


Languages
Pages
Legal


1Q 2019 Results
| |PT Indosat Tbk. – 1Q 2019 Results 2
• PT Indosat Tbk ( “Indosat Ooredoo” or “Company” ) cautions investors that certain statements contained in this document state its management's intentions, hopes, beliefs, expectations, or predictions of the future are forward-looking statements
• The Company wishes to caution the reader that forward-looking statements are not historical facts and are only estimates or predictions. Actual results may differ materially from those projected as a result of risks and uncertainties including, but not limited to:
• The Company’s ability to manage domestic and international growth and maintain a high level of customer service
• Future sales growth
• Market acceptance of the Company’s product and service offerings
• The Company’s ability to secure adequate financing or equity capital to fund our operations
• Network expansion
• Performance of the Company’s network and equipment
• The Company’s ability to enter into strategic alliances or transactions
• Cooperation of incumbent local exchange carriers in provisioning lines and interconnecting our equipment
• Regulatory approval processes
• Changes in technology
• Price competition
• Other market conditions and associated risks
• The company undertakes no obligation to update publicly any forward-looking statements, whether as a result of future events, new information, or otherwise

| |PT Indosat Tbk. – 1Q 2019 Results 4
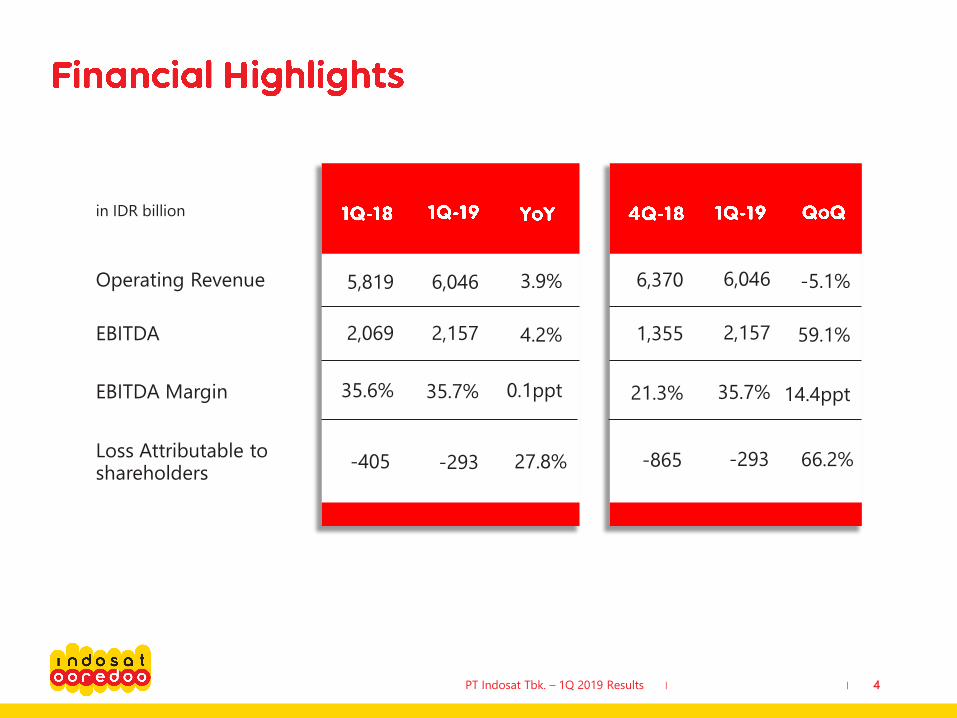
Operating Revenue
EBITDA
EBITDA Margin
Loss Attributable to shareholders
6,046 3.9%
2,157 4.2%
0.1ppt
-293 27.8%
6,370 -5.1%
1,355 59.1%
21.3% 14.4ppt
-865 66.2%
in IDR billion
35.7%
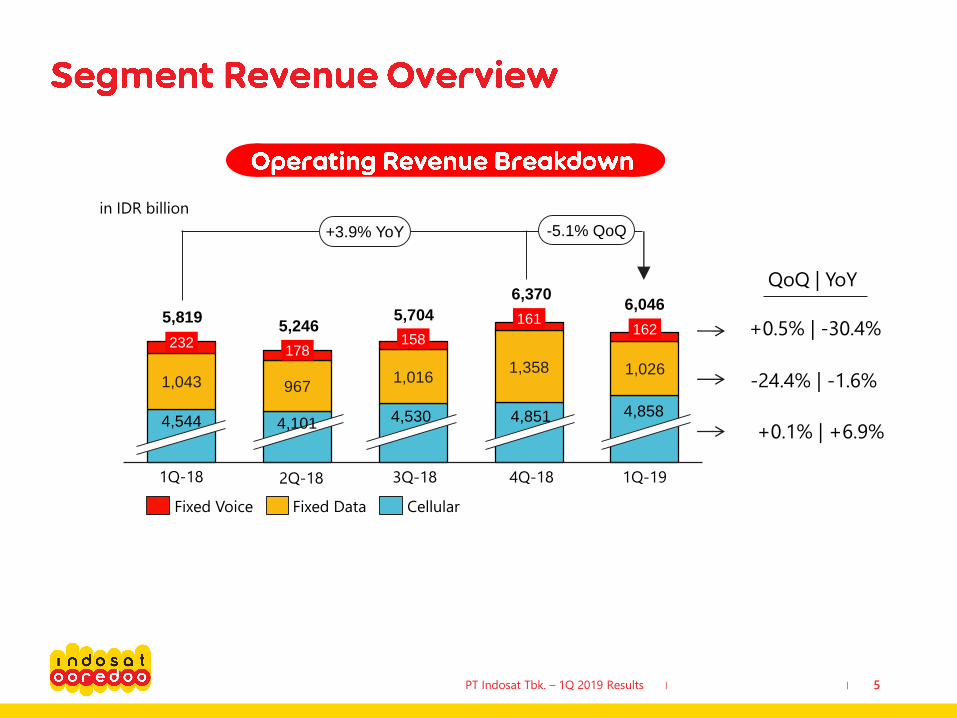
5,819
2,069
35.6%
-405
6,046
2,157
35.7%
-293
| |PT Indosat Tbk. – 1Q 2019 Results 5
1,043 9671,016
1,358 1,026
232178
158
161162
in IDR billion
-5.1% QoQ+3.9% YoY
CellularFixed DataFixed Voice
+0.5% | -30.4%
-24.4% | -1.6%
+0.1% | +6.9%
QoQ | YoY
1Q-18
4,101
5,819
2Q-18
5,246
4,544
3Q-18
5,704
4,530 4,851
4Q-18
6,370
4,858
6,046
1Q-19
| |PT Indosat Tbk. – 1Q 2019 Results 6
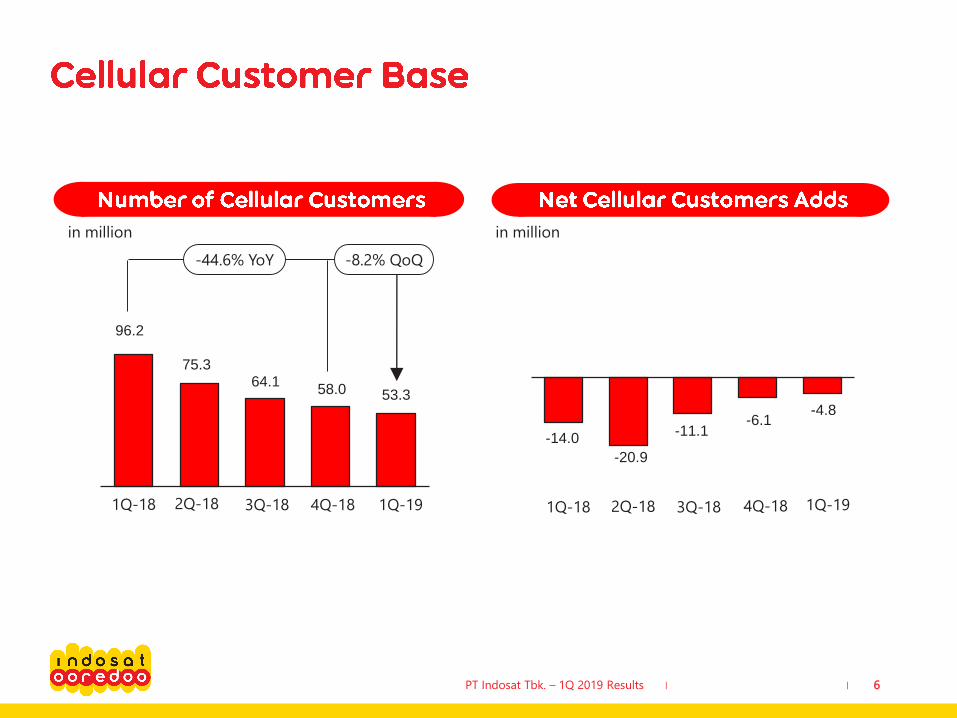
96.2
75.364.1
58.0 53.3
-44.6% YoY -8.2% QoQ
in million in million
-14.0
-20.9
-11.1-6.1
-4.8
1Q-18 1Q-182Q-18 2Q-183Q-18 3Q-184Q-18 4Q-181Q-19 1Q-19

| |
2935 40 40 37
PT Indosat Tbk. – 1Q 2019 Results 7
-34.9% YoY -14.7% QoQ
Voice Traffic
in billion minutes (Voice Traffic)
in minute/subscriber (MOU)
MOU
13.1 15.921.6 24.6 26.5
+7.7% QoQ+101.8% YoY
ARPU
in thousand IDR (ARPU)
1Q-18 1Q-182Q-18
9.4 8.5 7.9 7.2 6.1
2Q-183Q-18 3Q-184Q-18 4Q-181Q-19 1Q-19
| |PT Indosat Tbk. – 1Q 2019 Results 8
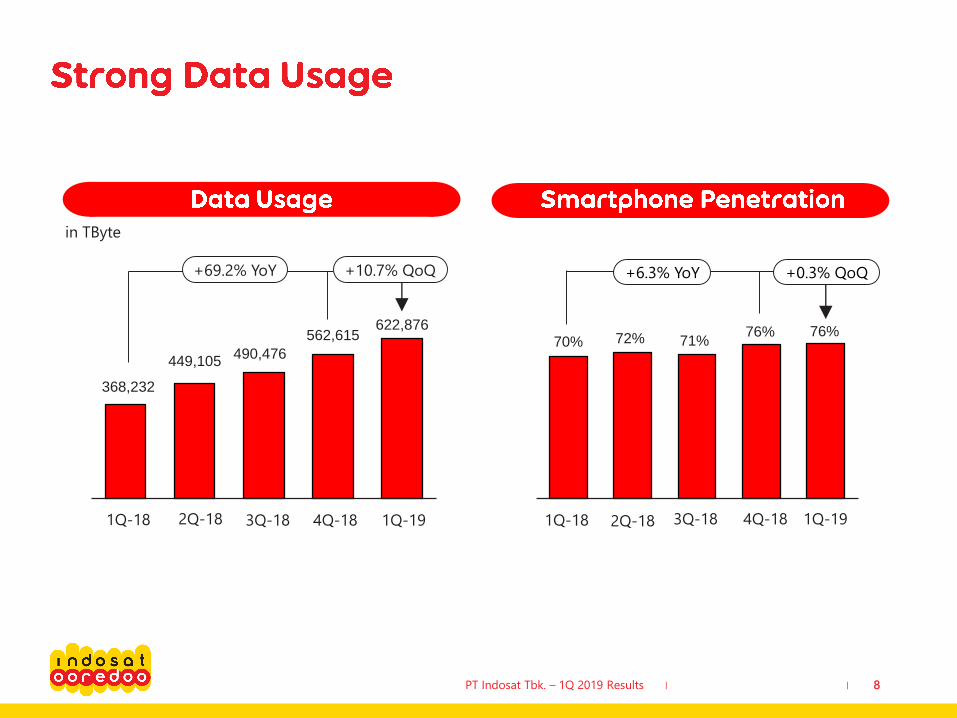
368,232
449,105490,476
562,615622,876
in TByte
+10.7% QoQ+69.2% YoY
1Q-18
70% 72% 71%76% 76%
+0.3% QoQ+6.3% YoY
1Q-182Q-18 2Q-183Q-18 3Q-18 4Q-184Q-18 1Q-19 1Q-19
| |PT Indosat Tbk. – 1Q 2019 Results 9
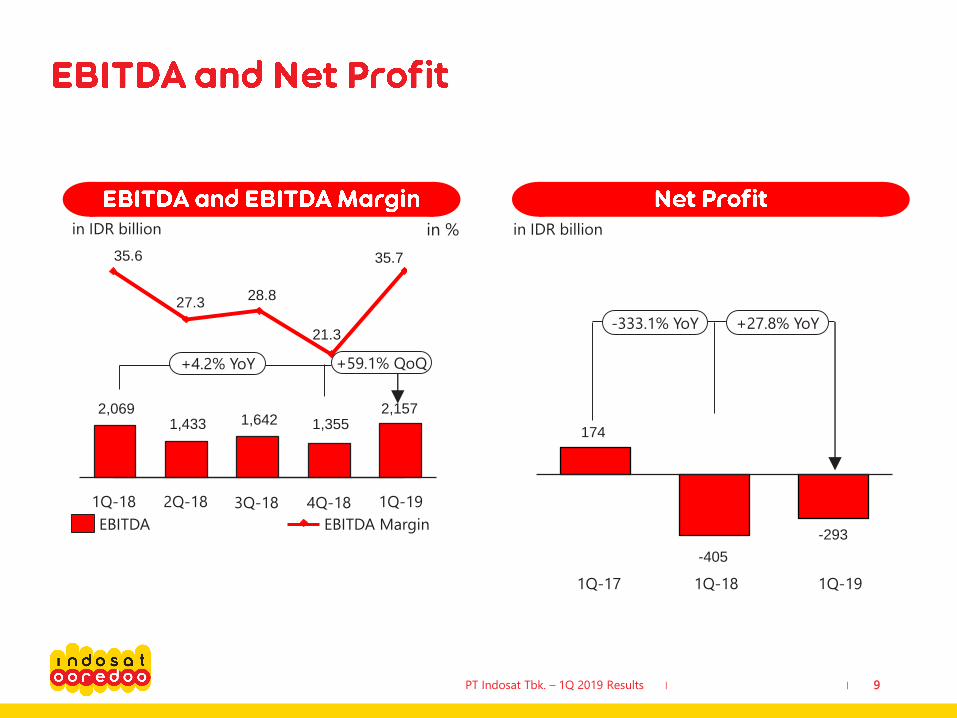
35.6
27.328.8
21.3
35.7
2,0691,433 1,642 1,355
2,157
+59.1% QoQ+4.2% YoY
EBITDA
in IDR billion
EBITDA Margin
174
-405
-293
+27.8% YoY-333.1% YoY
1Q-191Q-181Q-17
in IDR billion
1Q-18 2Q-18 3Q-18
in %
4Q-18 1Q-19

| |
17,40017,283
20,955
PT Indosat Tbk. – 1Q 2019 Results 10
1.341.47
1Q-191Q-17 1Q-18
Net Debt Net Debt/EBITDA
in IDR billion
+21.2% YoY
3.18 • Higher gearing to support network
expansion and improvement.
• Committed to maintain a ratio
below covenant value of 4x net
debt to EBITDA

| |
22.7 25.7
38.3
69.6
36.4
PT Indosat Tbk. – 1Q 2019 Results 11
in IDR billion
55041
-1,591
-290 -281
Capex (Spent)
in IDR billion
Capex/Revenue
in %
1Q-18
1Q-18 2Q-18
2Q-18
3Q-18
3Q-18 4Q-18
4Q-18 1Q-19
1Q-19
1,322 1,350
2,183
4,434
2,200
| |PT Indosat Tbk. – 1Q 2019 Results 12
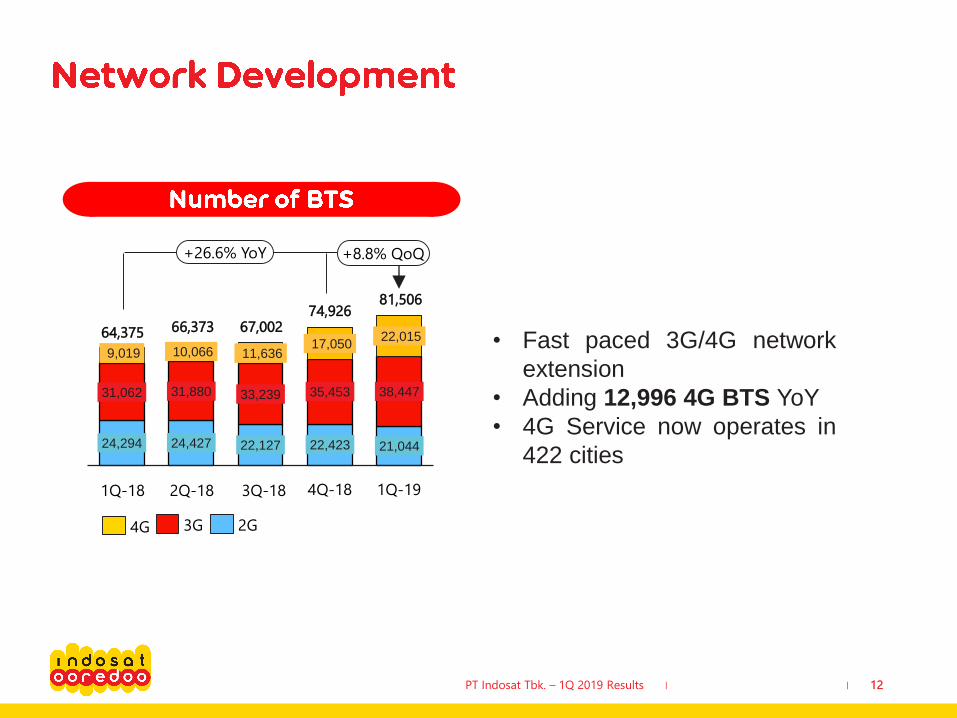
24,294 24,427 22,127 22,423 21,044
31,062 31,880 33,239 35,453 38,447
9,019 10,066 11,636 17,050
22,015
+8.8% QoQ+26.6% YoY
2G3G4G
1Q-18
64,375
2Q-18
66,373
3Q-18
67,002• Fast paced 3G/4G network
extension
• Adding 12,996 4G BTS YoY
• 4G Service now operates in
422 cities
4Q-18
74,926
1Q-19
81,506

| |PT Indosat Tbk. – 1Q 2019 Results 13

Top Related