


![[Product Monograph Template - Standard] - AstraZeneca · PDF filethe Product Monograph. a personal or family history of medullary thyroid carcinoma (MTC) or in patients with ... BYDUREON](https://static.fdocuments.net/doc/165x107/5aa1a3e67f8b9a436d8bdde1/product-monograph-template-standard-astrazeneca-product-monograph-a-personal.jpg)


Languages
Pages
Legal


1
MEDULLARY THYROID CARCINOMA (MTC): THE INFLUENCE OF POLICY 1
CHANGING IN CLINICAL CHARACTERISTICS AND DISEASE PROGRESSION 2
3
1Maria Alevizaki, MD, PhD,
1Katerina Saltiki, MD,
1Gianna Rentziou, MD,
1Alexandra 4
Papathoma, 1Leda Sarika,
1Vasiliki Vasileiou, MD,
1Eleni Anastasiou, MD. 5
6
1Endocrine Unit, Dept Medical Therapeutics, Alexandra Hospital, Athens University 7
School of Medicine, Athens, Greece 8
80, Vass Sofias ave 9
11528 Athens Greece 10
Tel: +302103381393 11
Fax +30-210-7704143 12
13
Corresponding author: 14
* Maria Alevizaki, MD, PhD 15
Endocrine Unit, Dept Medical Therapeutics, Alexandra Hospital, Athens University 17
School of Medicine, Athens, Greece 18
80, Vass Sofias ave 19
11528 Athens Greece 20
Tel: +302103381393 21
Fax +30-210-7704143 22
23
*to whom requests for reprints should be addressed 24
25
26
Short title: 27
Trends in progression of medullary thyroid carcinoma 28
29
Key words: 30
Medullary thyroid carcinoma, thyroid cancer, progression, microcarcinoma 31
Page 1 of 32 Accepted Preprint first posted on 18 September 2012 as Manuscript EJE-12-0388
Copyright © 2012 European Society of Endocrinology.

2
ABSTRACT 1
2
Objective: MTC has varying clinical course. We assessed trends in MTC presentation 3
during the last 34yrs. 4
Design: Retrospective study. 5
Methods: 151 patients (44.4% males) were followed for 0.9-34 years. Patients were 6
classified according to year of diagnosis: group 1: 1977-2000 (n=53), group 2: 2001-2011 7
(n=98). Extent of disease at diagnosis, during follow up, number of surgeries, pre- and 8
postoperative calcitonin levels were recorded. 9
Results: 48.34% reported family history of MTC. Group 1 had larger tumours: median 10
1.70 (Intraquartile-Range, IQR 1.7) vs 1.1 (1.2) cm, p=0.045, Mann-Whitney), they 11
presented less frequently micro-MTCs (27.8% vs 46.1%, p=0.045) and underwent more 12
multiple surgeries (63.3% vs 20.0%, p<0.001). Group 1 had more frequently progressive 13
disease (35.8% vs 12.2%, p=0.003) and distant metastasis at follow up (39.7% vs 17.4%, 14
p=0.017). Chronological group (HR 0.15, 95% CI 0.03-0.68, p=0.015) and distant 15
metastases at follow up (HR 0.07, 95% CI 0.015-0.30, p=0.001) were independently 16
associated with 10-year disease progression (p<0.001). In sporadic cases cervical lymph 17
node invasion and distant metastases at diagnosis were more frequent in group 1 (72.7% 18
vs 45.5%, p=0.032, and 27.3% vs 5% p=0.019 respectively); disease stage at diagnosis 19
was more advanced (p=0.004). They underwent more multiple surgeries (p<0.001), 20
presented more frequently distant metastasis at follow up (67.7% vs 20.0% p=0.002), had 21
less frequently remission and more frequently progressive disease (21.4% vs 58.0% and 22
64.3% vs 14.0% respectively, p<0.001). Postoperative calcitonin levels were higher 23
(p=0.024). 24
Conclusions: Recently an increase in micro-MTCs is observed, while indices of 25
invasiveness and persistence of disease are better. Increased awareness in familial cases, 26
routine calcitonin measurements and improved surgical procedures could be responsible. 27
28
29
Page 2 of 32
3
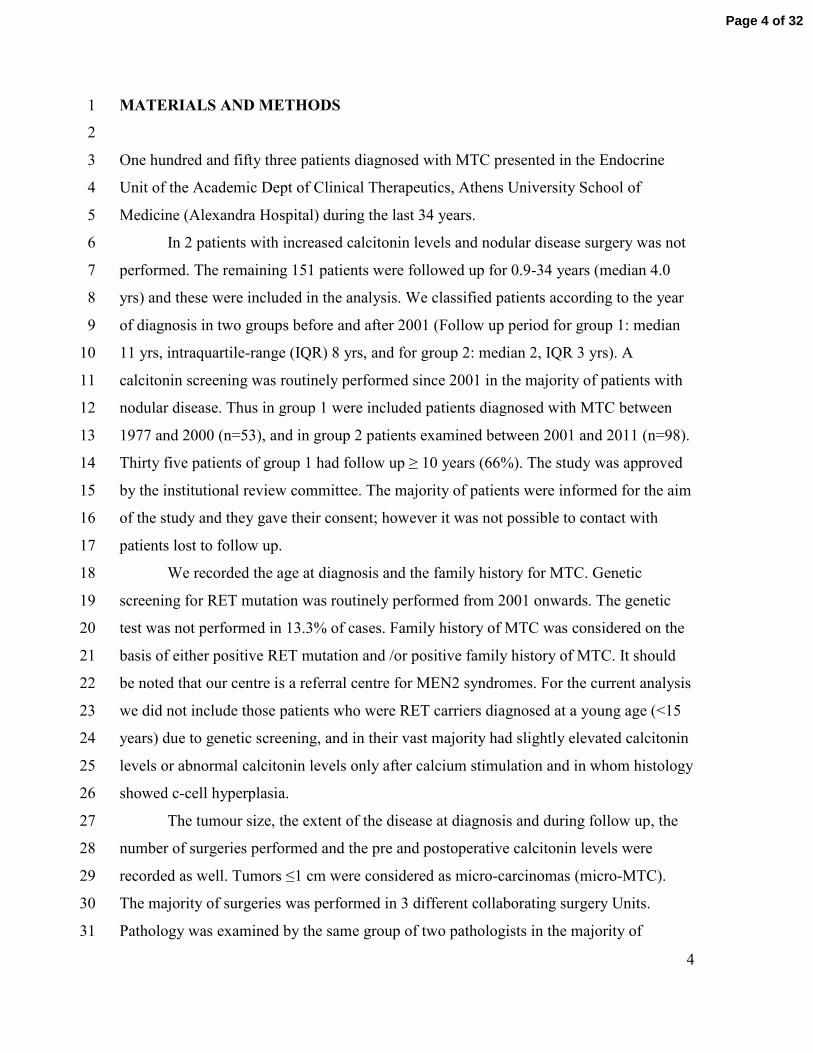
INTRODUCTION 1
2
3
Medullary thyroid carcinoma (MTC) is a rare thyroid neoplasm accounting for 2 -4
10% of all thyroid carcinomas 1-3
. The majority of MTC cases are sporadic while 5
hereditary cases are found in approximately 25% of patients diagnosed with MTC 2. 6
MTC is a more aggressive tumour compared to well-differentiated follicular cell derived 7
thyroid cancers. Cervical lymph node invasion is frequent and even distant metastases 8
may be present at the time of diagnosis. However persistent disease can occur for many 9
years having a varying clinical course 3. 10
Previous studies have proposed various prognostic factors concerning the 11
outcome as well as the survival in MTC patients. The stage of the disease and the tumour 12
extent at presentation are significant predictors of life expectancy, thus early diagnosis is 13
important for the outcome of the disease 4. Furthermore, the postoperative calcitonin 14
levels as well as the calcitonin and CEA doubling time have been proposed as predictive 15
factors for the outcome and the progression rate of the disease 5-10
. 16
In earlier studies, in MTC patients the overall survival was found to vary at 5 17
years follow-up from 78 to 91% and at 10 years follow-up from 61 to 88% 5-6
. 18
Over the last decades there is an increased awareness for MTC and several studies 19
have evaluated possible changes in prognostic factors, the survival rates and the outcome 20
in patients diagnosed with MTC 4-6, 8, 11-14
. There are several reasons for this change. The 21
routine measurement of serum calcitonin levels - which is a highly sensitive test for the 22
early MTC diagnosis 15
- in thyroid nodular disease, the use of ultrasound as well as the 23
genetic screening in the cases of familial MTC have allowed the diagnosis and the 24
treatment of MTC at an earlier stage 16-17
. 25
The purpose of this study was to examine possible trends in the clinical 26
presentation of MTC cases followed up in our center during the last 34 yrs. We 27
specifically examined the clinical and histological characteristics, the clinical course of 28
the disease as well as possible changes that occurred during the last decade in the 29
presentation and in the outcome of MTC. 30
31
Page 3 of 32
4
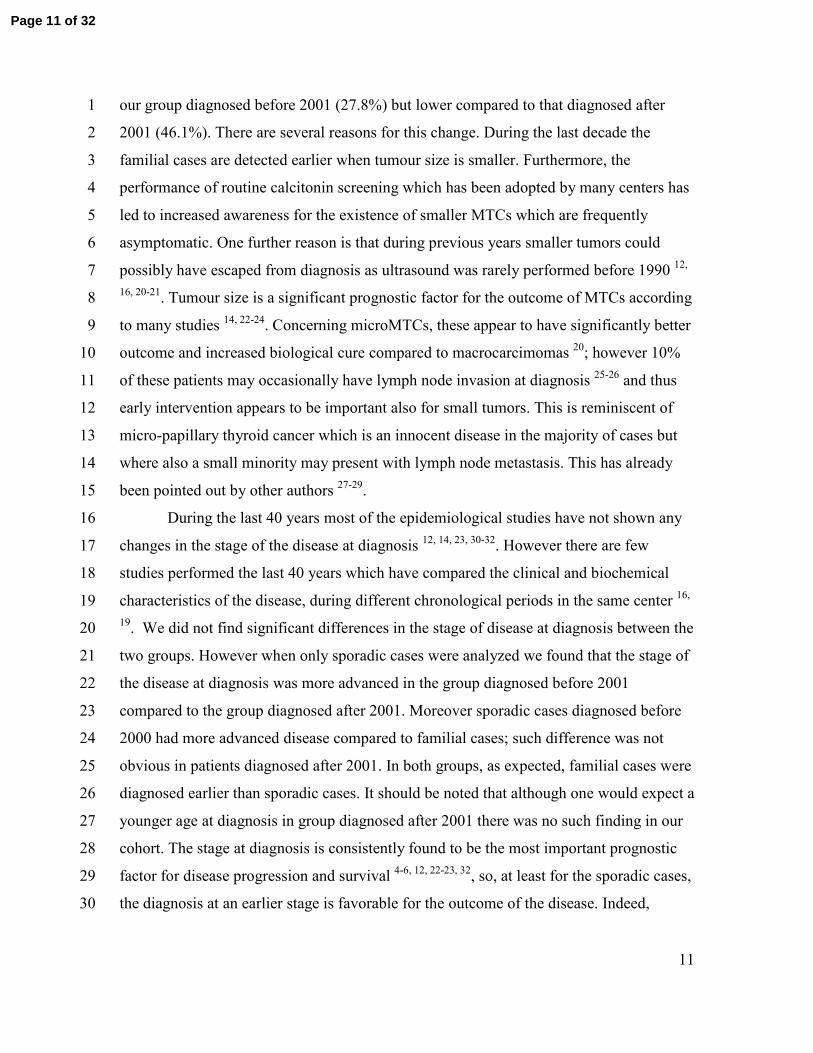
MATERIALS AND METHODS 1
2
One hundred and fifty three patients diagnosed with MTC presented in the Endocrine 3
Unit of the Academic Dept of Clinical Therapeutics, Athens University School of 4
Medicine (Alexandra Hospital) during the last 34 years. 5
In 2 patients with increased calcitonin levels and nodular disease surgery was not 6
performed. The remaining 151 patients were followed up for 0.9-34 years (median 4.0 7
yrs) and these were included in the analysis. We classified patients according to the year 8
of diagnosis in two groups before and after 2001 (Follow up period for group 1: median 9
11 yrs, intraquartile-range (IQR) 8 yrs, and for group 2: median 2, IQR 3 yrs). A 10
calcitonin screening was routinely performed since 2001 in the majority of patients with 11
nodular disease. Thus in group 1 were included patients diagnosed with MTC between 12
1977 and 2000 (n=53), and in group 2 patients examined between 2001 and 2011 (n=98). 13
Thirty five patients of group 1 had follow up ≥ 10 years (66%). The study was approved 14
by the institutional review committee. The majority of patients were informed for the aim 15
of the study and they gave their consent; however it was not possible to contact with 16
patients lost to follow up. 17
We recorded the age at diagnosis and the family history for MTC. Genetic 18
screening for RET mutation was routinely performed from 2001 onwards. The genetic 19
test was not performed in 13.3% of cases. Family history of MTC was considered on the 20
basis of either positive RET mutation and /or positive family history of MTC. It should 21
be noted that our centre is a referral centre for MEN2 syndromes. For the current analysis 22
we did not include those patients who were RET carriers diagnosed at a young age (<15 23
years) due to genetic screening, and in their vast majority had slightly elevated calcitonin 24
levels or abnormal calcitonin levels only after calcium stimulation and in whom histology 25
showed c-cell hyperplasia. 26
The tumour size, the extent of the disease at diagnosis and during follow up, the 27
number of surgeries performed and the pre and postoperative calcitonin levels were 28
recorded as well. Tumors ≤1 cm were considered as micro-carcinomas (micro-MTC). 29
The majority of surgeries was performed in 3 different collaborating surgery Units. 30
Pathology was examined by the same group of two pathologists in the majority of 31
Page 4 of 32

5
cases.The tumour staging at diagnosis was performed according to the American Joint 1
Committee on Cancer (AJCC) TNM classification 18
. 2
The presence of distant metastases was recorded according to clinical and imaging 3
examination. Basal serum calcitonin levels and postoperative calcitonin levels at 3 and 6 4
months, as well as at 1, 2, 3, 5, 6 and 10 years after the first surgery were evaluated to 5
classify patients as having remission, stable disease or progressive disease. Patients with 6
normal postoperative calcitonin levels (<1.5 pg/ml) were considered as having remission; 7
those with measurable postoperative calcitonin levels with no new imaging lesions were 8
considered as having stable disease and the those with new lesions were considered as 9
having progressive disease. 10
From 2006 to 2012 calcitonin was measured using a chemiluminescence DPC 11
immunoassay (Immulite 2000, Siemens) and from 2000 to 2005 a chemiluminescence 12
immunoassay (Nichol Institue Diagnostics). Before 2000 cis bio International ELISA-13
hCT Kit (IRMA, Cis-Diagnostis) was used. 14
15
Statistical analysis 16
Statistical analysis was done using the SPSS statistical package (version 18). All 17
descriptive data are expressed as mean ± SD for normally distributed variables, otherwise 18
median value and intraquartile range is shown. The chi-square statistic and the chi-19
square test for linear association (Mantel Haenzel x2) were used for contingency tables. 20
The linear regression model was used for correlations between continuous variables 21
(Pearson correlation); for variables not normally distributed Spearman’s correlation was 22
used. For the comparison of the means the t-test or the Mann-Whitney rank-test was used 23
depending on normality of distribution. ANOVA was used as appropriate. The Kaplan-24
Meier product limit method was used to estimate the probability of progression of disease 25
10 years (120 months) after initial diagnosis. To evaluate which factors contribute to the 26
progression of the disease, a univariate Cox proportional hazards model was used; those 27
factors found to contribute to the outcome in univariate analysis at P<0.05 (because of the 28
risk of type II error attributable to low statistical power in such an analysis) were included 29
in the multivariate model as potential risk factors. In the final multivariate analysis, the 30
level of statistical significance was set at 5% (P<0.05). 31
Page 5 of 32

6
1
RESULTS 2
3
Of the 151 patients with MTC who were finally analyzed 67 (44.4%) were males. 4
The mean age was 44.18±17.0 yrs (range 5-78); 48.34% (n=73) of patients had a family 5
history of MTC. No significant difference in age at diagnosis (group 1: 43.09±17.34 6
group 2: 44.51±17.08, p=0.63) and sex distribution (males in group 1: 50.9% vs group 2: 7
40%, p=0.12) was observed between the two groups. The frequency of familial disease 8
did not differ either (group1: 47.2% vs group 2: 48.9%, p=0.52). The demographic and 9
clinical characteristics of patients of both groups according to the type of the disease 10
(sporadic vs familial) are shown in table 1. 11
In group 1 (diagnosed before 2001) preoperative calcitonin measurement was 12
available in 29 patients (54.7%; 13 underwent routine CT screening, 12 were RET 13
carriers and in 4 a confirmation of positive FNA was performed). In group 2 (diagnosed 14
after 2001) preoperative calcitonin measurement was available in 89 patients (90.8%; 64 15
underwent routine CT screening, 22 were RET carriers and in 3 a positive FNA was 16
confirmed). 17
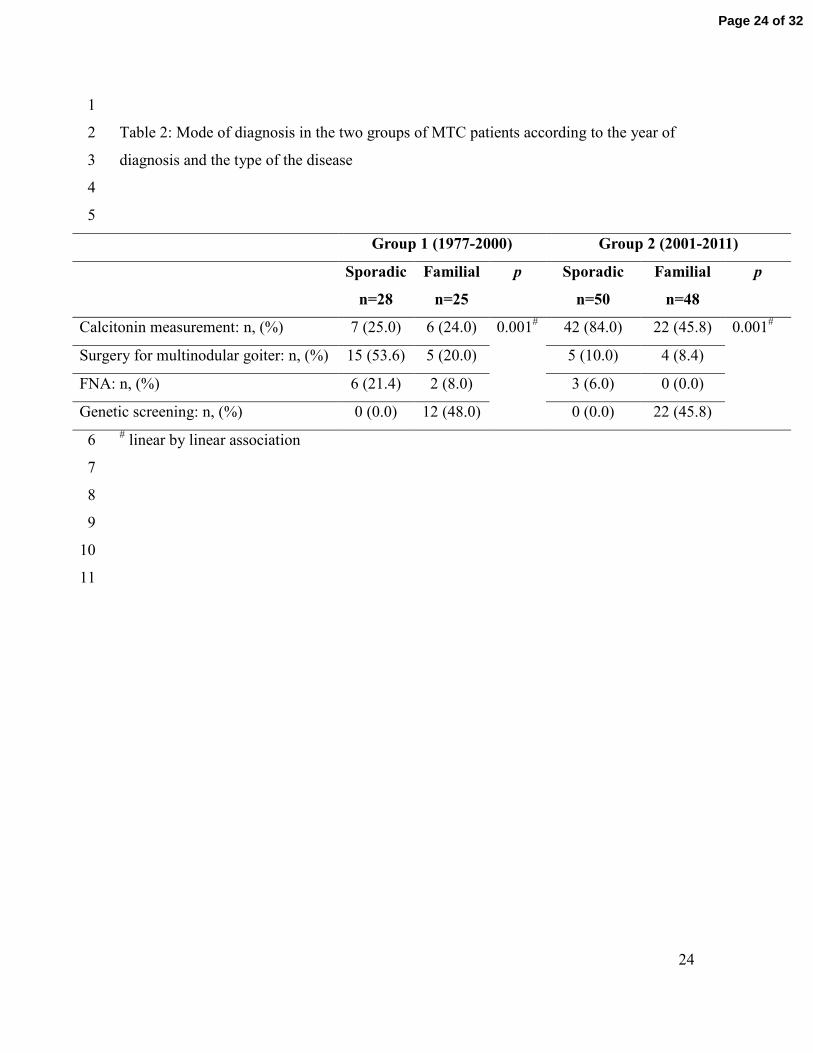
The differences in the mode of diagnosis between the 2 groups were significant 18
(x2, p=0.01 linear by linear association). In group 1, 24.5% underwent surgery for high 19
calcitonin levels, 37.8% for nodular goiter (in some of them with suspicious lymph node 20
in the ultrasound), in 15.1% for positive FNA cytology, while in 22.6% of patients MTC 21
diagnosis was done after genetic screening. In group 2, surgery was performed for 22
elevated calcitonin levels in 65.3%; 9.2% underwent surgery for nodular goiter with 23
suspicious ultrasound findings in one of the nodules while diagnosis after genetic 24
screening was performed in 22.4%. FNA was not routinely performed when calcitonin 25
was elevated (surgery due to positive FNA in 3.1%). Among patients who underwent 26
FNA, positivity for thyroid cancer was found in 41% and suspicious for malignancy in 27
another 11%. The mode of diagnosis in the two groups according to the type of MTC is 28
presented in table 2. 29
At diagnosis, group 1 (diagnosed before 2001) had larger tumour size (median 30
1.70 cm, IQR 1.7) compared to group 2 (median 1.1 cm, IQR 1.2 cm, p=0.045, Mann-31
Page 6 of 32

7
Whitney) and less frequently micro MTCs (≤1cm) (27.8% vs 46.1%, p=0.045, fig 1). No 1
significant differences in the frequency of cervical lymph node invasion (60.9% vs 2
45.8%, p=0.067) and in the TNM stage at diagnosis was found between the two groups 3
(p=0.087), although there was a tendency for locally more extensive disease in group 1 4
(Fig 1). Preoperative calcitonin levels were significantly correlated with tumour size 5
(r=0.655, p<0.001, Spearman’s correlation). No significant differences in preoperative 6
and postoperative calcitonin levels were found either. 7
No difference in the type of first surgery was found between groups (group1: total 8
thyroidectomy: 50.9%, subtotal thyroidectomy: 5.7%, central lymph node dissection: 9
43.4% vs group 2: 55.1%, 2.0% and 42.9% respectively, x2, p=0.3). Patients belonging to 10
group 1 underwent more multiple surgeries (≥2) (63.3% vs 20.0%, p<0.001, fig 1). In 11
cases where multiple surgeries were performed, calcitonin levels after the second surgery 12
tended to be higher in patients belonging to group 1 compared to those of group 2 13
(median 359.5 (IQR 1157) vs 65.5 (IQR 191.4), p=0.07, Mann-Whitney). Patients who 14
underwent ≥2 surgeries showed biochemical cure in 17%. Loco-regional therapy 15
(radiation or chemo-embolism) was given in 6 patients belonging to group 1 (11.5%) vs 16
in 4 patients belonging to group 2 (4%, x2, p=0.076). Only 6 patients received tyrosine 17
kinase inhibitors as adjuvant therapy (2 belonging to group 1 and 4 to group 2). Table 3 18
presents the treatment procedures in the two groups according to the type of the disease. 19
20
In the whole cohort, the outcome of the disease was significantly better in those 21
patients who underwent routine preoperative calcitonin measurement, compared to those 22
without (remission 60.7 vs 34.4%, stable disease 21.4 vs 31.3% and progression of 23
disease 17.9 vs 34.4%, p=0.008, linear by linear association). 24
In those patients where MTC diagnosis was established after routine calcitonin 25
screening, in group 1 remission was found in 55.2% and progressive disease in 34.5% 26
while in group 2 remission in 62.7% and progression in 12% respectively (x2, p=0.014). 27
No differences in the outcome of the disease in patients with no preoperative calcitonin 28
measurement were observed between groups. 29
30
Page 7 of 32

8
Group 1 had less frequently remission of disease (41.4% vs 61.2%) and more 1
frequently progressive disease (35.8% vs 12.2%) at follow up compared to group 2 2
(p=0.003, fig 2). The outcome in the two groups according to the type of the disease is 3
shown in table 4. In group 1 a higher percentage of patients presented distant metastases 4
at follow up compared to group 2 (39.7% vs 17.4%, p=0.017). Lymph node invasion at 5
diagnosis was more frequent in patients who showed progression of disease at follow up 6
(20.0% in patients in remission vs 78.1% in patients with persistent disease vs 93.1% in 7
patients with progressive disease, p<0.001, linear by linear association). In those patients 8
who had follow up for at least 5 years and who had postoperative CT<1.5 pg/ml (n=38) 3 9
patients showed recurrence with measurable CT during follow up (7.9%). All these 10
patients belonged to group 2. 11
The 10 year probability of stability of disease was for TNM stage I and II 95.6%, 12
for stage III 84.8% and for stage IV 23.8% (Kaplan-Meier analysis p for Log Rank 13
<0.001). In Cox proportional hazard analysis, the highly significant parameters were 14
entered into the model. These parameters were the tumour size (micro/macro-MTC), the 15
presence of distant metastasis at follow-up, the stage of the disease at diagnosis, as well 16
as the group according to the year of diagnosis. The analysis showed that the group 17
according to year of diagnosis (for patients belonging to group 2: HR 0.15, 95% CI 0.03-18
0.68, p=0.015) as well as the presence of distant metastasis at follow up (for absence of 19
distant metastasis: HR 0.07, 95% CI 0.015-0.30, p=0.001) were independently associated 20
with 10 year progression of the disease (p<0.001). 21
22
Sporadic cases (n=78) 23
When apparently sporadic cases were taken into account the median age did not 24
differ between the two groups. When apparently sporadic cases which were subsequently 25
found to be familial were excluded median age did not differ between groups either 26
(median 52 (range 15-71, IQR 28 for group 1 and median 50.5 (range 5-78, IQR 21) for 27
group 2. Sporadic cases were significantly older compared to familial cases in both 28
groups (table 1). 29
There was a tendency for increased tumour size in group 1 compared to group 2 30
(median 2.05 (0.3-7, IQR 1.8) vs 1.2 (0.3-7, IQR 1.3, p=0.064, Mann Whitney) and for 31
Page 8 of 32

9
decreased frequency of micro MTCs (18.8% vs 44.2%, p=0.065, fig 3). Cervical lymph 1
node invasion and distant metastasis at diagnosis were more frequent in group 1 2
compared to group 2 (72.7% vs 45.5%, p=0.032 and 27.3% vs 5% p=0.019 respectively, 3
fig 3). In group 1 the prevalence of patients with stage I and II disease at diagnosis was 4
significantly lower and with stage IVB and IVC was significantly higher compared to 5
group 2 (group 1: stage I-II 25%, III 32.1%, IV 42.9%, vs group 2: stage I-II 56%, III 6
32%, IV 12%, p=0.006, linear by linear association). Sporadic cases belonging in group 7
1 had more advanced disease at diagnosis compared to familial ones (table 1). 8
Sporadic cases in group 1 compared to those in group 2 underwent ≥2 surgeries 9
(78.5% vs 28.0%, p<0.001), and presented more frequently distant metastases at 10
diagnosis (27.3% vs 5%, p=0.002, fig 3) as well as distant metastases at follow up 11
(67.7% vs 20.0% p=0.002). Moreover they had less frequently remission of disease and 12
more frequently progressive disease (21.4% vs 58.0% and 64.3% vs 14.0% respectively, 13
p<0.001, fig 4). Group 1 had significantly higher postoperative calcitonin levels after the 14
first (median 572.2 (IQR 2025) vs 200.2 (IQR 156.1) pg/ml, p=0.024 Mann Whitney) as 15
well as after the second surgery (median 1031 (IQR 912) vs 73,9 (IQR 329) pg/ml, 16
p=0.001 Mann-Whitney) compared to group 2. 17
A decreased probability of 10-year progression of disease according to the TNM 18
stage of disease was found in the Kaplan Meier analysis (lack of progression: for stage I-19
II 93.1%, stage III 77.8%, stage IV 8.3% p=0.001 for Log Rank, Fig 5). 20
In Cox proportional hazard analysis when the tumour size (micro/macro-MTC), 21
the presence of distant metastasis at follow-up, the stage of the disease at diagnosis, as 22
well as the group according to the year of diagnosis were taken into account the group 23
according to year of diagnosis (for patients belonging to group 2: HR 0.097, 95% CI 24
0.011-0.82, p=0.033) as well as the presence of distant metastasis at follow up (for 25
absence of distant metastasis: HR 0.064, 95% CI 0.008-0.496, p=0.009) were 26
independently associated with 10 year progression of the disease (p<0.001). 27
28
Familial cases (n= 73) 29
Mean age in familial cases was for group 1: 30.45 ±14.1, median 31.5, IQR 18 yrs 30
and for group 2: 34.49±16.6, median 35, IQR 26 yrs (ns). No significant differences in 31
Page 9 of 32

10
tumour size, micro MTC frequency, cervical lymph node invasion and distant metastasis 1
at diagnosis and at follow up, in the stage of the disease at diagnosis according to the 2
TNM classification as well as in the outcome of the disease during follow up were found 3
between groups (data not shown). No significant differences in preoperative and 4
postoperative calcitonin levels were found either. Familial cases belonging to group 1 5
underwent more multiple surgeries compared to those belonging in group 2 (≥2) (48% vs 6
16.7%, p<0.009). Central lymph node dissection was more frequent in familial MTC 7
cases belonging to group 2 (group 1: 8.0% vs group 2: 39.5%, p=0.016 linear by linear 8
association). 9
A decreased probability of 10-year progression of disease according to the TNM 10
stage of disease was found in the Kaplan Meier analysis (for stage I-II: 97%, for stage III: 11
95% and for stage IV: 50%, p<0.001 for Log Rank, fig 6). 12
13
14
DISCUSSION 15
16
Recent developments facilitating earlier diagnosis and better management of 17
MTCs result in possible changes in clinical findings and prognosis. Like most referral 18
centers, we have also changed our policies during the last years. In this retrospective 19
study we report data concerning MTC patients referred in our centre for evaluation and 20
treatment during the last 34 years. We examined differences in prognostic factors 21
between two chronological periods according to the year of diagnosis using as cutoff the 22
year 2001 when routine calcitonin measurements and routine genetic screening started in 23
our center. 24
First, we showed that patients who underwent surgery for MTC before 2001 had 25
larger tumours and they presented less frequently microcarcinomas at diagnosis 26
compared to patients diagnosed after 2001. When familial cases were excluded there was 27
still a tendency towards the same direction. Similar findings have been reported from 28
other centers, indicating the common developments in investigation tools and 29
management in such patients 19
. Modigliani et al, in a study performed before 1996, 30
reported a microMTC’s incidence of approximately 32% 5 which is higher compared to 31
Page 10 of 32
11
our group diagnosed before 2001 (27.8%) but lower compared to that diagnosed after 1
2001 (46.1%). There are several reasons for this change. During the last decade the 2
familial cases are detected earlier when tumour size is smaller. Furthermore, the 3
performance of routine calcitonin screening which has been adopted by many centers has 4
led to increased awareness for the existence of smaller MTCs which are frequently 5
asymptomatic. One further reason is that during previous years smaller tumors could 6
possibly have escaped from diagnosis as ultrasound was rarely performed before 1990 12,
7
16, 20-21. Tumour size is a significant prognostic factor for the outcome of MTCs according 8
to many studies 14, 22-24
. Concerning microMTCs, these appear to have significantly better 9
outcome and increased biological cure compared to macrocarcimomas 20
; however 10% 10
of these patients may occasionally have lymph node invasion at diagnosis 25-26
and thus 11
early intervention appears to be important also for small tumors. This is reminiscent of 12
micro-papillary thyroid cancer which is an innocent disease in the majority of cases but 13
where also a small minority may present with lymph node metastasis. This has already 14
been pointed out by other authors 27-29
. 15
During the last 40 years most of the epidemiological studies have not shown any 16
changes in the stage of the disease at diagnosis 12, 14, 23, 30-32
. However there are few 17
studies performed the last 40 years which have compared the clinical and biochemical 18
characteristics of the disease, during different chronological periods in the same center 16,
19
19. We did not find significant differences in the stage of disease at diagnosis between the 20
two groups. However when only sporadic cases were analyzed we found that the stage of 21
the disease at diagnosis was more advanced in the group diagnosed before 2001 22
compared to the group diagnosed after 2001. Moreover sporadic cases diagnosed before 23
2000 had more advanced disease compared to familial cases; such difference was not 24
obvious in patients diagnosed after 2001. In both groups, as expected, familial cases were 25
diagnosed earlier than sporadic cases. It should be noted that although one would expect a 26
younger age at diagnosis in group diagnosed after 2001 there was no such finding in our 27
cohort. The stage at diagnosis is consistently found to be the most important prognostic 28
factor for disease progression and survival 4-6, 12, 22-23, 32
, so, at least for the sporadic cases, 29
the diagnosis at an earlier stage is favorable for the outcome of the disease. Indeed, 30
Page 11 of 32

12
Bergholm et al, in a study performed in Sweden, have reported that patients in stage I and 1
II have a relative survival similar to the general population 33
. 2
In sporadic cases cervical lymph node invasion and distant metastases at diagnosis 3
were more frequent in the group diagnosed before 2001. Grozinsky-Glasberg et al 4
showed lower remission rate in cases with lymph node invasion at diagnosis, which 5
however had no impact on long-term survival 8. Roman et al found that patients with 6
more extensive disease at diagnosis had 2.69 times and those with distant metastases 4.47 7
times greater risk for death 12
. It should be noted that the extent of lymph node invasion is 8
significantly related to the normalization of postoperative calcitonin levels, which is also 9
an important prognostic factor for the outcome of the disease 34
. The presence of cervical 10
lymph node invasion at diagnosis in our cohort was also associated with persistent and 11
progressive disease as previously described 8, 35
. 12
An important finding in our study was that patients who underwent routine 13
calcitonin screening (the majority of whom were diagnosed after 2001) had better 14
outcome of the disease compared to those who did not perform preoperative calcitonin 15
measurement. This finding underlines the importance of routine calcitonin screening in 16
detecting medullary carcinoma among patients presenting with nodular goiter which has 17
been extensively discussed in the literature 2, 16, 36
. Furthermore, we have recently shown 18
that routine calcitonin measurement may even lead to identification of unsuspected 19
familial cases 37
. Our results further support the fact that the routine calcitonin 20
measurement helps in detecting MTCs earlier and this may lead to a better surgical 21
treatment and final outcome as has already been discussed 16
. Preoperative calcitonin 22
levels also correlated with tumour size as previously reported 38
. 23
Interestingly the chronological period of diagnosis was an independent parameter 24
for progression of disease. Patients diagnosed after 2001 had more frequently remission 25
of disease and less frequently progression of disease and distant metastases at follow up 26
compared to those diagnosed before 2001. These differences were more obvious when 27
only sporadic cases where analyzed. This illustrates the importance of applying scientific 28
knowledge in patient care, which may have significant effects on the outcome of 29
malignant disease. Similar results have been reported in other studies 4, 10, 19
. In an older 30
study, Modigliani et al 5 reported biochemical cure in 37.6% in sporadic cases which is 31
Page 12 of 32

13
lower compared to the remission rate in our groups before 2001 (41.5%) and after 2001 1
(61.2%). Other studies performed during the last decade have reported 34-72% disease 2
remission rates 14, 23
as well as a better ten year overall and disease specific survivals 3
compared to studies published before 2000 4-6, 8, 12, 22, 24, 33, 39-42
. Finally, in our study the 4
appearance of distant metastases during follow up was more frequent in the group 5
diagnosed before 2001 compared to the group diagnosed after 2001. This is also a well-6
recognized prognostic factor affecting survival 8. 7
One further factor possibly explaining the differences between groups is the 8
improvement in surgical procedures during the last years 11-12, 43
. The surgical history of 9
our patients points to the same direction. We found that patients diagnosed after 2001 10
underwent fewer surgeries and had better outcome after the first surgery. The initial 11
treatment with thyroidectomy as well as lymph node dissection is the most critical step in 12
the management of MTC 44
. Preoperative calcitonin levels may also help surgeons to 13
individualize the extent of surgery and to perform a more radical treatment 11, 16
. The 14
efficiency of surgical procedures during recent years was obvious in our cohort of 15
sporadic cases as postoperative calcitonin levels after the first as well as a second surgery 16
were also lower in the group diagnosed after 2001 compared to the group diagnosed 17
before. This is in agreement with previous reports 12, 16, 45
. Finally, only 17% of patients 18
who underwent reoperation showed biochemical cure. Indeed, reoperation in MTC may 19
lead to remission and biochemical cure only in a small proportion of patients 14
. 20
21
Our study has several limitations. First we had inadequate information at follow 22
up in some of patients diagnosed before 2001 and thus survival evaluation was not 23
possible. We thus focused on progression of the disease and not on survival. It should be 24
noted that the 10 year progression rate according to the stage at diagnosis did not differ 25
from the 10 year survival rate in other series 4-6, 11-14
. 26
Moreover the number of patients was relatively small. Furthermore, the frequency 27
of familial disease did not differ between the two groups. As our unit is a referral center 28
for the genetic type of the disease, the percentage of inherited MTC is relatively high. It 29
should be noted that similar numbers have also been reported in other series 43, 46
. 30
Increased awareness in the families as well as identification of carriers through genetic 31
Page 13 of 32
14
screening has allowed the diagnosis of MTC in earlier stages in inherited disease. Thus 1
our findings are more striking in sporadic cases of MTC. 2
3
4
CONCLUSIONS 5
6
During recent years an increase in micro MTCs is observed, while indices of 7
invasiveness and persistence of disease are better. This is probably due to changing 8
policies in the evaluation of this disease including wider application of genetic screening 9
and increased awareness especially in familial cases, to the routine calcitonin 10
determinations revealing a higher prevalence of the disease and allowing earlier diagnosis 11
and, possibly, to improved surgical procedures. It is thus of great importance to perform 12
calcitonin screening in all nodular goiters, independently from the cytological diagnosis 13
that has led to decision for surgery. 14
15
16
17
Author contributions 18
M. Alevizaki conceived the study and participated in its design and coordination. K. 19
Saltiki drafted the manuscript and performed the statistical analysis. G. Rentziou, V. 20
Vasileiou and E. Anastasiou participated in the design of the study and collected the data. 21
A. Papathoma and L. Sarika carried out the immunoassays. All authors read and approved 22
the final manuscript. 23
24
Acknowledgements 25
We thank Dr KonstantinosVemmos, and Dr Kimon Stamatelopoulos for assisting in data 26
analysis in this manuscript. 27
28
Disclosure 29
Page 14 of 32

15
The authors declare that there is no conflict of interest that could be perceived as 1
prejudicing the impartiality of the research reported. They fully declare that there is no 2
any financial or other potential conflict of interest. 3
This research did not receive any specific grant from any funding agency in the 4
public, commercial or not-for-profit sector. 5
6
7
Page 15 of 32

16
REFERENCES 1
2
3
1. Pacini F, Castagna MG, Cipri C & Schlumberger M. Medullary thyroid 4
carcinoma. Clin Oncol (R Coll Radiol) 2010 22 475-485. 5
2. Cohen R, Campos JM, Salaun C, Heshmati HM, Kraimps JL, Proye C, Sarfati E, 6
Henry JF, Niccoli-Sire P & Modigliani E. Preoperative calcitonin levels are 7
predictive of tumor size and postoperative calcitonin normalization in medullary 8
thyroid carcinoma. Groupe d'Etudes des Tumeurs a Calcitonine (GETC). J Clin 9
Endocrinol Metab 2000 85 919-922. 10
3. Leboulleux S, Baudin E, Travagli JP & Schlumberger M. Medullary thyroid 11
carcinoma. Clin Endocrinol (Oxf) 2004 61 299-310. 12
4. de Groot JW, Plukker JT, Wolffenbuttel BH, Wiggers T, Sluiter WJ & Links TP. 13
Determinants of life expectancy in medullary thyroid cancer: age does not matter. 14
Clin Endocrinol (Oxf) 2006 65 729-736. 15
5. Modigliani E, Cohen R, Campos JM, Conte-Devolx B, Maes B, Boneu A, 16
Schlumberger M, Bigorgne JC, Dumontier P, Leclerc L, Corcuff B & Guilhem I. 17
Prognostic factors for survival and for biochemical cure in medullary thyroid 18
carcinoma: results in 899 patients. The GETC Study Group. Groupe d'etude des 19
tumeurs a calcitonine. Clin Endocrinol (Oxf) 1998 48 265-273. 20
6. Kebebew E, Ituarte PH, Siperstein AE, Duh QY & Clark OH. Medullary thyroid 21
carcinoma: clinical characteristics, treatment, prognostic factors, and a 22
comparison of staging systems. Cancer 2000 88 1139-1148. 23
7. Barbet J, Campion L, Kraeber-Bodere F & Chatal JF. Prognostic impact of serum 24
calcitonin and carcinoembryonic antigen doubling-times in patients with 25
medullary thyroid carcinoma. J Clin Endocrinol Metab 2005 90 6077-6084. 26
8. Grozinsky-Glasberg S, Benbassat CA, Tsvetov G, Feinmesser R, Peretz H, 27
Shimon I & Lapidot M. Medullary thyroid cancer: a retrospective analysis of a 28
cohort treated at a single tertiary care center between 1970 and 2005. Thyroid 29
2007 17 549-556. 30
Page 16 of 32

17
9. Giraudet AL, Vanel D, Leboulleux S, Auperin A, Dromain C, Chami L, Ny Tovo 1
N, Lumbroso J, Lassau N, Bonniaud G, Hartl D, Travagli JP, Baudin E & 2
Schlumberger M. Imaging medullary thyroid carcinoma with persistent elevated 3
calcitonin levels. J Clin Endocrinol Metab 2007 92 4185-4190. 4
10. de Groot JW, Kema IP, Breukelman H, van der Veer E, Wiggers T, Plukker JT, 5
Wolffenbuttel BH & Links TP. Biochemical markers in the follow-up of 6
medullary thyroid cancer. Thyroid 2006 16 1163-1170. 7
11. Machens A, Schneyer U, Holzhausen HJ & Dralle H. Prospects of remission in 8
medullary thyroid carcinoma according to basal calcitonin level. J Clin 9
Endocrinol Metab 2005 90 2029-2034. 10
12. Roman S, Lin R & Sosa JA. Prognosis of medullary thyroid carcinoma: 11
demographic, clinical, and pathologic predictors of survival in 1252 cases. Cancer 12
2006 107 2134-2142. 13
13. Pelizzo MR, Boschin IM, Bernante P, Toniato A, Piotto A, Pagetta C, Nibale O, 14
Rampin L, Muzzio PC & Rubello D. Natural history, diagnosis, treatment and 15
outcome of medullary thyroid cancer: 37 years experience on 157 patients. Eur J 16
Surg Oncol 2007 33 493-497. 17
14. Cupisti K, Wolf A, Raffel A, Schott M, Miersch D, Yang Q, Eisenberger CF, 18
Roher HD & Knoefel WT. Long-term clinical and biochemical follow-up in 19
medullary thyroid carcinoma: a single institution's experience over 20 years. Ann 20
Surg 2007 246 815-821. 21
15. Costante G, Meringolo D, Durante C, Bianchi D, Nocera M, Tumino S, Crocetti 22
U, Attard M, Maranghi M, Torlontano M & Filetti S. Predictive value of serum 23
calcitonin levels for preoperative diagnosis of medullary thyroid carcinoma in a 24
cohort of 5817 consecutive patients with thyroid nodules. J Clin Endocrinol 25
Metab 2007 92 450-455. 26
16. Elisei R, Bottici V, Luchetti F, Di Coscio G, Romei C, Grasso L, Miccoli P, 27
Iacconi P, Basolo F, Pinchera A & Pacini F. Impact of routine measurement of 28
serum calcitonin on the diagnosis and outcome of medullary thyroid cancer: 29
experience in 10,864 patients with nodular thyroid disorders. J Clin Endocrinol 30
Metab 2004 89 163-168. 31
Page 17 of 32
18
17. Hahm JR, Lee MS, Min YK, Lee MK, Kim KW, Nam SJ, Yang JH & Chung JH. 1
Routine measurement of serum calcitonin is useful for early detection of 2
medullary thyroid carcinoma in patients with nodular thyroid diseases. Thyroid 3
2001 11 73-80. 4
18. Kloos RT, Eng C, Evans DB, Francis GL, Gagel RF, Gharib H, Moley JF, Pacini 5
F, Ringel MD, Schlumberger M & Wells SA, Jr. Medullary thyroid cancer: 6
management guidelines of the American Thyroid Association. Thyroid 2009 19 7
565-612. 8
19. Karga H, Giagourta I, Papaioannou G, Doumouchtsis K, Polymeris A, Thanou S, 9
Papamichael K & Zerva C. Changes in risk factors and Tumor Node Metastasis 10
stage of sporadic medullary thyroid carcinoma over 41 years, before and after the 11
routine measurements of serum calcitonin. Metabolism 2011 60 604-608. 12
20. Beressi N, Campos JM, Beressi JP, Franc B, Niccoli-Sire P, Conte-Devolx B, 13
Murat A, Caron P, Baldet L, Kraimps JL, Cohen R, Bigorgne JC, Chabre O, 14
Lecomte P & Modigliani E. Sporadic medullary microcarcinoma of the thyroid: a 15
retrospective analysis of eighty cases. Thyroid 1998 8 1039-1044. 16
21. Zangeneh F, Gharib H, Goellner JR & Kao PC. Potential absence of prognostic 17
implications of severe preoperative hypercalcitoninemia in medullary thyroid 18
carcinoma. Endocr Pract 2003 9 284-289. 19
22. Hyer SL, Vini L, A'Hern R & Harmer C. Medullary thyroid cancer: multivariate 20
analysis of prognostic factors influencing survival. Eur J Surg Oncol 2000 26 21
686-690. 22
23. Rios A, Rodriguez JM, Acosta JM, Balsalobre MD, Torregrosa N, Sola J, Perez-23
Flores D & Parrilla P. Prognostic value of histological and immunohistochemical 24
characteristics for predicting the recurrence of medullary thyroid carcinoma. Ann 25
Surg Oncol 2010 17 2444-2451. 26
24. Scopsi L, Sampietro G, Boracchi P, Del Bo R, Gullo M, Placucci M & Pilotti S. 27
Multivariate analysis of prognostic factors in sporadic medullary carcinoma of the 28
thyroid. A retrospective study of 109 consecutive patients. Cancer 1996 78 2173-29
2183. 30
Page 18 of 32
19
25. Pillarisetty VG, Katz SC, Ghossein RA, Tuttle RM & Shaha AR. Micromedullary 1
thyroid cancer: how micro is truly micro? Ann Surg Oncol 2009 16 2875-2881. 2
26. Scheuba C, Kaserer K, Bieglmayer C, Asari R, Riss P, Drosten R & Niederle B. 3
Medullary thyroid microcarcinoma recommendations for treatment - a single-4
center experience. Surgery 2007 142 1003-1010; discussion 1010 e1001-1003. 5
27. Valle LA & Kloos RT. The prevalence of occult medullary thyroid carcinoma at 6
autopsy. J Clin Endocrinol Metab 2011 96 E109-113. 7
28. Ahmed SR & Ball DW. Clinical review: Incidentally discovered medullary 8
thyroid cancer: diagnostic strategies and treatment. J Clin Endocrinol Metab 2011 9
96 1237-1245. 10
29. Vasileiadis I, Karakostas E, Charitoudis G, Stavrianaki A, Kapetanakis S, 11
Kouraklis G & Karatzas T. Papillary thyroid microcarcinoma: clinicopathological 12
characteristics and implications for treatment in 276 patients. Eur J Clin Invest 13
2011. 14
30. Mehrotra PK, Mishra A, Mishra SK, Agarwal G, Agarwal A & Verma AK. 15
Medullary thyroid cancer: clinico-pathological profile and outcome in a tertiary 16
care center in North India. World J Surg 2011 35 1273-1280. 17
31. Abraham DT, Low TH, Messina M, Jackson N, Gill A, Chou AS, Delbridge L, 18
Learoyd D, Robinson BG, Sidhu S & Sywak M. Medullary thyroid carcinoma: 19
long-term outcomes of surgical treatment. Ann Surg Oncol 2011 18 219-225. 20
32. Brandao LG, Cavalheiro BG & Junqueira CR. Prognostic influence of clinical and 21
pathological factors in medullary thyroid carcinoma: a study of 53 cases. Clinics 22
(Sao Paulo) 2009 64 849-856. 23
33. Bergholm U, Bergstrom R & Ekbom A. Long-term follow-up of patients with 24
medullary carcinoma of the thyroid. Cancer 1997 79 132-138. 25
34. Scollo C, Baudin E, Travagli JP, Caillou B, Bellon N, Leboulleux S & 26
Schlumberger M. Rationale for central and bilateral lymph node dissection in 27
sporadic and hereditary medullary thyroid cancer. J Clin Endocrinol Metab 2003 28
88 2070-2075. 29
Page 19 of 32

20
35. Kandil E, Gilson MM, Alabbas HH, Tufaro AP, Dackiw A & Tufano RP. 1
Survival implications of cervical lymphadenectomy in patients with medullary 2
thyroid cancer. Ann Surg Oncol 2011 18 1028-1034. 3
36. Pacini F, Fontanelli M, Fugazzola L, Elisei R, Romei C, Di Coscio G, Miccoli P 4
& Pinchera A. Routine measurement of serum calcitonin in nodular thyroid 5
diseases allows the preoperative diagnosis of unsuspected sporadic medullary 6
thyroid carcinoma. J Clin Endocrinol Metab 1994 78 826-829. 7
37. Sarika HL, Papathoma A, Garofalaki M, Vasileiou V, Vlassopoulou B, 8
Anastasiou E & Alevizaki M. High prevalence of exon 8 g533c mutation in 9
apparently sporadic medullary thyroid carcinoma (mtc) in Greece. Clin 10
Endocrinol (Oxf) 2012. 11
38. Machens A & Dralle H. Biomarker-based risk stratification for previously 12
untreated medullary thyroid cancer. J Clin Endocrinol Metab 2010 95 2655-2663. 13
39. Saad MF, Ordonez NG, Rashid RK, Guido JJ, Hill CS, Jr., Hickey RC & Samaan 14
NA. Medullary carcinoma of the thyroid. A study of the clinical features and 15
prognostic factors in 161 patients. Medicine (Baltimore) 1984 63 319-342. 16
40. Dottorini ME, Assi A, Sironi M, Sangalli G, Spreafico G & Colombo L. 17
Multivariate analysis of patients with medullary thyroid carcinoma. Prognostic 18
significance and impact on treatment of clinical and pathologic variables. Cancer 19
1996 77 1556-1565. 20
41. Raue F, Kotzerke J, Reinwein D, Schroder S, Roher HD, Deckart H, Hofer R, 21
Ritter M, Seif F, Buhr H & et al. Prognostic factors in medullary thyroid 22
carcinoma: evaluation of 741 patients from the German Medullary Thyroid 23
Carcinoma Register. Clin Investig 1993 71 7-12. 24
42. Gharib H, McConahey WM, Tiegs RD, Bergstralh EJ, Goellner JR, Grant CS, van 25
Heerden JA, Sizemore GW & Hay ID. Medullary thyroid carcinoma: 26
clinicopathologic features and long-term follow-up of 65 patients treated during 27
1946 through 1970. Mayo Clin Proc 1992 67 934-940. 28
43. Machens A, Hofmann C, Hauptmann S & Dralle H. Locoregional recurrence and 29
death from medullary thyroid carcinoma in a contemporaneous series: 5-year 30
results. Eur J Endocrinol 2007 157 85-93. 31
Page 20 of 32
21
44. Moley JF & Fialkowski EA. Evidence-based approach to the management of 1
sporadic medullary thyroid carcinoma. World J Surg 2007 31 946-956. 2
45. Gulben K, Berberoglu U & Boyabatli M. Prognostic factors for sporadic 3
medullary thyroid carcinoma. World J Surg 2006 30 84-90. 4
46. Kameyama K & Takami H. Medullary thyroid carcinoma: nationwide Japanese 5
survey of 634 cases in 1996 and 271 cases in 2002. Endocr J 2004 51 453-456. 6
7
8
9
10
11
12
Page 21 of 32

22
Fig 1: Comparison of histological and clinical characteristics at diagnosis of medullary 1
carcinoma of the thyroid (%) between the two chronological periods of diagnosis: group 2
1: 1977-2001 (n=53 ) and group 2: 2001-2011, (n=98) 3
4
5
Fig 2: Comparison of the extent of disease (%) during follow up of medullary carcinoma 6
of the thyroid (MTC) between the two chronological periods when diagnosis was 7
established (group 1 n=53, group 2 n=98, p=0.003) 8
9
10
Fig 3: Comparison of histological and clinical characteristics at diagnosis of sporadic 11
MTC cases (%) between the two chronological periods of diagnosis (group 1: 1977-2000 12
n=28 and group 2: 2001-2011, n=50) 13
14
15
Fig 4: Comparison of the extent of the disease (%) during follow-up between the two 16
chronological periods when diagnosis was established in sporadic cases with medullary 17
carcinoma of the thyroid (p<0.001, n=77) 18
19
Fig 5: Kaplan Meier analysis for the probability of progression of disease in sporadic 20
MTC cases at 10-years follow up according to the TNM stage at diagnosis 21
22
Fig 6: Kaplan Meier analysis for the probability of progression of disease in familial 23
MTC cases at 10-years follow up according to the TNM stage at diagnosis 24
25
26
27
28
29
30
Page 22 of 32
23
1
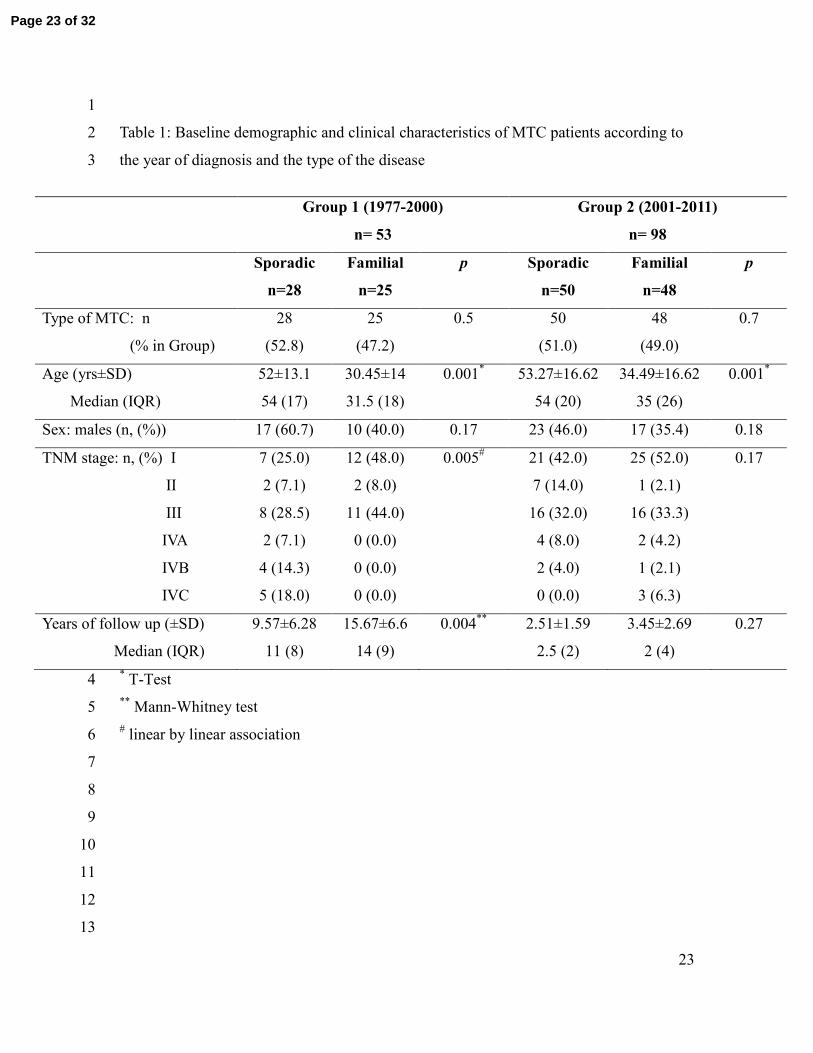
Table 1: Baseline demographic and clinical characteristics of MTC patients according to 2
the year of diagnosis and the type of the disease 3
* T-Test 4
** Mann-Whitney test 5
# linear by linear association 6
7
8
9
10
11
12
13
Group 1 (1977-2000)
n= 53
Group 2 (2001-2011)
n= 98
Sporadic
n=28
Familial
n=25
p Sporadic
n=50
Familial
n=48
p
Type of MTC: n
(% in Group)
28
(52.8)
25
(47.2)
0.5 50
(51.0)
48
(49.0)
0.7
Age (yrs±SD)
Median (IQR)
52±13.1
54 (17)
30.45±14
31.5 (18)
0.001* 53.27±16.62
54 (20)
34.49±16.62
35 (26)
0.001*
Sex: males (n, (%)) 17 (60.7) 10 (40.0) 0.17 23 (46.0) 17 (35.4) 0.18
TNM stage: n, (%) I
II
III
IVA
IVB
IVC
7 (25.0)
2 (7.1)
8 (28.5)
2 (7.1)
4 (14.3)
5 (18.0)
12 (48.0)
2 (8.0)
11 (44.0)
0 (0.0)
0 (0.0)
0 (0.0)
0.005# 21 (42.0)
7 (14.0)
16 (32.0)
4 (8.0)
2 (4.0)
0 (0.0)
25 (52.0)
1 (2.1)
16 (33.3)
2 (4.2)
1 (2.1)
3 (6.3)
0.17
Years of follow up (±SD)
Median (IQR)
9.57±6.28
11 (8)
15.67±6.6
14 (9)
0.004**
2.51±1.59
2.5 (2)
3.45±2.69
2 (4)
0.27
Page 23 of 32
24
1
Table 2: Mode of diagnosis in the two groups of MTC patients according to the year of 2
diagnosis and the type of the disease 3
4
5
Group 1 (1977-2000) Group 2 (2001-2011)
Sporadic
n=28
Familial
n=25
p Sporadic
n=50
Familial
n=48
p
Calcitonin measurement: n, (%) 7 (25.0) 6 (24.0) 0.001# 42 (84.0) 22 (45.8) 0.001
#
Surgery for multinodular goiter: n, (%) 15 (53.6) 5 (20.0) 5 (10.0) 4 (8.4)
FNA: n, (%) 6 (21.4) 2 (8.0) 3 (6.0) 0 (0.0)
Genetic screening: n, (%) 0 (0.0) 12 (48.0) 0 (0.0) 22 (45.8)
# linear by linear association 6
7
8
9
10
11
Page 24 of 32
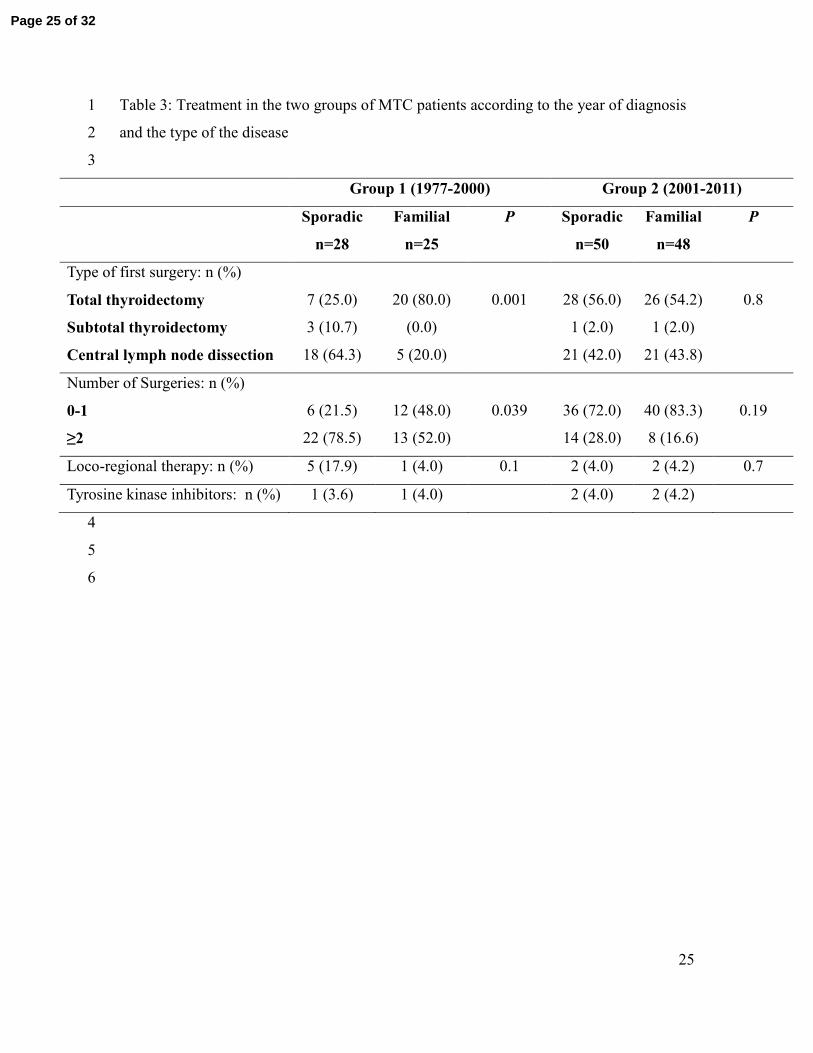
25
Table 3: Treatment in the two groups of MTC patients according to the year of diagnosis 1
and the type of the disease 2
3
Group 1 (1977-2000) Group 2 (2001-2011)
Sporadic
n=28
Familial
n=25
P Sporadic
n=50
Familial
n=48
P
Type of first surgery: n (%)
Total thyroidectomy
Subtotal thyroidectomy
Central lymph node dissection
7 (25.0)
3 (10.7)
18 (64.3)
20 (80.0)
(0.0)
5 (20.0)
0.001
28 (56.0)
1 (2.0)
21 (42.0)
26 (54.2)
1 (2.0)
21 (43.8)
0.8
Number of Surgeries: n (%)
0-1
≥2
6 (21.5)
22 (78.5)
12 (48.0)
13 (52.0)
0.039
36 (72.0)
14 (28.0)
40 (83.3)
8 (16.6)
0.19
Loco-regional therapy: n (%) 5 (17.9) 1 (4.0) 0.1 2 (4.0) 2 (4.2) 0.7
Tyrosine kinase inhibitors: n (%) 1 (3.6) 1 (4.0) 2 (4.0) 2 (4.2)
4
5
6
Page 25 of 32
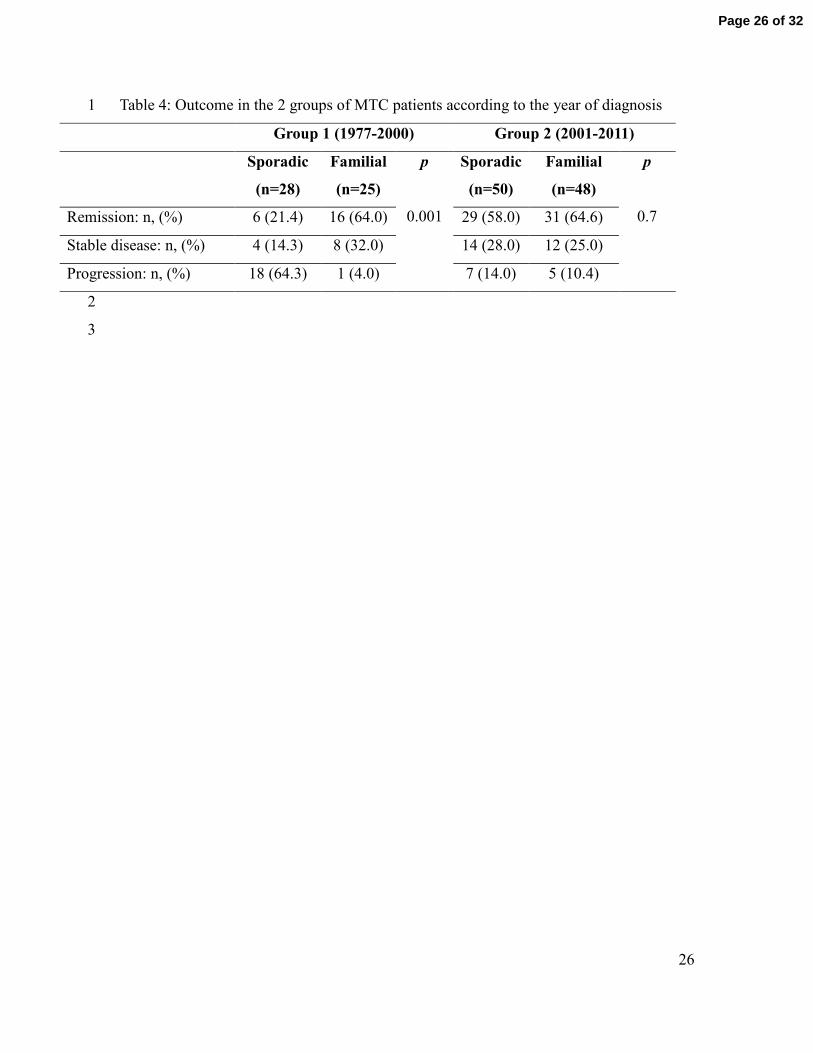
26
Table 4: Outcome in the 2 groups of MTC patients according to the year of diagnosis 1
Group 1 (1977-2000) Group 2 (2001-2011)
Sporadic
(n=28)
Familial
(n=25)
p
0.001
Sporadic
(n=50)
Familial
(n=48)
p
0.7 Remission: n, (%) 6 (21.4) 16 (64.0) 29 (58.0) 31 (64.6)
Stable disease: n, (%) 4 (14.3) 8 (32.0) 14 (28.0) 12 (25.0)
Progression: n, (%) 18 (64.3) 1 (4.0) 7 (14.0) 5 (10.4)
2
3
Page 26 of 32

Fig 1: Comparison of histological and clinical characteristics at diagnosis of medullary carcinoma of the thyroid (%) between the two chronological periods of diagnosis: group 1: 1977-2001 (n=53 ) and group 2:
2001-2011, (n=98)
254x190mm (96 x 96 DPI)
Page 27 of 32
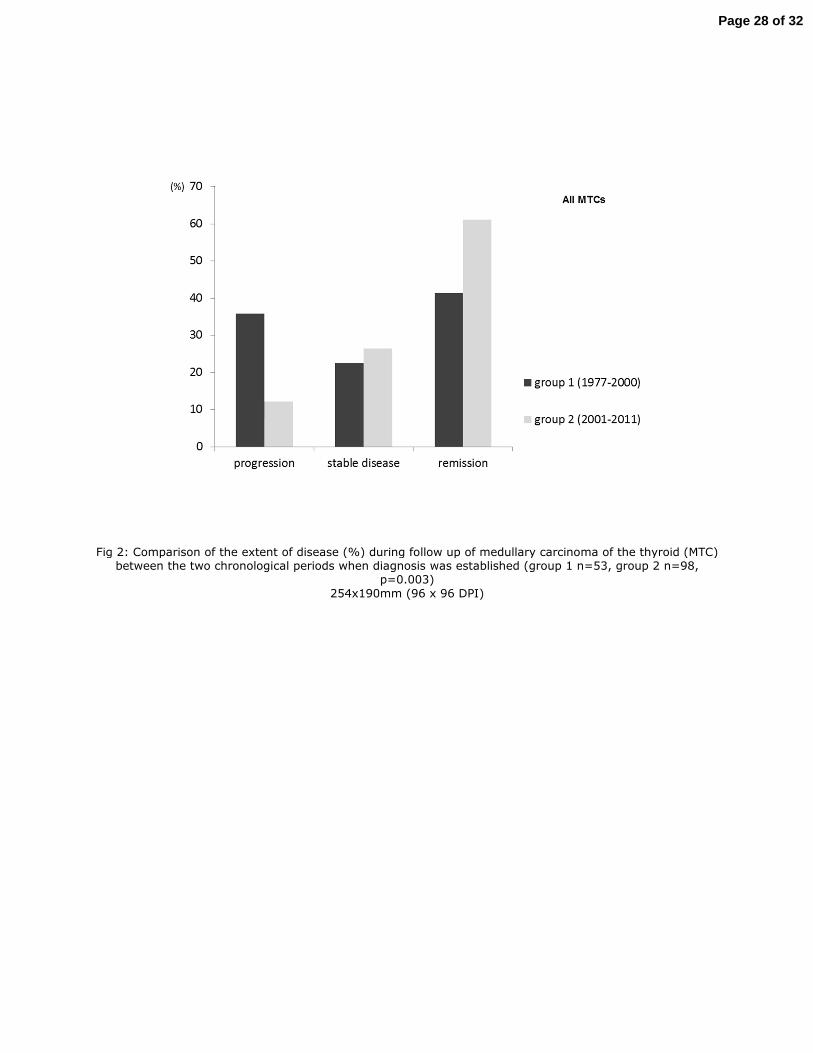
Fig 2: Comparison of the extent of disease (%) during follow up of medullary carcinoma of the thyroid (MTC) between the two chronological periods when diagnosis was established (group 1 n=53, group 2 n=98,
p=0.003)
254x190mm (96 x 96 DPI)
Page 28 of 32

Fig 3: Comparison of histological and clinical characteristics at diagnosis of sporadic MTC cases (%) between the two chronological periods of diagnosis (group 1: 1977-2000 n=28 and group 2: 2001-2011, n=50)
254x190mm (96 x 96 DPI)
Page 29 of 32

Fig 4: Comparison of the extent of the disease (%) during follow-up between the two chronological periods when diagnosis was established in sporadic cases with medullary carcinoma of the thyroid (p<0.001, n=77)
254x190mm (96 x 96 DPI)
Page 30 of 32
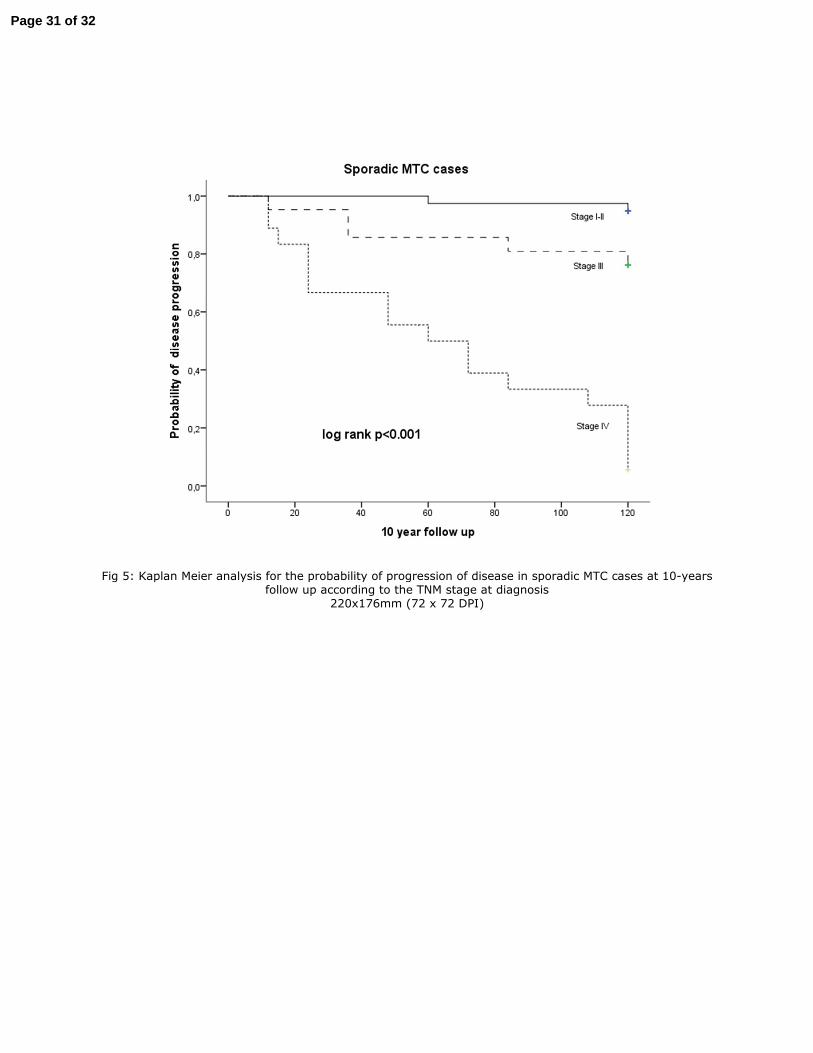
Fig 5: Kaplan Meier analysis for the probability of progression of disease in sporadic MTC cases at 10-years follow up according to the TNM stage at diagnosis
220x176mm (72 x 72 DPI)
Page 31 of 32

Fig 6: Kaplan Meier analysis for the probability of progression of disease in familial MTC cases at 10-years follow up according to the TNM stage at diagnosis
220x176mm (72 x 72 DPI)
Page 32 of 32
Top Related