


Languages
Pages
Legal


1 Braxton Way Suite 125 Glen Mills, PA 19342
484-840-4300 www.ssrs.com
POLL 1 @ssrs_research | 484.840.4300 | www.ssrs.com | 1
OVERVIEW The study was conducted for CNN via telephone by SSRS, an independent research company. Interviews were conducted from January 9-14, 2021 among a sample of 1,003 respondents. The landline total respondents were 253 and there were 750 cell phone respondents. The margin of sampling error for total respondents is +/- 3.7 at the 95% confidence level. The design effect is 1.40. More information about SSRS can be obtained by visiting www.ssrs.com. Unless otherwise noted, results beginning with the March 31-April 2, 2006 survey and ending with the April 22-25, 2017 survey are from surveys conducted by ORC International. Results before March 31, 2006 are from surveys conducted by Gallup. Question text noted in parentheses was rotated or randomized. Values less than 0.5 percent are indicated by an asterisk (*).
NOTE ABOUT CROSSTABS Interviews were conducted among a representative sample of the adult population, age 18 or older, of the United States. Members of demographic groups not shown in the published crosstabs are represented in the results for each question in the poll. Crosstabs on the pages that follow only include results for subgroups with a minimum N=125 unweighted cases. Results for subgroups with fewer than N=125 unweighted cases are not displayed and instead are denoted with "SN" because samples of that size carry larger margins of sampling error and can be too small to be projectable with confidence to their true values in the population.
EMBARGOED FOR RELEASE:
Sunday, January 17 at 8:00 a.m.

1 Braxton Way Suite 125 Glen Mills, PA 19342
484-840-4300 www.ssrs.com
POLL 1 @ssrs_research | 484.840.4300 | www.ssrs.com | 2
A1. Do you approve or disapprove of the way Donald Trump is handling his job as president?
Approve Disapprove No opinion
January 9-14, 2021 34% 62% 4%
October 23-26, 2020 42% 55% 4%
October 1-4, 2020 40% 57% 3%
Aug. 28-Sept. 01, 2020 41% 53% 7%
August 12-15, 2020 42% 54% 3%
June 2-5, 2020 38% 57% 5%
May 7-10, 2020 45% 51% 4%
April 3-6, 2020 44% 51% 5%
March 4-7, 2020 43% 53% 4%
January 16-19, 2020 43% 53% 4%
December 12-15, 2019 43% 53% 4%
November 21-24, 2019 42% 54% 4%
October 17-20, 2019 41% 57% 2%
September 5-9, 2019 39% 55% 6%
August 15-18, 2019 40% 54% 6%
June 28-30, 2019 43% 52% 5%
May 28-31, 2019 43% 52% 5%
April 25-28, 2019 43% 52% 5%
March 14-17, 2019 42% 51% 8%
Jan. 30-Feb. 02, 2019 40% 55% 5%
January 10-11, 2019 37% 57% 7%
December 06-09, 2018 39% 52% 9%
November 01-03, 2018 39% 55% 6%
October 04-07, 2018 41% 52% 7%
September 06-09, 2018 36% 58% 6%
August 09-12, 2018 42% 53% 5%
June 14-17, 2018 39% 54% 7%
May 02-05, 2018 41% 53% 6%
March 22-25, 2018 42% 54% 5%
February 20-23, 2018 35% 58% 7%
January 14-18, 2018 40% 55% 5%
December 14-17, 2017 35% 59% 6%
November 02-05, 2017 36% 58% 6%
October 12-15, 2017 37% 57% 6%
September 26-28, 2017 37% 56% 7%
September 17-20, 2017 40% 55% 5%
August 03-06, 2017 38% 56% 5%
April 22-25, 2017 44% 54% 2%
March 01-04, 2017 45% 52% 3%
Jan. 31-Feb. 02, 2017 44% 53% 3%

1 Braxton Way Suite 125 Glen Mills, PA 19342
484-840-4300 www.ssrs.com
POLL 1 @ssrs_research | 484.840.4300 | www.ssrs.com | 3
Q2. Thinking about the results of the 2020 presidential election, do you think that Joe Biden legitimately won enough votes to win the presidency, or not?
Yes, Biden legitimately won
enough votes to win the presidency
No, Biden did not legitimately win enough
votes to win the presidency No opinion
January 9-14, 2021 65% 32% 3%
(Respondents who say Biden did not legitimately win enough votes to win the presidency, N=311) Q2a. (Do you think there’s been solid evidence of that), or (is that your suspicion only)?
Solid evidence Suspicion only No opinion
January 9-14, 2021 73% 22% 4%
Q2. Thinking about the results of the 2020 presidential election, do you think that Joe Biden legitimately won enough votes to win the presidency, or not? Q2a. (Do you think there’s been solid evidence of that), or (is that your suspicion only)? Q2/Q2A COMBO TABLE
Yes, Biden legitimately won enough votes to win
the presidency
No, Biden did not
legitimately win enough votes to win
the presidency
Solid evidence
Suspicion only
No opinion No opinion
January 9-14, 2021 65% 32% 23% 7% 1% 3%
Q3. In general, how confident are you that elections in America today reflect the will of the people? [RESPONSES ROTATED IN ORDER FOR HALF/IN REVERSE ORDER FOR HALF]
NET Very/
Somewhat confident
Very confident
Somewhat confident
NET Just a little/
Not at all confident
Just a little confident
Not at all confident
No opinion
January 9-14, 2021 59% 36% 23% 40% 11% 29% 1%

1 Braxton Way Suite 125 Glen Mills, PA 19342
484-840-4300 www.ssrs.com
POLL 1 @ssrs_research | 484.840.4300 | www.ssrs.com | 4
Q4. Do you think that the storming of the U.S. Capitol on January 6 represents a crisis, a major problem, a minor problem, or not a problem for American democracy?
Crisis Major problem Minor problem Not a problem No opinion
January 9-14, 2021 36% 39% 14% 9% 2%
Q4a. Do you think that Donald Trump should or should not be removed from office before January 20 because of his role in the events of January 6?
Should be removed from office
Should not be removed from office
No opinion
January 9-14, 2021 54% 43% 3%
COMPARE TO:
Yes, vote for conviction
and removal No, vote against conviction
and removal No opinion
January 16-19, 2020 51% 45% 4%
**QUESTION WORDING: As you may know, removing a president from office involves two major steps in Congress. First, the House of Representatives must vote on whether there is enough evidence to bring a president to trial before the Senate. This step is called impeachment. Next, the Senate must vote on whether to remove the president from office, or not. As you may know, the House has now impeached Trump and the case has been sent to the Senate for trial. As of now, do you think the Senate should vote to convict Trump and remove him from office, or do you think the Senate should vote against conviction and removal?
Should be impeached
and removed from office Don't you feel that way No opinion
December 12-15, 2019 45% 47% 9%
November 21-24, 2019 50% 43% 6%
October 17-20, 2019 50% 43% 7%
September 24-29, 2019 47% 45% 8%
May 28-31, 2019 41% 54% 5%
April 25-28, 2019 37% 59% 4%
March 14-17, 2019 36% 59% 5%
December 06-09, 2018 43% 50% 8%
September 06-09, 2018 47% 48% 5%
June 14-17, 2018 42% 51% 7%
**QUESTION WORDING: Based on what you have read or heard, do you believe that President Trump should be impeached and removed from office, or don't you feel that way?
Q5. Do you think enough has been done to penalize those who stormed the U.S. Capitol, or not?
Yes, enough has been done
No, not enough has been done
No opinion
January 9-14, 2021 23% 63% 14%
1 Braxton Way Suite 125 Glen Mills, PA 19342
484-840-4300 www.ssrs.com
POLL 1 @ssrs_research | 484.840.4300 | www.ssrs.com | 5
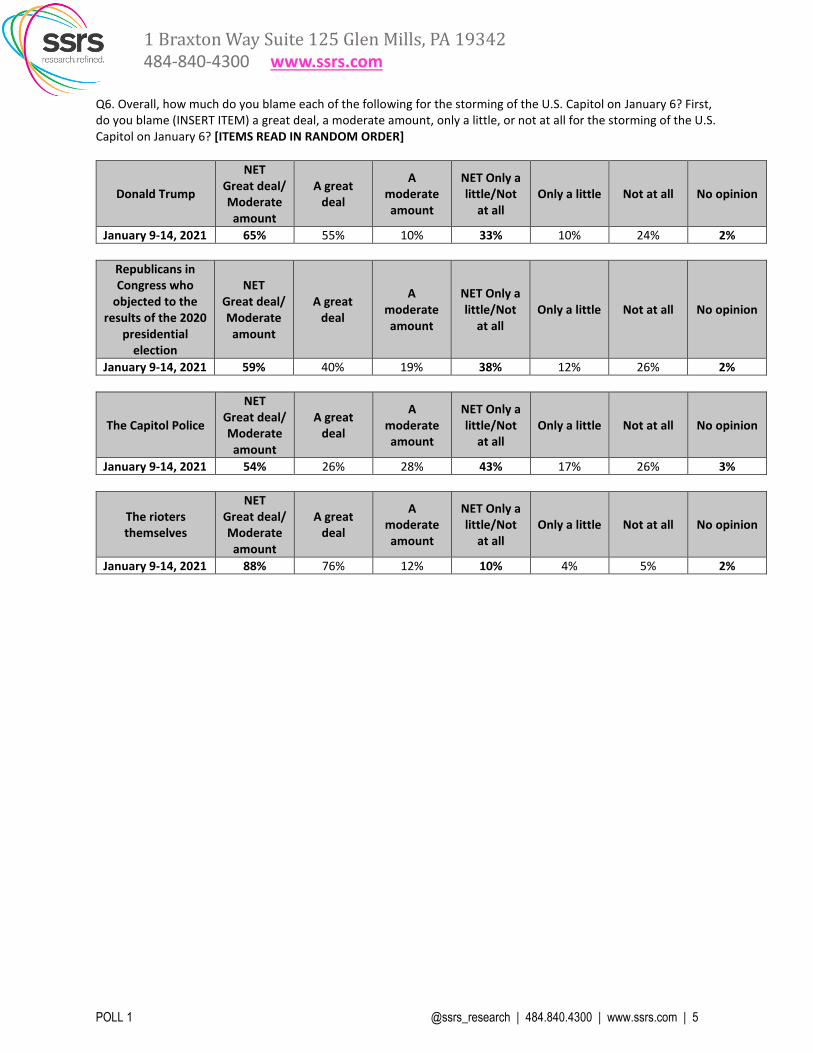
Q6. Overall, how much do you blame each of the following for the storming of the U.S. Capitol on January 6? First, do you blame (INSERT ITEM) a great deal, a moderate amount, only a little, or not at all for the storming of the U.S. Capitol on January 6? [ITEMS READ IN RANDOM ORDER]
Donald Trump
NET Great deal/ Moderate amount
A great deal
A moderate amount
NET Only a little/Not
at all Only a little Not at all No opinion
January 9-14, 2021 65% 55% 10% 33% 10% 24% 2%
Republicans in Congress who
objected to the results of the 2020
presidential election
NET Great deal/ Moderate
amount
A great deal
A moderate amount
NET Only a little/Not
at all Only a little Not at all No opinion
January 9-14, 2021 59% 40% 19% 38% 12% 26% 2%
The Capitol Police
NET Great deal/ Moderate amount
A great deal
A moderate amount
NET Only a little/Not
at all Only a little Not at all No opinion
January 9-14, 2021 54% 26% 28% 43% 17% 26% 3%
The rioters themselves
NET Great deal/ Moderate amount
A great deal
A moderate amount
NET Only a little/Not
at all Only a little Not at all No opinion
January 9-14, 2021 88% 76% 12% 10% 4% 5% 2%

1 Braxton Way Suite 125 Glen Mills, PA 19342
484-840-4300 www.ssrs.com
POLL 1 @ssrs_research | 484.840.4300 | www.ssrs.com | 6
Q7. Looking back on Donald Trump's four years in office, in general, would you say his presidency has been: [RESPONSES ROTATED IN ORDER FOR HALF/IN REVERSE ORDER FOR HALF]
A success A failure No opinion
January 9-14, 2021 41% 55% 4%
CNN/ORC TRENDS FOR COMPARISON
Barack Obama A success A failure Too soon to
tell (vol.) No opinion 2017 Jan 12-15^** 65% 34% -- 1% 2015 Mar 13-15*** 50% 47% -- 4% 2011 Jan 14-16**** 45% 48% 5% 2% 2010 Jan 8-10**** 47% 48% 4% 1% 2009 July 31-Aug 3**** 51% 37% 11% 1% ^ Asked of a half sample **QUESTION WORDING: Looking back on Barack Obama's eight years in office, in general, would you say his presidency has been: ***QUESTION WORDING: Since the start of 2009 when Barack Obama became president, in general, would you say his presidency has been: ****QUESTION WORDING: Do you consider the first [INSERT TIME: 2011 “first two years”; 2010 “first year”; 2009 “first six months”] of the Obama administration to be a success or a failure?
George W. Bush A success A failure Too soon to
tell (vol.) No opinion 2009 Jan 12-15** 31% 68% -- 1% 2007 Aug 6-8^*** 40% 57% -- 3% 2007 Jan 19-21*** 39% 55% -- 6% ^ Asked of a half sample ** QUESTION WORDING: Looking back on George W. Bush’s eight years in office, in general, would you say his presidency was a success or failure? *** QUESTION WORDING: Since the start of 2001 when George W. Bush became president, in general, would you say his presidency has been a success or failure?
(FURTHER TRENDS ON NEXT PAGE)

1 Braxton Way Suite 125 Glen Mills, PA 19342
484-840-4300 www.ssrs.com
POLL 1 @ssrs_research | 484.840.4300 | www.ssrs.com | 7
Q7. Looking back on Donald Trump's four years in office, in general, would you say his presidency has been: [RESPONSES ROTATED IN ORDER FOR HALF/IN REVERSE ORDER FOR HALF] (CONTINUED)
CNN/USA TODAY/GALLUP TRENDS FOR COMPARISON
George W. Bush A success A failure Too soon to
tell (vol.) No opinion 2006 Jan 20-22^*** 46% 52% -- 2% 2005 Oct 28-30*** 42% 55% -- 3% 2005 Aug 28-30^*** 47% 51% -- 2% 2002 Jan 25-27**** 83% 11% 3% 3% 2001 Aug 3-5^**** 56% 32% 7% 5% * Asked of a half sample ***QUESTION WORDING: Since the start of 2001 when George W. Bush became president, in general, would you say his presidency has been a success or failure? ****QUESTION WORDING: Do you consider the first [INSERT TIME: 2002 “first year”; 2001 “first six months”] of the Bush administration to be a success or a failure?
Bill Clinton A success A failure No opinion 2000 Aug 11-12** 68% 29% 3% 1999 Jan 22-24** 77% 20% 3% 1999 Jan 15-17** 81% 16% 3% 1998 Jan 24-25** 70% 26% 4% 1998 Jan 23-24** 71% 25% 4% 1997 Oct 27-29^** 70% 25% 5% 1996 Aug 30-Sep 1*** 64% 31% 5% 1996 Aug 16-18*** 57% 38% 5% 1996 Aug 5-7^*** 64% 30% 6% 1994 Dec 2-5**** 44% 50% 6% ^Asked of a half sample **QUESTION WORDING: Since the start of 1993 when Bill Clinton became president, in general, would you say his presidency has been a success or a failure? ***QUESTION WORDING: Looking back on Bill Clinton's first term in office, in general, would you say his presidency has been a success or a failure? ****QUESTION WORDING: Looking back on Bill Clinton's first two years in office, in general, would you say his presidency has been a success or a failure?
George H.W. Bush A success A failure Mixed (vol.) No opinion 1993 Aug 8-11** 53% 33% 12% 2% **QUESTION WORDING: Looking back on George Bush's four years in office, in general, would you say his Presidency was a success or a failure?
1 Braxton Way Suite 125 Glen Mills, PA 19342
484-840-4300 www.ssrs.com
POLL 1 @ssrs_research | 484.840.4300 | www.ssrs.com | 8
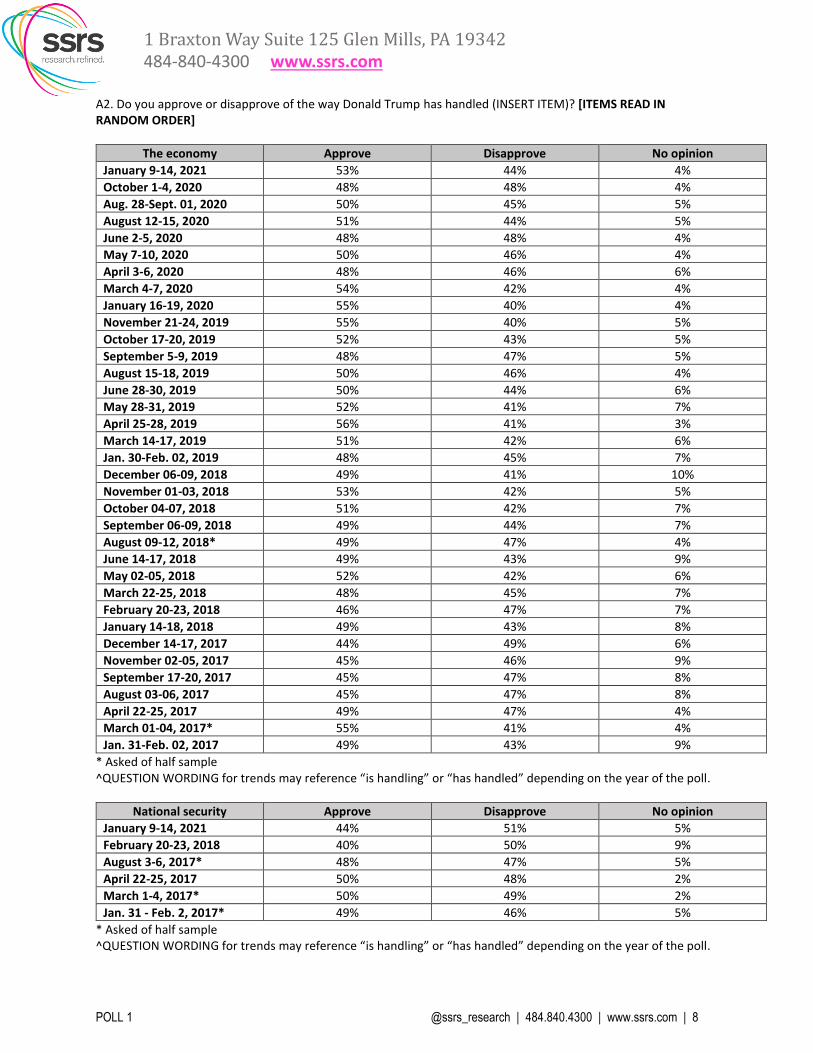
A2. Do you approve or disapprove of the way Donald Trump has handled (INSERT ITEM)? [ITEMS READ IN RANDOM ORDER]
The economy Approve Disapprove No opinion
January 9-14, 2021 53% 44% 4%
October 1-4, 2020 48% 48% 4%
Aug. 28-Sept. 01, 2020 50% 45% 5%
August 12-15, 2020 51% 44% 5%
June 2-5, 2020 48% 48% 4%
May 7-10, 2020 50% 46% 4%
April 3-6, 2020 48% 46% 6%
March 4-7, 2020 54% 42% 4%
January 16-19, 2020 55% 40% 4%
November 21-24, 2019 55% 40% 5%
October 17-20, 2019 52% 43% 5%
September 5-9, 2019 48% 47% 5%
August 15-18, 2019 50% 46% 4%
June 28-30, 2019 50% 44% 6%
May 28-31, 2019 52% 41% 7%
April 25-28, 2019 56% 41% 3%
March 14-17, 2019 51% 42% 6%
Jan. 30-Feb. 02, 2019 48% 45% 7%
December 06-09, 2018 49% 41% 10%
November 01-03, 2018 53% 42% 5%
October 04-07, 2018 51% 42% 7%
September 06-09, 2018 49% 44% 7%
August 09-12, 2018* 49% 47% 4%
June 14-17, 2018 49% 43% 9%
May 02-05, 2018 52% 42% 6%
March 22-25, 2018 48% 45% 7%
February 20-23, 2018 46% 47% 7%
January 14-18, 2018 49% 43% 8%
December 14-17, 2017 44% 49% 6%
November 02-05, 2017 45% 46% 9%
September 17-20, 2017 45% 47% 8%
August 03-06, 2017 45% 47% 8%
April 22-25, 2017 49% 47% 4%
March 01-04, 2017* 55% 41% 4%
Jan. 31-Feb. 02, 2017 49% 43% 9%
* Asked of half sample ^QUESTION WORDING for trends may reference “is handling” or “has handled” depending on the year of the poll.
National security Approve Disapprove No opinion
January 9-14, 2021 44% 51% 5%
February 20-23, 2018 40% 50% 9%
August 3-6, 2017* 48% 47% 5%
April 22-25, 2017 50% 48% 2%
March 1-4, 2017* 50% 49% 2%
Jan. 31 - Feb. 2, 2017* 49% 46% 5%
* Asked of half sample ^QUESTION WORDING for trends may reference “is handling” or “has handled” depending on the year of the poll.

1 Braxton Way Suite 125 Glen Mills, PA 19342
484-840-4300 www.ssrs.com
POLL 1 @ssrs_research | 484.840.4300 | www.ssrs.com | 9
A2. Do you approve or disapprove of the way Donald Trump has handled (INSERT ITEM)? [ITEMS READ IN RANDOM ORDER] (CONTINUED)
Immigration Approve Disapprove No opinion
January 9-14, 2021 36% 61% 3%
January 16-19, 2020 42% 56% 2%
November 21-24, 2019 39% 58% 3%
October 17-20, 2019 40% 58% 2%
September 5-9, 2019 37% 59% 4%
August 15-18, 2019 37% 58% 5%
June 28-30, 2019 40% 57% 3%
May 28-31, 2019 41% 54% 5%
April 25-28, 2019 42% 54% 4%
March 14-17, 2019 39% 58% 3%
Jan. 30-Feb. 02, 2019 41% 54% 5%
December 06-09, 2018 39% 54% 7%
November 01-03, 2018 37% 59% 4%
October 04-07, 2018 39% 56% 5%
September 06-09, 2018 35% 59% 6%
August 09-12, 2018 37% 58% 4%
June 14-17, 2018 35% 59% 6%
May 02-05, 2018 40% 55% 5%
February 20-23, 2018 36% 60% 5%
January 14-18, 2018 38% 57% 5%
November 02-05, 2017 37% 57% 6%
October 12-15, 2017 37% 59% 5%
September 17-20, 2017 36% 60% 4%
August 03-06, 2017* 40% 55% 5%
April 22-25, 2017 41% 57% 2%
March 01-04, 2017 44% 55% 1%
Jan. 31-Feb. 02, 2017 42% 56% 2%
* Asked of half sample ^QUESTION WORDING for trends may reference “is handling” or “has handled” depending on the year of the poll.
1 Braxton Way Suite 125 Glen Mills, PA 19342
484-840-4300 www.ssrs.com
POLL 1 @ssrs_research | 484.840.4300 | www.ssrs.com | 10
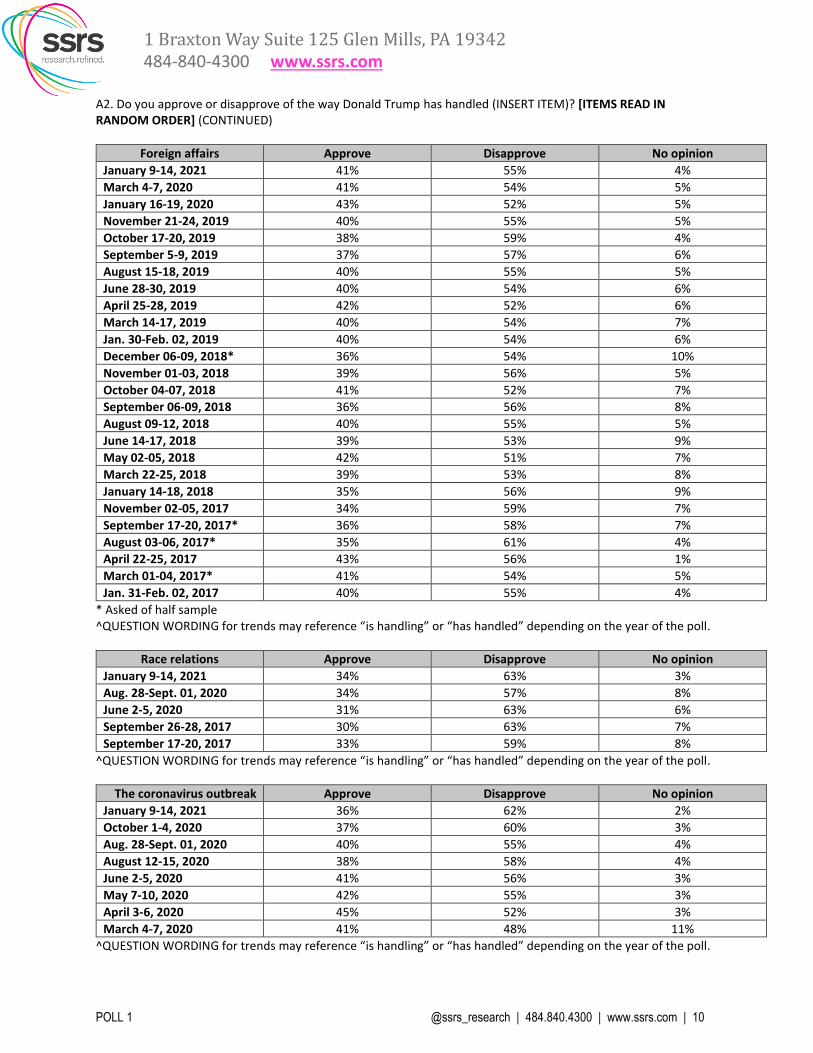
A2. Do you approve or disapprove of the way Donald Trump has handled (INSERT ITEM)? [ITEMS READ IN RANDOM ORDER] (CONTINUED)
Foreign affairs Approve Disapprove No opinion
January 9-14, 2021 41% 55% 4%
March 4-7, 2020 41% 54% 5%
January 16-19, 2020 43% 52% 5%
November 21-24, 2019 40% 55% 5%
October 17-20, 2019 38% 59% 4%
September 5-9, 2019 37% 57% 6%
August 15-18, 2019 40% 55% 5%
June 28-30, 2019 40% 54% 6%
April 25-28, 2019 42% 52% 6%
March 14-17, 2019 40% 54% 7%
Jan. 30-Feb. 02, 2019 40% 54% 6%
December 06-09, 2018* 36% 54% 10%
November 01-03, 2018 39% 56% 5%
October 04-07, 2018 41% 52% 7%
September 06-09, 2018 36% 56% 8%
August 09-12, 2018 40% 55% 5%
June 14-17, 2018 39% 53% 9%
May 02-05, 2018 42% 51% 7%
March 22-25, 2018 39% 53% 8%
January 14-18, 2018 35% 56% 9%
November 02-05, 2017 34% 59% 7%
September 17-20, 2017* 36% 58% 7%
August 03-06, 2017* 35% 61% 4%
April 22-25, 2017 43% 56% 1%
March 01-04, 2017* 41% 54% 5%
Jan. 31-Feb. 02, 2017 40% 55% 4%
* Asked of half sample ^QUESTION WORDING for trends may reference “is handling” or “has handled” depending on the year of the poll.
Race relations Approve Disapprove No opinion
January 9-14, 2021 34% 63% 3%
Aug. 28-Sept. 01, 2020 34% 57% 8%
June 2-5, 2020 31% 63% 6%
September 26-28, 2017 30% 63% 7%
September 17-20, 2017 33% 59% 8%
^QUESTION WORDING for trends may reference “is handling” or “has handled” depending on the year of the poll.
The coronavirus outbreak Approve Disapprove No opinion
January 9-14, 2021 36% 62% 2%
October 1-4, 2020 37% 60% 3%
Aug. 28-Sept. 01, 2020 40% 55% 4%
August 12-15, 2020 38% 58% 4%
June 2-5, 2020 41% 56% 3%
May 7-10, 2020 42% 55% 3%
April 3-6, 2020 45% 52% 3%
March 4-7, 2020 41% 48% 11%
^QUESTION WORDING for trends may reference “is handling” or “has handled” depending on the year of the poll.

1 Braxton Way Suite 125 Glen Mills, PA 19342
484-840-4300 www.ssrs.com
POLL 1 @ssrs_research | 484.840.4300 | www.ssrs.com | 11
Q8. Do you think that Donald Trump’s presidency has or has not created significant changes in the country?
Yes, has created changes No, has not created changes No opinion
January 9-14, 2021 85% 13% 2%
September 5-9, 2019 80% 17% 2%
Jan. 30-Feb. 02, 2019 76% 21% 3%
December 14-17, 2017 77% 21% 3%
CNN/ORC TRENDS FOR COMPARISON
Donald Trump Yes, will change No, will not change No opinion 2016 Nov 17-20* 66% 32% 2% * QUESTION WORDING: As President, do you think Donald Trump will or will not be able to change the country? Barack Obama Yes No No opinion 2015 Dec 17-21 78% 21% 1% 2009 Oct 30 - Nov 1* 69% 29% 2% 2009 Feb 7-8** 76% 23% * 2008 Nov 6-9** 73% 25% 1% *QUESTION WORDING: Do you think the election of Barack Obama has or has not created significant changes in the country? **QUESTION WORDING: As President, do you think Barack Obama will or will not be able to change the country?

1 Braxton Way Suite 125 Glen Mills, PA 19342
484-840-4300 www.ssrs.com
POLL 1 @ssrs_research | 484.840.4300 | www.ssrs.com | 12
(Respondents who think Donald Trump’s presidency has created significant changes in the country, N=857) Q8a. Do you think the country has changed for the better or changed for the worse?
Changed for the
better Changed for the
worse Changed, not better
or worse (vol.) No opinion
January 9-14, 2021 31% 65% 2% 2%
September 5-9, 2019 41% 56% 2% 2%
Jan. 30-Feb. 02, 2019 43% 49% 2% 6%
December 14-17, 2017 39% 56% 4% 1%
CNN/ORC TRENDS FOR COMPARISON
Donald Trump Change for the better
Change for the worse
Will not change No opinion
2016 Nov 17-20 43% 21% 32% 4% * QUESTION WORDING: As President, do you think Donald Trump will or will not be able to change the country? / (IF YES) Do you think the country will change for the better or change for the worse?
Barack Obama Change for the better
Change for the worse
Change, not better or worse
(vol.) No
change No opinion 2015 Dec 17-21 37% 37% 4% 21% 1% 2009 Feb 7-8** 68% 8% 0% 23% 1% 2008 Nov 6-9** 63% 9% 0% 25% 2% * QUESTION WORDING: Do you think the election of Barack Obama has or has not created significant changes in the country? / (IF YES) Do you think the country has changed for the better or changed for the worse? ** QUESTION WORDING: As President, do you think Barack Obama will or will not be able to change the country? / (IF YES) Do you think the country will change for the better or change for the worse?
Q8. Do you think that Donald Trump’s presidency has or has not created significant changes in the country? Q8a. Do you think the country has changed for the better or changed for the worse? Q8/Q8a COMBO TABLE
January 9-14, 2021 Sept. 5-9, 2019 Jan. 30-Feb. 2, 2019 Dec. 14-17, 2017
Yes, has created changes 85% 80% 76% 77%
Changed for the better 26% 33% 33% 30%
Changed for the worse 55% 45% 37% 43%
Changed, not better or worse (vol.)
2% 1% 1% 3%
No opinion 1% 1% 4% 1%
No, has not created changes 13% 17% 21% 21%
No opinion 2% 2% 3% 3%

1 Braxton Way Suite 125 Glen Mills, PA 19342
484-840-4300 www.ssrs.com
POLL 1 @ssrs_research | 484.840.4300 | www.ssrs.com | 13
Q9. Once Donald Trump has left office, would you rather see the Republican Party (continue to treat Trump as its leader) or (move on from Trump)?
Total Respondents Continue to treat Trump as
its leader Move on from Trump No opinion
January 9-14, 2021 19% 77% 4%
Republicans/Republican-leaning independents
Continue to treat Trump as its leader
Move on from Trump No opinion
January 9-14, 2021 43% 53% 5%
Q9a. How important do you think it is for the outgoing president to participate in the incoming president’s inauguration in order to have a peaceful transfer of power?
NET Important
Very important
Somewhat important
NET Not important
Not too important
Not at all important
No opinion
Jan 9-14, 2021 58% 36% 22% 40% 14% 26% 2%

1 Braxton Way Suite 125 Glen Mills, PA 19342
484-840-4300 www.ssrs.com
POLL 1 @ssrs_research | 484.840.4300 | www.ssrs.com | 14
FV1. We'd like to get your overall opinion of some people in the news. As I read each name, please say if you have a favorable or unfavorable opinion of these people - or if you have never heard of them. [ITEMS READ IN RANDOM ORDER, DEMOCRATIC PARTY AND REPUBLICAN PARTY READ IN RANDOM ORDER LAST]
(DJT) Donald Trump Favorable opinion Unfavorable opinion Never heard of (vol.) No opinion
January 9-14, 2021 33% 64% 0% 2%
October 23-26, 2020 41% 56% 1% 2%
October 1-4, 2020 39% 59% * 3%
Aug. 28-Sept. 01, 2020 40% 56% 0% 4%
August 12-15, 2020 43% 55% * 2%
May 7-10, 2020 43% 55% * 2%
March 4-7, 2020 43% 54% * 2%
December 12-15, 2019 43% 53% * 3%
October 17-20, 2019 42% 56% * 1%
June 28-30, 2019 41% 56% * 2%
May 28-31, 2019 45% 53% * 2%
April 25-28, 2019 45% 54% 0% 1%
March 14-17, 2019 41% 54% * 5%
Jan. 30-Feb. 02, 2019 42% 55% * 3%
December 06-09, 2018 40% 55% * 5%
October 04-07, 2018 41% 54% * 4%
September 06-09, 2018 36% 61% * 3%
June 14-17, 2018 40% 55% 1% 4%
May 02-05, 2018 42% 55% -- 4%
January 14-18, 2018 40% 57% * 3%
December 14-17, 2017 36% 60% * 3%
November 02-05, 2017 38% 59% * 3%
September 17-20, 2017 41% 57% * 2%
April 22-25, 2017 45% 53% * 1%
March 01-04, 2017 45% 53% * 1%
January 12-15, 2017 44% 53% * 3%
November 17-20, 2016 47% 50% 1% 2%
October 20-23, 2016 36% 61% 1% 2%
July 29-31, 2016 33% 61% * 5%
July 22-24, 2016 43% 52% 1% 4%
July 13-16, 2016 37% 59% * 4%
June 16-19, 2016 38% 60% 1% 1%
April 25-May 1, 2016 39% 57% * 3%
March 17-20, 2016 31% 67% * 2%
February 24-27, 2016 37% 60% * 2%
January 21-24, 2016 40% 55% 1% 3%
December 17-21, 2015 39% 57% 1% 2%
September 17-19, 2015 31% 59% 1% 9%
August 13-16, 2015 36% 59% 1% 3%
July 22-25, 2015 33% 58% 2% 7%
April 29-May 1, 2011 31% 64% * 4%
June 16-19, 2005 50% 38% 2% 10%
October 8-10, 1999 33% 58% 2% 7%
September 23-26, 1999 41% 47% 3% 9%

1 Braxton Way Suite 125 Glen Mills, PA 19342
484-840-4300 www.ssrs.com
POLL 1 @ssrs_research | 484.840.4300 | www.ssrs.com | 15
FV1. We'd like to get your overall opinion of some people in the news. As I read each name, please say if you have a favorable or unfavorable opinion of these people - or if you have never heard of them. [ITEMS READ IN RANDOM ORDER, DEMOCRATIC PARTY AND REPUBLICAN PARTY READ IN RANDOM ORDER LAST] (CONTINUED)
(MP) Mike Pence Favorable opinion Unfavorable
opinion Never heard of
(vol.) No opinion
January 9-14, 2021 41% 49% 4% 6%
October 1-4, 2020 38% 49% 6% 7%
Aug. 28-Sept. 01, 2020 41% 45% 7% 6%
August 12-15, 2020 41% 45% 7% 7%
March 4-7, 2020 37% 48% 8% 7%
October 17-20, 2019 38% 45% 8% 9%
Jan. 30-Feb. 02, 2019 39% 40% 12% 8%
January 14-18, 2018 40% 42% 10% 8%
November 2-5, 2017 38% 45% 9% 8%
April 22-25, 2017 46% 39% 10% 6%
March 1-4, 2017 47% 37% 10% 6%
January 12-15, 2017 40% 37% 12% 11%
November 17-20, 2016 43% 38% 12% 6%
Sept. 28-Oct. 2, 2016 (RV) 38% 30% 15% 17%
September 1-4, 2016 (RV) 43% 26% 16% 14%
July 29-31, 2016 25% 30% 28% 17%
July 22-24, 2016 34% 25% 22% 19%
July 13-16, 2016** 24% 21% 31% 24%
**WORDING: Indiana Governor Mike Pence
(MT) Melania Trump Favorable Opinion Unfavorable
Opinion Never heard of
(vol.) No opinion
January 9-14, 2021 42% 47% 2% 10%
Aug. 28-Sept. 01, 2020 44% 40% 3% 12%
October 04-07, 2018 54% 30% 3% 14%
June 14-17, 2018 51% 29% 5% 15%
May 02-05, 2018 57% 27% 2% 14%
January 14-18, 2018 47% 37% 4% 12%
November 2-5, 2017 48% 37% 2% 16%
September 17-20, 2017 44% 35% 4% 16%
April 22-25, 2017 45% 38% 3% 13%
March 1-4, 2017 52% 32% 3% 12%
January 12-15, 2017 36% 35% 5% 23%
October 20-23, 2016 39% 38% 5% 18%
July 22-24, 2016 39% 34% 6% 21%
July 13-16, 2016 25% 32% 18% 25%
June 16-19, 2016 28% 34% 17% 21%
February 24-27, 2016 24% 31% 23% 21%

1 Braxton Way Suite 125 Glen Mills, PA 19342
484-840-4300 www.ssrs.com
POLL 1 @ssrs_research | 484.840.4300 | www.ssrs.com | 16
FV1. We'd like to get your overall opinion of some people in the news. As I read each name, please say if you have a favorable or unfavorable opinion of these people - or if you have never heard of them. [ITEMS READ IN RANDOM ORDER, DEMOCRATIC PARTY AND REPUBLICAN PARTY READ IN RANDOM ORDER LAST] (CONTINUED)
(NP) Speaker of the House Nancy Pelosi
Favorable opinion Unfavorable
opinion Never heard of
(vol.) No opinion
January 9-14, 2021 44% 52% 2% 2%
December 12-15, 2019 39% 49% 5% 7%
October 17-20, 2019 44% 46% 4% 6%
May 28-31, 2019 40% 48% 6% 6%
Jan. 30-Feb. 02, 2019 42% 47% 5% 6%
December 06-09, 2018**** 34% 46% 9% 11%
May 02-05, 2018**** 30% 49% 12% 8%
Sept. 17-20, 2017**** 29% 50% 11% 9%
January 12-15, 2017**** 35% 40% 15% 10%
November 21-23, 2014*** 34% 48% 10% 8%
October 18-20, 2013*** 37% 47% 8% 9%
Sept 27-29, 2013*** 37% 51% 6% 6%
March 15-17, 2013*** 32% 50% 11% 7%
August 5-7, 2011*** 31% 51% 9% 9%
July 18-20, 2011*** 35% 52% 7% 6%
December 17-19, 2010 34% 51% 8% 7%
November 11-14, 2010 33% 52% 7% 8%
October 27-30, 2010 26% 53% 10% 11%
September 1-2, 2010 33% 51% 9% 7%
April 9-11, 2010 38% 50% 8% 5%
January 22-24, 2010 30% 50% 11% 9%
February 18-19, 2009 36% 43% 10% 11%
January 12-15, 2009 39% 37% 11% 12%
November 6-9, 2008 40% 39% 12% 8%
Aug. 23-24, 2008 (RV) 38% 37% 11% 13%
April 10-12, 2007 45% 30% 13% 11%
November 17-19, 2006** 41% 23% 21% 15%
November 3-5, 2006* 35% 24% 23% 19%
October 6-8, 2006* 35% 26% 29% 11%
*WORDING: "Democratic House Leader Nancy Pelosi" **WORDING: "Incoming Speaker of the House Nancy Pelosi" ***WORDING: "House Democratic Leader Nancy Pelosi" ****WORDING: "House Minority Leader Nancy Pelosi"
CNN/USA TODAY/GALLUP TRENDS FOR COMPARISON
Favorable
Unfavorable
Never heard of (vol.)
No opinion
2003 Jul 25-27 23% 19% 42% 16% 2003 Jan 3-5 23% 18% 39% 20% WORDING: “Democratic House Leader Nancy Pelosi”
1 Braxton Way Suite 125 Glen Mills, PA 19342
484-840-4300 www.ssrs.com
POLL 1 @ssrs_research | 484.840.4300 | www.ssrs.com | 17
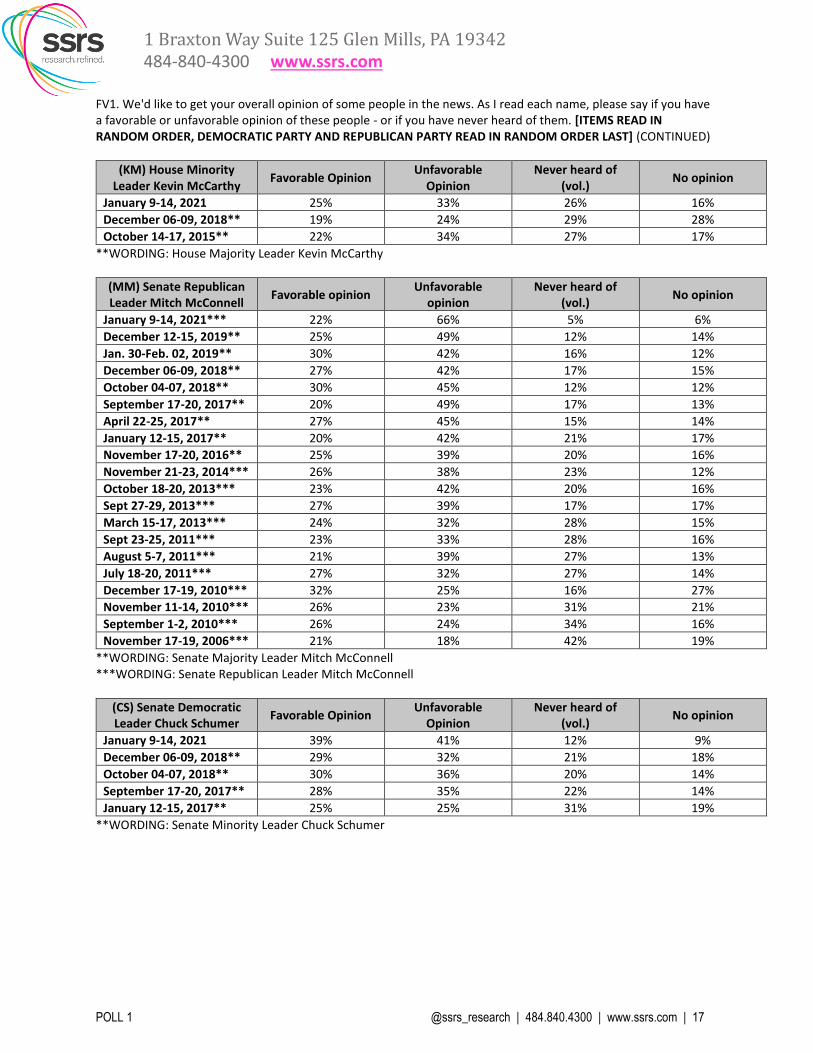
FV1. We'd like to get your overall opinion of some people in the news. As I read each name, please say if you have a favorable or unfavorable opinion of these people - or if you have never heard of them. [ITEMS READ IN RANDOM ORDER, DEMOCRATIC PARTY AND REPUBLICAN PARTY READ IN RANDOM ORDER LAST] (CONTINUED)
(KM) House Minority Leader Kevin McCarthy
Favorable Opinion Unfavorable
Opinion Never heard of
(vol.) No opinion
January 9-14, 2021 25% 33% 26% 16%
December 06-09, 2018** 19% 24% 29% 28%
October 14-17, 2015** 22% 34% 27% 17%
**WORDING: House Majority Leader Kevin McCarthy
(MM) Senate Republican Leader Mitch McConnell
Favorable opinion Unfavorable
opinion Never heard of
(vol.) No opinion
January 9-14, 2021*** 22% 66% 5% 6%
December 12-15, 2019** 25% 49% 12% 14%
Jan. 30-Feb. 02, 2019** 30% 42% 16% 12%
December 06-09, 2018** 27% 42% 17% 15%
October 04-07, 2018** 30% 45% 12% 12%
September 17-20, 2017** 20% 49% 17% 13%
April 22-25, 2017** 27% 45% 15% 14%
January 12-15, 2017** 20% 42% 21% 17%
November 17-20, 2016** 25% 39% 20% 16%
November 21-23, 2014*** 26% 38% 23% 12%
October 18-20, 2013*** 23% 42% 20% 16%
Sept 27-29, 2013*** 27% 39% 17% 17%
March 15-17, 2013*** 24% 32% 28% 15%
Sept 23-25, 2011*** 23% 33% 28% 16%
August 5-7, 2011*** 21% 39% 27% 13%
July 18-20, 2011*** 27% 32% 27% 14%
December 17-19, 2010*** 32% 25% 16% 27%
November 11-14, 2010*** 26% 23% 31% 21%
September 1-2, 2010*** 26% 24% 34% 16%
November 17-19, 2006*** 21% 18% 42% 19%
**WORDING: Senate Majority Leader Mitch McConnell ***WORDING: Senate Republican Leader Mitch McConnell
(CS) Senate Democratic Leader Chuck Schumer
Favorable Opinion Unfavorable
Opinion Never heard of
(vol.) No opinion
January 9-14, 2021 39% 41% 12% 9%
December 06-09, 2018** 29% 32% 21% 18%
October 04-07, 2018** 30% 36% 20% 14%
September 17-20, 2017** 28% 35% 22% 14%
January 12-15, 2017** 25% 25% 31% 19%
**WORDING: Senate Minority Leader Chuck Schumer

1 Braxton Way Suite 125 Glen Mills, PA 19342
484-840-4300 www.ssrs.com
POLL 1 @ssrs_research | 484.840.4300 | www.ssrs.com | 18
FV1. We'd like to get your overall opinion of some people in the news. As I read each name, please say if you have a favorable or unfavorable opinion of these people - or if you have never heard of them. [ITEMS READ IN RANDOM ORDER, DEMOCRATIC PARTY AND REPUBLICAN PARTY READ IN RANDOM ORDER LAST] (CONTINUED)
(DP) The Democratic Party Favorable opinion Unfavorable opinion Never heard of (vol.) No opinion
January 9-14, 2021 49% 45% 1% 5%
October 23-26, 2020 46% 45% 1% 8%
October 17-20, 2019 45% 48% 1% 7%
December 06-09, 2018 46% 43% 1% 10%
October 04-07, 2018 46% 45% 1% 8%
May 02-05, 2018 44% 45% * 10%
December 14-17, 2017 46% 48% * 7%
November 02-05, 2017 37% 54% 1% 8%
September 17-20, 2017 41% 51% * 5%
March 01-04, 2017 44% 51% * 5%
November 17-20, 2016 39% 54% 1% 6%
October 20-23, 2016 45% 45% 1% 9%
July 29-31, 2016 43% 47% 2% 8%
July 13-16, 2016 46% 42% 1% 11%
June 16-19, 2016 44% 48% 1% 7%
March 17-20, 2016 50% 45% * 4%
January 21-24, 2016 45% 46% 1% 8%
August 13-16, 2015 47% 48% * 5%
May 29-31, 2015 47% 45% 1% 7%
November 21-23, 2014 44% 50% 1% 5%
October 18-20, 2013 43% 51% 1% 6%
September 27-29, 2013 43% 52% * 5%
May 17-18, 2013 52% 43% 2% 4%
March 15-17, 2013 46% 48% 1% 5%
Nov. 16-18, 2012 51% 41% 1% 7%
Nov. 2-4, 2012 (RV) 52% 43% * 4%
Sept. 7-9, 2012 (RV) 52% 43% * 5%
August 22-23, 2012 (RV) 49% 45% * 6%
April 13-15, 2012 46% 46% 1% 7%
March 24-25, 2012 48% 45% 1% 6%
September 23-25, 2011 44% 48% 1% 6%
August 5-7, 2011 47% 47% * 6%
July 18-20, 2011 45% 49% 1% 5%
March 11-13, 2011 46% 48% * 7%
December 17-19, 2010 47% 47% 1% 6%
November 11-14, 2010 46% 48% 1% 5%
October 27-30, 2010 46% 47% * 7%
September 1-2, 2010 44% 49% 1% 6%
April 9-11, 2010 49% 46% 1% 5%
January 22-24, 2010 46% 46% * 8%
(FURTHER TRENDS ON NEXT PAGE)
1 Braxton Way Suite 125 Glen Mills, PA 19342
484-840-4300 www.ssrs.com
POLL 1 @ssrs_research | 484.840.4300 | www.ssrs.com | 19
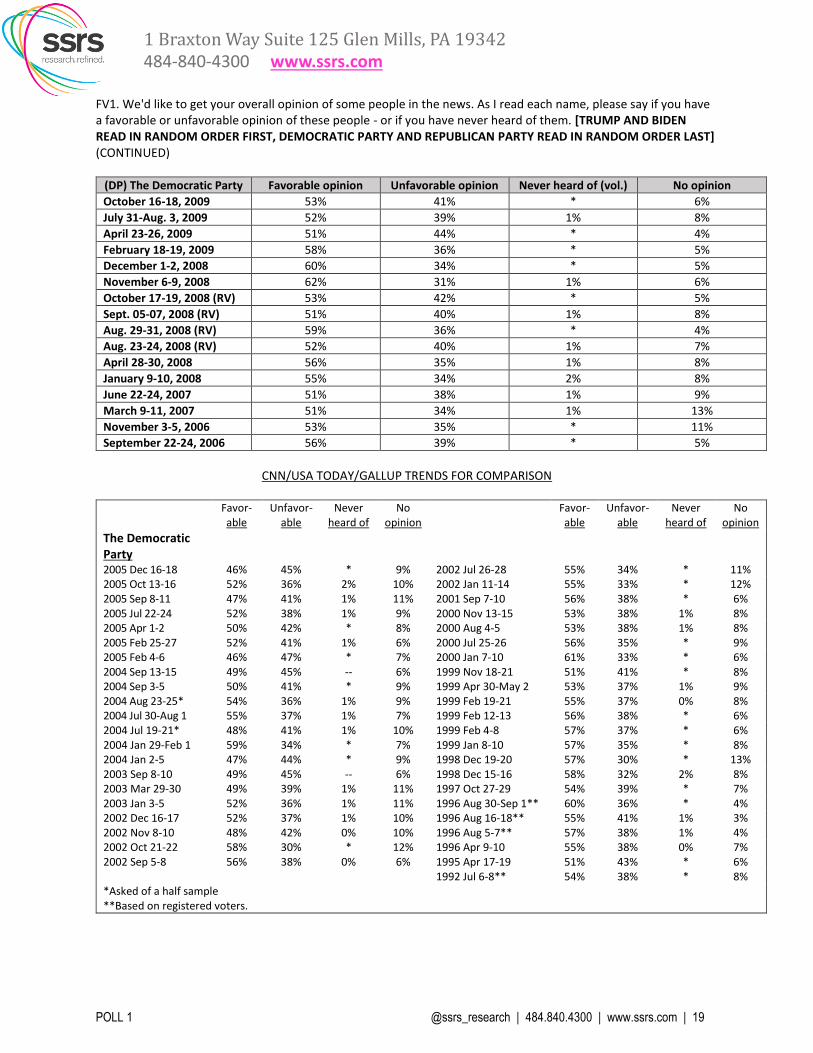
FV1. We'd like to get your overall opinion of some people in the news. As I read each name, please say if you have a favorable or unfavorable opinion of these people - or if you have never heard of them. [TRUMP AND BIDEN READ IN RANDOM ORDER FIRST, DEMOCRATIC PARTY AND REPUBLICAN PARTY READ IN RANDOM ORDER LAST] (CONTINUED)
(DP) The Democratic Party Favorable opinion Unfavorable opinion Never heard of (vol.) No opinion
October 16-18, 2009 53% 41% * 6%
July 31-Aug. 3, 2009 52% 39% 1% 8%
April 23-26, 2009 51% 44% * 4%
February 18-19, 2009 58% 36% * 5%
December 1-2, 2008 60% 34% * 5%
November 6-9, 2008 62% 31% 1% 6%
October 17-19, 2008 (RV) 53% 42% * 5%
Sept. 05-07, 2008 (RV) 51% 40% 1% 8%
Aug. 29-31, 2008 (RV) 59% 36% * 4%
Aug. 23-24, 2008 (RV) 52% 40% 1% 7%
April 28-30, 2008 56% 35% 1% 8%
January 9-10, 2008 55% 34% 2% 8%
June 22-24, 2007 51% 38% 1% 9%
March 9-11, 2007 51% 34% 1% 13%
November 3-5, 2006 53% 35% * 11%
September 22-24, 2006 56% 39% * 5%
CNN/USA TODAY/GALLUP TRENDS FOR COMPARISON
Favor-
able Unfavor-
able Never
heard of No
opinion Favor-able
Unfavor-able
Never heard of
No opinion
The Democratic Party
2005 Dec 16-18 46% 45% * 9% 2002 Jul 26-28 55% 34% * 11% 2005 Oct 13-16 52% 36% 2% 10% 2002 Jan 11-14 55% 33% * 12% 2005 Sep 8-11 47% 41% 1% 11% 2001 Sep 7-10 56% 38% * 6% 2005 Jul 22-24 52% 38% 1% 9% 2000 Nov 13-15 53% 38% 1% 8% 2005 Apr 1-2 50% 42% * 8% 2000 Aug 4-5 53% 38% 1% 8% 2005 Feb 25-27 52% 41% 1% 6% 2000 Jul 25-26 56% 35% * 9% 2005 Feb 4-6 46% 47% * 7% 2000 Jan 7-10 61% 33% * 6% 2004 Sep 13-15 49% 45% -- 6% 1999 Nov 18-21 51% 41% * 8% 2004 Sep 3-5 50% 41% * 9% 1999 Apr 30-May 2 53% 37% 1% 9% 2004 Aug 23-25* 54% 36% 1% 9% 1999 Feb 19-21 55% 37% 0% 8% 2004 Jul 30-Aug 1 55% 37% 1% 7% 1999 Feb 12-13 56% 38% * 6% 2004 Jul 19-21* 48% 41% 1% 10% 1999 Feb 4-8 57% 37% * 6% 2004 Jan 29-Feb 1 59% 34% * 7% 1999 Jan 8-10 57% 35% * 8% 2004 Jan 2-5 47% 44% * 9% 1998 Dec 19-20 57% 30% * 13% 2003 Sep 8-10 49% 45% -- 6% 1998 Dec 15-16 58% 32% 2% 8% 2003 Mar 29-30 49% 39% 1% 11% 1997 Oct 27-29 54% 39% * 7% 2003 Jan 3-5 52% 36% 1% 11% 1996 Aug 30-Sep 1** 60% 36% * 4% 2002 Dec 16-17 52% 37% 1% 10% 1996 Aug 16-18** 55% 41% 1% 3% 2002 Nov 8-10 48% 42% 0% 10% 1996 Aug 5-7** 57% 38% 1% 4% 2002 Oct 21-22 58% 30% * 12% 1996 Apr 9-10 55% 38% 0% 7% 2002 Sep 5-8 56% 38% 0% 6% 1995 Apr 17-19 51% 43% * 6% 1992 Jul 6-8** 54% 38% * 8% *Asked of a half sample **Based on registered voters.

1 Braxton Way Suite 125 Glen Mills, PA 19342
484-840-4300 www.ssrs.com
POLL 1 @ssrs_research | 484.840.4300 | www.ssrs.com | 20
FV1. We'd like to get your overall opinion of some people in the news. As I read each name, please say if you have a favorable or unfavorable opinion of these people - or if you have never heard of them. [TRUMP AND BIDEN READ IN RANDOM ORDER FIRST, DEMOCRATIC PARTY AND REPUBLICAN PARTY READ IN RANDOM ORDER LAST] (CONTINUED)
(RP) The Republican Party
Favorable opinion Unfavorable opinion Never heard of (vol.) No opinion
January 9-14, 2021 32% 62% * 5%
October 23-26, 2020 41% 50% 1% 8%
October 17-20, 2019 38% 55% 1% 6%
December 06-09, 2018 38% 51% 1% 10%
October 04-07, 2018 40% 52% 1% 8%
May 02-05, 2018 39% 52% * 9%
December 14-17, 2017 34% 59% * 7%
November 02-05, 2017 30% 61% 1% 8%
September 17-20, 2017 29% 62% 1% 5%
March 01-04, 2017 42% 53% 1% 5%
November 17-20, 2016 41% 52% 1% 6%
October 20-23, 2016 36% 53% 1% 10%
July 29-31, 2016 36% 53% 1% 10%
July 13-16, 2016 40% 49% 1% 11%
June 16-19, 2016 34% 60% 1% 6%
March 17-20, 2016 34% 61% 1% 4%
January 21-24, 2016 40% 50% 1% 9%
August 13-16, 2015 41% 54% * 5%
May 29-31, 2015 41% 49% 1% 9%
November 21-23, 2014 41% 52% 1% 5%
October 18-20, 2013 30% 64% * 6%
September 27-29, 2013 32% 62% * 5%
May 17-18, 2013 35% 59% 2% 4%
March 15-17, 2013 38% 54% 1% 7%
Nov. 16-18, 2012 38% 53% * 9%
Nov. 2-4, 2012 (RV) 45% 49% * 7%
Sept. 7-9, 2012 (RV) 38% 55% * 7%
Aug 22-23, 2012 (RV) 41% 52% * 7%
April 13-15, 2012 41% 51% * 8%
March 24-25, 2012 35% 58% 1% 6%
September 23-25, 2011 39% 54% 1% 6%
August 5-7, 2011 33% 59% 1% 7%
July 18-20, 2011 41% 55% 1% 3%
March 11-13, 2011 44% 48% * 7%
December 17-19, 2010 42% 50% * 8%
November 11-14, 2010 43% 48% 1% 8%
October 27-30, 2010 44% 43% 1% 12%
September 1-2, 2010 45% 49% 1% 6%
April 9-11, 2010 47% 47% * 6%
January 22-24, 2010 44% 45% 1% 10%
(FURTHER TRENDS ON NEXT PAGE)

1 Braxton Way Suite 125 Glen Mills, PA 19342
484-840-4300 www.ssrs.com
POLL 1 @ssrs_research | 484.840.4300 | www.ssrs.com | 21
FV1. We'd like to get your overall opinion of some people in the news. As I read each name, please say if you have a favorable or unfavorable opinion of these people - or if you have never heard of them. [TRUMP AND BIDEN READ IN RANDOM ORDER FIRST, DEMOCRATIC PARTY AND REPUBLICAN PARTY READ IN RANDOM ORDER LAST] (CONTINUED)
(RP) The Republican Party
Favorable opinion Unfavorable opinion Never heard of (vol.) No opinion
October 16-18, 2009 36% 54% 1% 8%
July 31-Aug. 3, 2009 41% 50% 1% 8%
April 23-26, 2009 39% 55% * 6%
February 18-19, 2009 39% 54% * 7%
December 1-2, 2008 41% 52% * 6%
November 6-9, 2008 38% 54% 1% 8%
Oct 17-19, 2008 (RV) 43% 51% * 6%
Sept. 05-07, 2008 (RV) 48% 45% * 6%
Aug. 29-31, 2008 (RV) 43% 50% * 6%
Aug. 23-24, 2008 (RV) 48% 46% * 6%
April 28-30, 2008 38% 53% 1% 7%
January 9-10, 2008 41% 48% 2% 10%
June 22-24, 2007 36% 53% 1% 9%
March 9-11, 2007 42% 45% 1% 12%
November 3-5, 2006 38% 52% 1% 10%
September 22-24, 2006 44% 51% * 5%
CNN/USA TODAY/GALLUP TRENDS FOR COMPARISON
Favor-able
Unfav-orable
Never heard of
No opinion
Favor-able
Unfav-orable
Never heard of
No opinion
The Republican Party
2005 Dec 16-18 45% 48% * 7% 2002 Jul 26-28 55% 36% * 9% 2005 Oct 13-16 40% 50% 2% 8% 2002 Jan 11-14 61% 30% * 9% 2005 Sep 8-11 45% 45% 1% 9% 2001 Sep 7-10 47% 48% * 5% 2005 Jul 22-24 46% 45% 1% 8% 2000 Nov 13-15 49% 43% * 8% 2005 Apr 1-2 50% 44% 1% 5% 2000 Aug 4-5 54% 37% 1% 8% 2005 Feb 25-27 51% 42% 1% 6% 2000 Jul 25-26 49% 39% * 12% 2005 Feb 4-6 56% 39% 1% 4% 2000 Jan 7-10 53% 41% * 6% 2004 Sep 13-15 55% 41% * 4% 1999 Nov 18-21 50% 44% * 6% 2004 Sep 3-5 53% 40% * 7% 1999 Apr 30-May 2 47% 44% * 9% 2004 Aug 23-25* 50% 41% 1% 8% 1999 Feb 19-21 45% 46% 0% 9% 2004 Jul 30-Aug 1 47% 45% 1% 7% 1999 Feb 12-13 40% 54% 1% 5% 2004 Jul 19-21* 50% 43% * 7% 1999 Feb 4-8 45% 47% * 8% 2004 Jan 29-Feb 1 48% 45% * 7% 1999 Jan 8-10 40% 52% * 8% 2004 Jan 2-5 52% 40% 1% 7% 1998 Dec 19-20 31% 57% * 12% 2003 Sep 8-10 50% 44% -- 6% 1998 Dec 15-16 43% 47% 2% 8% 2003 Mar 29-30 56% 33% 1% 10% 1997 Oct 27-29 50% 42% * 8% 2003 Jan 3-5 51% 38% 1% 10% 1996 Aug 30-Sep 1** 50% 45% * 5% 2002 Dec 16-17 51% 38% 1% 10% 1996 Aug 16-18** 55% 41% 1% 2% 2002 Nov 8-10 54% 38% * 8% 1996 Aug 5-7** 51% 44% * 5% 2002 Oct 21-22 53% 35% * 12% 1996 Apr 9-10 52% 41% * 7% 2002 Sep 5-8 54% 40% 0% 6% 1995 Apr 17-19 52% 42% * 6% 1992 Jul 6-8** 53% 39% * 8% *Asked of a half sample **Based on registered voters.
1 Braxton Way Suite 125 Glen Mills, PA 19342
484-840-4300 www.ssrs.com
POLL 1 @ssrs_research | 484.840.4300 | www.ssrs.com | 22
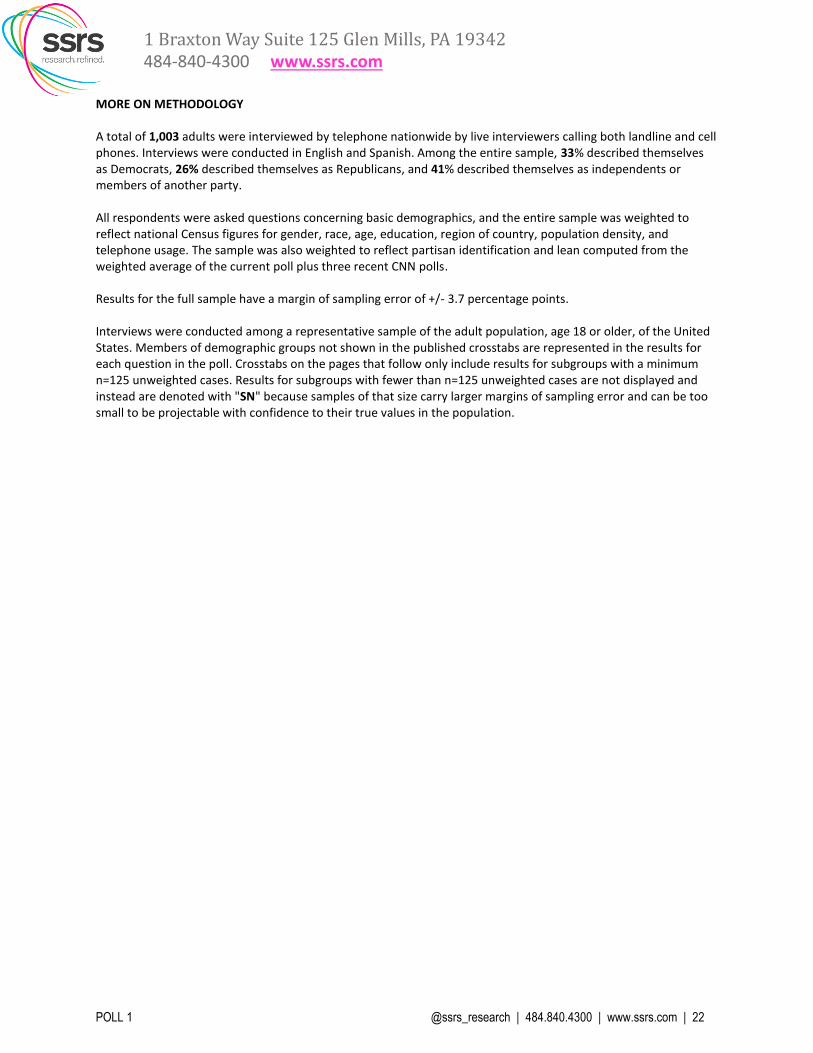
MORE ON METHODOLOGY A total of 1,003 adults were interviewed by telephone nationwide by live interviewers calling both landline and cell phones. Interviews were conducted in English and Spanish. Among the entire sample, 33% described themselves as Democrats, 26% described themselves as Republicans, and 41% described themselves as independents or members of another party. All respondents were asked questions concerning basic demographics, and the entire sample was weighted to reflect national Census figures for gender, race, age, education, region of country, population density, and telephone usage. The sample was also weighted to reflect partisan identification and lean computed from the weighted average of the current poll plus three recent CNN polls. Results for the full sample have a margin of sampling error of +/- 3.7 percentage points. Interviews were conducted among a representative sample of the adult population, age 18 or older, of the United States. Members of demographic groups not shown in the published crosstabs are represented in the results for each question in the poll. Crosstabs on the pages that follow only include results for subgroups with a minimum n=125 unweighted cases. Results for subgroups with fewer than n=125 unweighted cases are not displayed and instead are denoted with "SN" because samples of that size carry larger margins of sampling error and can be too small to be projectable with confidence to their true values in the population.

1 Braxton Way Suite 125 Glen Mills, PA 19342
484-840-4300 www.ssrs.com
POLL 1 @ssrs_research | 484.840.4300 | www.ssrs.com | 23
CNN/SSRS Poll -- January 09, 2021 to January 14, 2021
TABLE 001
Question A1
A1. Do you approve or disapprove of the way Donald Trump is handling his job as president?
Base: Total Respondents
Ppl Trump Trump
of ap- disap
Total Men Women White Color prove prove
===== ===== ===== ===== ===== ===== =====
Approve 34% 42% 26% 41% 21% 100% 0%
Disapprove 62% 52% 71% 56% 72% 0% 100%
Don't know/Undecided/Refused 4% 6% 3% 3% 7% 0% 0%
Sampling Error (+/-) 3.7 4.7 5.6 4.4 6.6 6.1 4.7
Total 18-34 35-49 50-64 65+ <45 45+
===== ===== ===== ===== ===== ===== =====
Approve 34% 33% 34% 33% 35% 33% 34%
Disapprove 62% 61% 64% 62% 61% 62% 62%
Don't know/Undecided/Refused 4% 6% 3% 5% 4% 5% 4%
Sampling Error (+/-) 3.7 7.3 8.1 7.1 6.6 5.9 4.6
Non- White White
coll. Coll. non- coll.
Total <$50K $50K+ grad grad. coll. grad.
===== ===== ===== ===== ===== ===== =====
Approve 34% 29% 37% 36% 30% 47% 31%
Disapprove 62% 65% 61% 59% 66% 51% 64%
Don't know/Undecided/Refused 4% 6% 3% 5% 4% 2% 5%
Sampling Error (+/-) 3.7 6.3 4.7 4.8 5.6 5.8 6.5
Indep Con
Demo- endnt Repub Lib- Mode- serva
Total crat Other lican eral rate tive
===== ===== ===== ===== ===== ===== =====
Approve 34% 2% 32% 80% 2% 27% 66%
Disapprove 62% 98% 61% 17% 96% 69% 27%
Don't know/Undecided/Refused 4% * 8% 4% 1% 4% 6%
Sampling Error (+/-) 3.7 6.3 5.6 7.5 7.4 5.8 6.5
Lean Lean
Demo- Repub
Total crat lican
===== ===== =====
Approve 34% 2% 77%
Disapprove 62% 96% 18%
Don't know/Undecided/Refused 4% 2% 5%
Sampling Error (+/-) 3.7 5.1 5.8

1 Braxton Way Suite 125 Glen Mills, PA 19342
484-840-4300 www.ssrs.com
POLL 1 @ssrs_research | 484.840.4300 | www.ssrs.com | 24
CNN/SSRS Poll -- January 09, 2021 to January 14, 2021
TABLE 006
Question 2
2. Thinking about the results of the 2020 presidential election, do you think that Joe Biden legitimately won
enough votes to win the presidency, or not?
Base: Total Respondents
Ppl Trump Trump
of ap- disap
Total Men Women White Color prove prove
===== ===== ===== ===== ===== ===== =====
Yes, Biden legitimately won enough votes to win
the presidency.................................... 65% 59% 71% 58% 78% 11% 95%
No, Biden did not legitimately win enough votes
to win the presidency............................. 32% 37% 27% 38% 21% 85% 4%
Don't know/Undecided/Refused 3% 4% 2% 4% 1% 4% 1%
Sampling Error (+/-) 3.7 4.7 5.6 4.4 6.6 6.1 4.7
Total 18-34 35-49 50-64 65+ <45 45+
===== ===== ===== ===== ===== ===== =====
Yes, Biden legitimately won enough votes to win
the presidency.................................... 65% 65% 67% 64% 65% 66% 65%
No, Biden did not legitimately win enough votes
to win the presidency............................. 32% 32% 31% 32% 32% 32% 32%
Don't know/Undecided/Refused 3% 3% 2% 4% 3% 3% 4%
Sampling Error (+/-) 3.7 7.3 8.1 7.1 6.6 5.9 4.6
Non- White White
coll. Coll. non- coll.
Total <$50K $50K+ grad grad. coll. grad.
===== ===== ===== ===== ===== ===== =====
Yes, Biden legitimately won enough votes to win
the presidency.................................... 65% 69% 63% 62% 71% 51% 70%
No, Biden did not legitimately win enough votes
to win the presidency............................. 32% 28% 34% 35% 27% 45% 27%
Don't know/Undecided/Refused 3% 2% 3% 3% 3% 5% 3%
Sampling Error (+/-) 3.7 6.3 4.7 4.8 5.6 5.8 6.5
Indep Con
Demo- endnt Repub Lib- Mode- serva
Total crat Other lican eral rate tive
===== ===== ===== ===== ===== ===== =====
Yes, Biden legitimately won enough votes to win
the presidency.................................... 65% 99% 66% 19% 97% 70% 34%
No, Biden did not legitimately win enough votes
to win the presidency............................. 32% 1% 31% 75% 3% 28% 60%
Don't know/Undecided/Refused 3% 0% 4% 6% * 2% 6%
Sampling Error (+/-) 3.7 6.3 5.6 7.5 7.4 5.8 6.5
Lean Lean
Demo- Repub
Total crat lican
===== ===== =====
Yes, Biden legitimately won enough votes to win
the presidency.................................... 65% 98% 22%
No, Biden did not legitimately win enough votes
to win the presidency............................. 32% 2% 71%
Don't know/Undecided/Refused 3% 0% 6%
Sampling Error (+/-) 3.7 5.1 5.8

1 Braxton Way Suite 125 Glen Mills, PA 19342
484-840-4300 www.ssrs.com
POLL 1 @ssrs_research | 484.840.4300 | www.ssrs.com | 25
CNN/SSRS Poll -- January 09, 2021 to January 14, 2021
Question 2/2a Combo Table
2. Thinking about the results of the 2020 presidential election, do you think that Joe Biden legitimately won
enough votes to win the presidency, or not? 2a. Do you think there's been solid evidence of that, or is that your
suspicion only?
Base: Total Respondents
Ppl Trump Trump
of ap- disap
Total Men Women White Color prove prove
===== ===== ===== ===== ===== ===== =====
Yes, Biden legitimately won 65% 59% 71% 58% 78% 11% 95%
No, Biden did not legitimately win enough votes
to win the presidency (Net)....................... 32% 37% 27% 38% 21% 85% 4%
Solid evidence that he did not legitimately win 23% 28% 19% 28% 15% 67% 1%
Suspicion only that he did not legitimately win 7% 8% 6% 8% 6% 16% 3%
Don't know/Undecided/Refused 1% 1% 2% 2% * 2% 1%
Don't know/Undecided/Refused 3% 4% 2% 4% 1% 4% 1%
Sampling Error (+/-) 3.7 4.7 5.6 4.4 6.6 6.1 4.7
Total 18-34 35-49 50-64 65+ <45 45+
===== ===== ===== ===== ===== ===== =====
Yes, Biden legitimately won 65% 65% 67% 64% 65% 66% 65%
No, Biden did not legitimately win enough votes
to win the presidency (Net)....................... 32% 32% 31% 32% 32% 32% 32%
Solid evidence that he did not legitimately win 23% 24% 20% 23% 25% 22% 24%
Suspicion only that he did not legitimately win 7% 7% 9% 7% 6% 8% 6%
Don't know/Undecided/Refused 1% 1% 2% 2% * 1% 1%
Don't know/Undecided/Refused 3% 3% 2% 4% 3% 3% 4%
Sampling Error (+/-) 3.7 7.3 8.1 7.1 6.6 5.9 4.6
Non- White White
coll. Coll. non- coll.
Total <$50K $50K+ grad grad. coll. grad.
===== ===== ===== ===== ===== ===== =====
Yes, Biden legitimately won 65% 69% 63% 62% 71% 51% 70%
No, Biden did not legitimately win enough votes
to win the presidency (Net)....................... 32% 28% 34% 35% 27% 45% 27%
Solid evidence that he did not legitimately win 23% 18% 26% 25% 20% 32% 21%
Suspicion only that he did not legitimately win 7% 8% 7% 8% 5% 10% 5%
Don't know/Undecided/Refused 1% 2% * 2% 1% 3% 1%
Don't know/Undecided/Refused 3% 2% 3% 3% 3% 5% 3%
Sampling Error (+/-) 3.7 6.3 4.7 4.8 5.6 5.8 6.5
Indep Con
Demo- endnt Repub Lib- Mode- serva
Total crat Other lican eral rate tive
===== ===== ===== ===== ===== ===== =====
Yes, Biden legitimately won 65% 99% 66% 19% 97% 70% 34%
No, Biden did not legitimately win enough votes
to win the presidency (Net)....................... 32% 1% 31% 75% 3% 28% 60%
Solid evidence that he did not legitimately win 23% * 20% 58% 1% 17% 49%
Suspicion only that he did not legitimately win 7% * 9% 13% 2% 8% 11%
Don't know/Undecided/Refused 1% 0% 1% 4% 0% 2% 1%
Don't know/Undecided/Refused 3% 0% 4% 6% * 2% 6%
Sampling Error (+/-) 3.7 6.3 5.6 7.5 7.4 5.8 6.5
Lean Lean
Demo- Repub
Total crat lican
===== ===== =====
Yes, Biden legitimately won 65% 98% 22%
No, Biden did not legitimately win enough votes
to win the presidency (Net)....................... 32% 2% 71%
Solid evidence that he did not legitimately win 23% 1% 54%
Suspicion only that he did not legitimately win 7% 1% 15%
Don't know/Undecided/Refused 1% 0% 3%
Don't know/Undecided/Refused 3% 0% 6%
Sampling Error (+/-) 3.7 5.1 5.8
1 Braxton Way Suite 125 Glen Mills, PA 19342
484-840-4300 www.ssrs.com
POLL 1 @ssrs_research | 484.840.4300 | www.ssrs.com | 26
CNN/SSRS Poll -- January 09, 2021 to January 14, 2021
TABLE 009
Question 3
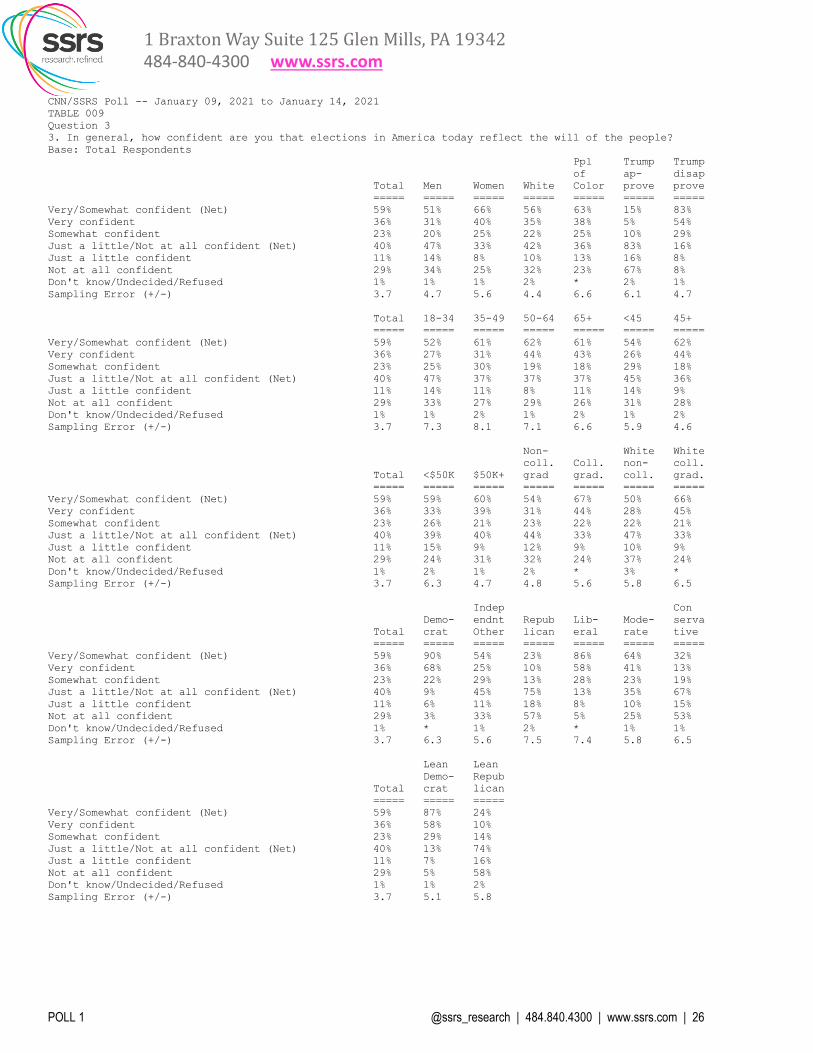
3. In general, how confident are you that elections in America today reflect the will of the people?
Base: Total Respondents
Ppl Trump Trump
of ap- disap
Total Men Women White Color prove prove
===== ===== ===== ===== ===== ===== =====
Very/Somewhat confident (Net) 59% 51% 66% 56% 63% 15% 83%
Very confident 36% 31% 40% 35% 38% 5% 54%
Somewhat confident 23% 20% 25% 22% 25% 10% 29%
Just a little/Not at all confident (Net) 40% 47% 33% 42% 36% 83% 16%
Just a little confident 11% 14% 8% 10% 13% 16% 8%
Not at all confident 29% 34% 25% 32% 23% 67% 8%
Don't know/Undecided/Refused 1% 1% 1% 2% * 2% 1%
Sampling Error (+/-) 3.7 4.7 5.6 4.4 6.6 6.1 4.7
Total 18-34 35-49 50-64 65+ <45 45+
===== ===== ===== ===== ===== ===== =====
Very/Somewhat confident (Net) 59% 52% 61% 62% 61% 54% 62%
Very confident 36% 27% 31% 44% 43% 26% 44%
Somewhat confident 23% 25% 30% 19% 18% 29% 18%
Just a little/Not at all confident (Net) 40% 47% 37% 37% 37% 45% 36%
Just a little confident 11% 14% 11% 8% 11% 14% 9%
Not at all confident 29% 33% 27% 29% 26% 31% 28%
Don't know/Undecided/Refused 1% 1% 2% 1% 2% 1% 2%
Sampling Error (+/-) 3.7 7.3 8.1 7.1 6.6 5.9 4.6
Non- White White
coll. Coll. non- coll.
Total <$50K $50K+ grad grad. coll. grad.
===== ===== ===== ===== ===== ===== =====
Very/Somewhat confident (Net) 59% 59% 60% 54% 67% 50% 66%
Very confident 36% 33% 39% 31% 44% 28% 45%
Somewhat confident 23% 26% 21% 23% 22% 22% 21%
Just a little/Not at all confident (Net) 40% 39% 40% 44% 33% 47% 33%
Just a little confident 11% 15% 9% 12% 9% 10% 9%
Not at all confident 29% 24% 31% 32% 24% 37% 24%
Don't know/Undecided/Refused 1% 2% 1% 2% * 3% *
Sampling Error (+/-) 3.7 6.3 4.7 4.8 5.6 5.8 6.5
Indep Con
Demo- endnt Repub Lib- Mode- serva
Total crat Other lican eral rate tive
===== ===== ===== ===== ===== ===== =====
Very/Somewhat confident (Net) 59% 90% 54% 23% 86% 64% 32%
Very confident 36% 68% 25% 10% 58% 41% 13%
Somewhat confident 23% 22% 29% 13% 28% 23% 19%
Just a little/Not at all confident (Net) 40% 9% 45% 75% 13% 35% 67%
Just a little confident 11% 6% 11% 18% 8% 10% 15%
Not at all confident 29% 3% 33% 57% 5% 25% 53%
Don't know/Undecided/Refused 1% * 1% 2% * 1% 1%
Sampling Error (+/-) 3.7 6.3 5.6 7.5 7.4 5.8 6.5
Lean Lean
Demo- Repub
Total crat lican
===== ===== =====
Very/Somewhat confident (Net) 59% 87% 24%
Very confident 36% 58% 10%
Somewhat confident 23% 29% 14%
Just a little/Not at all confident (Net) 40% 13% 74%
Just a little confident 11% 7% 16%
Not at all confident 29% 5% 58%
Don't know/Undecided/Refused 1% 1% 2%
Sampling Error (+/-) 3.7 5.1 5.8

1 Braxton Way Suite 125 Glen Mills, PA 19342
484-840-4300 www.ssrs.com
POLL 1 @ssrs_research | 484.840.4300 | www.ssrs.com | 27
CNN/SSRS Poll -- January 09, 2021 to January 14, 2021
TABLE 010
Question 4
4. Do you think that the storming of the U.S. Capitol on January 6 represents a crisis, a major problem, a minor
problem, or not a problem for American democracy?
Base: Total Respondents
Ppl Trump Trump
of ap- disap
Total Men Women White Color prove prove
===== ===== ===== ===== ===== ===== =====
Crisis 36% 28% 44% 38% 33% 13% 50%
Major problem 39% 38% 40% 32% 50% 29% 44%
Minor problem 14% 19% 10% 19% 6% 32% 4%
Not a problem 9% 14% 5% 10% 9% 22% 2%
Don't know/Undecided/Refused 2% 2% 1% 1% 2% 3% 1%
Sampling Error (+/-) 3.7 4.7 5.6 4.4 6.6 6.1 4.7
Total 18-34 35-49 50-64 65+ <45 45+
===== ===== ===== ===== ===== ===== =====
Crisis 36% 37% 35% 38% 34% 35% 37%
Major problem 39% 36% 41% 36% 42% 38% 39%
Minor problem 14% 15% 13% 13% 15% 15% 14%
Not a problem 9% 9% 9% 10% 8% 10% 9%
Don't know/Undecided/Refused 2% 1% 2% 2% 1% 2% 2%
Sampling Error (+/-) 3.7 7.3 8.1 7.1 6.6 5.9 4.6
Non- White White
coll. Coll. non- coll.
Total <$50K $50K+ grad grad. coll. grad.
===== ===== ===== ===== ===== ===== =====
Crisis 36% 31% 41% 29% 50% 30% 50%
Major problem 39% 47% 33% 43% 29% 37% 26%
Minor problem 14% 11% 16% 15% 14% 20% 16%
Not a problem 9% 9% 9% 11% 7% 12% 6%
Don't know/Undecided/Refused 2% 2% 1% 1% 1% 2% 1%
Sampling Error (+/-) 3.7 6.3 4.7 4.8 5.6 5.8 6.5
Indep Con
Demo- endnt Repub Lib- Mode- serva
Total crat Other lican eral rate tive
===== ===== ===== ===== ===== ===== =====
Crisis 36% 54% 31% 20% 57% 38% 17%
Major problem 39% 43% 39% 32% 38% 40% 37%
Minor problem 14% 1% 16% 30% 2% 13% 26%
Not a problem 9% 1% 13% 15% 2% 7% 18%
Don't know/Undecided/Refused 2% 1% 1% 2% 0% 2% 2%
Sampling Error (+/-) 3.7 6.3 5.6 7.5 7.4 5.8 6.5
Lean Lean
Demo- Repub
Total crat lican
===== ===== =====
Crisis 36% 50% 19%
Major problem 39% 45% 31%
Minor problem 14% 2% 31%
Not a problem 9% 2% 17%
Don't know/Undecided/Refused 2% 1% 2%
Sampling Error (+/-) 3.7 5.1 5.8

1 Braxton Way Suite 125 Glen Mills, PA 19342
484-840-4300 www.ssrs.com
POLL 1 @ssrs_research | 484.840.4300 | www.ssrs.com | 28
CNN/SSRS Poll -- January 09, 2021 to January 14, 2021
TABLE 011
Question 4a
4a. Do you think that Donald Trump should or should not be removed from office before January 20 because of his
role in the events of January 6?
Base: Total Respondents
Ppl Trump Trump
of ap- disap
Total Men Women White Color prove prove
===== ===== ===== ===== ===== ===== =====
Should be removed from office 54% 44% 65% 49% 64% 2% 85%
Should not be removed from office 43% 52% 34% 49% 32% 97% 14%
Don't know/Undecided/Refused 3% 4% 2% 2% 4% 2% 1%
Sampling Error (+/-) 3.7 4.7 5.6 4.4 6.6 6.1 4.7
Total 18-34 35-49 50-64 65+ <45 45+
===== ===== ===== ===== ===== ===== =====
Should be removed from office 54% 53% 55% 56% 53% 53% 56%
Should not be removed from office 43% 43% 43% 42% 44% 44% 42%
Don't know/Undecided/Refused 3% 4% 3% 1% 3% 4% 2%
Sampling Error (+/-) 3.7 7.3 8.1 7.1 6.6 5.9 4.6
Non- White White
coll. Coll. non- coll.
Total <$50K $50K+ grad grad. coll. grad.
===== ===== ===== ===== ===== ===== =====
Should be removed from office 54% 57% 52% 50% 60% 43% 60%
Should not be removed from office 43% 39% 46% 46% 38% 56% 38%
Don't know/Undecided/Refused 3% 4% 1% 3% 2% 2% 2%
Sampling Error (+/-) 3.7 6.3 4.7 4.8 5.6 5.8 6.5
Indep Con
Demo- endnt Repub Lib- Mode- serva
Total crat Other lican eral rate tive
===== ===== ===== ===== ===== ===== =====
Should be removed from office 54% 93% 51% 10% 92% 57% 22%
Should not be removed from office 43% 7% 45% 88% 7% 41% 73%
Don't know/Undecided/Refused 3% 1% 5% 2% 1% 2% 4%
Sampling Error (+/-) 3.7 6.3 5.6 7.5 7.4 5.8 6.5
Lean Lean
Demo- Repub
Total crat lican
===== ===== =====
Should be removed from office 54% 89% 11%
Should not be removed from office 43% 10% 87%
Don't know/Undecided/Refused 3% 1% 2%
Sampling Error (+/-) 3.7 5.1 5.8

1 Braxton Way Suite 125 Glen Mills, PA 19342
484-840-4300 www.ssrs.com
POLL 1 @ssrs_research | 484.840.4300 | www.ssrs.com | 29
CNN/SSRS Poll -- January 09, 2021 to January 14, 2021
TABLE 012
Question 5
5. Do you think enough has been done to penalize those who stormed the U.S. Capitol, or not?
Base: Total Respondents
Ppl Trump Trump
of ap- disap
Total Men Women White Color prove prove
===== ===== ===== ===== ===== ===== =====
Yes, enough has been done 23% 27% 20% 22% 25% 39% 14%
No, not enough has been done 63% 56% 69% 62% 65% 37% 79%
Don't know/Undecided/Refused 14% 17% 11% 16% 10% 24% 7%
Sampling Error (+/-) 3.7 4.7 5.6 4.4 6.6 6.1 4.7
Total 18-34 35-49 50-64 65+ <45 45+
===== ===== ===== ===== ===== ===== =====
Yes, enough has been done 23% 29% 17% 24% 21% 24% 22%
No, not enough has been done 63% 61% 65% 63% 64% 63% 63%
Don't know/Undecided/Refused 14% 10% 18% 13% 15% 12% 15%
Sampling Error (+/-) 3.7 7.3 8.1 7.1 6.6 5.9 4.6
Non- White White
coll. Coll. non- coll.
Total <$50K $50K+ grad grad. coll. grad.
===== ===== ===== ===== ===== ===== =====
Yes, enough has been done 23% 26% 22% 25% 19% 25% 17%
No, not enough has been done 63% 61% 65% 61% 69% 59% 68%
Don't know/Undecided/Refused 14% 13% 13% 15% 13% 16% 15%
Sampling Error (+/-) 3.7 6.3 4.7 4.8 5.6 5.8 6.5
Indep Con
Demo- endnt Repub Lib- Mode- serva
Total crat Other lican eral rate tive
===== ===== ===== ===== ===== ===== =====
Yes, enough has been done 23% 11% 24% 38% 10% 23% 33%
No, not enough has been done 63% 85% 60% 38% 84% 66% 45%
Don't know/Undecided/Refused 14% 4% 15% 24% 6% 11% 22%
Sampling Error (+/-) 3.7 6.3 5.6 7.5 7.4 5.8 6.5
Lean Lean
Demo- Repub
Total crat lican
===== ===== =====
Yes, enough has been done 23% 13% 38%
No, not enough has been done 63% 82% 40%
Don't know/Undecided/Refused 14% 5% 23%
Sampling Error (+/-) 3.7 5.1 5.8

1 Braxton Way Suite 125 Glen Mills, PA 19342
484-840-4300 www.ssrs.com
POLL 1 @ssrs_research | 484.840.4300 | www.ssrs.com | 30
CNN/SSRS Poll -- January 09, 2021 to January 14, 2021
TABLE 013
Question 6a
6a. Overall, how much do you blame each of the following for the storming of the U.S. Capitol on January 6?
First/Next, do you blame Donald Trump a great deal, a moderate amount, only a little, or not at all for the
storming of the U.S. Capitol on January 6?
Base: Total Respondents
Ppl Trump Trump
of ap- disap
Total Men Women White Color prove prove
===== ===== ===== ===== ===== ===== =====
Great deal/Moderate amount (Net) 65% 59% 71% 58% 78% 15% 93%
A great deal 55% 46% 63% 49% 64% 4% 85%
A moderate amount 10% 13% 8% 8% 13% 10% 8%
Only a little/Not at all (Net) 33% 39% 28% 41% 20% 85% 6%
Only a little 10% 11% 9% 12% 6% 20% 4%
Not at all 24% 28% 20% 29% 14% 65% 2%
Don't know/Undecided/Refused 2% 2% 1% 1% 2% * 1%
Sampling Error (+/-) 3.7 4.7 5.6 4.4 6.6 6.1 4.7
Total 18-34 35-49 50-64 65+ <45 45+
===== ===== ===== ===== ===== ===== =====
Great deal/Moderate amount (Net) 65% 66% 66% 64% 63% 67% 63%
A great deal 55% 51% 56% 55% 58% 53% 56%
A moderate amount 10% 15% 11% 8% 5% 14% 7%
Only a little/Not at all (Net) 33% 32% 32% 35% 35% 32% 35%
Only a little 10% 12% 6% 11% 10% 10% 10%
Not at all 24% 21% 26% 24% 25% 22% 25%
Don't know/Undecided/Refused 2% 2% 1% 1% 2% 2% 2%
Sampling Error (+/-) 3.7 7.3 8.1 7.1 6.6 5.9 4.6
Non- White White
coll. Coll. non- coll.
Total <$50K $50K+ grad grad. coll. grad.
===== ===== ===== ===== ===== ===== =====
Great deal/Moderate amount (Net) 65% 67% 64% 62% 71% 50% 69%
A great deal 55% 55% 55% 51% 61% 43% 60%
A moderate amount 10% 13% 9% 11% 9% 8% 9%
Only a little/Not at all (Net) 33% 32% 34% 36% 28% 48% 29%
Only a little 10% 11% 9% 9% 11% 12% 12%
Not at all 24% 21% 25% 27% 17% 36% 18%
Don't know/Undecided/Refused 2% 1% 1% 2% 1% 1% 2%
Sampling Error (+/-) 3.7 6.3 4.7 4.8 5.6 5.8 6.5
Indep Con
Demo- endnt Repub Lib- Mode- serva
Total crat Other lican eral rate tive
===== ===== ===== ===== ===== ===== =====
Great deal/Moderate amount (Net) 65% 96% 66% 23% 95% 73% 33%
A great deal 55% 92% 51% 13% 90% 57% 25%
A moderate amount 10% 4% 15% 9% 5% 16% 8%
Only a little/Not at all (Net) 33% 3% 32% 76% 4% 26% 65%
Only a little 10% 2% 10% 20% 2% 10% 15%
Not at all 24% 1% 22% 56% 2% 16% 50%
Don't know/Undecided/Refused 2% * 2% 2% * 1% 3%
Sampling Error (+/-) 3.7 6.3 5.6 7.5 7.4 5.8 6.5
Lean Lean
Demo- Repub
Total crat lican
===== ===== =====
Great deal/Moderate amount (Net) 65% 95% 27%
A great deal 55% 89% 14%
A moderate amount 10% 6% 13%
Only a little/Not at all (Net) 33% 4% 72%
Only a little 10% 3% 19%
Not at all 24% 1% 53%
Don't know/Undecided/Refused 2% * 1%
Sampling Error (+/-) 3.7 5.1 5.8

1 Braxton Way Suite 125 Glen Mills, PA 19342
484-840-4300 www.ssrs.com
POLL 1 @ssrs_research | 484.840.4300 | www.ssrs.com | 31
CNN/SSRS Poll -- January 09, 2021 to January 14, 2021
TABLE 014
Question 6b
6b. Overall, how much do you blame each of the following for the storming of the U.S. Capitol on January 6?
First/Next, do you blame Republicans in Congress who objected to the results of the 2020 presidential election a
great deal, a moderate amount, only a little, or not at all for the storming of the U.S. Capitol on January 6?
Base: Total Respondents
Ppl Trump Trump
of ap- disap
Total Men Women White Color prove prove
===== ===== ===== ===== ===== ===== =====
Great deal/Moderate amount (Net) 59% 53% 65% 54% 69% 22% 82%
A great deal 40% 35% 45% 36% 48% 7% 60%
A moderate amount 19% 19% 20% 18% 21% 14% 22%
Only a little/Not at all (Net) 38% 45% 32% 44% 28% 75% 17%
Only a little 12% 14% 10% 12% 12% 13% 11%
Not at all 26% 30% 22% 32% 16% 61% 6%
Don't know/Undecided/Refused 2% 2% 3% 2% 3% 4% 1%
Sampling Error (+/-) 3.7 4.7 5.6 4.4 6.6 6.1 4.7
Total 18-34 35-49 50-64 65+ <45 45+
===== ===== ===== ===== ===== ===== =====
Great deal/Moderate amount (Net) 59% 56% 64% 57% 62% 59% 59%
A great deal 40% 38% 40% 39% 45% 38% 42%
A moderate amount 19% 19% 24% 18% 17% 21% 17%
Only a little/Not at all (Net) 38% 42% 34% 39% 37% 39% 38%
Only a little 12% 19% 7% 12% 8% 14% 10%
Not at all 26% 23% 27% 27% 28% 24% 28%
Don't know/Undecided/Refused 2% 2% 2% 4% 2% 2% 3%
Sampling Error (+/-) 3.7 7.3 8.1 7.1 6.6 5.9 4.6
Non- White White
coll. Coll. non- coll.
Total <$50K $50K+ grad grad. coll. grad.
===== ===== ===== ===== ===== ===== =====
Great deal/Moderate amount (Net) 59% 61% 60% 56% 66% 48% 63%
A great deal 40% 37% 43% 36% 48% 29% 46%
A moderate amount 19% 24% 16% 20% 18% 19% 17%
Only a little/Not at all (Net) 38% 35% 39% 42% 33% 50% 35%
Only a little 12% 16% 9% 15% 8% 14% 9%
Not at all 26% 20% 30% 27% 25% 35% 27%
Don't know/Undecided/Refused 2% 4% 1% 3% 2% 2% 2%
Sampling Error (+/-) 3.7 6.3 4.7 4.8 5.6 5.8 6.5
Indep Con
Demo- endnt Repub Lib- Mode- serva
Total crat Other lican eral rate tive
===== ===== ===== ===== ===== ===== =====
Great deal/Moderate amount (Net) 59% 90% 54% 26% 88% 64% 32%
A great deal 40% 70% 32% 14% 71% 39% 18%
A moderate amount 19% 20% 22% 12% 18% 24% 14%
Only a little/Not at all (Net) 38% 9% 43% 70% 10% 34% 65%
Only a little 12% 6% 16% 14% 6% 13% 15%
Not at all 26% 3% 27% 56% 4% 21% 50%
Don't know/Undecided/Refused 2% * 3% 4% 2% 2% 2%
Sampling Error (+/-) 3.7 6.3 5.6 7.5 7.4 5.8 6.5
Lean Lean
Demo- Repub
Total crat lican
===== ===== =====
Great deal/Moderate amount (Net) 59% 86% 28%
A great deal 40% 64% 13%
A moderate amount 19% 22% 15%
Only a little/Not at all (Net) 38% 13% 69%
Only a little 12% 10% 15%
Not at all 26% 4% 54%
Don't know/Undecided/Refused 2% 1% 3%
Sampling Error (+/-) 3.7 5.1 5.8

1 Braxton Way Suite 125 Glen Mills, PA 19342
484-840-4300 www.ssrs.com
POLL 1 @ssrs_research | 484.840.4300 | www.ssrs.com | 32
CNN/SSRS Poll -- January 09, 2021 to January 14, 2021
TABLE 015
Question 6c
6c. Overall, how much do you blame each of the following for the storming of the U.S. Capitol on January 6?
First/Next, do you blame The Capitol Police a great deal, a moderate amount, only a little, or not at all for the
storming of the U.S. Capitol on January 6?
Base: Total Respondents
Ppl Trump Trump
of ap- disap
Total Men Women White Color prove prove
===== ===== ===== ===== ===== ===== =====
Great deal/Moderate amount (Net) 54% 48% 59% 52% 56% 43% 61%
A great deal 26% 25% 26% 21% 33% 24% 28%
A moderate amount 28% 23% 32% 31% 23% 20% 33%
Only a little/Not at all (Net) 43% 48% 38% 45% 40% 54% 37%
Only a little 17% 19% 15% 16% 20% 17% 18%
Not at all 26% 29% 23% 30% 20% 37% 18%
Don't know/Undecided/Refused 3% 3% 3% 3% 4% 3% 2%
Sampling Error (+/-) 3.7 4.7 5.6 4.4 6.6 6.1 4.7
Total 18-34 35-49 50-64 65+ <45 45+
===== ===== ===== ===== ===== ===== =====
Great deal/Moderate amount (Net) 54% 60% 53% 50% 50% 57% 51%
A great deal 26% 31% 22% 25% 23% 28% 24%
A moderate amount 28% 28% 31% 25% 27% 29% 27%
Only a little/Not at all (Net) 43% 38% 44% 48% 44% 41% 45%
Only a little 17% 16% 19% 19% 14% 18% 17%
Not at all 26% 22% 25% 28% 30% 23% 29%
Don't know/Undecided/Refused 3% 2% 3% 3% 6% 2% 4%
Sampling Error (+/-) 3.7 7.3 8.1 7.1 6.6 5.9 4.6
Non- White White
coll. Coll. non- coll.
Total <$50K $50K+ grad grad. coll. grad.
===== ===== ===== ===== ===== ===== =====
Great deal/Moderate amount (Net) 54% 53% 55% 52% 57% 51% 54%
A great deal 26% 29% 24% 27% 22% 23% 17%
A moderate amount 28% 25% 31% 24% 35% 28% 36%
Only a little/Not at all (Net) 43% 44% 43% 45% 40% 46% 44%
Only a little 17% 17% 18% 17% 17% 14% 18%
Not at all 26% 26% 26% 28% 23% 31% 26%
Don't know/Undecided/Refused 3% 3% 2% 3% 3% 3% 2%
Sampling Error (+/-) 3.7 6.3 4.7 4.8 5.6 5.8 6.5
Indep Con
Demo- endnt Repub Lib- Mode- serva
Total crat Other lican eral rate tive
===== ===== ===== ===== ===== ===== =====
Great deal/Moderate amount (Net) 54% 66% 54% 37% 71% 54% 42%
A great deal 26% 28% 29% 19% 28% 25% 25%
A moderate amount 28% 38% 25% 18% 43% 30% 17%
Only a little/Not at all (Net) 43% 32% 43% 60% 28% 42% 56%
Only a little 17% 21% 14% 18% 16% 19% 17%
Not at all 26% 12% 28% 42% 12% 24% 38%
Don't know/Undecided/Refused 3% 2% 4% 3% 1% 3% 3%
Sampling Error (+/-) 3.7 6.3 5.6 7.5 7.4 5.8 6.5
Lean Lean
Demo- Repub
Total crat lican
===== ===== =====
Great deal/Moderate amount (Net) 54% 64% 43%
A great deal 26% 28% 23%
A moderate amount 28% 36% 20%
Only a little/Not at all (Net) 43% 34% 55%
Only a little 17% 19% 15%
Not at all 26% 15% 39%
Don't know/Undecided/Refused 3% 2% 3%
Sampling Error (+/-) 3.7 5.1 5.8

1 Braxton Way Suite 125 Glen Mills, PA 19342
484-840-4300 www.ssrs.com
POLL 1 @ssrs_research | 484.840.4300 | www.ssrs.com | 33
CNN/SSRS Poll -- January 09, 2021 to January 14, 2021
TABLE 016
Question 6d
6d. Overall, how much do you blame each of the following for the storming of the U.S. Capitol on January 6?
First/Next, do you blame The rioters themselves a great deal, a moderate amount, only a little, or not at all for
the storming of the U.S. Capitol on January 6?
Base: Total Respondents
Ppl Trump Trump
of ap- disap
Total Men Women White Color prove prove
===== ===== ===== ===== ===== ===== =====
Great deal/Moderate amount (Net) 88% 85% 91% 90% 86% 79% 94%
A great deal 76% 71% 81% 78% 74% 61% 85%
A moderate amount 12% 14% 11% 12% 13% 18% 8%
Only a little/Not at all (Net) 10% 12% 8% 9% 11% 19% 5%
Only a little 4% 5% 4% 3% 7% 7% 3%
Not at all 5% 7% 3% 6% 4% 12% 2%
Don't know/Undecided/Refused 2% 3% 1% 2% 2% 2% 1%
Sampling Error (+/-) 3.7 4.7 5.6 4.4 6.6 6.1 4.7
Total 18-34 35-49 50-64 65+ <45 45+
===== ===== ===== ===== ===== ===== =====
Great deal/Moderate amount (Net) 88% 87% 88% 86% 92% 88% 89%
A great deal 76% 73% 77% 74% 81% 74% 78%
A moderate amount 12% 14% 11% 13% 10% 14% 11%
Only a little/Not at all (Net) 10% 12% 10% 11% 5% 11% 8%
Only a little 4% 6% 4% 6% 1% 5% 3%
Not at all 5% 6% 6% 5% 4% 6% 5%
Don't know/Undecided/Refused 2% 1% 1% 3% 3% 1% 3%
Sampling Error (+/-) 3.7 7.3 8.1 7.1 6.6 5.9 4.6
Non- White White
coll. Coll. non- coll.
Total <$50K $50K+ grad grad. coll. grad.
===== ===== ===== ===== ===== ===== =====
Great deal/Moderate amount (Net) 88% 88% 91% 86% 94% 87% 93%
A great deal 76% 74% 79% 72% 83% 74% 84%
A moderate amount 12% 14% 12% 14% 10% 14% 10%
Only a little/Not at all (Net) 10% 12% 8% 12% 5% 11% 6%
Only a little 4% 6% 3% 5% 2% 3% 3%
Not at all 5% 6% 5% 7% 2% 8% 3%
Don't know/Undecided/Refused 2% * 2% 2% 1% 2% 1%
Sampling Error (+/-) 3.7 6.3 4.7 4.8 5.6 5.8 6.5
Indep Con
Demo- endnt Repub Lib- Mode- serva
Total crat Other lican eral rate tive
===== ===== ===== ===== ===== ===== =====
Great deal/Moderate amount (Net) 88% 94% 88% 82% 97% 91% 80%
A great deal 76% 88% 71% 68% 87% 78% 64%
A moderate amount 12% 6% 17% 14% 10% 13% 16%
Only a little/Not at all (Net) 10% 5% 10% 15% 2% 8% 17%
Only a little 4% 4% 3% 6% 1% 5% 7%
Not at all 5% 1% 7% 9% 1% 4% 10%
Don't know/Undecided/Refused 2% 1% 2% 2% 1% 1% 3%
Sampling Error (+/-) 3.7 6.3 5.6 7.5 7.4 5.8 6.5
Lean Lean
Demo- Repub
Total crat lican
===== ===== =====
Great deal/Moderate amount (Net) 88% 93% 83%
A great deal 76% 85% 66%
A moderate amount 12% 8% 18%
Only a little/Not at all (Net) 10% 6% 14%
Only a little 4% 4% 5%
Not at all 5% 2% 9%
Don't know/Undecided/Refused 2% 1% 2%
Sampling Error (+/-) 3.7 5.1 5.8

1 Braxton Way Suite 125 Glen Mills, PA 19342
484-840-4300 www.ssrs.com
POLL 1 @ssrs_research | 484.840.4300 | www.ssrs.com | 34
CNN/SSRS Poll -- January 09, 2021 to January 14, 2021
TABLE 017
Question 7
7. Looking back on Donald Trump's four years in office, in general, would you say his presidency has been:
Base: Total Respondents
Ppl Trump Trump
of ap- disap
Total Men Women White Color prove prove
===== ===== ===== ===== ===== ===== =====
A success 41% 49% 33% 48% 29% 97% 9%
A failure 55% 46% 63% 50% 64% 2% 87%
Don't know/Undecided/Refused 4% 5% 4% 2% 8% 1% 4%
Sampling Error (+/-) 3.7 4.7 5.6 4.4 6.6 6.1 4.7
Total 18-34 35-49 50-64 65+ <45 45+
===== ===== ===== ===== ===== ===== =====
A success 41% 42% 37% 43% 41% 41% 41%
A failure 55% 52% 57% 55% 57% 54% 56%
Don't know/Undecided/Refused 4% 6% 6% 3% 2% 5% 3%
Sampling Error (+/-) 3.7 7.3 8.1 7.1 6.6 5.9 4.6
Non- White White
coll. Coll. non- coll.
Total <$50K $50K+ grad grad. coll. grad.
===== ===== ===== ===== ===== ===== =====
A success 41% 40% 41% 45% 35% 55% 36%
A failure 55% 56% 55% 51% 62% 44% 59%
Don't know/Undecided/Refused 4% 5% 3% 5% 3% 1% 4%
Sampling Error (+/-) 3.7 6.3 4.7 4.8 5.6 5.8 6.5
Indep Con
Demo- endnt Repub Lib- Mode- serva
Total crat Other lican eral rate tive
===== ===== ===== ===== ===== ===== =====
A success 41% 3% 44% 86% 3% 36% 77%
A failure 55% 94% 50% 11% 96% 57% 21%
Don't know/Undecided/Refused 4% 2% 6% 2% 1% 7% 3%
Sampling Error (+/-) 3.7 6.3 5.6 7.5 7.4 5.8 6.5
Lean Lean
Demo- Repub
Total crat lican
===== ===== =====
A success 41% 6% 86%
A failure 55% 91% 12%
Don't know/Undecided/Refused 4% 3% 3%
Sampling Error (+/-) 3.7 5.1 5.8

1 Braxton Way Suite 125 Glen Mills, PA 19342
484-840-4300 www.ssrs.com
POLL 1 @ssrs_research | 484.840.4300 | www.ssrs.com | 35
CNN/SSRS Poll -- January 09, 2021 to January 14, 2021
TABLE 018
Question A2a
A2a. Do you approve or disapprove of the way Donald Trump has handled The economy?
Base: Total Respondents
Ppl Trump Trump
of ap- disap
Total Men Women White Color prove prove
===== ===== ===== ===== ===== ===== =====
Approve 53% 63% 43% 60% 40% 97% 28%
Disapprove 44% 33% 54% 37% 55% 1% 68%
Don't know/Undecided/Refused 4% 4% 3% 3% 5% 1% 4%
Sampling Error (+/-) 3.7 4.7 5.6 4.4 6.6 6.1 4.7
Total 18-34 35-49 50-64 65+ <45 45+
===== ===== ===== ===== ===== ===== =====
Approve 53% 56% 47% 57% 50% 52% 53%
Disapprove 44% 40% 48% 41% 47% 43% 44%
Don't know/Undecided/Refused 4% 5% 5% 2% 3% 5% 3%
Sampling Error (+/-) 3.7 7.3 8.1 7.1 6.6 5.9 4.6
Non- White White
coll. Coll. non- coll.
Total <$50K $50K+ grad grad. coll. grad.
===== ===== ===== ===== ===== ===== =====
Approve 53% 51% 55% 56% 48% 65% 52%
Disapprove 44% 45% 42% 41% 49% 32% 45%
Don't know/Undecided/Refused 4% 5% 3% 4% 3% 2% 4%
Sampling Error (+/-) 3.7 6.3 4.7 4.8 5.6 5.8 6.5
Indep Con
Demo- endnt Repub Lib- Mode- serva
Total crat Other lican eral rate tive
===== ===== ===== ===== ===== ===== =====
Approve 53% 17% 59% 91% 16% 53% 81%
Disapprove 44% 81% 37% 6% 82% 43% 15%
Don't know/Undecided/Refused 4% 2% 4% 3% 2% 4% 3%
Sampling Error (+/-) 3.7 6.3 5.6 7.5 7.4 5.8 6.5
Lean Lean
Demo- Repub
Total crat lican
===== ===== =====
Approve 53% 22% 90%
Disapprove 44% 74% 7%
Don't know/Undecided/Refused 4% 4% 2%
Sampling Error (+/-) 3.7 5.1 5.8
1 Braxton Way Suite 125 Glen Mills, PA 19342
484-840-4300 www.ssrs.com
POLL 1 @ssrs_research | 484.840.4300 | www.ssrs.com | 36
CNN/SSRS Poll -- January 09, 2021 to January 14, 2021
TABLE 019
Question A2b
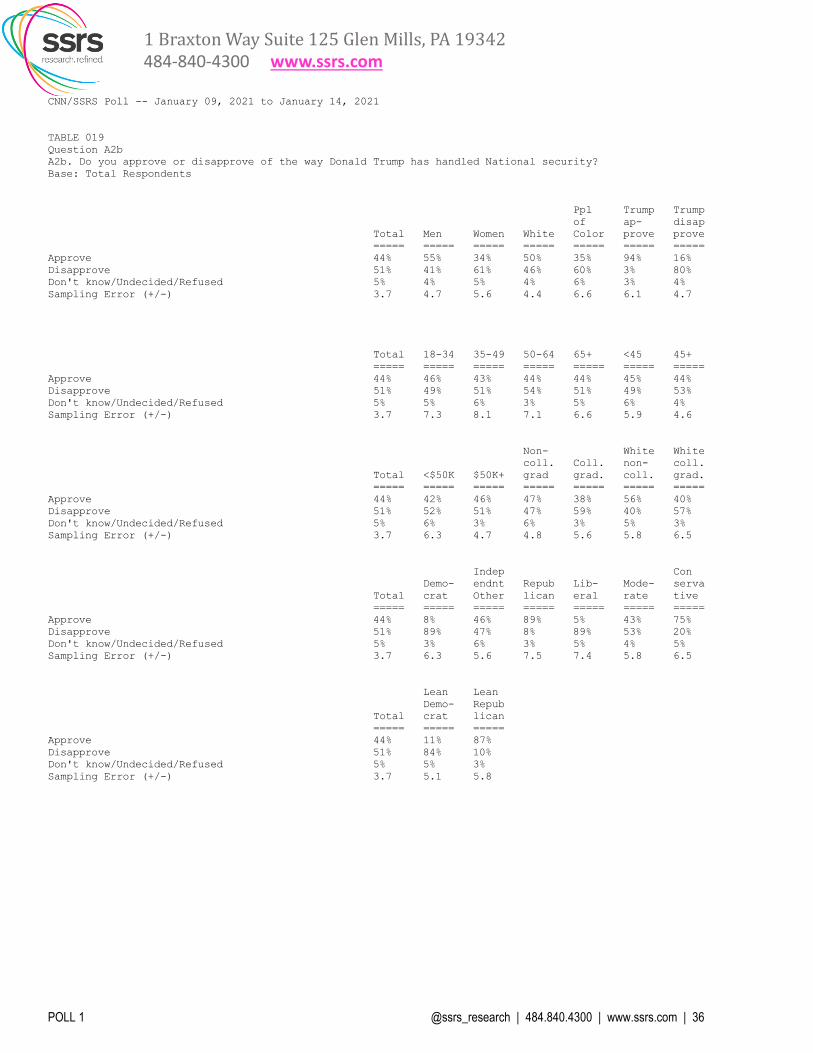
A2b. Do you approve or disapprove of the way Donald Trump has handled National security?
Base: Total Respondents
Ppl Trump Trump
of ap- disap
Total Men Women White Color prove prove
===== ===== ===== ===== ===== ===== =====
Approve 44% 55% 34% 50% 35% 94% 16%
Disapprove 51% 41% 61% 46% 60% 3% 80%
Don't know/Undecided/Refused 5% 4% 5% 4% 6% 3% 4%
Sampling Error (+/-) 3.7 4.7 5.6 4.4 6.6 6.1 4.7
Total 18-34 35-49 50-64 65+ <45 45+
===== ===== ===== ===== ===== ===== =====
Approve 44% 46% 43% 44% 44% 45% 44%
Disapprove 51% 49% 51% 54% 51% 49% 53%
Don't know/Undecided/Refused 5% 5% 6% 3% 5% 6% 4%
Sampling Error (+/-) 3.7 7.3 8.1 7.1 6.6 5.9 4.6
Non- White White
coll. Coll. non- coll.
Total <$50K $50K+ grad grad. coll. grad.
===== ===== ===== ===== ===== ===== =====
Approve 44% 42% 46% 47% 38% 56% 40%
Disapprove 51% 52% 51% 47% 59% 40% 57%
Don't know/Undecided/Refused 5% 6% 3% 6% 3% 5% 3%
Sampling Error (+/-) 3.7 6.3 4.7 4.8 5.6 5.8 6.5
Indep Con
Demo- endnt Repub Lib- Mode- serva
Total crat Other lican eral rate tive
===== ===== ===== ===== ===== ===== =====
Approve 44% 8% 46% 89% 5% 43% 75%
Disapprove 51% 89% 47% 8% 89% 53% 20%
Don't know/Undecided/Refused 5% 3% 6% 3% 5% 4% 5%
Sampling Error (+/-) 3.7 6.3 5.6 7.5 7.4 5.8 6.5
Lean Lean
Demo- Repub
Total crat lican
===== ===== =====
Approve 44% 11% 87%
Disapprove 51% 84% 10%
Don't know/Undecided/Refused 5% 5% 3%
Sampling Error (+/-) 3.7 5.1 5.8

1 Braxton Way Suite 125 Glen Mills, PA 19342
484-840-4300 www.ssrs.com
POLL 1 @ssrs_research | 484.840.4300 | www.ssrs.com | 37
CNN/SSRS Poll -- January 09, 2021 to January 14, 2021
TABLE 020
Question A2e
A2e. Do you approve or disapprove of the way Donald Trump has handled Immigration?
Base: Total Respondents
Ppl Trump Trump
of ap- disap
Total Men Women White Color prove prove
===== ===== ===== ===== ===== ===== =====
Approve 36% 46% 27% 44% 23% 91% 7%
Disapprove 61% 51% 70% 53% 74% 7% 91%
Don't know/Undecided/Refused 3% 3% 3% 3% 3% 2% 2%
Sampling Error (+/-) 3.7 4.7 5.6 4.4 6.6 6.1 4.7
Total 18-34 35-49 50-64 65+ <45 45+
===== ===== ===== ===== ===== ===== =====
Approve 36% 31% 33% 39% 44% 32% 40%
Disapprove 61% 63% 64% 60% 54% 64% 58%
Don't know/Undecided/Refused 3% 5% 3% * 2% 4% 2%
Sampling Error (+/-) 3.7 7.3 8.1 7.1 6.6 5.9 4.6
Non- White White
coll. Coll. non- coll.
Total <$50K $50K+ grad grad. coll. grad.
===== ===== ===== ===== ===== ===== =====
Approve 36% 31% 40% 39% 31% 51% 33%
Disapprove 61% 67% 58% 58% 66% 46% 65%
Don't know/Undecided/Refused 3% 2% 2% 3% 2% 3% 2%
Sampling Error (+/-) 3.7 6.3 4.7 4.8 5.6 5.8 6.5
Indep Con
Demo- endnt Repub Lib- Mode- serva
Total crat Other lican eral rate tive
===== ===== ===== ===== ===== ===== =====
Approve 36% 4% 35% 83% 4% 30% 71%
Disapprove 61% 96% 61% 13% 96% 67% 26%
Don't know/Undecided/Refused 3% * 4% 4% 1% 3% 3%
Sampling Error (+/-) 3.7 6.3 5.6 7.5 7.4 5.8 6.5
Lean Lean
Demo- Repub
Total crat lican
===== ===== =====
Approve 36% 5% 79%
Disapprove 61% 95% 18%
Don't know/Undecided/Refused 3% 1% 3%
Sampling Error (+/-) 3.7 5.1 5.8

1 Braxton Way Suite 125 Glen Mills, PA 19342
484-840-4300 www.ssrs.com
POLL 1 @ssrs_research | 484.840.4300 | www.ssrs.com | 38
CNN/SSRS Poll -- January 09, 2021 to January 14, 2021
TABLE 021
Question A2f
A2f. Do you approve or disapprove of the way Donald Trump has handled Foreign affairs?
Base: Total Respondents
Ppl Trump Trump
of ap- disap
Total Men Women White Color prove prove
===== ===== ===== ===== ===== ===== =====
Approve 41% 52% 31% 48% 29% 95% 12%
Disapprove 55% 46% 63% 49% 65% 4% 84%
Don't know/Undecided/Refused 4% 3% 6% 3% 6% 1% 4%
Sampling Error (+/-) 3.7 4.7 5.6 4.4 6.6 6.1 4.7
Total 18-34 35-49 50-64 65+ <45 45+
===== ===== ===== ===== ===== ===== =====
Approve 41% 43% 36% 42% 43% 41% 41%
Disapprove 55% 52% 61% 53% 54% 55% 54%
Don't know/Undecided/Refused 4% 5% 3% 4% 4% 4% 4%
Sampling Error (+/-) 3.7 7.3 8.1 7.1 6.6 5.9 4.6
Non- White White
coll. Coll. non- coll.
Total <$50K $50K+ grad grad. coll. grad.
===== ===== ===== ===== ===== ===== =====
Approve 41% 37% 44% 44% 37% 54% 38%
Disapprove 55% 56% 54% 52% 60% 43% 58%
Don't know/Undecided/Refused 4% 7% 2% 4% 3% 3% 4%
Sampling Error (+/-) 3.7 6.3 4.7 4.8 5.6 5.8 6.5
Indep Con
Demo- endnt Repub Lib- Mode- serva
Total crat Other lican eral rate tive
===== ===== ===== ===== ===== ===== =====
Approve 41% 6% 41% 90% 6% 37% 73%
Disapprove 55% 91% 54% 9% 91% 59% 21%
Don't know/Undecided/Refused 4% 4% 5% 2% 2% 4% 6%
Sampling Error (+/-) 3.7 6.3 5.6 7.5 7.4 5.8 6.5
Lean Lean
Demo- Repub
Total crat lican
===== ===== =====
Approve 41% 7% 86%
Disapprove 55% 89% 12%
Don't know/Undecided/Refused 4% 4% 2%
Sampling Error (+/-) 3.7 5.1 5.8

1 Braxton Way Suite 125 Glen Mills, PA 19342
484-840-4300 www.ssrs.com
POLL 1 @ssrs_research | 484.840.4300 | www.ssrs.com | 39
CNN/SSRS Poll -- January 09, 2021 to January 14, 2021
TABLE 022
Question A2o
A2o. Do you approve or disapprove of the way Donald Trump has handled Race relations?
Base: Total Respondents
Ppl Trump Trump
of ap- disap
Total Men Women White Color prove prove
===== ===== ===== ===== ===== ===== =====
Approve 34% 42% 27% 41% 22% 89% 4%
Disapprove 63% 55% 71% 57% 74% 9% 93%
Don't know/Undecided/Refused 3% 3% 3% 2% 4% 1% 2%
Sampling Error (+/-) 3.7 4.7 5.6 4.4 6.6 6.1 4.7
Total 18-34 35-49 50-64 65+ <45 45+
===== ===== ===== ===== ===== ===== =====
Approve 34% 29% 32% 38% 38% 31% 37%
Disapprove 63% 68% 65% 60% 58% 67% 59%
Don't know/Undecided/Refused 3% 3% 3% 2% 5% 2% 4%
Sampling Error (+/-) 3.7 7.3 8.1 7.1 6.6 5.9 4.6
Non- White White
coll. Coll. non- coll.
Total <$50K $50K+ grad grad. coll. grad.
===== ===== ===== ===== ===== ===== =====
Approve 34% 30% 37% 37% 28% 48% 30%
Disapprove 63% 66% 62% 59% 71% 49% 69%
Don't know/Undecided/Refused 3% 4% 1% 4% 1% 3% 1%
Sampling Error (+/-) 3.7 6.3 4.7 4.8 5.6 5.8 6.5
Indep Con
Demo- endnt Repub Lib- Mode- serva
Total crat Other lican eral rate tive
===== ===== ===== ===== ===== ===== =====
Approve 34% 2% 30% 83% 2% 27% 69%
Disapprove 63% 98% 65% 15% 96% 72% 27%
Don't know/Undecided/Refused 3% * 5% 3% 2% 2% 4%
Sampling Error (+/-) 3.7 6.3 5.6 7.5 7.4 5.8 6.5
Lean Lean
Demo- Repub
Total crat lican
===== ===== =====
Approve 34% 3% 76%
Disapprove 63% 97% 21%
Don't know/Undecided/Refused 3% 1% 3%
Sampling Error (+/-) 3.7 5.1 5.8

1 Braxton Way Suite 125 Glen Mills, PA 19342
484-840-4300 www.ssrs.com
POLL 1 @ssrs_research | 484.840.4300 | www.ssrs.com | 40
CNN/SSRS Poll -- January 09, 2021 to January 14, 2021
TABLE 023
Question A2y
A2y. Do you approve or disapprove of the way Donald Trump has handled The coronavirus outbreak?
Base: Total Respondents
Ppl Trump Trump
of ap- disap
Total Men Women White Color prove prove
===== ===== ===== ===== ===== ===== =====
Approve 36% 41% 31% 42% 25% 85% 8%
Disapprove 62% 56% 67% 56% 72% 12% 91%
Don't know/Undecided/Refused 2% 4% 1% 2% 3% 3% 1%
Sampling Error (+/-) 3.7 4.7 5.6 4.4 6.6 6.1 4.7
Total 18-34 35-49 50-64 65+ <45 45+
===== ===== ===== ===== ===== ===== =====
Approve 36% 35% 33% 36% 39% 35% 36%
Disapprove 62% 61% 64% 62% 59% 62% 61%
Don't know/Undecided/Refused 2% 3% 2% 2% 2% 2% 3%
Sampling Error (+/-) 3.7 7.3 8.1 7.1 6.6 5.9 4.6
Non- White White
coll. Coll. non- coll.
Total <$50K $50K+ grad grad. coll. grad.
===== ===== ===== ===== ===== ===== =====
Approve 36% 35% 36% 39% 30% 48% 31%
Disapprove 62% 63% 62% 58% 69% 50% 67%
Don't know/Undecided/Refused 2% 2% 2% 3% 2% 2% 2%
Sampling Error (+/-) 3.7 6.3 4.7 4.8 5.6 5.8 6.5
Indep Con
Demo- endnt Repub Lib- Mode- serva
Total crat Other lican eral rate tive
===== ===== ===== ===== ===== ===== =====
Approve 36% 4% 35% 79% 6% 29% 68%
Disapprove 62% 95% 62% 18% 94% 68% 29%
Don't know/Undecided/Refused 2% * 3% 3% * 3% 3%
Sampling Error (+/-) 3.7 6.3 5.6 7.5 7.4 5.8 6.5
Lean Lean
Demo- Repub
Total crat lican
===== ===== =====
Approve 36% 6% 75%
Disapprove 62% 93% 22%
Don't know/Undecided/Refused 2% 1% 2%
Sampling Error (+/-) 3.7 5.1 5.8

1 Braxton Way Suite 125 Glen Mills, PA 19342
484-840-4300 www.ssrs.com
POLL 1 @ssrs_research | 484.840.4300 | www.ssrs.com | 41
CNN/SSRS Poll -- January 09, 2021 to January 14, 2021
TABLE 024
Question 8
8. Do you think that Donald Trump's presidency has or has not created significant changes in the country?
Base: Total Respondents
Ppl Trump Trump
of ap- disap
Total Men Women White Color prove prove
===== ===== ===== ===== ===== ===== =====
Yes, has created changes 85% 85% 85% 88% 80% 90% 83%
No, has not created changes 13% 13% 14% 10% 19% 9% 15%
Don't know/Undecided/Refused 2% 2% 2% 2% 1% 1% 2%
Sampling Error (+/-) 3.7 4.7 5.6 4.4 6.6 6.1 4.7
Total 18-34 35-49 50-64 65+ <45 45+
===== ===== ===== ===== ===== ===== =====
Yes, has created changes 85% 89% 83% 81% 86% 86% 84%
No, has not created changes 13% 9% 15% 18% 12% 12% 14%
Don't know/Undecided/Refused 2% 2% 1% 2% 2% 2% 2%
Sampling Error (+/-) 3.7 7.3 8.1 7.1 6.6 5.9 4.6
Non- White White
coll. Coll. non- coll.
Total <$50K $50K+ grad grad. coll. grad.
===== ===== ===== ===== ===== ===== =====
Yes, has created changes 85% 83% 86% 86% 84% 90% 85%
No, has not created changes 13% 16% 11% 13% 13% 8% 12%
Don't know/Undecided/Refused 2% 1% 3% 1% 3% 2% 3%
Sampling Error (+/-) 3.7 6.3 4.7 4.8 5.6 5.8 6.5
Indep Con
Demo- endnt Repub Lib- Mode- serva
Total crat Other lican eral rate tive
===== ===== ===== ===== ===== ===== =====
Yes, has created changes 85% 86% 83% 86% 84% 85% 86%
No, has not created changes 13% 12% 15% 11% 15% 14% 12%
Don't know/Undecided/Refused 2% 1% 1% 3% 1% 2% 2%
Sampling Error (+/-) 3.7 6.3 5.6 7.5 7.4 5.8 6.5
Lean Lean
Demo- Repub
Total crat lican
===== ===== =====
Yes, has created changes 85% 85% 86%
No, has not created changes 13% 13% 12%
Don't know/Undecided/Refused 2% 2% 3%
Sampling Error (+/-) 3.7 5.1 5.8

1 Braxton Way Suite 125 Glen Mills, PA 19342
484-840-4300 www.ssrs.com
POLL 1 @ssrs_research | 484.840.4300 | www.ssrs.com | 42
CNN/SSRS Poll -- January 09, 2021 to January 14, 2021
TABLE 026
Question 8/8a Combo Table
8. Do you think that Donald Trump's presidency has or has not created significant changes in the country?
8a. Do you think the country has changed for the better or changed for the worse?
Base: Total Respondents
Ppl Trump Trump
of ap- disap
Total Men Women White Color prove prove
===== ===== ===== ===== ===== ===== =====
Yes, has created changes (Net) 85% 85% 85% 88% 80% 90% 83%
Changed for the better 26% 33% 20% 31% 18% 67% 5%
Changed for the worse 55% 47% 63% 54% 58% 19% 77%
Changed, not better or worse 2% 3% 1% 1% 3% 2% 1%
Don't know/Undecided/Refused 1% 2% 1% 2% 1% 2% *
No, has not created changes 13% 13% 14% 10% 19% 9% 15%
Don't know/Undecided/Refused 2% 2% 2% 2% 1% 1% 2%
Sampling Error (+/-) 3.7 4.7 5.6 4.4 6.6 6.1 4.7
Total 18-34 35-49 50-64 65+ <45 45+
===== ===== ===== ===== ===== ===== =====
Yes, has created changes (Net) 85% 89% 83% 81% 86% 86% 84%
Changed for the better 26% 25% 22% 30% 28% 23% 29%
Changed for the worse 55% 59% 58% 48% 55% 58% 52%
Changed, not better or worse 2% 4% 2% 1% 1% 3% 1%
Don't know/Undecided/Refused 1% 1% 2% 1% 2% 1% 2%
No, has not created changes 13% 9% 15% 18% 12% 12% 14%
Don't know/Undecided/Refused 2% 2% 1% 2% 2% 2% 2%
Sampling Error (+/-) 3.7 7.3 8.1 7.1 6.6 5.9 4.6
Non- White White
coll. Coll. non- coll.
Total <$50K $50K+ grad grad. coll. grad.
===== ===== ===== ===== ===== ===== =====
Yes, has created changes (Net) 85% 83% 86% 86% 84% 90% 85%
Changed for the better 26% 26% 26% 29% 21% 36% 23%
Changed for the worse 55% 54% 57% 53% 60% 51% 59%
Changed, not better or worse 2% 2% 1% 2% 1% 1% 1%
Don't know/Undecided/Refused 1% 1% 2% 1% 2% 1% 2%
No, has not created changes 13% 16% 11% 13% 13% 8% 12%
Don't know/Undecided/Refused 2% 1% 3% 1% 3% 2% 3%
Sampling Error (+/-) 3.7 6.3 4.7 4.8 5.6 5.8 6.5
Indep Con
Demo- endnt Repub Lib- Mode- serva
Total crat Other lican eral rate tive
===== ===== ===== ===== ===== ===== =====
Yes, has created changes (Net) 85% 86% 83% 86% 84% 85% 86%
Changed for the better 26% 3% 26% 59% 3% 19% 54%
Changed for the worse 55% 82% 53% 24% 79% 61% 30%
Changed, not better or worse 2% 1% 2% 1% 2% 2% *
Don't know/Undecided/Refused 1% 0% 2% 2% * 2% 2%
No, has not created changes 13% 12% 15% 11% 15% 14% 12%
Don't know/Undecided/Refused 2% 1% 1% 3% 1% 2% 2%
Sampling Error (+/-) 3.7 6.3 5.6 7.5 7.4 5.8 6.5
Lean Lean
Demo- Repub
Total crat lican
===== ===== =====
Yes, has created changes (Net) 85% 85% 86%
Changed for the better 26% 4% 56%
Changed for the worse 55% 80% 26%
Changed, not better or worse 2% 2% 1%
Don't know/Undecided/Refused 1% * 3%
No, has not created changes 13% 13% 12%
Don't know/Undecided/Refused 2% 2% 3%
Sampling Error (+/-) 3.7 5.1 5.8
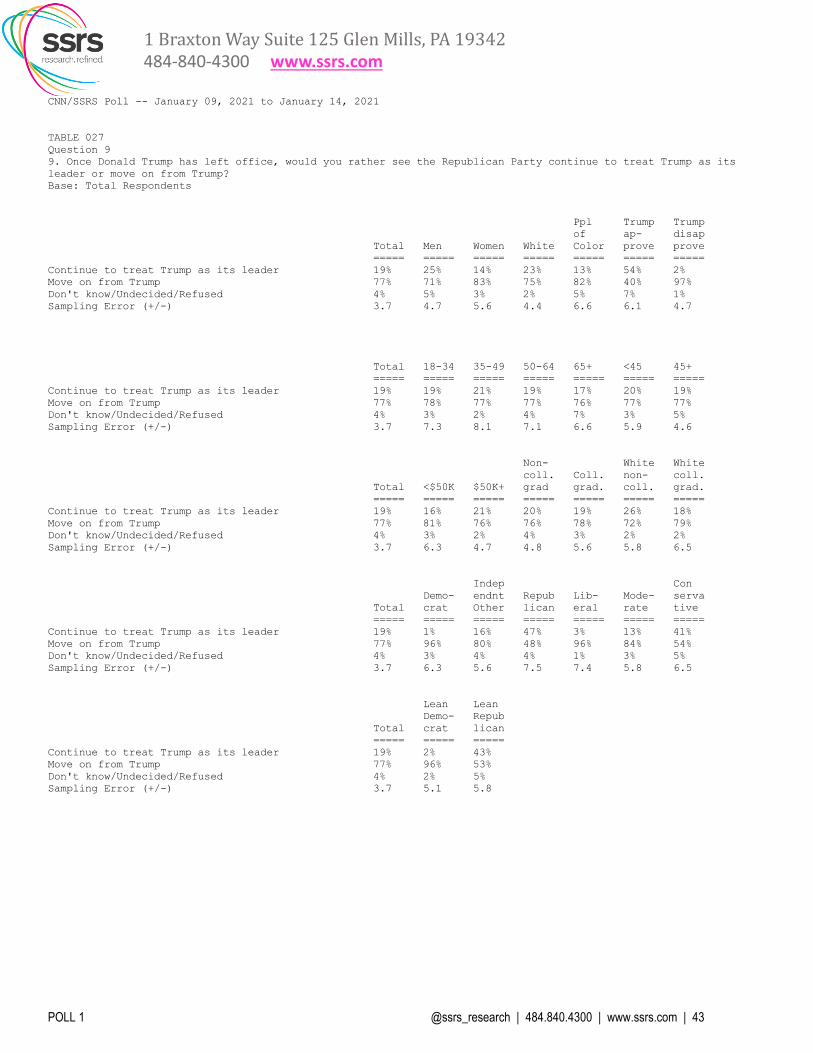
1 Braxton Way Suite 125 Glen Mills, PA 19342
484-840-4300 www.ssrs.com
POLL 1 @ssrs_research | 484.840.4300 | www.ssrs.com | 43
CNN/SSRS Poll -- January 09, 2021 to January 14, 2021
TABLE 027
Question 9
9. Once Donald Trump has left office, would you rather see the Republican Party continue to treat Trump as its
leader or move on from Trump?
Base: Total Respondents
Ppl Trump Trump
of ap- disap
Total Men Women White Color prove prove
===== ===== ===== ===== ===== ===== =====
Continue to treat Trump as its leader 19% 25% 14% 23% 13% 54% 2%
Move on from Trump 77% 71% 83% 75% 82% 40% 97%
Don't know/Undecided/Refused 4% 5% 3% 2% 5% 7% 1%
Sampling Error (+/-) 3.7 4.7 5.6 4.4 6.6 6.1 4.7
Total 18-34 35-49 50-64 65+ <45 45+
===== ===== ===== ===== ===== ===== =====
Continue to treat Trump as its leader 19% 19% 21% 19% 17% 20% 19%
Move on from Trump 77% 78% 77% 77% 76% 77% 77%
Don't know/Undecided/Refused 4% 3% 2% 4% 7% 3% 5%
Sampling Error (+/-) 3.7 7.3 8.1 7.1 6.6 5.9 4.6
Non- White White
coll. Coll. non- coll.
Total <$50K $50K+ grad grad. coll. grad.
===== ===== ===== ===== ===== ===== =====
Continue to treat Trump as its leader 19% 16% 21% 20% 19% 26% 18%
Move on from Trump 77% 81% 76% 76% 78% 72% 79%
Don't know/Undecided/Refused 4% 3% 2% 4% 3% 2% 2%
Sampling Error (+/-) 3.7 6.3 4.7 4.8 5.6 5.8 6.5
Indep Con
Demo- endnt Repub Lib- Mode- serva
Total crat Other lican eral rate tive
===== ===== ===== ===== ===== ===== =====
Continue to treat Trump as its leader 19% 1% 16% 47% 3% 13% 41%
Move on from Trump 77% 96% 80% 48% 96% 84% 54%
Don't know/Undecided/Refused 4% 3% 4% 4% 1% 3% 5%
Sampling Error (+/-) 3.7 6.3 5.6 7.5 7.4 5.8 6.5
Lean Lean
Demo- Repub
Total crat lican
===== ===== =====
Continue to treat Trump as its leader 19% 2% 43%
Move on from Trump 77% 96% 53%
Don't know/Undecided/Refused 4% 2% 5%
Sampling Error (+/-) 3.7 5.1 5.8

1 Braxton Way Suite 125 Glen Mills, PA 19342
484-840-4300 www.ssrs.com
POLL 1 @ssrs_research | 484.840.4300 | www.ssrs.com | 44
CNN/SSRS Poll -- January 09, 2021 to January 14, 2021
TABLE 035
Question FV1_DJT
FV1_DJT. We'd like to get your overall opinion of some people in the news. As I read each name, please say if you
have a favorable or unfavorable opinion of these people - or if you have never heard of them. Do you have a
favorable or unfavorable opinion of Donald Trump, or have you never heard of them?
Base: Total Respondents
Ppl Trump Trump
of ap- disap
Total Men Women White Color prove prove
===== ===== ===== ===== ===== ===== =====
Favorable Opinion 33% 41% 26% 40% 22% 92% 2%
Unfavorable Opinion 64% 57% 72% 59% 75% 8% 96%
Never heard of 0% 0% 0% 0% 0% 0% 0%
No opinion (Net) 2% 3% 2% 2% 3% * 2%
Heard of, no opinion 1% 1% 2% 1% 2% 0% 1%
Undecided/Refused 1% 2% 1% 1% 2% * 1%
Sampling Error (+/-) 3.7 4.7 5.6 4.4 6.6 6.1 4.7
Total 18-34 35-49 50-64 65+ <45 45+
===== ===== ===== ===== ===== ===== =====
Favorable Opinion 33% 32% 32% 33% 35% 33% 34%
Unfavorable Opinion 64% 65% 67% 64% 62% 65% 64%
Never heard of 0% 0% 0% 0% 0% 0% 0%
No opinion (Net) 2% 3% 1% 2% 3% 2% 2%
Heard of, no opinion 1% 2% 0% 1% 2% 1% 2%
Undecided/Refused 1% 1% 1% 1% 1% 1% 1%
Sampling Error (+/-) 3.7 7.3 8.1 7.1 6.6 5.9 4.6
Non- White White
coll. Coll. non- coll.
Total <$50K $50K+ grad grad. coll. grad.
===== ===== ===== ===== ===== ===== =====
Favorable Opinion 33% 31% 35% 36% 30% 45% 30%
Unfavorable Opinion 64% 67% 64% 61% 70% 52% 69%
Never heard of 0% 0% 0% 0% 0% 0% 0%
No opinion (Net) 2% 2% 1% 3% 1% 2% 1%
Heard of, no opinion 1% 1% * 2% 1% 1% 1%
Undecided/Refused 1% 1% 1% 2% * 1% 0%
Sampling Error (+/-) 3.7 6.3 4.7 4.8 5.6 5.8 6.5
Indep Con
Demo- endnt Repub Lib- Mode- serva
Total crat Other lican eral rate tive
===== ===== ===== ===== ===== ===== =====
Favorable Opinion 33% 1% 31% 79% 1% 27% 66%
Unfavorable Opinion 64% 98% 67% 18% 98% 71% 30%
Never heard of 0% 0% 0% 0% 0% 0% 0%
No opinion (Net) 2% 1% 2% 3% * 2% 3%
Heard of, no opinion 1% 0% 2% 2% 0% 1% 3%
Undecided/Refused 1% 1% 1% 1% * 1% 1%
Sampling Error (+/-) 3.7 6.3 5.6 7.5 7.4 5.8 6.5
Lean Lean
Demo- Repub
Total crat lican
===== ===== =====
Favorable Opinion 33% 2% 75%
Unfavorable Opinion 64% 96% 23%
Never heard of 0% 0% 0%
No opinion (Net) 2% 1% 2%
Heard of, no opinion 1% * 2%
Undecided/Refused 1% 1% 1%
Sampling Error (+/-) 3.7 5.1 5.8

1 Braxton Way Suite 125 Glen Mills, PA 19342
484-840-4300 www.ssrs.com
POLL 1 @ssrs_research | 484.840.4300 | www.ssrs.com | 45
CNN/SSRS Poll -- January 09, 2021 to January 14, 2021
TABLE 037
Question FV1_MP
FV1_MP. We'd like to get your overall opinion of some people in the news. As I read each name, please say if you
have a favorable or unfavorable opinion of these people - or if you have never heard of them. Do you have a
favorable or unfavorable opinion of Mike Pence, or have you never heard of them?
Base: Total Respondents
Ppl Trump Trump
of ap- disap
Total Men Women White Color prove prove
===== ===== ===== ===== ===== ===== =====
Favorable Opinion 41% 46% 37% 47% 32% 68% 26%
Unfavorable Opinion 49% 44% 54% 47% 53% 23% 66%
Never heard of 4% 4% 4% 2% 8% 3% 3%
No opinion (Net) 6% 7% 5% 4% 8% 5% 5%
Heard of, no opinion 4% 5% 3% 3% 5% 3% 3%
Undecided/Refused 2% 2% 2% 1% 3% 3% 2%
Sampling Error (+/-) 3.7 4.7 5.6 4.4 6.6 6.1 4.7
Total 18-34 35-49 50-64 65+ <45 45+
===== ===== ===== ===== ===== ===== =====
Favorable Opinion 41% 29% 40% 49% 50% 30% 50%
Unfavorable Opinion 49% 58% 53% 44% 40% 58% 41%
Never heard of 4% 6% 3% 4% 3% 5% 3%
No opinion (Net) 6% 8% 4% 4% 7% 6% 6%
Heard of, no opinion 4% 5% 3% 2% 5% 3% 4%
Undecided/Refused 2% 3% 1% 2% 2% 2% 2%
Sampling Error (+/-) 3.7 7.3 8.1 7.1 6.6 5.9 4.6
Non- White White
coll. Coll. non- coll.
Total <$50K $50K+ grad grad. coll. grad.
===== ===== ===== ===== ===== ===== =====
Favorable Opinion 41% 38% 43% 43% 38% 50% 41%
Unfavorable Opinion 49% 47% 52% 45% 56% 43% 54%
Never heard of 4% 8% 1% 5% 1% 3% *
No opinion (Net) 6% 7% 4% 6% 5% 4% 5%
Heard of, no opinion 4% 4% 3% 4% 3% 3% 4%
Undecided/Refused 2% 3% 1% 3% 2% 2% 1%
Sampling Error (+/-) 3.7 6.3 4.7 4.8 5.6 5.8 6.5
Indep Con
Demo- endnt Repub Lib- Mode- serva
Total crat Other lican eral rate tive
===== ===== ===== ===== ===== ===== =====
Favorable Opinion 41% 19% 40% 72% 14% 40% 65%
Unfavorable Opinion 49% 76% 46% 19% 79% 52% 23%
Never heard of 4% 3% 5% 3% 4% 3% 5%
No opinion (Net) 6% 2% 8% 5% 3% 5% 7%
Heard of, no opinion 4% 1% 5% 4% 2% 3% 5%
Undecided/Refused 2% 1% 3% 2% 1% 2% 2%
Sampling Error (+/-) 3.7 6.3 5.6 7.5 7.4 5.8 6.5
Lean Lean
Demo- Repub
Total crat lican
===== ===== =====
Favorable Opinion 41% 21% 69%
Unfavorable Opinion 49% 70% 23%
Never heard of 4% 4% 3%
No opinion (Net) 6% 5% 5%
Heard of, no opinion 4% 3% 3%
Undecided/Refused 2% 1% 2%
Sampling Error (+/-) 3.7 5.1 5.8
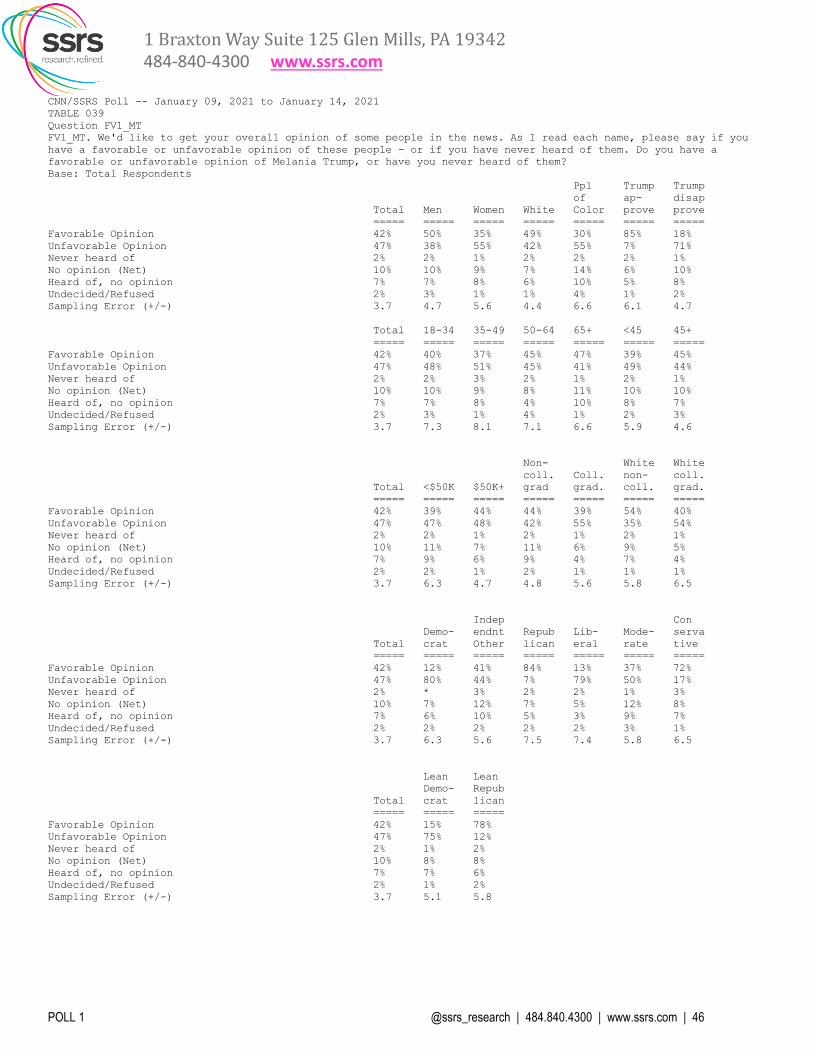
1 Braxton Way Suite 125 Glen Mills, PA 19342
484-840-4300 www.ssrs.com
POLL 1 @ssrs_research | 484.840.4300 | www.ssrs.com | 46
CNN/SSRS Poll -- January 09, 2021 to January 14, 2021
TABLE 039
Question FV1_MT
FV1_MT. We'd like to get your overall opinion of some people in the news. As I read each name, please say if you
have a favorable or unfavorable opinion of these people - or if you have never heard of them. Do you have a
favorable or unfavorable opinion of Melania Trump, or have you never heard of them?
Base: Total Respondents
Ppl Trump Trump
of ap- disap
Total Men Women White Color prove prove
===== ===== ===== ===== ===== ===== =====
Favorable Opinion 42% 50% 35% 49% 30% 85% 18%
Unfavorable Opinion 47% 38% 55% 42% 55% 7% 71%
Never heard of 2% 2% 1% 2% 2% 2% 1%
No opinion (Net) 10% 10% 9% 7% 14% 6% 10%
Heard of, no opinion 7% 7% 8% 6% 10% 5% 8%
Undecided/Refused 2% 3% 1% 1% 4% 1% 2%
Sampling Error (+/-) 3.7 4.7 5.6 4.4 6.6 6.1 4.7
Total 18-34 35-49 50-64 65+ <45 45+
===== ===== ===== ===== ===== ===== =====
Favorable Opinion 42% 40% 37% 45% 47% 39% 45%
Unfavorable Opinion 47% 48% 51% 45% 41% 49% 44%
Never heard of 2% 2% 3% 2% 1% 2% 1%
No opinion (Net) 10% 10% 9% 8% 11% 10% 10%
Heard of, no opinion 7% 7% 8% 4% 10% 8% 7%
Undecided/Refused 2% 3% 1% 4% 1% 2% 3%
Sampling Error (+/-) 3.7 7.3 8.1 7.1 6.6 5.9 4.6
Non- White White
coll. Coll. non- coll.
Total <$50K $50K+ grad grad. coll. grad.
===== ===== ===== ===== ===== ===== =====
Favorable Opinion 42% 39% 44% 44% 39% 54% 40%
Unfavorable Opinion 47% 47% 48% 42% 55% 35% 54%
Never heard of 2% 2% 1% 2% 1% 2% 1%
No opinion (Net) 10% 11% 7% 11% 6% 9% 5%
Heard of, no opinion 7% 9% 6% 9% 4% 7% 4%
Undecided/Refused 2% 2% 1% 2% 1% 1% 1%
Sampling Error (+/-) 3.7 6.3 4.7 4.8 5.6 5.8 6.5
Indep Con
Demo- endnt Repub Lib- Mode- serva
Total crat Other lican eral rate tive
===== ===== ===== ===== ===== ===== =====
Favorable Opinion 42% 12% 41% 84% 13% 37% 72%
Unfavorable Opinion 47% 80% 44% 7% 79% 50% 17%
Never heard of 2% * 3% 2% 2% 1% 3%
No opinion (Net) 10% 7% 12% 7% 5% 12% 8%
Heard of, no opinion 7% 6% 10% 5% 3% 9% 7%
Undecided/Refused 2% 2% 2% 2% 2% 3% 1%
Sampling Error (+/-) 3.7 6.3 5.6 7.5 7.4 5.8 6.5
Lean Lean
Demo- Repub
Total crat lican
===== ===== =====
Favorable Opinion 42% 15% 78%
Unfavorable Opinion 47% 75% 12%
Never heard of 2% 1% 2%
No opinion (Net) 10% 8% 8%
Heard of, no opinion 7% 7% 6%
Undecided/Refused 2% 1% 2%
Sampling Error (+/-) 3.7 5.1 5.8

1 Braxton Way Suite 125 Glen Mills, PA 19342
484-840-4300 www.ssrs.com
POLL 1 @ssrs_research | 484.840.4300 | www.ssrs.com | 47
CNN/SSRS Poll -- January 09, 2021 to January 14, 2021
TABLE 041
Question FV1_NP
FV1_NP. We'd like to get your overall opinion of some people in the news. As I read each name, please say if you
have a favorable or unfavorable opinion of these people - or if you have never heard of them. Do you have a
favorable or unfavorable opinion of Speaker of the House Nancy Pelosi, or have you never heard of them?
Base: Total Respondents
Ppl Trump Trump
of ap- disap
Total Men Women White Color prove prove
===== ===== ===== ===== ===== ===== =====
Favorable Opinion 44% 35% 52% 36% 58% 4% 66%
Unfavorable Opinion 52% 60% 44% 61% 37% 94% 30%
Never heard of 2% 2% 1% 1% 3% 1% 1%
No opinion (Net) 2% 2% 3% 2% 3% 1% 3%
Heard of, no opinion 2% 1% 2% 2% 1% 1% 2%
Undecided/Refused 1% 1% * * 1% 0% 1%
Sampling Error (+/-) 3.7 4.7 5.6 4.4 6.6 6.1 4.7
Total 18-34 35-49 50-64 65+ <45 45+
===== ===== ===== ===== ===== ===== =====
Favorable Opinion 44% 30% 50% 47% 52% 38% 49%
Unfavorable Opinion 52% 64% 47% 50% 44% 58% 47%
Never heard of 2% 3% * 1% 2% 2% 1%
No opinion (Net) 2% 3% 3% 2% 2% 2% 2%
Heard of, no opinion 2% 2% 2% 1% 2% 2% 2%
Undecided/Refused 1% 1% * 1% * 1% 1%
Sampling Error (+/-) 3.7 7.3 8.1 7.1 6.6 5.9 4.6
Non- White White
coll. Coll. non- coll.
Total <$50K $50K+ grad grad. coll. grad.
===== ===== ===== ===== ===== ===== =====
Favorable Opinion 44% 49% 42% 41% 50% 30% 46%
Unfavorable Opinion 52% 46% 57% 55% 48% 67% 51%
Never heard of 2% 2% 1% 2% 1% 1% 1%
No opinion (Net) 2% 3% 1% 3% 2% 2% 2%
Heard of, no opinion 2% 3% 1% 2% 1% 2% 2%
Undecided/Refused 1% * * 1% * 0% 1%
Sampling Error (+/-) 3.7 6.3 4.7 4.8 5.6 5.8 6.5
Indep Con
Demo- endnt Repub Lib- Mode- serva
Total crat Other lican eral rate tive
===== ===== ===== ===== ===== ===== =====
Favorable Opinion 44% 84% 36% 4% 76% 43% 21%
Unfavorable Opinion 52% 14% 58% 94% 21% 54% 75%
Never heard of 2% 1% 2% 1% 1% 1% 2%
No opinion (Net) 2% 1% 4% 1% 3% 2% 1%
Heard of, no opinion 2% 1% 3% 1% 3% 1% 1%
Undecided/Refused 1% * 1% 0% 0% 1% *
Sampling Error (+/-) 3.7 6.3 5.6 7.5 7.4 5.8 6.5
Lean Lean
Demo- Repub
Total crat lican
===== ===== =====
Favorable Opinion 44% 75% 6%
Unfavorable Opinion 52% 21% 92%
Never heard of 2% 1% 1%
No opinion (Net) 2% 3% 1%
Heard of, no opinion 2% 2% 1%
Undecided/Refused 1% 1% 0%
Sampling Error (+/-) 3.7 5.1 5.8

1 Braxton Way Suite 125 Glen Mills, PA 19342
484-840-4300 www.ssrs.com
POLL 1 @ssrs_research | 484.840.4300 | www.ssrs.com | 48
CNN/SSRS Poll -- January 09, 2021 to January 14, 2021
TABLE 042
Question FV1_KM
FV1_KM. We'd like to get your overall opinion of some people in the news. As I read each name, please say if you
have a favorable or unfavorable opinion of these people - or if you have never heard of them. Do you have a
favorable or unfavorable opinion of House Minority Leader Kevin McCarthy, or have you never heard of them?
Base: Total Respondents
Ppl Trump Trump
of ap- disap
Total Men Women White Color prove prove
===== ===== ===== ===== ===== ===== =====
Favorable Opinion 25% 28% 23% 25% 26% 40% 17%
Unfavorable Opinion 33% 35% 31% 36% 28% 24% 40%
Never heard of 26% 24% 29% 22% 33% 22% 28%
No opinion (Net) 16% 14% 17% 17% 14% 14% 15%
Heard of, no opinion 13% 11% 15% 14% 12% 12% 13%
Undecided/Refused 2% 3% 2% 3% 2% 2% 2%
Sampling Error (+/-) 3.7 4.7 5.6 4.4 6.6 6.1 4.7
Total 18-34 35-49 50-64 65+ <45 45+
===== ===== ===== ===== ===== ===== =====
Favorable Opinion 25% 17% 25% 31% 31% 20% 30%
Unfavorable Opinion 33% 30% 28% 36% 37% 30% 35%
Never heard of 26% 34% 31% 21% 17% 34% 20%
No opinion (Net) 16% 19% 16% 12% 15% 16% 15%
Heard of, no opinion 13% 16% 15% 10% 12% 13% 13%
Undecided/Refused 2% 3% 2% 2% 2% 3% 2%
Sampling Error (+/-) 3.7 7.3 8.1 7.1 6.6 5.9 4.6
Non- White White
coll. Coll. non- coll.
Total <$50K $50K+ grad grad. coll. grad.
===== ===== ===== ===== ===== ===== =====
Favorable Opinion 25% 27% 25% 27% 20% 27% 22%
Unfavorable Opinion 33% 24% 39% 27% 43% 30% 46%
Never heard of 26% 32% 21% 30% 19% 26% 16%
No opinion (Net) 16% 17% 14% 15% 17% 17% 16%
Heard of, no opinion 13% 16% 12% 12% 16% 14% 15%
Undecided/Refused 2% 2% 2% 3% 1% 4% 1%
Sampling Error (+/-) 3.7 6.3 4.7 4.8 5.6 5.8 6.5
Indep Con
Demo- endnt Repub Lib- Mode- serva
Total crat Other lican eral rate tive
===== ===== ===== ===== ===== ===== =====
Favorable Opinion 25% 15% 23% 43% 14% 21% 41%
Unfavorable Opinion 33% 45% 31% 21% 46% 34% 23%
Never heard of 26% 26% 28% 23% 28% 27% 22%
No opinion (Net) 16% 14% 18% 13% 13% 18% 14%
Heard of, no opinion 13% 12% 15% 12% 10% 16% 13%
Undecided/Refused 2% 2% 3% 2% 3% 2% 1%
Sampling Error (+/-) 3.7 6.3 5.6 7.5 7.4 5.8 6.5
Lean Lean
Demo- Repub
Total crat lican
===== ===== =====
Favorable Opinion 25% 16% 38%
Unfavorable Opinion 33% 41% 24%
Never heard of 26% 29% 21%
No opinion (Net) 16% 14% 17%
Heard of, no opinion 13% 12% 15%
Undecided/Refused 2% 2% 1%
Sampling Error (+/-) 3.7 5.1 5.8
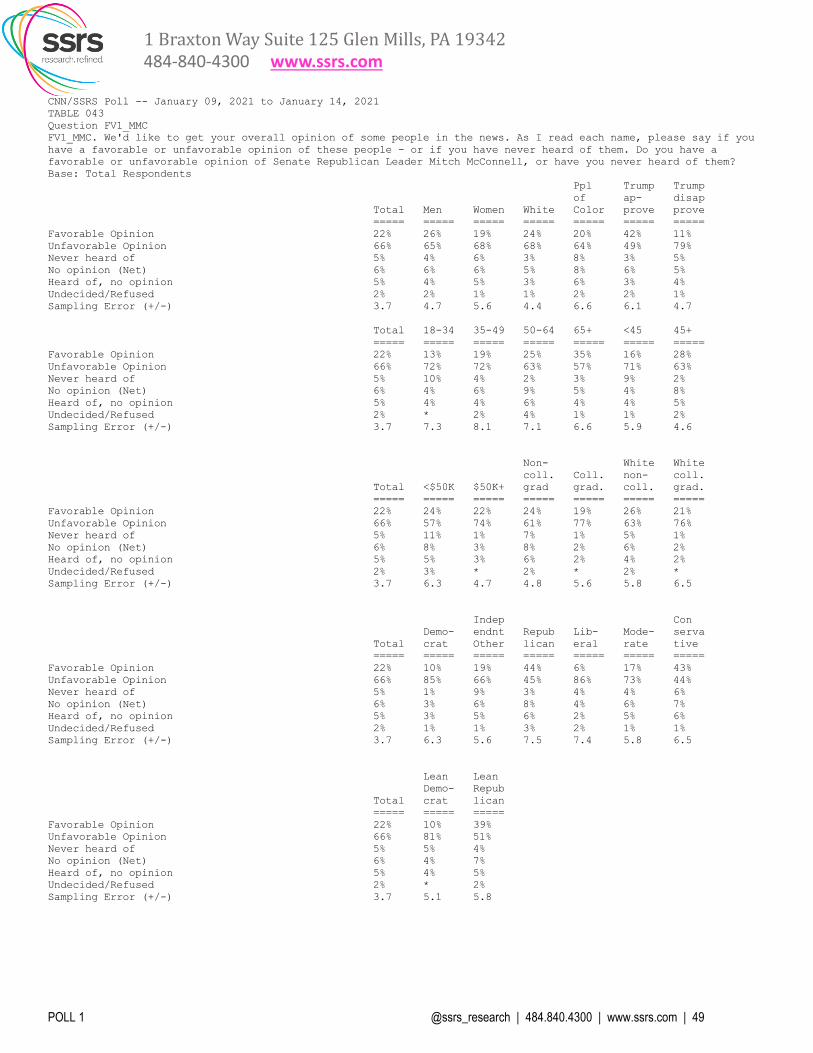
1 Braxton Way Suite 125 Glen Mills, PA 19342
484-840-4300 www.ssrs.com
POLL 1 @ssrs_research | 484.840.4300 | www.ssrs.com | 49
CNN/SSRS Poll -- January 09, 2021 to January 14, 2021
TABLE 043
Question FV1_MMC
FV1_MMC. We'd like to get your overall opinion of some people in the news. As I read each name, please say if you
have a favorable or unfavorable opinion of these people - or if you have never heard of them. Do you have a
favorable or unfavorable opinion of Senate Republican Leader Mitch McConnell, or have you never heard of them?
Base: Total Respondents
Ppl Trump Trump
of ap- disap
Total Men Women White Color prove prove
===== ===== ===== ===== ===== ===== =====
Favorable Opinion 22% 26% 19% 24% 20% 42% 11%
Unfavorable Opinion 66% 65% 68% 68% 64% 49% 79%
Never heard of 5% 4% 6% 3% 8% 3% 5%
No opinion (Net) 6% 6% 6% 5% 8% 6% 5%
Heard of, no opinion 5% 4% 5% 3% 6% 3% 4%
Undecided/Refused 2% 2% 1% 1% 2% 2% 1%
Sampling Error (+/-) 3.7 4.7 5.6 4.4 6.6 6.1 4.7
Total 18-34 35-49 50-64 65+ <45 45+
===== ===== ===== ===== ===== ===== =====
Favorable Opinion 22% 13% 19% 25% 35% 16% 28%
Unfavorable Opinion 66% 72% 72% 63% 57% 71% 63%
Never heard of 5% 10% 4% 2% 3% 9% 2%
No opinion (Net) 6% 4% 6% 9% 5% 4% 8%
Heard of, no opinion 5% 4% 4% 6% 4% 4% 5%
Undecided/Refused 2% * 2% 4% 1% 1% 2%
Sampling Error (+/-) 3.7 7.3 8.1 7.1 6.6 5.9 4.6
Non- White White
coll. Coll. non- coll.
Total <$50K $50K+ grad grad. coll. grad.
===== ===== ===== ===== ===== ===== =====
Favorable Opinion 22% 24% 22% 24% 19% 26% 21%
Unfavorable Opinion 66% 57% 74% 61% 77% 63% 76%
Never heard of 5% 11% 1% 7% 1% 5% 1%
No opinion (Net) 6% 8% 3% 8% 2% 6% 2%
Heard of, no opinion 5% 5% 3% 6% 2% 4% 2%
Undecided/Refused 2% 3% * 2% * 2% *
Sampling Error (+/-) 3.7 6.3 4.7 4.8 5.6 5.8 6.5
Indep Con
Demo- endnt Repub Lib- Mode- serva
Total crat Other lican eral rate tive
===== ===== ===== ===== ===== ===== =====
Favorable Opinion 22% 10% 19% 44% 6% 17% 43%
Unfavorable Opinion 66% 85% 66% 45% 86% 73% 44%
Never heard of 5% 1% 9% 3% 4% 4% 6%
No opinion (Net) 6% 3% 6% 8% 4% 6% 7%
Heard of, no opinion 5% 3% 5% 6% 2% 5% 6%
Undecided/Refused 2% 1% 1% 3% 2% 1% 1%
Sampling Error (+/-) 3.7 6.3 5.6 7.5 7.4 5.8 6.5
Lean Lean
Demo- Repub
Total crat lican
===== ===== =====
Favorable Opinion 22% 10% 39%
Unfavorable Opinion 66% 81% 51%
Never heard of 5% 5% 4%
No opinion (Net) 6% 4% 7%
Heard of, no opinion 5% 4% 5%
Undecided/Refused 2% * 2%
Sampling Error (+/-) 3.7 5.1 5.8

1 Braxton Way Suite 125 Glen Mills, PA 19342
484-840-4300 www.ssrs.com
POLL 1 @ssrs_research | 484.840.4300 | www.ssrs.com | 50
CNN/SSRS Poll -- January 09, 2021 to January 14, 2021
TABLE 044
Question FV1_CS
FV1_CS. We'd like to get your overall opinion of some people in the news. As I read each name, please say if you
have a favorable or unfavorable opinion of these people - or if you have never heard of them. Do you have a
favorable or unfavorable opinion of Senate Democratic Leader Chuck Schumer, or have you never heard of them?
Base: Total Respondents
Ppl Trump Trump
of ap- disap
Total Men Women White Color prove prove
===== ===== ===== ===== ===== ===== =====
Favorable Opinion 39% 31% 46% 37% 41% 4% 59%
Unfavorable Opinion 41% 51% 31% 47% 28% 83% 18%
Never heard of 12% 9% 15% 9% 17% 7% 13%
No opinion (Net) 9% 9% 9% 6% 14% 6% 10%
Heard of, no opinion 7% 7% 7% 5% 11% 5% 8%
Undecided/Refused 2% 2% 1% 1% 3% 1% 2%
Sampling Error (+/-) 3.7 4.7 5.6 4.4 6.6 6.1 4.7
Total 18-34 35-49 50-64 65+ <45 45+
===== ===== ===== ===== ===== ===== =====
Favorable Opinion 39% 25% 42% 44% 48% 30% 46%
Unfavorable Opinion 41% 45% 37% 40% 39% 42% 39%
Never heard of 12% 17% 13% 9% 7% 16% 8%
No opinion (Net) 9% 13% 7% 7% 6% 11% 7%
Heard of, no opinion 7% 11% 6% 5% 5% 9% 5%
Undecided/Refused 2% 3% 2% 2% 1% 2% 2%
Sampling Error (+/-) 3.7 7.3 8.1 7.1 6.6 5.9 4.6
Non- White White
coll. Coll. non- coll.
Total <$50K $50K+ grad grad. coll. grad.
===== ===== ===== ===== ===== ===== =====
Favorable Opinion 39% 39% 39% 35% 44% 32% 46%
Unfavorable Opinion 41% 30% 49% 40% 42% 50% 43%
Never heard of 12% 19% 6% 15% 7% 12% 5%
No opinion (Net) 9% 12% 6% 10% 7% 6% 5%
Heard of, no opinion 7% 10% 5% 8% 6% 5% 5%
Undecided/Refused 2% 2% 1% 2% 1% 2% 1%
Sampling Error (+/-) 3.7 6.3 4.7 4.8 5.6 5.8 6.5
Indep Con
Demo- endnt Repub Lib- Mode- serva
Total crat Other lican eral rate tive
===== ===== ===== ===== ===== ===== =====
Favorable Opinion 39% 75% 27% 9% 62% 45% 14%
Unfavorable Opinion 41% 9% 45% 76% 17% 36% 66%
Never heard of 12% 8% 19% 7% 13% 10% 12%
No opinion (Net) 9% 7% 9% 8% 8% 9% 8%
Heard of, no opinion 7% 6% 8% 7% 7% 7% 7%
Undecided/Refused 2% 1% 2% 1% 1% 2% 1%
Sampling Error (+/-) 3.7 6.3 5.6 7.5 7.4 5.8 6.5
Lean Lean
Demo- Repub
Total crat lican
===== ===== =====
Favorable Opinion 39% 64% 9%
Unfavorable Opinion 41% 13% 76%
Never heard of 12% 15% 8%
No opinion (Net) 9% 8% 7%
Heard of, no opinion 7% 7% 6%
Undecided/Refused 2% 1% 1%
Sampling Error (+/-) 3.7 5.1 5.8
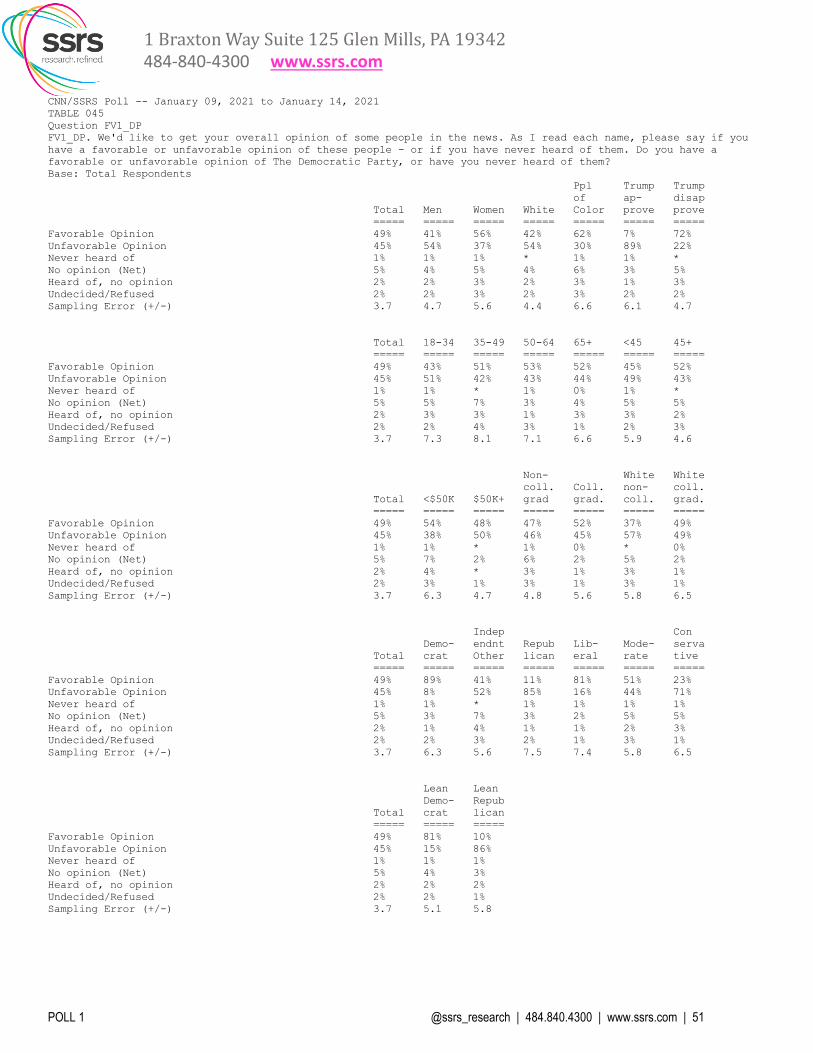
1 Braxton Way Suite 125 Glen Mills, PA 19342
484-840-4300 www.ssrs.com
POLL 1 @ssrs_research | 484.840.4300 | www.ssrs.com | 51
CNN/SSRS Poll -- January 09, 2021 to January 14, 2021
TABLE 045
Question FV1_DP
FV1_DP. We'd like to get your overall opinion of some people in the news. As I read each name, please say if you
have a favorable or unfavorable opinion of these people - or if you have never heard of them. Do you have a
favorable or unfavorable opinion of The Democratic Party, or have you never heard of them?
Base: Total Respondents
Ppl Trump Trump
of ap- disap
Total Men Women White Color prove prove
===== ===== ===== ===== ===== ===== =====
Favorable Opinion 49% 41% 56% 42% 62% 7% 72%
Unfavorable Opinion 45% 54% 37% 54% 30% 89% 22%
Never heard of 1% 1% 1% * 1% 1% *
No opinion (Net) 5% 4% 5% 4% 6% 3% 5%
Heard of, no opinion 2% 2% 3% 2% 3% 1% 3%
Undecided/Refused 2% 2% 3% 2% 3% 2% 2%
Sampling Error (+/-) 3.7 4.7 5.6 4.4 6.6 6.1 4.7
Total 18-34 35-49 50-64 65+ <45 45+
===== ===== ===== ===== ===== ===== =====
Favorable Opinion 49% 43% 51% 53% 52% 45% 52%
Unfavorable Opinion 45% 51% 42% 43% 44% 49% 43%
Never heard of 1% 1% * 1% 0% 1% *
No opinion (Net) 5% 5% 7% 3% 4% 5% 5%
Heard of, no opinion 2% 3% 3% 1% 3% 3% 2%
Undecided/Refused 2% 2% 4% 3% 1% 2% 3%
Sampling Error (+/-) 3.7 7.3 8.1 7.1 6.6 5.9 4.6
Non- White White
coll. Coll. non- coll.
Total <$50K $50K+ grad grad. coll. grad.
===== ===== ===== ===== ===== ===== =====
Favorable Opinion 49% 54% 48% 47% 52% 37% 49%
Unfavorable Opinion 45% 38% 50% 46% 45% 57% 49%
Never heard of 1% 1% * 1% 0% * 0%
No opinion (Net) 5% 7% 2% 6% 2% 5% 2%
Heard of, no opinion 2% 4% * 3% 1% 3% 1%
Undecided/Refused 2% 3% 1% 3% 1% 3% 1%
Sampling Error (+/-) 3.7 6.3 4.7 4.8 5.6 5.8 6.5
Indep Con
Demo- endnt Repub Lib- Mode- serva
Total crat Other lican eral rate tive
===== ===== ===== ===== ===== ===== =====
Favorable Opinion 49% 89% 41% 11% 81% 51% 23%
Unfavorable Opinion 45% 8% 52% 85% 16% 44% 71%
Never heard of 1% 1% * 1% 1% 1% 1%
No opinion (Net) 5% 3% 7% 3% 2% 5% 5%
Heard of, no opinion 2% 1% 4% 1% 1% 2% 3%
Undecided/Refused 2% 2% 3% 2% 1% 3% 1%
Sampling Error (+/-) 3.7 6.3 5.6 7.5 7.4 5.8 6.5
Lean Lean
Demo- Repub
Total crat lican
===== ===== =====
Favorable Opinion 49% 81% 10%
Unfavorable Opinion 45% 15% 86%
Never heard of 1% 1% 1%
No opinion (Net) 5% 4% 3%
Heard of, no opinion 2% 2% 2%
Undecided/Refused 2% 2% 1%
Sampling Error (+/-) 3.7 5.1 5.8

1 Braxton Way Suite 125 Glen Mills, PA 19342
484-840-4300 www.ssrs.com
POLL 1 @ssrs_research | 484.840.4300 | www.ssrs.com | 52
CNN/SSRS Poll -- January 09, 2021 to January 14, 2021
TABLE 046
Question FV1_RP
FV1_RP. We'd like to get your overall opinion of some people in the news. As I read each name, please say if you
have a favorable or unfavorable opinion of these people - or if you have never heard of them. Do you have a
favorable or unfavorable opinion of The Republican Party, or have you never heard of them?
Base: Total Respondents
Ppl Trump Trump
of ap- disap
Total Men Women White Color prove prove
===== ===== ===== ===== ===== ===== =====
Favorable Opinion 32% 34% 31% 37% 25% 67% 13%
Unfavorable Opinion 62% 61% 64% 59% 68% 28% 82%
Never heard of * * 0% 0% * * 0%
No opinion (Net) 5% 5% 5% 4% 7% 5% 5%
Heard of, no opinion 3% 3% 3% 2% 3% 1% 3%
Undecided/Refused 3% 3% 2% 2% 3% 3% 2%
Sampling Error (+/-) 3.7 4.7 5.6 4.4 6.6 6.1 4.7
Total 18-34 35-49 50-64 65+ <45 45+
===== ===== ===== ===== ===== ===== =====
Favorable Opinion 32% 29% 30% 34% 38% 30% 35%
Unfavorable Opinion 62% 66% 65% 59% 58% 66% 59%
Never heard of * 0% * 0% 0% * 0%
No opinion (Net) 5% 5% 5% 7% 4% 5% 6%
Heard of, no opinion 3% 3% 3% 2% 3% 3% 3%
Undecided/Refused 3% 2% 2% 5% 1% 2% 3%
Sampling Error (+/-) 3.7 7.3 8.1 7.1 6.6 5.9 4.6
Non- White White
coll. Coll. non- coll.
Total <$50K $50K+ grad grad. coll. grad.
===== ===== ===== ===== ===== ===== =====
Favorable Opinion 32% 35% 31% 37% 24% 44% 26%
Unfavorable Opinion 62% 60% 66% 57% 73% 51% 72%
Never heard of * 0% * * 0% 0% 0%
No opinion (Net) 5% 6% 3% 6% 3% 6% 2%
Heard of, no opinion 3% 2% 2% 3% 2% 3% 1%
Undecided/Refused 3% 3% 1% 3% 1% 3% 1%
Sampling Error (+/-) 3.7 6.3 4.7 4.8 5.6 5.8 6.5
Indep Con
Demo- endnt Repub Lib- Mode- serva
Total crat Other lican eral rate tive
===== ===== ===== ===== ===== ===== =====
Favorable Opinion 32% 9% 24% 76% 7% 26% 61%
Unfavorable Opinion 62% 89% 69% 19% 91% 69% 32%
Never heard of * * 0% 0% 0% * 0%
No opinion (Net) 5% 2% 7% 5% 1% 5% 7%
Heard of, no opinion 3% 1% 4% 2% 1% 2% 5%
Undecided/Refused 3% 1% 2% 3% 1% 3% 2%
Sampling Error (+/-) 3.7 6.3 5.6 7.5 7.4 5.8 6.5
Lean Lean
Demo- Repub
Total crat lican
===== ===== =====
Favorable Opinion 32% 9% 64%
Unfavorable Opinion 62% 88% 32%
Never heard of * * 0%
No opinion (Net) 5% 3% 5%
Heard of, no opinion 3% 2% 2%
Undecided/Refused 3% 1% 3%
Sampling Error (+/-) 3.7 5.1 5.8
Top Related