


Languages
Pages
Legal


© Cumming & Johan (2013) Exits
Exit Outcomes
Cumming and Johan (2013 Chapter 21)
Plus some supplementary material
1
© Cumming & Johan (2013) Exits
Venture Capital Exits
Exits – Definitions and OverviewEuropean ExitsCanadian Exits
Australasian ExitsUS versus Canada Full Partial Exits
IPOsAcquisitionsSecondary SalesBuybacksWrite-offs
2
© Cumming & Johan (2013) Exits
What is a “Venture Capital Exit” ?
Exits – Definitions and OverviewEuropean ExitsCanadian Exits
Australasian ExitsUS versus Canada Full Partial Exits
• The means by which venture capitalists (VCs) dispose of their investments (recall introductory statistics lecture)
• Exit Types» IPO» Merger/Acquisition» Secondary Sale» Buyback» Writeoff
3
© Cumming & Johan (2013) Exits
What Drives Choice of VC Exit?
Exits – Definitions and OverviewEuropean ExitsCanadian Exits
Australasian ExitsUS versus Canada Full Partial Exits
1. Entrepreneurial firm characteristics
2. VC characteristics
3. Cash flow and control rights between VC and entrepreneur
4. Market conditions
5. Legality and institutional factors across countries
4

© Cumming & Johan (2013) Exits
1. Entrepreneurial Firm Characteristics
Exits – Definitions and OverviewEuropean ExitsCanadian Exits
Australasian ExitsUS versus Canada Full Partial Exits
Entrepreneurial firm characteristicsVC characteristicsCash flow and control rights between VC and entrepreneurMarket conditionsLegality and institutional factors across countries
• Size– Minimum listing standards for IPO
• Quality– Not possible to take bad companies public?!– Important to minimize information problems to max sale price (next slide)
• Industry– High Market/Book high growth potential
• Location
• Transaction synergies with new owner(s)– Very important for acquisitions, & possibly IPOs
5
© Cumming & Johan (2013) Exits
1. Firm Characteristics: Exit Vehicles and Info Asymmetry
Exits – Definitions and OverviewEuropean ExitsCanadian Exits
Australasian ExitsUS versus Canada Full Partial Exits
Entrepreneurial firm characteristicsVC characteristicsCash flow and control rights between VC and entrepreneurMarket conditionsLegality and institutional factors across countries
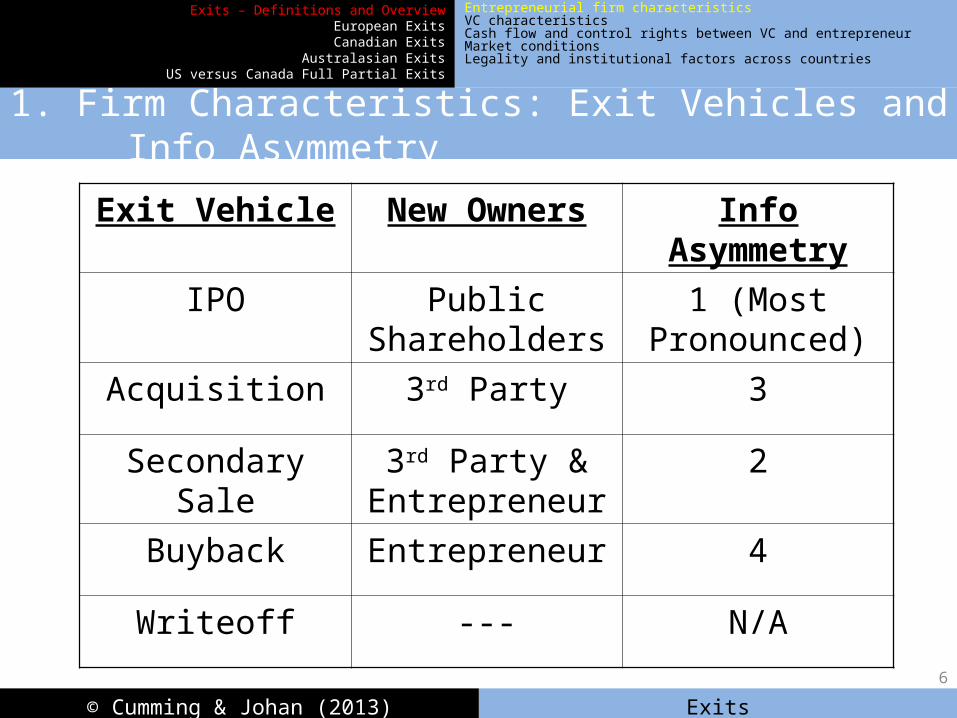
Exit Vehicle New Owners Info Asymmetry
IPO Public Shareholders
1 (Most Pronounced)
Acquisition 3rd Party 3
Secondary Sale
3rd Party & Entrepreneur
2
Buyback Entrepreneur 4
Writeoff --- N/A
6

© Cumming & Johan (2013) Exits
2. VC Characteristics
Exits – Definitions and OverviewEuropean ExitsCanadian Exits
Australasian ExitsUS versus Canada Full Partial Exits
Entrepreneurial firm characteristicsVC characteristicsCash flow and control rights between VC and entrepreneurMarket conditionsLegality and institutional factors across countries
• LPs versus corporate• & versus Government funds!
• Kliener Perkins versus “Fargo” VC Fund
• Fund Capital
• Connections with Investment Banks and/or Microsoft type companies
7

© Cumming & Johan (2013) Exits
3. Control Rights
Exits – Definitions and OverviewEuropean ExitsCanadian Exits
Australasian ExitsUS versus Canada Full Partial Exits
Entrepreneurial firm characteristicsVC characteristicsCash flow and control rights between VC and entrepreneurMarket conditionsLegality and institutional factors across countries
• Entrepreneurs have a non-pecuniary preference for IPOs
• Weak VC control rights and common equity IPOs more likely?
• Strong VC control rights and convertible securities acquisitions more likely?
8

© Cumming & Johan (2013) Exits
4. Market conditions
Exits – Definitions and OverviewEuropean ExitsCanadian Exits
Australasian ExitsUS versus Canada Full Partial Exits
Entrepreneurial firm characteristicsVC characteristicsCash flow and control rights between VC and entrepreneurMarket conditionsLegality and institutional factors across countries
• Significant factor in IPOs– 1999 – April 14, 2000
• Also a significant factor in write-offs!– Post April 14, 2000
9

© Cumming & Johan (2013) Exits
5. Legality / Institutional Factors
Exits – Definitions and OverviewEuropean ExitsCanadian Exits
Australasian ExitsUS versus Canada Full Partial Exits
Entrepreneurial firm characteristicsVC characteristicsCash flow and control rights between VC and entrepreneurMarket conditionsLegality and institutional factors across countries
• Legal– Quality of shareholder rights– Corruption– Contract repudiation– Rule of Law– Efficiency of Judiciary
• Institutional– Size of country’s stock market
10

© Cumming & Johan (2013) Exits
Control Rights and VC Exits
Exits – Definitions and OverviewEuropean ExitsCanadian Exits
Australasian ExitsUS versus Canada Full Partial Exits
Cumming and Johan (2013 Chapter 21)
11

© Cumming & Johan (2013) Exits
Data
Exits – Definitions and OverviewEuropean ExitsCanadian Exits
Australasian ExitsUS versus Canada Full Partial Exits
• 223 entrepreneurial firms• Hand-collected from 35 private equity funds• 11 continental European countries: Germany (50), The
Czech Republic (5), The Netherlands (73), Switzerland (15), Italy (23), Denmark (11), France (6), Belgium (12), Poland (12), Austria (10) and Portugal (6).
• Investment Years 1995 – 2002. • Exit Years 1996 – 2005.
12

© Cumming & Johan (2013) Exits
Securities Used by Year of Investment in European Data (Chapter 21)
0
5
10
15
20
25
30
35
40
1995 1996 1997 1998 1999 2000 2001 2002
Year
To
tal N
um
ber
per
Yea
r
Straight Debt or Straight Preferred Preferred or Debt and Common Common Equity Convertible Debt or Convertible Preferred Equity
13

© Cumming & Johan (2013) Exits
Table 21.5. Multinomial Logit Regressions (selected variables excluded to fit on this slide)
IPO Acquisition Buyback Write-off IPO Acquisition Buyback Write-off
Constant -0.613 3.173* -0.013 -1.260 -1.056 3.259* 0.226 -0.984
Investor Characteristics
Log (Fund Capital) -0.011 -0.036 -0.047** -0.001 0.030 -0.108 -0.050* 0.037
Non-Captive VC Fund -0.004 -0.221* 0.103** 0.048 0.058 -0.214* 0.084* 0.012
Transaction Characteristics
Log (Private Investment Value) 0.019 -0.043 0.005 0.039 0.014 -0.031 0.004 0.023
Prior Rounds 0.029 0.282** -0.019 -0.301** 0.030 0.395** -0.019 -0.413**
Replace CEO -0.068 0.386*** 0.024 -0.159 -0.068 0.236* 0.036 -0.028
Majority Board -0.106** 0.237*** -0.039 0.035 -0.092* 0.184* -0.043 0.082
Majority Vote 0.040 -0.059 0.006 -0.085
Control Rights Index -0.066** 0.122** 0.014 -0.072
Veto Rights 0.011 0.056 -0.008 -0.052
Market Characteristics
Log (MSCI 0-3 Months) 1.007*** -1.668*** 0.290 0.366 0.916*** -1.682** 0.254 0.603
Investment Year Dummies? Yes Yes Yes Yes Yes Yes Yes Yes
Institutional and Legal Variables
Log (Legality) -0.026 -0.833 0.110 0.203 0.046 -0.787 0.060 0.116
Log (Market Capitalization) 0.052* 0.063 0.014 0.003 0.022 0.093 0.013 0.005
Country Dummies? Yes Yes Yes Yes Yes Yes Yes Yes14

© Cumming & Johan (2013) Exits
Some Key Findings
Exits – Definitions and OverviewEuropean ExitsCanadian Exits
Australasian ExitsUS versus Canada Full Partial Exits
• Strong VC control rights Acquisition
• Weak VC control rights / common equity IPO
• Why?
15

© Cumming & Johan (2013) Exits
Puzzle
Exits – Definitions and OverviewEuropean ExitsCanadian Exits
Australasian ExitsUS versus Canada Full Partial Exits
• Legality less important than size of stock market in driving exit outcomes in Europe
• Legality more important than size of stock market in driving exit outcomes in Asia-Pacific region
• Why?
16

© Cumming & Johan (2013) Exits
Supplementary Material
VC exits from other parts of the world
17

© Cumming & Johan (2013) Exits
Canadian Exits
Exits – Definitions and OverviewEuropean ExitsCanadian Exits
Australasian ExitsUS versus Canada Full Partial Exits
Cumming and Johan (2008 Venture Capital)
18

© Cumming & Johan (2013) Exits
Summary Testable Hypotheses
This table summarizes the central hypotheses and describes the variables used to test the hypotheses.
Hypo-thesis #
Variable Description Hypothesized Effect on Exit Outcomes
Venture Capital Characteristics
Limited Partnership Venture Capitalist
20.1The fraction of the number of limited partnership venture capital funds that were syndicated venture capital funds at the first round investment.
IPOs and acquisitions are more likely than secondary sales, buybacks and write-offs for limited partnership venture capital funds.
Corporate Venture capital fund
20.2The fraction of the number of corporate venture capital funds that were syndicated venture capital funds at the first round investment.
Acquisitions are more likely than IPOs as the corporate venture capital has strategic incentives to invest.
Government Venture capital fund
20.3The fraction of the number of government venture capital funds that were syndicated venture capital funds at the first round investment.
Weaker governance structure associated with government funds, and therefore a greater probability of secondary sales, buybacks and write-offs.
Number of Syndicated Venture capital funds
20.4The number of syndicated venture capital funds in the first round investment.
A greater number of syndicate venture capital funds will reduce adverse selection problems and facilitate value added, thereby increasing the probability of an IPO
Entrepreneurial Firm Characteristics
Life Science Industry 20.5A dummy variable equal to one for firms in one of the life sciences industries (biotechnology or medical)
Increases the probability of an IPO, as IPO investors often have an appetite for technology companies
Other High-Tech Industry
20.5A dummy variable equal to one for firms in one of the high-tech industries other than the life sciences industries.
Increases the probability of an IPO, as IPO investors often have an appetite for technology companies
Seed or Early Stage 20.6A dummy variable equal to one for seed or early stage investments in the first round of investment
Higher probability of a write-off as risks are greater the earlier the stage of investment
Expansion Stage 20.6A dummy variable equal to one for expansion stage investments in the first round of investment
Lower risks relative to seed and early stage investments, and therefore a lower probability of a write-off
Entrepreneur Capital Requirements
[Log (Deal Size)]20.7
The log of the amount invested in the first round investment across all syndicated venture capital funds, in thousands of 2004 Canadian dollars.
Larger investments are more likely to go public as there are minimum capital requirements for listing.
Venture capital fund and Entrepreneur in Same
Province20.8
A dummy variable equal to one if the venture capital fund and the entrepreneur were located with the same province at the time of first round investment
Higher probability of an IPO and acquisition as adverse selection problems are mitigated and value-added facilitated by regional proximity. 19

© Cumming & Johan (2013) Exits
Summary Testable Hypotheses
(Continued)
Hypo-thesis #
Variable Description Hypothesized Effect on Exit Outcomes
Transaction Characteristics
Common Equity and/or Warrants
20.9
The fraction of the number of first-round investment securities in the form of common equity and/or warrants. If only common equity was used then the variable equals 1, and if common equity was not used then the variable equals 0.
Increases the probability of an IPO over an acquisition, as common equity signals favorable information to the public market. As well, higher quality entrepreneurs are more likely to negotiate common equity contracts. Further, entrepreneurs typically have stronger control rights when the venture capital fund uses common equity, and therefore entrepreneurs with a non-pecuniary preference for an IPO are less likely to be acquired than go public.
Convertible Securities 20.10
The fraction of the number of first-round investment securities in the form of convertible preferred equity and/or convertible debt. If only convertible securities were used then the variable equals 1, and if convertible securities were not used then the variable equals 0.
Provides incentives for the venture capital fund to add value and thereby increase the probability of both IPOs and acquisitions over secondary sales, buybacks and write-offs.
Control Variables: Institutional and
Economic Conditions
Entrepreneur A dummy variable equal to one for an entrepreneur based in Higher probability of an IPO and acquisition as economic activity is greater in the of and than other provinces.
Entrepreneur A dummy variable equal to one for an entrepreneur based in Higher probability of an IPO and acquisition as economic activity is greater in the of and than other provinces.
Log (1+MSCI Index in Year of Exit)
The log of 1+ the Morgan Stanley Capital International stock index return for in the year of exit
Higher probability of an IPO or acquisition in boom market conditions; greater probability of secondary sales, buybacks and write-offs in bad market conditions
Log (1+MSCI Index in Year Prior to Exit)
The log of 1+ the Morgan Stanley Capital International stock index return for in the year prior to exit
Higher probability of an IPO or acquisition in boom market conditions; greater probability of secondary sales, buybacks and write-offs in bad market conditions
Dummy for Exit in 1999 A dummy variable equal to one for exits in 1999Higher probability of an IPO or acquisition in boom market conditions; greater probability of secondary sales, buybacks and write-offs in bad market conditions
Dummy for Exit in 2000 A dummy variable equal to one for exits in 2000Higher probability of an IPO or acquisition in boom market conditions; greater probability of secondary sales, buybacks and write-offs in bad market conditions 20

© Cumming & Johan (2013) Exits
0
10
20
30
40
50
60
1991 1992 1993 1994 1995 1996 1997 1998 1999 2000 2001 2002 2003 2004
Nu
mb
er o
f E
xits
Figure 20.1. Number of Venture Capital - Backed Exits by Year, 1991-1994
IPO Acquisition Secondary Sale Buyback Write-off 21

© Cumming & Johan (2013) Exits
IPO
Acquisition
SecSale
BuybackWriteof f
0.00%
10.00%
20.00%
30.00%
40.00%
50.00%
60.00%
Co
rpo
rate
Go
vern
men
t
Hyb
rid
Lab
our
Sp
ons
ore
d
Priv
ate
Ind
epen
den
t
Unk
now
n
Figure 20.2. Percentage of Exit Outcomes for Each Type of Investor
22

© Cumming & Johan (2013) Exits
Write-of f
IPO
Secondary Sale
Buyback
Acquisition
0.00%
5.00%
10.00%
15.00%
20.00%
25.00%
30.00%
35.00%
40.00%
45.00%
50.00%
SeedEarly
ExpansionBuyout
TurnaroundUnknown
Figure 20.3. Percentage of Exit Outcomes for Each Stage of First Investment
23

© Cumming & Johan (2013) Exits
IPOSecondary Sale BuybackWrite-of fAcquisition
0.00%
5.00%
10.00%
15.00%
20.00%
25.00%
30.00%
35.00%
40.00%
45.00%
50.00%
Co
mm
on
and
/or W
arra
nts
Pre
ferr
ed
Co
nver
tible
Pre
ferr
ed
Co
nver
tible
Deb
t
Mix
ed C
om
mo
n w
ith P
refe
rred
and
/or D
ebt
Deb
t
Unk
now
n
Figure 20.4. Percentage of Exit Outcomes for Each Type of Security
24
© Cumming & Johan (2013) Exits
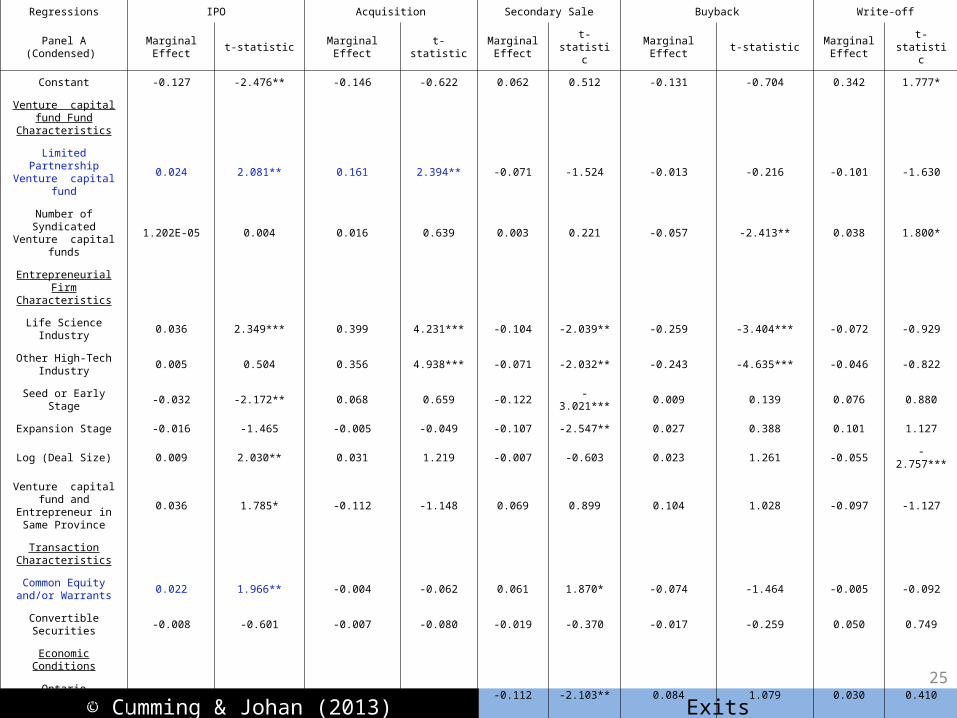
Regressions IPO Acquisition Secondary Sale Buyback Write-off
Panel A (Condensed) Marginal
Effectt-statistic Marginal Effect t-statistic
Marginal Effect
t-statistic Marginal Effect t-statisticMarginal
Effectt-statistic
Constant -0.127 -2.476** -0.146 -0.622 0.062 0.512 -0.131 -0.704 0.342 1.777*
Venture capital fund Fund Characteristics
Limited Partnership Venture capital fund
0.024 2.081** 0.161 2.394** -0.071 -1.524 -0.013 -0.216 -0.101 -1.630
Number of Syndicated Venture capital funds
1.202E-05 0.004 0.016 0.639 0.003 0.221 -0.057 -2.413** 0.038 1.800*
Entrepreneurial Firm Characteristics
Life Science Industry 0.036 2.349*** 0.399 4.231*** -0.104 -2.039** -0.259 -3.404*** -0.072 -0.929
Other High-Tech Industry
0.005 0.504 0.356 4.938*** -0.071 -2.032** -0.243 -4.635*** -0.046 -0.822
Seed or Early Stage -0.032 -2.172** 0.068 0.659 -0.122 -3.021*** 0.009 0.139 0.076 0.880
Expansion Stage -0.016 -1.465 -0.005 -0.049 -0.107 -2.547** 0.027 0.388 0.101 1.127
Log (Deal Size) 0.009 2.030** 0.031 1.219 -0.007 -0.603 0.023 1.261 -0.055 -2.757***
Venture capital fund and Entrepreneur in
Same Province0.036 1.785* -0.112 -1.148 0.069 0.899 0.104 1.028 -0.097 -1.127
Transaction Characteristics
Common Equity and/or Warrants
0.022 1.966** -0.004 -0.062 0.061 1.870* -0.074 -1.464 -0.005 -0.092
Convertible Securities -0.008 -0.601 -0.007 -0.080 -0.019 -0.370 -0.017 -0.259 0.050 0.749
Economic Conditions
Ontario Entrepreneur -0.015 -1.354 0.012 0.155 -0.112 -2.103** 0.084 1.079 0.030 0.410
Quebec Entrepreneur -0.014 -1.472 -0.309 -3.935*** 0.049 1.170 0.219 3.081*** 0.055 0.801
Log (1+MSCI Index in Year of Exit)
-0.049 -1.847* -0.118 -0.924 0.034 0.506 0.098 0.953 0.034 0.325
Log (1+MSCI Index in Year Prior to Exit)
0.007 0.296 0.137 1.135 -0.062 -1.019 0.196 2.197** -0.278 -2.665***
Dummy for Exit in 1999 0.049 2.211** 0.358 2.337** 0.024 0.391 -0.452 -2.551** 0.021 0.175
Dummy for Exit in 2000 0.028 1.954* 0.028 0.326 -0.081 -1.498 -0.265 -3.638*** 0.290 4.291***
25

© Cumming & Johan (2013) Exits
Regressions IPO Acquisition Secondary Sale Buyback Write-off
Panel B (Condensed) Marginal
Effectt-statistic Marginal Effect t-statistic Marginal Effect t-statistic
Marginal Effect
t-statisticMarginal
Effectt-statistic
Constant -0.107 -2.296** 0.055 0.232 -0.028 -0.348 -0.241 -1.229 0.321 1.570
Venture capital fund Fund Characteristics
Corporate Venture capital fund
0.015 1.202 0.282 2.362** -0.351 -3.102*** -0.136 -1.236 0.191 1.902*
Government Venture capital fund or LSVCC
-0.021 -1.841* -0.229 -3.137** 0.071 2.047** 0.146 2.309** 0.034 0.503
Number of Syndicated Venture capital funds
0.000 0.082 0.006 0.212 0.014 1.562 -0.053 -2.142** 0.034 1.503
Entrepreneurial Firm Characteristics
Life Science Industry 0.039 2.312** 0.410 4.185*** -0.071 -1.882* -0.268 -3.405*** -0.110 -1.305
Other High-Tech Industry
0.007 0.702 0.332 4.389*** -0.040 -1.630 -0.229 -4.165*** -0.070 -1.126
Log (Deal Size) 0.008 1.951* 0.026 1.013 -0.004 -0.515 0.026 1.361 -0.056 -2.660***
Transaction Characteristics
Common Equity and/or Warrants
0.025 2.039** 0.014 0.206 0.035 1.522 -0.071 -1.331 -0.003 -0.051
Convertible Securities -0.007 -0.478 -0.027 -0.321 -0.008 -0.262 0.010 0.148 0.032 0.448
Economic Conditions
Log (1+MSCI Index in Year of Exit)
-0.050 -1.801* -0.103 -0.781 0.018 0.414 0.099 0.919 0.036 0.320
Log (1+MSCI Index in Year Prior to Exit)
0.000 0.014 0.130 1.045 -0.033 -0.846 0.211 2.251** -0.309 -2.759***
Dummy for Exit in 1999 0.053 2.257** 0.388 2.455** 0.004 0.093 -0.462 -2.562** 0.017 0.138
Dummy for Exit in 2000 0.031 2.004** 0.042 0.462 -0.070 -1.768* -0.318 -4.120*** 0.315 4.361***
26

© Cumming & Johan (2013) Exits
Summary
Exits – Definitions and OverviewEuropean ExitsCanadian Exits
Australasian ExitsUS versus Canada Full Partial Exits
• Fund Type– Limited partners: IPO or acquisition– Corporate: acquisition– LSVCC: buyback or secondary sale
• Transaction type– Common equity: IPO– Consistent with European evidence discussed in Chapter 21
• Entrepreneur characteristics and economic conditions also important
27

© Cumming & Johan (2013) Exits
Some Further Evidence… Asia Pacific
Exits – Definitions and OverviewEuropean ExitsCanadian Exits
Australasian ExitsUS versus Canada Full Partial Exits
Cumming, Fleming & Schwienbacher (2006, Journal of Corporate Finance)
28
© Cumming & Johan (2013) Exits
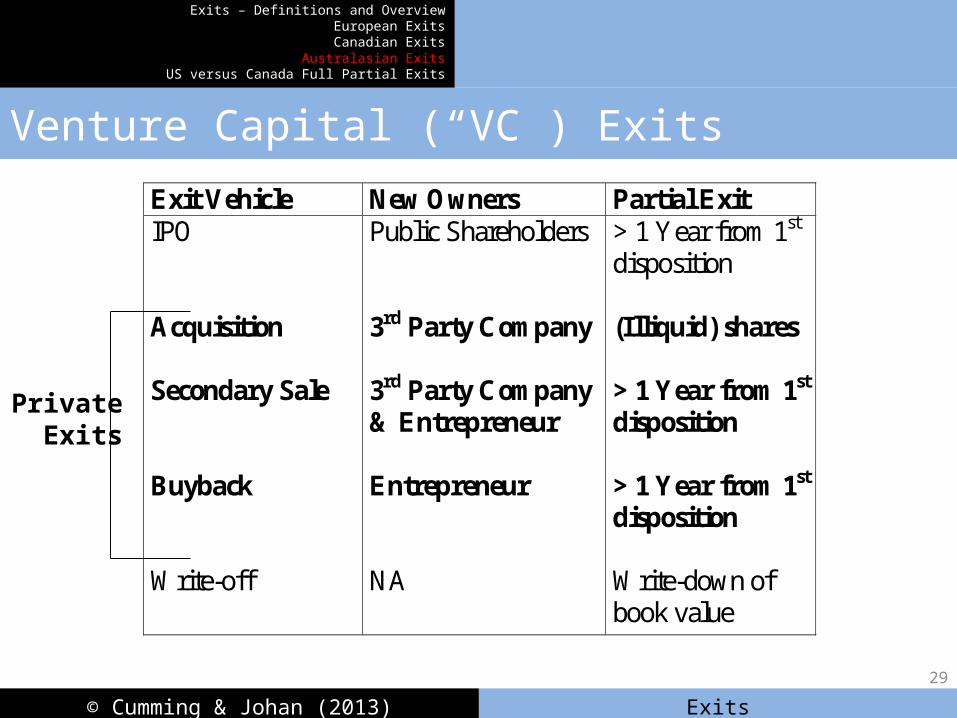
Venture Capital (“VC”) Exits
Exits – Definitions and OverviewEuropean ExitsCanadian Exits
Australasian ExitsUS versus Canada Full Partial Exits
Exit Vehicle New Owners Partial Exit IPO Acquisition Secondary Sale Buyback Write-off
Public Shareholders 3rd Party Company 3rd Party Company & Entrepreneur Entrepreneur NA
> 1 Year from 1st disposition (Illiquid) shares > 1 Year from 1st disposition > 1 Year from 1st disposition Write-down of book value
PrivateExits
29

© Cumming & Johan (2013) Exits
Core Research Question
Exits – Definitions and OverviewEuropean ExitsCanadian Exits
Australasian ExitsUS versus Canada Full Partial Exits
• Does legality affect VC exit outcomes? IPO private sale (acquisition, secondary sale, buyback) write-off
• Related questions in companion work:1. Does legality affect investment decisions2. Does legality affect decision to move company from Asia-
Pacific to the United States
30

© Cumming & Johan (2013) Exits
Competing Theories
Exits – Definitions and OverviewEuropean ExitsCanadian Exits
Australasian ExitsUS versus Canada Full Partial Exits
• Black and Gilson (1998 JFE Discussion Paper) Venture Capital Markets Require Strong Stock Markets to
Facilitate IPOs Proposition not previously subject to empirical scrutiny
• Shleifer and Wolfenzon (2002 JFE) IPOs facilitated by Legality Proposition not previously subject to empirical scrutiny
31
© Cumming & Johan (2013) Exits
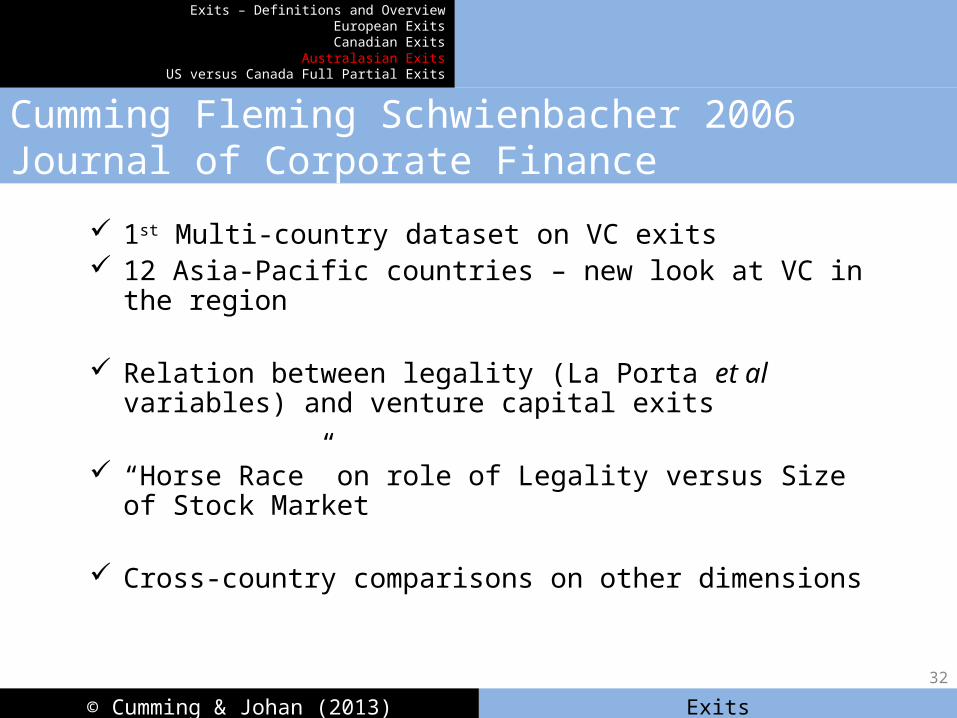
Cumming Fleming Schwienbacher 2006 Journal of Corporate Finance
Exits – Definitions and OverviewEuropean ExitsCanadian Exits
Australasian ExitsUS versus Canada Full Partial Exits
1st Multi-country dataset on VC exits 12 Asia-Pacific countries – new look at VC in the region
Relation between legality (La Porta et al variables) and venture capital exits
“Horse Race” on role of Legality versus Size of Stock Market
Cross-country comparisons on other dimensions
32

© Cumming & Johan (2013) Exits
Central Findings in this Paper
Exits – Definitions and OverviewEuropean ExitsCanadian Exits
Australasian ExitsUS versus Canada Full Partial Exits
1. Legality facilitates VC-backed firms achieving IPO (supports Shleifer and Wolfenzon 2002 JFE)
2. Size of a country’s stock market unrelated to probability of an IPO (reject Black & Gilson 1998 JFE)
3. VC-backed firms also more likely to go IPO when:a. Higher market/book frimsb. Larger firmsc. Limited partnership VCs (not captive VCs)d. VCs with more capital (reputation)
33

© Cumming & Johan (2013) Exits
Primary Competing Hypotheses
Exits – Definitions and OverviewEuropean ExitsCanadian Exits
Australasian ExitsUS versus Canada Full Partial Exits
HypothesesDataEmpirical TestsConclusion
• Legality VC IPO exits Legality mitigates agency problems between outside
shareholders and entrepreneurs Shleifer and Wolfenzon (2002 JFE)
No empirical tests considered
• Stock Market Capitalization VC IPO exits Black and Gilson (1998 JFE)
No empirical tests considered
34

© Cumming & Johan (2013) Exits
Control Variables
Exits – Definitions and OverviewEuropean ExitsCanadian Exits
Australasian ExitsUS versus Canada Full Partial Exits
HypothesesDataEmpirical TestsConclusion
• Market & Institutional Conditions MSCI Returns Country dummy variables (esp. for moves to US)
• VC Fund Characteristics Age, size US-affiliation Captive versus Limited Partnership
• Entrepreneurial Firm & Investment Characteristics Industry market / book Size Syndication, Co-investment
35

© Cumming & Johan (2013) Exits
Data
Exits – Definitions and OverviewEuropean ExitsCanadian Exits
Australasian ExitsUS versus Canada Full Partial Exits
HypothesesDataEmpirical TestsConclusion
• 468 VC-backed companies, 1989 – 2001 Australia, China, Hong Kong, India, Indonesia, Malaysia, New
Zealand, Philippines, Singapore, South Korea, Taiwan, Thailand These countries’ VC investments in US-based entrepreneurial
firms Source: Wilshire and Associates, Ltd.
• Similar in scope to related VC papers with hand-collected datasets (typically 100 – 200 observations) E.g., Lerner and Schoar (2003)
36

© Cumming & Johan (2013) Exits
1989 1990 1991 1992 1993 1994 1995 1996 1997 1998 1999 2000 2001
Investment Years
Exit Years
0.00%
5.00%
10.00%
15.00%
20.00%
25.00%
30.00%
Percentageof All
Investments(of All Exits
for Subsampleof Exited
Investments)
Figure 1 . Investment and Exit Years in the Dataset
37

© Cumming & Johan (2013) Exits
-100 -75
-50
-25 0
25 50 7510
012
515
017
520
022
525
027
530
0
325
350
375
400
425
450
475
500
1000
No Exit
Partial Realization
Write-off
Private Exit
IPO
0
20
40
60
80
100
120
Numberof Exits
IRR (%)
Figure 2. Frequency of and Returns to Alternative Exit Outcomes
38

Table 2. Countries Represented in the Exits Database, and the Legality Components
Country LegalityTotal Market
Capitalization (Billions US$)
Average IRR
Median IRR
# IPOs#
Private Exits
# Write-offs
# Unexited Investments
New Zealand 21.55 19.69 0.905 0.365 4 10 0 1
Asia-Pacific VC Inv. in US
20.85 12380.03 0.480 0.064 9 49 21 38
Australia 20.44 242.26 0.164 0.189 27 43 23 22
Singapore 19.53 130.42 0.341 0.145 1 7 3 2
Hong Kong 19.11 278.95 -0.056 0.070 2 11 3 8
Malaysia 16.67 108.65 -0.168 -0.168 0 1 0 0
India 12.80 213.19 1.020 1.020 2 1 0 0
Thailand 12.94 70.02 -0.101 -0.101 0 9 3 0
China 19.23 461.42 -0.063 0.084 2 12 2 2
Taiwan 17.62 388.13 0.723 0.445 31 39 0 62
South Korea 14.23 260.00 0.145 0.250 0 3 0 0
Indonesia 9.16 25.68 -0.029 -0.015 0 14 0 0
Philippines 8.51 13.04 -0.003 -0.003 0 1 0 039

© Cumming & Johan (2013) Exits
Table 3. Difference Tests and Summary Statistics
Characteristic Tested # FirmsProportion
of IPO Exits
Difference Test Statistic
Full Sample 468 0.167
Average Legality Index > 20 (Excluding US and Taiwan) 132 0.235
2.303**
Average Legality Index < 20 (Excluding US and Taiwan) 87 0.080
Average Market Cap. > 300 (Excluding US and Taiwan) 22 0.182
0.082
Average Market Cap. < 300 (Excluding US and Taiwan) 197 0.173
US Only 117 0.077-2.574**
Taiwan 132 0.235
US Only 117 0.077-2.488**
Australia 115 0.235
Taiwan 132 0.2350.001
Australia 115 0.235
Taiwan 132 0.2351.990**
All Other Countries Excluding US, Australia 104 0.106 40

© Cumming & Johan (2013) Exits
Regressions (Tables 5 – 7)Regressions (Tables 5 – 7)
Exits – Definitions and OverviewEuropean ExitsCanadian Exits
Australasian ExitsUS versus Canada Full Partial Exits
HypothesesDataEmpirical TestsConclusion
Focus of Empirical Tests Probability of exit outcomes Multinomial regressions of the likelihood of an IPO versus private sale
transaction and versus write-off Other tests considered (not discussed today)
Robustness Tests Endogeneity, collinearity, heteroscedasticity Definitions of variables Single / multi-step estimation Binomial / multinomial logit estimates Heckman (1976, 1979) selection effects Other
41

© Cumming & Johan (2013) Exits
Multinomial Logit Regressions
Probability
IPO
Probability
Private Exit
Probability
Write-off
Log (Legality)
Log (Market Cap)
Market Conditions:
MSCI Variables
VC Fund Characteristics:
Captive VC
Log (VC Fund Capital)
Ent. Firm / Trans Char.:
Industry Market / Book
Log (Book Value)
Syndication
Co-Investment
0.854**
-0.0001
0.216
-0.030
0.181***
0.080**
-0.008
0.073
0.001
-1.389***
-0.058
-0.895***
-0.018
-0.217***
-0.070
0.015*
0.015
0.0001
-0.150
-0.011
0.352**
0.089**
-0.051**
0.008
-0.002
-0.084*
0.002***42
© Cumming & Johan (2013) Exits
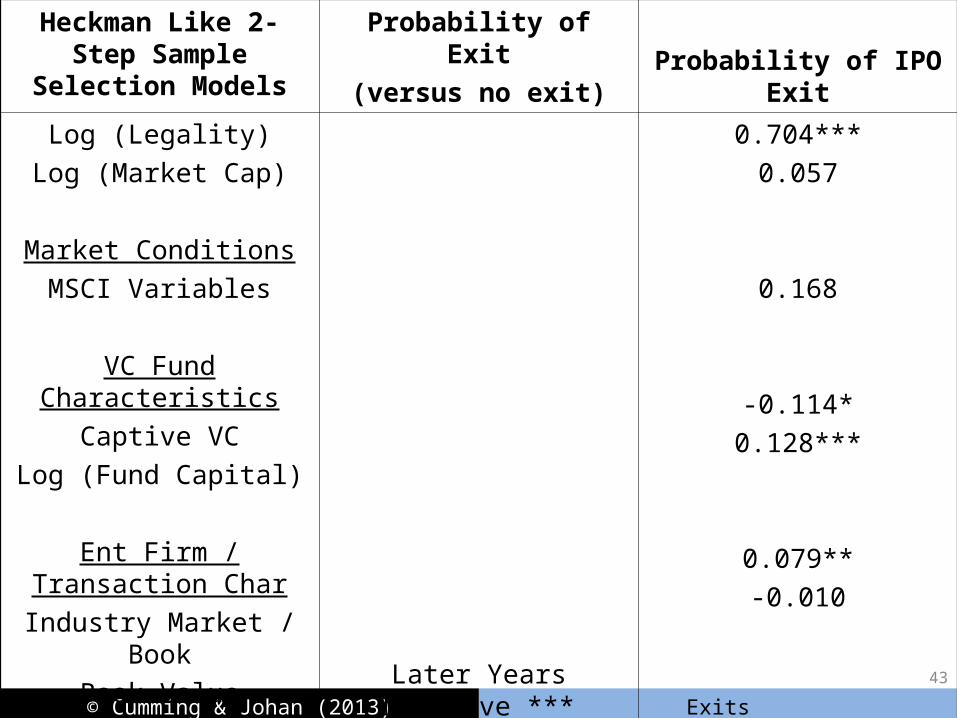
Heckman Like 2-Step Sample Selection Models
Probability of Exit
(versus no exit) Probability of IPO Exit
Log (Legality)
Log (Market Cap)
Market Conditions
MSCI Variables
VC Fund Characteristics
Captive VC
Log (Fund Capital)
Ent Firm / Transaction Char
Industry Market / Book
Book Value
Investment Year DummiesLater Years Negative ***
0.704***
0.057
0.168
-0.114*
0.128***
0.079**
-0.010
43

© Cumming & Johan (2013) Exits
Primary Results Re Legality
Exits – Definitions and OverviewEuropean ExitsCanadian Exits
Australasian ExitsUS versus Canada Full Partial Exits
HypothesesDataEmpirical TestsConclusion
• An increase in the Legality index from 20-21 (e.g., Hong Kong Australia)increases the probability of an IPO by 1.7%
• An increase in Legality from 10-11(e.g., Philippines Indonesia)increases the probability of an IPO by 3.3%
44

© Cumming & Johan (2013) Exits
Central Findings in this Paper
Exits – Definitions and OverviewEuropean ExitsCanadian Exits
Australasian ExitsUS versus Canada Full Partial Exits
HypothesesDataEmpirical TestsConclusion
1. Legality facilitates VC-backed firms achieving IPO (supports Shleifer and Wolfenzon 2002 JFE)
2. Size of a country’s stock market unrelated to probability of an IPO (reject Black & Gilson 1998 JFE)
3. VC-backed firms also more likely to go IPO when:a. Higher market/book frimsb. Larger firmsc. Limited partnership VCs (not captive VCs)d. VCs with more capital (reputation)
45

© Cumming & Johan (2013) Exits
Outliers and Further Research
Exits – Definitions and OverviewEuropean ExitsCanadian Exits
Australasian ExitsUS versus Canada Full Partial Exits
HypothesesDataEmpirical TestsConclusion
• High legality not necessary in special cases: Taiwan: successful VCs despite low legality index Entrepreneurial culture in Taiwan
• Legality not sufficient in special cases:Asia-Pacific VC investments in US entrepreneurial firms: less likely to go IPO Weak VC certification in IPOs across the Pacific
46

© Cumming & Johan (2013) Exits
Now…Full versus Partial Exits
Exits – Definitions and OverviewEuropean ExitsCanadian Exits
Australasian ExitsUS versus Canada Full Partial Exits
Source: Cumming and MacIntosh (2003 Journal of Banking and Finance)
2004 Ido Sarnat Best Paper Award in the Journal of Banking and Finance
47

© Cumming & Johan (2013) Exits
Full and Partial VC Exits
Exits – Definitions and OverviewEuropean ExitsCanadian Exits
Australasian ExitsUS versus Canada Full Partial Exits
DefinitionsHypothesesDataEmpirical TestsConclusion
• IPO, Secondary Sale and Buyback Exits:Full: dispose of investment within 1 year of 1st distribution;Partial: more than 1 year
• Acquisition Exits: Full: cash paymentPartial: (illiquid) shares
• Write-off Exits:Full: liquidationPartial: write-down
48
© Cumming & Johan (2013) Exits
Research Questions
Exits – Definitions and OverviewEuropean ExitsCanadian Exits
Australasian ExitsUS versus Canada Full Partial Exits
DefinitionsHypothesesDataEmpirical TestsConclusion
Does the extent of VC exit depend on:
1. Characteristics of Entrepreneurial Firm?
2. Duration of Venture Capital Investment?
3. Exit vehicle selected?
4. Regulatory Environment?
49
© Cumming & Johan (2013) Exits
Contributions
Exits – Definitions and OverviewEuropean ExitsCanadian Exits
Australasian ExitsUS versus Canada Full Partial Exits
DefinitionsHypothesesDataEmpirical TestsConclusion
1. Relate VC investment duration, exit vehicles, and entrepreneurial firm characteristics to exit strategies
2. Introduce the first empirical evidence on the extent of exit for the complete set of VC exits
3. Document the first cross-country evidence [Canada and the US] to illustrate the effect of legal and institutional constraints on efficient exit strategies
4. Consider implications for the risk & return to venture capital
50

© Cumming & Johan (2013) Exits
VC Exit Strategies
Exits – Definitions and OverviewEuropean ExitsCanadian Exits
Australasian ExitsUS versus Canada Full Partial Exits
DefinitionsHypothesesDataEmpirical TestsConclusion
• Minimizing agency costs (moral hazard and adverse selection) between entrepreneurial firm and its new owners maximizes the value of the firm upon VC exit
• Partial exits reduce informational asymmetry between entrepreneurial firm and new owner(s)
• Informational asymmetry and agency costs vary by:1. Length of VC investment,2. Entrepreneurial firm characteristics (e.g., the nature of its
assets, market & book values)3. Exit vehicle
51

© Cumming & Johan (2013) Exits
Exit Vehicle New Owners Info Asymmetry
IPO Public Shareholders
1 (Most Pronounced)
Acquisition 3rd Party 3
Secondary Sale 3rd Party & Entrepreneur
2
Buyback Entrepreneur 4
Write-off --- N/A
Exit Vehicles and Info AsymmetryInfo asymmetry Partial Exits
52

© Cumming & Johan (2013) Exits
Entrepreneurial Firm Characteristics-Market & Book Value-Technology Firm-Stage of Development-Other
Institutional andRegulatory Environment-Securities Regulation-Government Sponsorship of Venture Capital-Other
Venture Capital Investment Duration
Venture Capital Exit Vehicle
Extent of Venture Capital Exit
53

© Cumming & Johan (2013) Exits
Investment Duration and Exit Strategy
Exits – Definitions and OverviewEuropean ExitsCanadian Exits
Australasian ExitsUS versus Canada Full Partial Exits
DefinitionsHypothesesDataEmpirical TestsConclusion
• Longer VC investment duration mitigates informational asymmetries between the entrepreneurial firm and its new owners
• E.g., evidence that longer VC investment duration mitigates IPO underpricing [Megginson & Weiss (1991) JF]
• Longer investment duration less need for partial exit
54

© Cumming & Johan (2013) Exits
Firm Characteristics & Exit Strategy
Exits – Definitions and OverviewEuropean ExitsCanadian Exits
Australasian ExitsUS versus Canada Full Partial Exits
DefinitionsHypothesesDataEmpirical TestsConclusion
• Asset intangibility greater informational asymmetry partial exit
• Buyout transactions: VC facilitates transfer of ownership interest through a partial exit
• Other firm characteristics …
5555

© Cumming & Johan (2013) Exits
Legal & Institutional Barriers to Efficient Exit Strategies
Exits – Definitions and OverviewEuropean ExitsCanadian Exits
Australasian ExitsUS versus Canada Full Partial Exits
DefinitionsHypothesesDataEmpirical TestsConclusion
US: Private Venture Capital Funds
Canada: Government Sponsorship of VC (25% in1992 to 50% in 1995)
LSVCFs less able to credibly certify the quality of their investments to the new owner(s)
E.g., Must invest new funds within a few months!
Greater need to commit to a partial exit strategy to certify firm quality in Canada
56

© Cumming & Johan (2013) Exits
Securities Regulation & Institutional Differences
Exits – Definitions and OverviewEuropean ExitsCanadian Exits
Australasian ExitsUS versus Canada Full Partial Exits
DefinitionsHypothesesDataEmpirical TestsConclusion
More onerous in Canada (MacIntosh, 1994) less liquidity of SME securities in Canada
Legal uncertainty with hold-periods and escrow requirements in Canada “cumbersome and confusing for issuers and investors” (Tucker, 1999, CVCA Newsletter “Enterprise”)
Fewer institutional IPO purchasers in Canada, and Canadian underwriters are less specialized relative to their US counterparts
* Greater need for VCs to commit to partial IPO exits to certify firm quality in Canada
57

© Cumming & Johan (2013) Exits
Data
Exits – Definitions and OverviewEuropean ExitsCanadian Exits
Australasian ExitsUS versus Canada Full Partial Exits
DefinitionsHypothesesDataEmpirical TestsConclusion
• 112 U.S. Exits (Table 1a) • Source: Venture Economics• 1992-1995 (Approx 10% of Industry Exits)
• 134 European Exits (Table 1b)• Source: Macdonald & Associates• 1992-1995 (Approx 32% of Industry Exits)
58

© Cumming & Johan (2013) Exits
Data Limitations
Exits – Definitions and OverviewEuropean ExitsCanadian Exits
Australasian ExitsUS versus Canada Full Partial Exits
DefinitionsHypothesesDataEmpirical TestsConclusion
• Non-IPO exits (acquisitions, secondary sales, buybacks and writeoffs) are private exits
• Some private data not obtainable, such as exact timing of partial distributions
• But for all exit vehicles, we do know if VC exit was complete within 1 year of the first distribution
59
© Cumming & Johan (2013) Exits
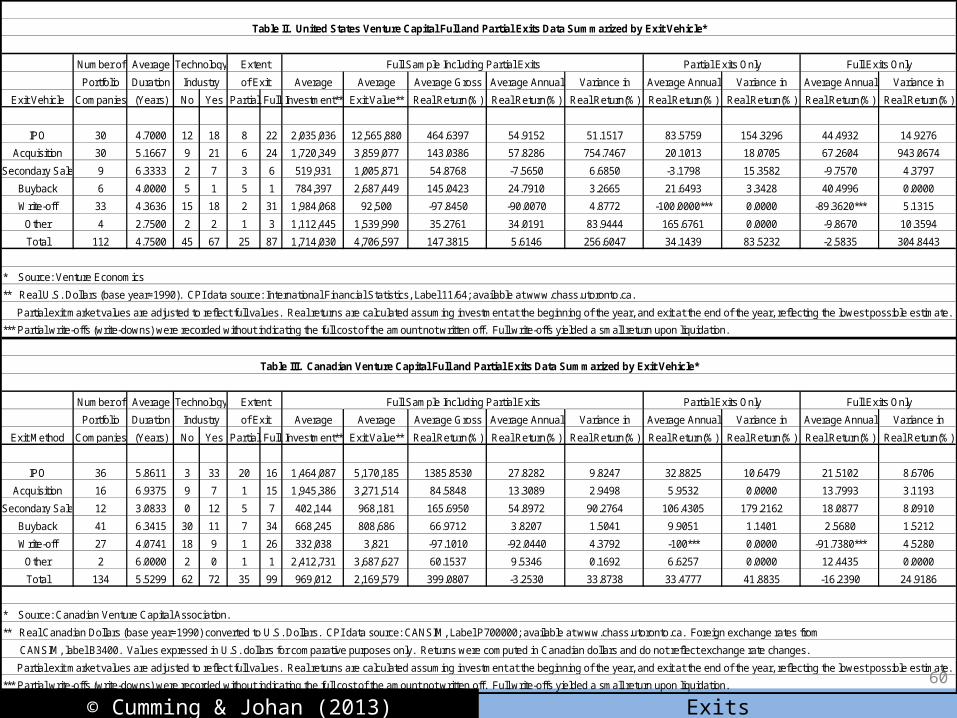
Table II. United States Venture Capital Full and Partial Exits Data Summarized by Exit Vehicle*
Number of Average Technology
Portfolio Duration Industry Average Average Average Gross Average Annual Variance in Average Annual Variance in Average Annual Variance in
Exit Vehicle Companies (Years) No Yes Partial Full Investment** Exit Value** Real Return(%) Real Return(%) Real Return(%) Real Return(%) Real Return(%) Real Return(%) Real Return(%)
IPO 30 4.7000 12 18 8 22 2,035,036 12,565,880 464.6397 54.9152 51.1517 83.5759 154.3296 44.4932 14.9276
Acquisition 30 5.1667 9 21 6 24 1,720,349 3,859,077 143.0386 57.8286 754.7467 20.1013 18.0705 67.2604 943.0674
Secondary Sale 9 6.3333 2 7 3 6 519,931 1,005,871 54.8768 -7.5650 6.6850 -3.1798 15.3582 -9.7570 4.3797
Buyback 6 4.0000 5 1 5 1 784,397 2,687,449 145.0423 24.7910 3.2665 21.6493 3.3428 40.4996 0.0000
Write-off 33 4.3636 15 18 2 31 1,984,068 92,500 -97.8450 -90.0070 4.8772 -100.0000*** 0.0000 -89.3620*** 5.1315
Other 4 2.7500 2 2 1 3 1,112,445 1,539,990 35.2761 34.0191 83.9444 165.6761 0.0000 -9.8670 10.3594
Total 112 4.7500 45 67 25 87 1,714,030 4,706,597 147.3815 5.6146 256.6047 34.1439 83.5232 -2.5835 304.8443
Table III. Canadian Venture Capital Full and Partial Exits Data Summarized by Exit Vehicle*
Number of Average Technology
Portfolio Duration Industry Average Average Average Gross Average Annual Variance in Average Annual Variance in Average Annual Variance in
Exit Method Companies (Years) No Yes Partial Full Investment** Exit Value** Real Return(%) Real Return(%) Real Return(%) Real Return(%) Real Return(%) Real Return(%) Real Return(%)
IPO 36 5.8611 3 33 20 16 1,464,087 5,170,185 1385.8530 27.8282 9.8247 32.8825 10.6479 21.5102 8.6706
Acquisition 16 6.9375 9 7 1 15 1,945,386 3,271,514 84.5848 13.3089 2.9498 5.9532 0.0000 13.7993 3.1193
Secondary Sale 12 3.0833 0 12 5 7 402,144 968,181 165.6950 54.8972 90.2764 106.4305 179.2162 18.0877 8.0910
Buyback 41 6.3415 30 11 7 34 668,245 808,686 66.9712 3.8207 1.5041 9.9051 1.1401 2.5680 1.5212
Write-off 27 4.0741 18 9 1 26 332,038 3,821 -97.1010 -92.0440 4.3792 -100*** 0.0000 -91.7380*** 4.5280
Other 2 6.0000 2 0 1 1 2,412,731 3,687,627 60.1537 9.5346 0.1692 6.6257 0.0000 12.4435 0.0000
Total 134 5.5299 62 72 35 99 969,012 2,169,579 399.0807 -3.2530 33.8738 33.4777 41.8835 -16.2390 24.9186
Partial Exits Only
Partial Exits Only
Partial exit market values are adjusted to reflect full values. Real returns are calculated assuming investment at the beginning of the year, and exit at the end of the year, reflecting the lowest possible estimate.
Partial exit market values are adjusted to reflect full values. Real returns are calculated assuming investment at the beginning of the year, and exit at the end of the year, reflecting the lowest possible estimate.
CANSIM, label B3400. Values expressed in U.S. dollars for comparative purposes only. Returns were computed in Canadian dollars and do not reflect exchange rate changes.
Extent Full Sample Including Partial Exits Full Exits Only
*** Partial write-offs (write-downs) were recorded without indicating the full cost of the amount not written off. Full write-offs yielded a small return upon liquidation.
of Exit
* Source: Canadian Venture Capital Association.
** Real Canadian Dollars (base year=1990) converted to U.S. Dollars. CPI data source: CANSIM, Label P700000; available at www.chass.utoronto.ca. Foreign exchange rates from
Full Sample Including Partial Exits
*** Partial write-offs (write-downs) were recorded without indicating the full cost of the amount not written off. Full write-offs yielded a small return upon liquidation.
** Real U.S. Dollars (base year=1990). CPI data source: International Financial Statistics, Label 11/64; available at www.chass.utoronto.ca.
* Source: Venture Economics
Extent
of Exit
Full Exits Only
60

© Cumming & Johan (2013) Exits
Differences in exit performance between Canada and U.S.
Exits – Definitions and OverviewEuropean ExitsCanadian Exits
Australasian ExitsUS versus Canada Full Partial Exits
DefinitionsHypothesesDataEmpirical TestsConclusion
• Lower risk and return in Canada relative to the US– Securities regulation– Government sponsorship of venture capital
• Partial exits typically associated with a higher risk and return– Selection effects: riskier ventures exited by a partial exit to
mitigate informational problems between the entrepreneurial firm and new owners
61

© Cumming & Johan (2013) Exits
Tables in next slides
Exits – Definitions and OverviewEuropean ExitsCanadian Exits
Australasian ExitsUS versus Canada Full Partial Exits
DefinitionsHypothesesDataEmpirical TestsConclusion
• Negative and significant: partial exit more likely than full exit (and vice versa)
• Table 4 considers the extent of exit for all exits together
• Table 5 considers the extent of exit for each exit vehicle separately
• Important results summarized thereafter below
62

© Cumming & Johan (2013) Exits
Coefficient t-statistic p-value* Coefficient t-statistic p-value* Coefficient t-statistic p-value*
Constant 2.5415 1.7109 0.0871 2.3416 1.5120 0.1305 1.7849 2.0421 0.0411
IPO -0.5653 -0.8049 0.4209 -2.2167 -2.2954 0.0217 -1.1766 -2.4555 0.0141
Secondary Sale -0.0745 -0.0767 0.9389 -2.5584 -2.1063 0.0352 -1.0788 -1.7274 0.0841
Buyback -3.2569 -2.4566 0.0140 -0.4808 -0.5334 0.5938 -0.8364 -1.5009 0.1334
Write-off 1.5403 1.6986 0.0894 0.5694 0.4243 0.6714 1.1194 1.5491 0.1214
Technology -1.4559 -2.1294 0.0332 0.3345 0.4744 0.6352 -0.6341 -1.5760 0.1150
Duration -0.0542 -0.4343 0.6641 -0.0973 -1.2427 0.2140 -0.0851 -1.6360 0.1018
Market/Book 0.0514 0.7094 0.4781 -0.1694 -1.7701 0.0767 -0.0283 -0.5932 0.5530
Seed 0.5762 0.4564 0.6481 1.4040 0.8697 0.3844 0.9533 1.1733 0.2407
Start-up 1.7609 1.2686 0.2046 0.3771 0.3286 0.7425 1.4116 1.8354 0.0664
Early Stage 2.1683 1.5422 0.1230 -0.5629 -0.4531 0.6505 1.0899 1.3588 0.1742
Expansion 0.1150 0.0941 0.9250 0.4802 0.4262 0.6700 0.7645 1.0686 0.2852
Fundraising -0.0003 -1.2266 0.2200 0.0003 0.3842 0.7008 -0.0001 -0.9457 0.3443
* Two-sided test.
Table 4. Logit Estimates of the Extent of Exits in Canada and the United States
United States Canada Full Sample Estimates
63

© Cumming & Johan (2013) Exits
Coefficient t-statistic p-value* Coefficient t-statistic p-value* Coefficient t-statistic p-value*
Constant -1.7464 -0.6011 0.5478 3.8845 1.4746 0.1403 -0.9414 -0.6502 0.5155
Technology -1.3741 -0.7716 0.4404 -1.0835 -0.6401 0.5221 -0.2668 -0.3236 0.7463
Duration 0.0232 0.1079 0.9141 0.0507 0.2950 0.7680 -0.0646 -0.6511 0.5150
Market/Book 0.1686 1.1524 0.2492 -0.5356 -2.3978 0.0165 -0.0269 -0.4409 0.6593
Seed -1.0031 -0.6911 0.4895 8.4458 1.8914 0.0586 0.2351 0.2283 0.8194
Start-up 0.9551 0.5821 0.5605 0.1227 0.1052 0.9162 0.7264 0.9571 0.3385
Early Stage 2.8746 1.4570 0.1451 -1.9273 -1.4485 0.1475 0.2104 0.2799 0.7795
Fundraising 0.00002 0.0255 0.9796 -0.0003 -0.1914 0.8482 0.0004 1.4318 0.1522
Market Conditions 4.3553 1.9961 0.0459 -1.3877 -0.8020 0.4225 1.1070 1.0651 0.2868
Preplanned Exit 1.9696 1.2263 0.2201 -0.6243 -0.3426 0.7319 1.1470 1.2025 0.2292
Coefficient t-statistic p-value* Coefficient t-statistic p-value* Coefficient t-statistic p-value*
Constant 16.3158 2.0161 0.0438 3.9083 1.3993 0.1617 3.9789 2.9397 0.0033
Technology -5.7817 -1.7299 0.0836 N/A** N/A** N/A** -0.4488 -0.4577 0.6471
Duration -1.7639 -1.9076 0.0564 -0.1461 -0.6908 0.4897 -0.2197 -1.6636 0.0962
Market/Book -0.6524 -1.8228 0.0683 -0.0783 -0.1057 0.9158 -0.2134 -1.5004 0.1335
Market Conditions -1.8654 -0.9307 0.3520 N/A** N/A** N/A** -1.1553 -1.0449 0.2961
* Two-sided test.
** Not Applicable. Variable excluded to avoid collinearity problems. Similarly, variables not shown were excluded to avoid collinearity problems.
Table 5b. Logit Estimates of the Likelihood of Cash Consideration in Venture Capital Acquisition Exits in Canada and the United States
United States Canada Full Sample Estimates
Table 5a. Logit Estimates of the Extent of Venture Capital IPO Exits in Canada and the United States
United States Canada Full Sample Estimates
64

© Cumming & Johan (2013) Exits
Coefficient t-statistic p-value* Coefficient t-statistic p-value* Coefficient t-statistic p-value*
Constant 8.7239 0.8487 0.3960 -0.2319 -0.2139 0.8306 3.4863 1.4486 0.1474
Duration 0.1528 0.4005 0.6888 0.5147 1.0835 0.2786 0.2716 0.9795 0.3273
Market/Book -4.5011 -0.7136 0.4755 -0.1801 -0.6207 0.5348 -0.4544 -1.7349 0.0828
Fundraising -0.0014 -0.8524 0.3940 N/A** N/A** N/A** -0.0010 -1.2967 0.1947
Market Conditions -3.2965 -0.6533 0.5136 N/A** N/A** N/A** -1.7177 -1.0815 0.2795
Coefficient t-statistic p-value* Coefficient t-statistic p-value* Coefficient t-statistic p-value*
Constant -4.1615 -0.8387 0.4017 3.3246 1.8021 0.0715 4.9667 2.9692 0.0030
Technology N/A** N/A** N/A** -0.4461 -0.4109 0.6812 -0.0239 -0.0241 0.9808
Duration -1.0598 -0.4219 0.6731 -0.2537 -1.9289 0.0537 -0.2151 -1.8143 0.0696
Market/Book 1.7273 0.5900 0.5552 -0.0703 -0.3117 0.7552 -0.0309 -0.1558 0.8762
Fundraising N/A** N/A** N/A** 0.0017 1.2522 0.2105 -0.0014 -2.1257 0.0335
Preplanned N/A** N/A** N/A** -2.3292 -1.4464 0.1481 -1.9042 -1.3994 0.1617
Unsolicited Offer N/A** N/A** N/A** -1.0873 -0.7297 0.4656 -0.4738 -0.3403 0.7336
Coefficient t-statistic p-value* Coefficient t-statistic p-value* Coefficient t-statistic p-value*
Constant 3.7177 2.0021 0.0453 5.9173 2.1892 0.0286 4.5620 3.3746 0.0007
Duration -0.2676 -0.7603 0.4471 -0.5285 -1.5436 0.1227 -0.4225 -1.7465 0.0807
Market Conditions 0.1290 0.0875 0.9303 N/A** N/A** N/A** 0.5814 0.4075 0.6836
* Two-sided test.
** Not Applicable. Variable excluded to avoid collinearity problems. Similarly, variables not shown were excluded to avoid collinearity problems.
Table 5c. Logit Estimates of the Extent of Venture Capital Secondary Sale Exits in Canada and the United States
United States Canada Full Sample Estimates
Table 5d. Logit Estimates of the Extent of Venture Capital Buyback Exits in Canada and the United States
United States Canada Full Sample Estimates
Table 5e. Logit Estimates of the Likelihood of Venture Capital Write-offs versus Write-downs in Canada and the United States
United States Canada Full Sample Estimates
65

© Cumming & Johan (2013) Exits
Conclusions (1 of 2)
Exits – Definitions and OverviewEuropean ExitsCanadian Exits
Australasian ExitsUS versus Canada Full Partial Exits
DefinitionsHypothesesDataEmpirical TestsConclusion
• Partial Exits Mitigate informational asymmetries between the entrepreneurial
firm & its new owners But very little overlap in cross-country results – WHY?
• US: Partial exits for buybacks, buyouts, technology firms
• Canada – Greater Legal & Institutional Barriers: Greater need for partial exits for IPOs and secondary sales Inefficient exit strategies for longer VC duration, and technology firms
66

© Cumming & Johan (2013) Exits
Conclusions (2 of 2)
Exits – Definitions and OverviewEuropean ExitsCanadian Exits
Australasian ExitsUS versus Canada Full Partial Exits
DefinitionsHypothesesDataEmpirical TestsConclusion
• Full/Partial Selection Effects: Affect the risk and return to venture capital
• US: Higher risk and higher return Less onerous securities regulation Private funds
• Canada: Lower risk and lower return More onerous securities legislation Government sponsorship of venture capital
67
Top Related