ZUCKER STÄRKE STARCH FRUCHT FRUIT - agrana.com · ZUCKER STÄRKE FRUCHT Der natürliche Mehrwert...
29
SUGAR STARCH FRUIT The natural upgrade AGRANA Beteiligungs-AG Results for the first three quarters of 2017|18 Presentation for investors and analysts Vienna, 11 January 2018
Transcript of ZUCKER STÄRKE STARCH FRUCHT FRUIT - agrana.com · ZUCKER STÄRKE FRUCHT Der natürliche Mehrwert...

ZUCKERSTÄRKEFRUCHTDer natürliche Mehrwert
SUGARSTARCHFRUIT
The natural upgrade
AGRANA Beteiligungs-AGResults for the first three quarters of 2017|18Presentation for investors and analysts
Vienna, 11 January 2018

Q1-3 2017|18 OVERVIEW
Leading
SUGARSUPPLIERin Central, Eastern & Southeastern Europe
Major European manufacturer of customised
STARCHPRODUCTS and bioethanol
World market leaderin the production of
FRUITPREPARATIONSand largest manufacturer offruit juice concentrates in Europe
Significant improvement in Group EBIT, with all segments going up
But EBIT in Q3 2017|18 (3 months) went down by 13.3% year-on-year
Revenue: € 2,010.6 m (up 2.2%; Q1-3 prior year: € 1,967.5 m)
EBIT: € 171.6 m (up 24.6%; Q1-3 prior year: € 137.7 m)
EBIT margin: 8.5% (Q1-3 prior year: 7.0%)
~8,800Employees (FTEs)
as of 30 Nov. 2017
57Production
sites€ ~2.6 billion
Group revenuein 2016|17 FY
2AGRANA Results for Q1-3 2017|18, 11 January 2018
as of 30 Nov. 2017

532.5 550.6
551.9 576.0
883.1 884.0
Q1-3 2016|17 Q1-3 2017|18
Fruit
Starch
Sugar
AGRANA Results for Q1-3 2017|18, 11 January 2018 3
Q1-3 2017|18 VS PRIOR YEAR
REVENUE BY SEGMENT
GROUP
27.4%
28.6%
44.0%
Q1-3 2017|18
€m2,010.6
+0.1%
27.1%
28.0%
44.9%
Q1-3 2016|17
1,967.5

23.142.1
58.0
70.4
56.6
59.1
Q1-3 2016|17 Q1-3 2017|18
Fruit
Starch
Sugar
AGRANA Results for Q1-3 2017|18, 11 January 2018 4
Q1-3 2017|18 VS PRIOR YEAR
EBIT BY SEGMENT
GROUP
24.5%
41.0%
34.5%
Q1-3 2017|18
€m 171.6
16.8%
42.1%41.1%
Q1-3 2016|17
6.4%
EBIT margin
4.3%
10.5%
6.7%
7.6%
12.2%
137.7
7.0% 8.5%

17.825.4
36.2
41.2
15.6
28.9
Q1-3 2016|17 Q1-3 2017|18
Sugar Starch Fruit
AGRANA Results for Q1-3 2017|18, 11 January 2018 5
69.6
MOST IMPORTANT PROJECTS IN THE GROUP
INVESTMENT OVERVIEW
Q1-3 2017|18
FRUIT• Various projects across all 42 production sites (including
construction of the new, second fruit preparations plant in China and a new carrot concentrate production line in Hungary)
STARCH• Expansion of corn processing in Aschach, Austria• Expansion of starch saccharification facilities in Aschach• Construction and commissioning of a new spray drying
plant in Aschach• Increase of potato processing capacity in Gmünd,
Austria• Installation of potato fibre dryer in Gmünd
SUGAR• Sugar drying in Leopoldsdorf, Austria• Replacement of two beet diffusers in Tulln, Austria• Optimisation of the cooling crystallisation in Sereď,
Slovakia
€m
95.5
GROUP

SUGARSEGMENT
6

AGRANA Results for Q1-3 2017|18, 11 January 2018 7
MARKET ENVIRONMENT IN Q1-3 2017|18
SUGAR SEGMENT
World sugar market After two deficit years a production surplus is forecasted for SMY 2017|18 Sugar quotations at commodity exchanges follow a bearish trend mainly
driven by a surplus in the world sugar balance linked to positive harvest outlooks in major beet and cane production regions such as the EU, India and other Asian countries
EU sugar market SMY 2017|18: +16% increase in the sugar beet planting area, ~77 tonnes of
beet per hectare -> sugar production significantly above five year’s average expected
European Commission is forecasting EU sugar production at about 21 million tonnes for SMY 2017|18
EU policy Since 1 October 2017, the European sugar industry is operating in a new
environment End of the production quotas for sugar and isoglucose and abolition of the
minimum beet prices

AGRANA Results for Q1-3 2017|18, 11 January 2018
RAW SUGAR & WHITE SUGAR
SUGAR QUOTATION
1 January 2006 – 9 January 2018 (USD)
9 Jan. 2018:386.8 USD/t
= 322.5 EUR/t
9 Jan. 2018:322.8 USD/t
= 269.1 EUR/t
White sugar (LIFFE)
Raw sugar (ICE)
7-years-low:Raw sugar, 24/8/15: 229.1 USD/t
White sugar, 24/8/15: 333.6 USD/t
1/1/2009
8
4-years-high:Raw sugar, 5/10/16: 524.9 USD/t
White sugar, 28/9/16: 612.0 USD/t
2017|18 FY

AGRANA Results for Q1-3 2017|18, 11 January 2018
SUGAR IN THE EU
MONTHLY AVERAGE PRICES(DECEMBER 2008 TO DECEMBER 2017; € PER TONNE)
QS - Min: 414 € per tonne (February, June and July 2015)QS - Max: 738 € per tonne (January 2013)
Source: European Commission, Sugar Price Reporting (as of 21 December 2017) and SugarOnline (as of 2 January 2018)
9
Recent decline in October 2017 -> first month of the new SMY 2017|18 (without quotas and minimum beet prices)

532.5 550.6
Q1-3 2016|17 Q1-3 2017|18
AGRANA Results for Q1-3 2017|18, 11 January 2018 10
FINANCIAL RESULTS FOR Q1-3 2017|18
SUGAR SEGMENT
23.142.1
Q1-3 2016|17 Q1-3 2017|18
REVENUE slightly up at € 550.6 million
Sugar segment's revenue was 3.4% up compared to the year-ago period
Positive effects came from an increase in sugar sales prices relative to the first nine months of the prior year, and by slightly higher sales quantities
EBIT increased significantly to € 42.1 million
EBIT rose still benefiting in the first six months from an improved sales price environment compared to the year-earlier period
In the financial 3rd quarter – the first to fall into the new 2017|18 SMY – the earnings measure operating profit declined by 16.5%
Exceptional items (€ 3.6 m) included expenses for reorganisation measures
REVENUE€m
EBIT€m

STARCHSEGMENT
11

AGRANA Results for Q1-3 2017|18, 11 January 2018 12
MARKET ENVIRONMENT IN Q1-3 2017|18
STARCH SEGMENT
Food starch segment was steady in terms of sales quantities; prices for native and modified starch products moved upward
Principal upside driver in non-food starches was the demand from the paper and corrugated board industry -> steady growth of the online mail order market, which stimulates consumption of corrugated board and container board
Concerning starch saccharification products in general and isoglucose in particular, there is high competitive pressure due to the liberalisation of the sugar market since October 2017
Bioethanol business remains volatile; in the first half of 2017|18, closer correspondence between supply and demand in the EU -> stabilisation in prices; since the last quarter of the 2017 calendar year, quotations are visibly trending lower again -> downside market pressure in the European ethanol market
By-products prices on a firm level with high-protein products and vital wheat gluten in particular

AGRANA Results for Q1-3 2017|18, 11 January 2018
WHEAT & CORN (EURONEXT, PARIS)
COMMODITY PRICES
1 January 2006 – 9 January 2018 (EUR)
9 Jan. 2018:158.5 EUR/t
9 Jan. 2018:161.0 EUR/t
Corn (Paris)
Wheat (Paris)
13
2017|18 FY

0
100
200
300
400
500
600
700
800
900Average daily ethanol price in EUR/m³ (Ethanol T2 FOB Rdam EUR/cm Platts)
Average daily petrol price in EUR/m³ (PREM UNL-10ppm/FOB RDAM BARG Platts)
AGRANA Results for Q1-3 2017|18, 11 January 2018
1 JANUARY 2008 – 8 JANUARY 2018 (EUR)
DEVELOPMENT OF ETHANOL PRICES
14
8 January 2018:
Ethanol: 479.5 EUR/m3
Petrol: 398.4 EUR/m3

551.9576.0
Q1-3 2016|17 Q1-3 2017|18
AGRANA Results for Q1-3 2017|18, 11 January 2018 15
FINANCIAL RESULTS FOR Q1-3 2017|18
STARCH SEGMENT
58.070.4
Q1-3 2016|17 Q1-3 2017|18
REVENUE at € 576.0 m slightly above prior year
Growth of 4.4% compared to the previous year period
Key positive drivers were higher sales volumes of starches and saccharification products and higher bioethanol prices than in the prior-year nine-month comparative period
EBIT significantly up to € 70.4 million
Besides the higher bioethanol quotations, other drivers of the earnings growth were productivity gains, favourable raw material prices and lower energy prices
Significant EBIT reduction in the third quarter yoy was the result of higher raw material costs (from the 2017 campaign); further factor was, that in October 2017 the new capacity added in Aschach, Austria, was commissioned
REVENUE€m
EBIT€m

FRUITSEGMENT
16

AGRANA Results for Q1-3 2017|18, 11 January 2018 17
MARKET ENVIRONMENT IN Q1-3 2017|18
FRUIT SEGMENT
Fruit preparations
Global market for spoonable fruit yoghurts is expected to grow at about 1% in the 2017 calendar year(1)
Major markets such as Europe and North America are saturated Expanding markets in the Middle East & Africa (growth of 5.1%) and Asia (growth
of 4.7%)(1)
Drinkable yoghurts continue to show a worldwide growth trend of 5.3%(1)
Global market for ice-cream continues to grow by about 2% p.a. until 2020(1)
Stable growth is also expected in the bakery sector
Fruit juice concentrates
European prices for apple juice concentrate stabilised at a solid level in the first half of 2017|18 as a result of higher demand and limited quantities in supply out of the main growing regions
Low crop volumes in the major apple production regions Poland, Hungary, Germany and Italy caused prices of concentrate from the now-completed 2017 apple campaign to rise significantly from the prior year
Marketing of berry juice concentrates from the 2017 crop is largely complete
(1) Euromonitor data

883.1 884.0
Q1-3 2016|17 Q1-3 2017|18
AGRANA Results for Q1-3 2017|18, 11 January 2018 18
FINANCIAL RESULTS FOR Q1-3 2017|18
FRUIT SEGMENT
56.6 59.1
Q1-3 2016|17 Q1-3 2017|18
REVENUE stable at € 884.0 million
Fruit preparations: small increase in sales volumes and somewhat higher selling prices added up to slight revenue growth
Fruit juice concentrates: revenue decreased as a result of lower raw material prices and a reduction in concentrate prices for product from the 2016 crop compared to 2015
EBIT slightly higher than in prior year
While the fruit preparations activities generated significant earnings growth, EBIT in the fruit juice concentrate business was down in the third quarter as a result of a reduced operating performance -> idle-capacity costs amid lower availability of apples
REVENUE€m
+0.1%
EBIT€m
CONSOLIDATED FINANCIAL STATEMENTS
Q1-3 2017|18
19

CONSOLIDATED INCOME STATEMENT
AGRANA Results for Q1-3 2017|18, 11 January 2018 20
€m (condensed)
Q1-3 2017|18
Q1-3 2016|17
Q3 2017|18
Q3 2016|17
Revenue 2,010.6 1,967.5 648.5 647.2
EBITDA1 213.8 183.9 64.2 69.7
Operating profit before except. items and results of equity-accounted JV 149.4 121.6 36.0 43.3
Share of results of equity-accounted JV 25.8 23.7 5.8 8.7
Exceptional items (3.6) (7.6) (0.8) (4.7)
EBIT 171.6 137.7 41.0 47.3
EBIT margin 8.5% 7.0% 6.3% 7.3%
Net financial items (11.0) (13.3) (2.1) (3.0)
Profit before tax 160.6 124.4 38.9 44.3
Income tax expense (33.0) (29.2) (8.6) (11.7)
Profit for the period 127.6 95.2 30.3 32.6
Attributable to shareholders of the parent 124.6 89.3 30.6 29.5
Earnings per share € 7.98 € 6.292 € 1.96 € 2.082
1 EBITDA represents operating profit before exceptional items, results of equity-accounted joint ventures, and operating depreciation and amortisation.
2 This figure for earnings per share in the year-earlier period is calculated on the basis of the 14,202,040 shares outstanding at that time (number of shares outstanding at 30 Nov. 2017: 15,622,244)

EXCEPTIONAL ITEMS IN THE SUGAR SEGMENT
AGRANA Results for Q1-3 2017|18, 11 January 2018 21
Exceptional items in the first three quarters of 2017|18 amounted to a net expense of € 3.6 million and resulted largely from costs of restructuring measures
Q1-Q3 prior year: net expense of € 7.6 million, on negative one-time effects in Romania
€m (condensed)
Q1-3 2017|18
Q1-3 2016|17
Q3 2017|18
Q3 2016|17
Exceptional items (3.6) (7.6) (0.8) (4.7)

ANALYSIS OF NET FINANCIAL ITEMS
AGRANA Results for Q1-3 2017|18, 11 January 2018 22
€m
Q1-3 2017|18
Q1-3 2016|17 Change
Net interest expense (6.0) (6.9) +13.0%
Currency translation differences (2.7) (0.7) >-100%
Other financial items (2.3) (5.7) +59.7%
Total (11.0) (13.3) +17.3%
Net interest expense: lower amount of net debt + lower interest rates on debt
Currency translation differences: deterioration mainly driven by the currencies ARS (Argentina) and BRL (Brazil) + USD deposits
Other financial items: improvement resulted from the base effect of a prior-year impairment charge on a current finance receivable in Ukraine in the Fruit segment

CONSOLIDATED CASH FLOW STATEMENT
AGRANA Results for Q1-3 2017|18, 11 January 2018
€m (condensed)
Q1-3 2017|18
Q1-3 2016|17 Change
Operating cash flow before changes in working capital 243.2 186.8 +30.2%
Changes in working capital (6.7) (7.9) +15.2%
Total of interest paid/received and tax paid (38.9) (25.8) -50.8%
Net cash from operating activities 197.6 153.1 +29.1%
Net cash (used in) investing activities (96.1) (72.4) -32.7%
Net cash (used in) financing activities (168.3) (101.8) -65.3%
Net (decrease) in cash and cash equivalents (66.7) (21.1) >-100%
23

CONSOLIDATED BALANCE SHEET
AGRANA Results for Q1-3 2017|18, 11 January 2018
€m (condensed) 30 Nov. 2017 28 Feb. 2017 Change
Non-current assets 1,173.9 1,135.3 +3.4%
Current assets 1,279.3 1,346.1 -5.0%
Total assets 2,453.2 2,481.4 -1.1%
Equity 1,444.4 1,411.9 +2.3%
Non-current liabilities 324.5 296.6 +9.4%
Current liabilities 684.3 772.9 -11.5%
Total equity and liabilities 2,453.2 2,481.4 -1.1%
Equity ratio 58.9% 56.9% +2.0pp
Net debt 226.0 239.9 -5.8%
Gearing 15.6% 17.0% -1.4pp
24

OUTLOOK2017|18
25

AGRANA Results for Q1-3 2017|18, 11 January 2018 26
AGRANA GROUP
OUTLOOK FOR 2017|18
For the full 2017|18 financial year, AGRANA expects Group revenueto rise slightly and EBIT to increase significantly
Total investment across the three business segments in the financial year, at approximately € 140 million, will significantly exceed the budgeted depreciation of about € 90 million
Revenue 2017|18
EBIT 2017|18
AGRANA Group
EBIT Guidance confirmed
AGRANA Results for Q1-3 2017|18, 11 January 2018 27
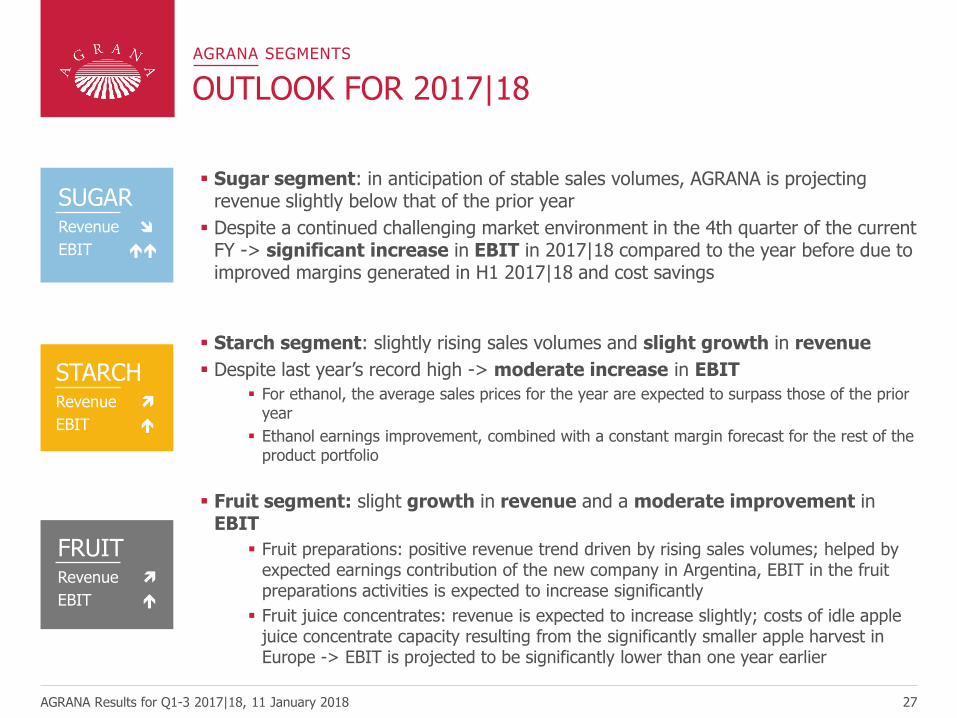
AGRANA SEGMENTS
OUTLOOK FOR 2017|18
Starch segment: slightly rising sales volumes and slight growth in revenue
Despite last year’s record high -> moderate increase in EBIT
For ethanol, the average sales prices for the year are expected to surpass those of the prior year
Ethanol earnings improvement, combined with a constant margin forecast for the rest of the product portfolio
Fruit segment: slight growth in revenue and a moderate improvement inEBIT
Fruit preparations: positive revenue trend driven by rising sales volumes; helped by expected earnings contribution of the new company in Argentina, EBIT in the fruit preparations activities is expected to increase significantly
Fruit juice concentrates: revenue is expected to increase slightly; costs of idle apple juice concentrate capacity resulting from the significantly smaller apple harvest in Europe -> EBIT is projected to be significantly lower than one year earlier
Sugar segment: in anticipation of stable sales volumes, AGRANA is projecting revenue slightly below that of the prior year
Despite a continued challenging market environment in the 4th quarter of the current FY -> significant increase in EBIT in 2017|18 compared to the year before due to improved margins generated in H1 2017|18 and cost savings
SUGARRevenue
EBIT
FRUITRevenue
EBIT
STARCHRevenue
EBIT

AGRANA Results for Q1-3 2017|18, 11 January 2018 28
2018|19
FINANCIAL CALENDAR
8 May 2018
Results for full year 2017|18 (annual results press conference)
26 June 2018
Record date for Annual General Meeting participation
6 July 2018
Annual General Meeting in respect of 2017|18
11 July 2018
Ex-dividend date
12 July 2018
Results for first quarter of 2018|19
12 July 2018
Record date for dividend
13 July 2018
Dividend payment date
11 October 2018
Results for first half of 2018|19
10 January 2019
Results for first three quarters of 2018|19

29
DISCLAIMER
AGRANA Results for Q1-3 2017|18, 11 January 2018
This presentation is being provided to you solely for your information and may not be reproduced or further distributed to any other person or published, in whole or in part, for any purpose. This presentation comprises the written materials/slides for a presentation concerning AGRANA Beteiligungs-AG (“Company”) and its business.
This presentation does not constitute or form part of any offer or invitation to sell or issue, or any solicitation of any offer to purchase or subscribe for, any shares in the Company, nor shall it or any part of it form the basis of, or be relied on in connection with, any contract or investment decision.
This presentation includes forward-looking statements, i.e. statements that are not historical facts, including statements about the Company's beliefs and expectations and the Company's targets for future performance are forward-looking statements. These statements are based on current plans, estimates and projections, and therefore investors should not place undue reliance on them. Forward-looking statements speak only as of the date they are made, and the Company undertakes no obligation to update publicly any of them in light of new information or future events.
Although care has been taken to ensure that the facts stated in the presentation are accurate, and that the opinions expressed are fair and reasonable, the contents of this presentation have not been verified by the Company no representation or warranty, express or implied, is given by or on behalf of the Company any of its respective directors, or any other person as to the accuracy or completeness of the information or opinions contained in this presentation. Neither the Company nor any of its respective members, organs, representatives or employees or any other person accepts any liability whatsoever for any loss howsoever arising from any use of this presentation or its contents or otherwise arising in connection therewith.
Quantitative definitions of selected common modifying words used:
Modifier Visualisation Numerical rate of change
Steady 0% up to 1%, or 0% to -1%
Slight(ly) or More than 1% and up to 5%, or less than -1% and not less than -5%
Moderate(ly) or More than 5% and up to 10%, or less than -5% and not less than -10%
Significant(ly) or More than 10%, or less than -10%