Zoetrope: Interacting with the Ephemeral Web · Zoetrope: Interacting with the Ephemeral Web ......
10
Zoetrope: Interacting with the Ephemeral Web Eytan Adar † , Mira Dontcheva ‡ , James Fogarty † , and Daniel S. Weld † † Computer Science & Engineering DUB Group, University of Washington Seattle, WA 98195 {eadar, jfogarty, weld}@cs.washington.edu ‡ Advanced Technology Labs Adobe Systems San Francisco, CA 94103 [email protected] ABSTRACT The Web is ephemeral. Pages change frequently, and it is nearly impossible to find data or follow a link after the underlying page evolves. We present Zoetrope, a system that enables interaction with the historical Web (pages, links, and embedded data) that would otherwise be lost to time. Using a number of novel interactions, the temporal Web can be manipulated, queried, and analyzed from the context of familar pages. Zoetrope is based on a set of operators for manipulating content streams. We describe these primitives and the associated indexing strategies for handling temporal Web data. They form the basis of Zoetrope and enable our construction of new temporal interactions and visualizations. ACM Classification: H5.2 [Information interfaces and presentation]: User Interfaces. - Graphical user interfaces. Keywords: Web, temporal informatics, Web extraction INTRODUCTION The World-Wide Web is highly dynamic, evolving with surprising speed over time. News stories, Wikipedia articles, social network profiles, and corporate pages are continually updated. Automatically generated pages, whether driven by back-end inventory-control systems (e.g., travel and e-commerce sites) or real-time sensor streams (e.g., traffic, weather, and webcams) may change even more quickly. In contrast, most Web usage is restricted to the Web’s most recent state. People access the Web through browsers that, with the exception of simple caching, provide access only to the Web’s present state. Although search engines provide quick access to a vast corpus, retrieval is again limited to the most recent snapshot recorded by the underlying crawler. The headlines on today’s CNN homepage will be gone tomorrow, and yesterday’s price for a book on Amazon is likely irretrievable today. Even if historical data still exists, it may be aggregated into averages or split among many webpages. For a person who does not have access to historical data, or would find it difficult or impossible to recreate, the Web is primarily one-dimensional, containing only one version of any page. The current lack of support for temporal access to the Web makes it difficult or impossible to find, analyze, extract, and compare historical information. Permission to make digital or hard copies of all or part of this work for personal or classroom use is granted without fee provided that copies are not made or distributed for profit or commercial advantage and that copies bear this notice and the full citation on the first page. To copy otherwise, to republish, to post on servers or to redistribute to lists, requires prior specific permission and/or a fee. UIST’08, October 19–22, 2008, Monterey, CA, USA.. Copyright 2008 ACM 978-1-59593-975-3/08/10 ...$5.00. Figure 1: Temporal lenses include a slider for accessing previous versions, a scented widget that shows the location of available content, and buttons for creating visualizations and binding lenses together. This paper presents Zoetrope, a tool for interacting with the extended history of the World Wide Web. With Zoetrope, one can explore past versions of entire pages or place lenses (Figure 1) on any part of a webpage to scan backwards through time (e.g., to see all previous top headlines on CNN’s page). Lenses can be filtered with keyword and other queries or bound together to explore correlated historical data. To support analysis of this data, Zoetrope provides a number of visualizations for the extracted content. Because temporal Web data is not currently available at fine granularity, Zoetrope also includes a set of crawling and indexing technologies for obtaining high-resolution temporal data. We use an experimental dataset of 250 webpages from a range of domains and websites (news, sports, weather, entertainment, etc.) crawled at one-hour intervals for more than a month. By providing a variety of lenses, filters, and visualizations that can be combined and composed in powerful ways, Zoetrope presents a new way to think about historical Web data. As a tool, Zoetrope allows anyone to explore the Web over time. Furthermore, Zoetrope provides developers a mechanism for easily exploring new applications and interactions. The contributions of our work include: • a novel visual programming toolkit and a set of interactions for rapidly building and testing temporal Web queries, • a semantics for temporal data streams, • a set of recomposable operators to manipulate temporal data streams, • indexing structures for fast processing and interaction with Web content over time, • and a unique dataset collected by a new crawler design.
Transcript of Zoetrope: Interacting with the Ephemeral Web · Zoetrope: Interacting with the Ephemeral Web ......
Zoetrope: Interacting with the Ephemeral Web
Eytan Adar†, Mira Dontcheva‡, James Fogarty†, and Daniel S. Weld†
†Computer Science & EngineeringDUB Group, University of Washington
Seattle, WA 98195{eadar, jfogarty, weld}@cs.washington.edu
‡Advanced Technology LabsAdobe Systems
San Francisco, CA [email protected]
ABSTRACTThe Web is ephemeral. Pages change frequently, and itis nearly impossible to find data or follow a link after theunderlying page evolves. We present Zoetrope, a systemthat enables interaction with the historical Web (pages, links,and embedded data) that would otherwise be lost to time.Using a number of novel interactions, the temporal Web canbe manipulated, queried, and analyzed from the context offamilar pages. Zoetrope is based on a set of operators formanipulating content streams. We describe these primitivesand the associated indexing strategies for handling temporalWeb data. They form the basis of Zoetrope and enable ourconstruction of new temporal interactions and visualizations.
ACM Classification: H5.2 [Information interfaces andpresentation]: User Interfaces. - Graphical user interfaces.
Keywords: Web, temporal informatics, Web extractionINTRODUCTIONThe World-Wide Web is highly dynamic, evolving withsurprising speed over time. News stories, Wikipedia articles,social network profiles, and corporate pages are continuallyupdated. Automatically generated pages, whether drivenby back-end inventory-control systems (e.g., travel ande-commerce sites) or real-time sensor streams (e.g., traffic,weather, and webcams) may change even more quickly.
In contrast, most Web usage is restricted to the Web’s mostrecent state. People access the Web through browsers that,with the exception of simple caching, provide access only tothe Web’s present state. Although search engines providequick access to a vast corpus, retrieval is again limitedto the most recent snapshot recorded by the underlyingcrawler. The headlines on today’s CNN homepage will begone tomorrow, and yesterday’s price for a book on Amazonis likely irretrievable today. Even if historical data stillexists, it may be aggregated into averages or split amongmany webpages. For a person who does not have accessto historical data, or would find it difficult or impossible torecreate, the Web is primarily one-dimensional, containingonly one version of any page. The current lack of support fortemporal access to the Web makes it difficult or impossibleto find, analyze, extract, and compare historical information.
Permission to make digital or hard copies of all or part of this work forpersonal or classroom use is granted without fee provided that copies arenot made or distributed for profit or commercial advantage and that copiesbear this notice and the full citation on the first page. To copy otherwise, torepublish, to post on servers or to redistribute to lists, requires prior specificpermission and/or a fee.UIST’08, October 19–22, 2008, Monterey, CA, USA..Copyright 2008 ACM 978-1-59593-975-3/08/10 ...$5.00.
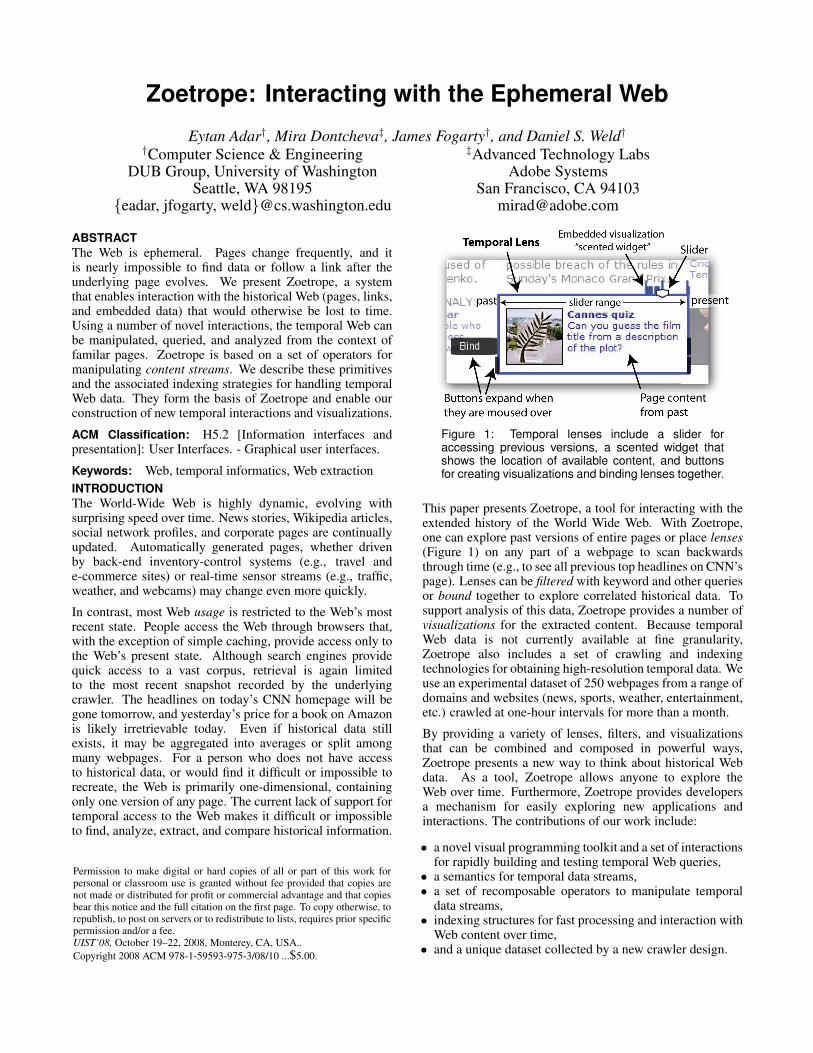
Figure 1: Temporal lenses include a slider foraccessing previous versions, a scented widget thatshows the location of available content, and buttonsfor creating visualizations and binding lenses together.
This paper presents Zoetrope, a tool for interacting with theextended history of the World Wide Web. With Zoetrope,one can explore past versions of entire pages or place lenses(Figure 1) on any part of a webpage to scan backwardsthrough time (e.g., to see all previous top headlines on CNN’spage). Lenses can be filtered with keyword and other queriesor bound together to explore correlated historical data. Tosupport analysis of this data, Zoetrope provides a number ofvisualizations for the extracted content. Because temporalWeb data is not currently available at fine granularity,Zoetrope also includes a set of crawling and indexingtechnologies for obtaining high-resolution temporal data. Weuse an experimental dataset of 250 webpages from a range ofdomains and websites (news, sports, weather, entertainment,etc.) crawled at one-hour intervals for more than a month.
By providing a variety of lenses, filters, and visualizationsthat can be combined and composed in powerful ways,Zoetrope presents a new way to think about historical Webdata. As a tool, Zoetrope allows anyone to explore theWeb over time. Furthermore, Zoetrope provides developersa mechanism for easily exploring new applications andinteractions. The contributions of our work include:
• a novel visual programming toolkit and a set of interactionsfor rapidly building and testing temporal Web queries,
• a semantics for temporal data streams,• a set of recomposable operators to manipulate temporal
data streams,• indexing structures for fast processing and interaction with
Web content over time,• and a unique dataset collected by a new crawler design.
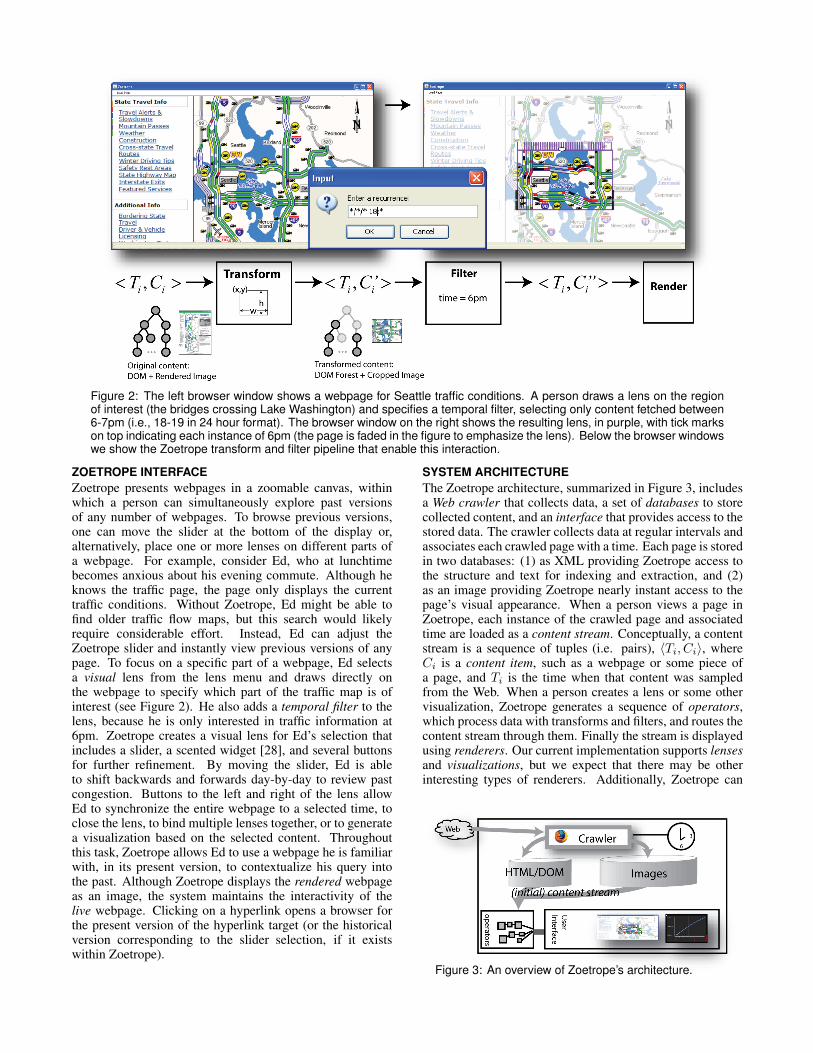
Figure 2: The left browser window shows a webpage for Seattle traffic conditions. A person draws a lens on the regionof interest (the bridges crossing Lake Washington) and specifies a temporal filter, selecting only content fetched between6-7pm (i.e., 18-19 in 24 hour format). The browser window on the right shows the resulting lens, in purple, with tick markson top indicating each instance of 6pm (the page is faded in the figure to emphasize the lens). Below the browser windowswe show the Zoetrope transform and filter pipeline that enable this interaction.
ZOETROPE INTERFACEZoetrope presents webpages in a zoomable canvas, withinwhich a person can simultaneously explore past versionsof any number of webpages. To browse previous versions,one can move the slider at the bottom of the display or,alternatively, place one or more lenses on different parts ofa webpage. For example, consider Ed, who at lunchtimebecomes anxious about his evening commute. Although heknows the traffic page, the page only displays the currenttraffic conditions. Without Zoetrope, Ed might be able tofind older traffic flow maps, but this search would likelyrequire considerable effort. Instead, Ed can adjust theZoetrope slider and instantly view previous versions of anypage. To focus on a specific part of a webpage, Ed selectsa visual lens from the lens menu and draws directly onthe webpage to specify which part of the traffic map is ofinterest (see Figure 2). He also adds a temporal filter to thelens, because he is only interested in traffic information at6pm. Zoetrope creates a visual lens for Ed’s selection thatincludes a slider, a scented widget [28], and several buttonsfor further refinement. By moving the slider, Ed is ableto shift backwards and forwards day-by-day to review pastcongestion. Buttons to the left and right of the lens allowEd to synchronize the entire webpage to a selected time, toclose the lens, to bind multiple lenses together, or to generatea visualization based on the selected content. Throughoutthis task, Zoetrope allows Ed to use a webpage he is familiarwith, in its present version, to contextualize his query intothe past. Although Zoetrope displays the rendered webpageas an image, the system maintains the interactivity of thelive webpage. Clicking on a hyperlink opens a browser forthe present version of the hyperlink target (or the historicalversion corresponding to the slider selection, if it existswithin Zoetrope).
SYSTEM ARCHITECTUREThe Zoetrope architecture, summarized in Figure 3, includesa Web crawler that collects data, a set of databases to storecollected content, and an interface that provides access to thestored data. The crawler collects data at regular intervals andassociates each crawled page with a time. Each page is storedin two databases: (1) as XML providing Zoetrope access tothe structure and text for indexing and extraction, and (2)as an image providing Zoetrope nearly instant access to thepage’s visual appearance. When a person views a page inZoetrope, each instance of the crawled page and associatedtime are loaded as a content stream. Conceptually, a contentstream is a sequence of tuples (i.e. pairs), 〈Ti, Ci〉, whereCi is a content item, such as a webpage or some piece ofa page, and Ti is the time when that content was sampledfrom the Web. When a person creates a lens or some othervisualization, Zoetrope generates a sequence of operators,which process data with transforms and filters, and routes thecontent stream through them. Finally the stream is displayedusing renderers. Our current implementation supports lensesand visualizations, but we expect that there may be otherinteresting types of renderers. Additionally, Zoetrope can
Figure 3: An overview of Zoetrope’s architecture.
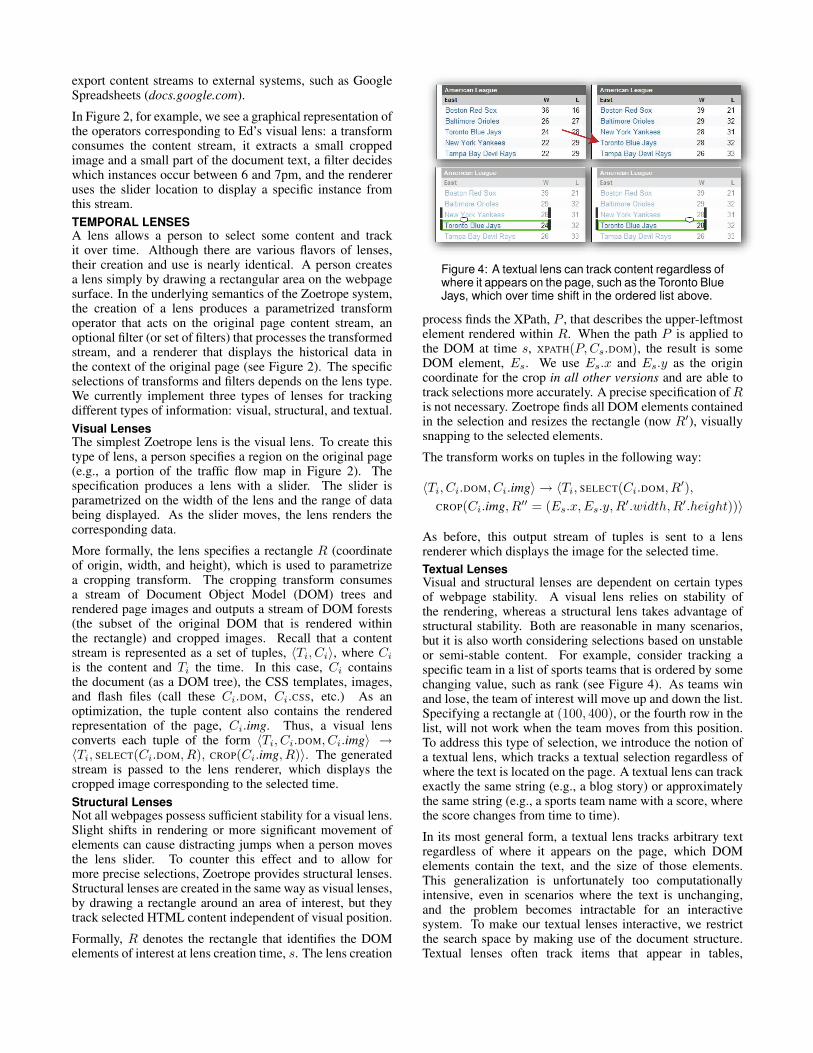
export content streams to external systems, such as GoogleSpreadsheets (docs.google.com).
In Figure 2, for example, we see a graphical representation ofthe operators corresponding to Ed’s visual lens: a transformconsumes the content stream, it extracts a small croppedimage and a small part of the document text, a filter decideswhich instances occur between 6 and 7pm, and the rendereruses the slider location to display a specific instance fromthis stream.TEMPORAL LENSESA lens allows a person to select some content and trackit over time. Although there are various flavors of lenses,their creation and use is nearly identical. A person createsa lens simply by drawing a rectangular area on the webpagesurface. In the underlying semantics of the Zoetrope system,the creation of a lens produces a parametrized transformoperator that acts on the original page content stream, anoptional filter (or set of filters) that processes the transformedstream, and a renderer that displays the historical data inthe context of the original page (see Figure 2). The specificselections of transforms and filters depends on the lens type.We currently implement three types of lenses for trackingdifferent types of information: visual, structural, and textual.Visual LensesThe simplest Zoetrope lens is the visual lens. To create thistype of lens, a person specifies a region on the original page(e.g., a portion of the traffic flow map in Figure 2). Thespecification produces a lens with a slider. The slider isparametrized on the width of the lens and the range of databeing displayed. As the slider moves, the lens renders thecorresponding data.
More formally, the lens specifies a rectangle R (coordinateof origin, width, and height), which is used to parametrizea cropping transform. The cropping transform consumesa stream of Document Object Model (DOM) trees andrendered page images and outputs a stream of DOM forests(the subset of the original DOM that is rendered withinthe rectangle) and cropped images. Recall that a contentstream is represented as a set of tuples, 〈Ti, Ci〉, where Ci
is the content and Ti the time. In this case, Ci containsthe document (as a DOM tree), the CSS templates, images,and flash files (call these Ci.DOM, Ci.CSS, etc.) As anoptimization, the tuple content also contains the renderedrepresentation of the page, Ci.img. Thus, a visual lensconverts each tuple of the form 〈Ti, Ci.DOM, Ci.img〉 →〈Ti, SELECT(Ci.DOM, R), CROP(Ci.img, R)〉. The generatedstream is passed to the lens renderer, which displays thecropped image corresponding to the selected time.Structural LensesNot all webpages possess sufficient stability for a visual lens.Slight shifts in rendering or more significant movement ofelements can cause distracting jumps when a person movesthe lens slider. To counter this effect and to allow formore precise selections, Zoetrope provides structural lenses.Structural lenses are created in the same way as visual lenses,by drawing a rectangle around an area of interest, but theytrack selected HTML content independent of visual position.
Formally, R denotes the rectangle that identifies the DOMelements of interest at lens creation time, s. The lens creation
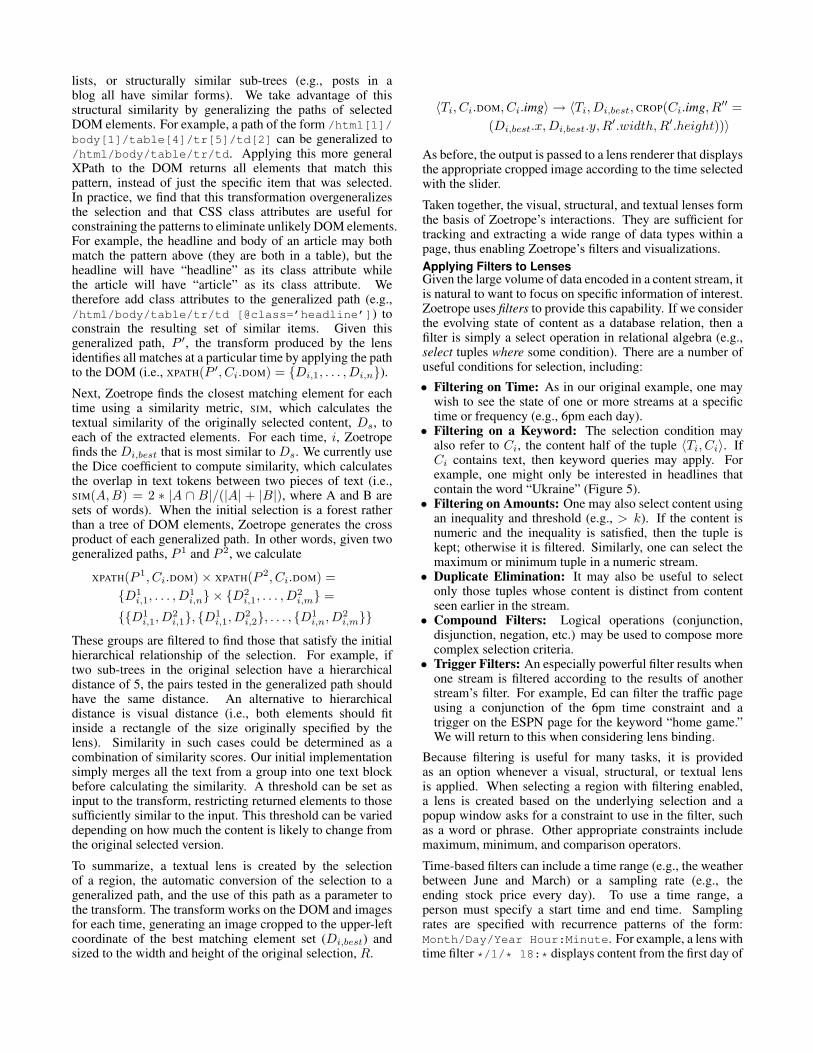
Figure 4: A textual lens can track content regardless ofwhere it appears on the page, such as the Toronto BlueJays, which over time shift in the ordered list above.
process finds the XPath, P , that describes the upper-leftmostelement rendered within R. When the path P is applied tothe DOM at time s, XPATH(P,Cs.DOM), the result is someDOM element, Es. We use Es.x and Es.y as the origincoordinate for the crop in all other versions and are able totrack selections more accurately. A precise specification of Ris not necessary. Zoetrope finds all DOM elements containedin the selection and resizes the rectangle (now R′), visuallysnapping to the selected elements.
The transform works on tuples in the following way:
〈Ti, Ci.DOM, Ci.img〉 → 〈Ti, SELECT(Ci.DOM, R′),CROP(Ci.img, R′′ = (Es.x, Es.y, R′.width,R′.height))〉
As before, this output stream of tuples is sent to a lensrenderer which displays the image for the selected time.Textual LensesVisual and structural lenses are dependent on certain typesof webpage stability. A visual lens relies on stability ofthe rendering, whereas a structural lens takes advantage ofstructural stability. Both are reasonable in many scenarios,but it is also worth considering selections based on unstableor semi-stable content. For example, consider tracking aspecific team in a list of sports teams that is ordered by somechanging value, such as rank (see Figure 4). As teams winand lose, the team of interest will move up and down the list.Specifying a rectangle at (100, 400), or the fourth row in thelist, will not work when the team moves from this position.To address this type of selection, we introduce the notion ofa textual lens, which tracks a textual selection regardless ofwhere the text is located on the page. A textual lens can trackexactly the same string (e.g., a blog story) or approximatelythe same string (e.g., a sports team name with a score, wherethe score changes from time to time).
In its most general form, a textual lens tracks arbitrary textregardless of where it appears on the page, which DOMelements contain the text, and the size of those elements.This generalization is unfortunately too computationallyintensive, even in scenarios where the text is unchanging,and the problem becomes intractable for an interactivesystem. To make our textual lenses interactive, we restrictthe search space by making use of the document structure.Textual lenses often track items that appear in tables,
lists, or structurally similar sub-trees (e.g., posts in ablog all have similar forms). We take advantage of thisstructural similarity by generalizing the paths of selectedDOM elements. For example, a path of the form /html[1]/body[1]/table[4]/tr[5]/td[2] can be generalized to/html/body/table/tr/td. Applying this more generalXPath to the DOM returns all elements that match thispattern, instead of just the specific item that was selected.In practice, we find that this transformation overgeneralizesthe selection and that CSS class attributes are useful forconstraining the patterns to eliminate unlikely DOM elements.For example, the headline and body of an article may bothmatch the pattern above (they are both in a table), but theheadline will have “headline” as its class attribute whilethe article will have “article” as its class attribute. Wetherefore add class attributes to the generalized path (e.g.,/html/body/table/tr/td [@class=’headline’]) toconstrain the resulting set of similar items. Given thisgeneralized path, P ′, the transform produced by the lensidentifies all matches at a particular time by applying the pathto the DOM (i.e., XPATH(P ′, Ci.DOM) = {Di,1, . . . , Di,n}).
Next, Zoetrope finds the closest matching element for eachtime using a similarity metric, SIM, which calculates thetextual similarity of the originally selected content, Ds, toeach of the extracted elements. For each time, i, Zoetropefinds the Di,best that is most similar to Ds. We currently usethe Dice coefficient to compute similarity, which calculatesthe overlap in text tokens between two pieces of text (i.e.,SIM(A,B) = 2 ∗ |A ∩ B|/(|A| + |B|), where A and B aresets of words). When the initial selection is a forest ratherthan a tree of DOM elements, Zoetrope generates the crossproduct of each generalized path. In other words, given twogeneralized paths, P 1 and P 2, we calculate
XPATH(P 1, Ci.DOM) × XPATH(P 2, Ci.DOM) ={D1
i,1, . . . , D1i,n} × {D2
i,1, . . . , D2i,m} =
{{D1i,1, D
2i,1}, {D1
i,1, D2i,2}, . . . , {D1
i,n, D2i,m}}
These groups are filtered to find those that satisfy the initialhierarchical relationship of the selection. For example, iftwo sub-trees in the original selection have a hierarchicaldistance of 5, the pairs tested in the generalized path shouldhave the same distance. An alternative to hierarchicaldistance is visual distance (i.e., both elements should fitinside a rectangle of the size originally specified by thelens). Similarity in such cases could be determined as acombination of similarity scores. Our initial implementationsimply merges all the text from a group into one text blockbefore calculating the similarity. A threshold can be set asinput to the transform, restricting returned elements to thosesufficiently similar to the input. This threshold can be varieddepending on how much the content is likely to change fromthe original selected version.
To summarize, a textual lens is created by the selectionof a region, the automatic conversion of the selection to ageneralized path, and the use of this path as a parameter tothe transform. The transform works on the DOM and imagesfor each time, generating an image cropped to the upper-leftcoordinate of the best matching element set (Di,best) andsized to the width and height of the original selection, R.
〈Ti, Ci.DOM, Ci.img〉 → 〈Ti, Di,best, CROP(Ci.img, R′′ =(Di,best.x, Di,best.y, R′.width,R′.height))〉
As before, the output is passed to a lens renderer that displaysthe appropriate cropped image according to the time selectedwith the slider.
Taken together, the visual, structural, and textual lenses formthe basis of Zoetrope’s interactions. They are sufficient fortracking and extracting a wide range of data types within apage, thus enabling Zoetrope’s filters and visualizations.Applying Filters to LensesGiven the large volume of data encoded in a content stream, itis natural to want to focus on specific information of interest.Zoetrope uses filters to provide this capability. If we considerthe evolving state of content as a database relation, then afilter is simply a select operation in relational algebra (e.g.,select tuples where some condition). There are a number ofuseful conditions for selection, including:
• Filtering on Time: As in our original example, one maywish to see the state of one or more streams at a specifictime or frequency (e.g., 6pm each day).
• Filtering on a Keyword: The selection condition mayalso refer to Ci, the content half of the tuple 〈Ti, Ci〉. IfCi contains text, then keyword queries may apply. Forexample, one might only be interested in headlines thatcontain the word “Ukraine” (Figure 5).
• Filtering on Amounts: One may also select content usingan inequality and threshold (e.g., > k). If the content isnumeric and the inequality is satisfied, then the tuple iskept; otherwise it is filtered. Similarly, one can select themaximum or minimum tuple in a numeric stream.
• Duplicate Elimination: It may also be useful to selectonly those tuples whose content is distinct from contentseen earlier in the stream.
• Compound Filters: Logical operations (conjunction,disjunction, negation, etc.) may be used to compose morecomplex selection criteria.
• Trigger Filters: An especially powerful filter results whenone stream is filtered according to the results of anotherstream’s filter. For example, Ed can filter the traffic pageusing a conjunction of the 6pm time constraint and atrigger on the ESPN page for the keyword “home game.”We will return to this when considering lens binding.
Because filtering is useful for many tasks, it is providedas an option whenever a visual, structural, or textual lensis applied. When selecting a region with filtering enabled,a lens is created based on the underlying selection and apopup window asks for a constraint to use in the filter, suchas a word or phrase. Other appropriate constraints includemaximum, minimum, and comparison operators.
Time-based filters can include a time range (e.g., the weatherbetween June and March) or a sampling rate (e.g., theending stock price every day). To use a time range, aperson must specify a start time and end time. Samplingrates are specified with recurrence patterns of the form:Month/Day/Year Hour:Minute. For example, a lens withtime filter */1/* 18:* displays content from the first day of
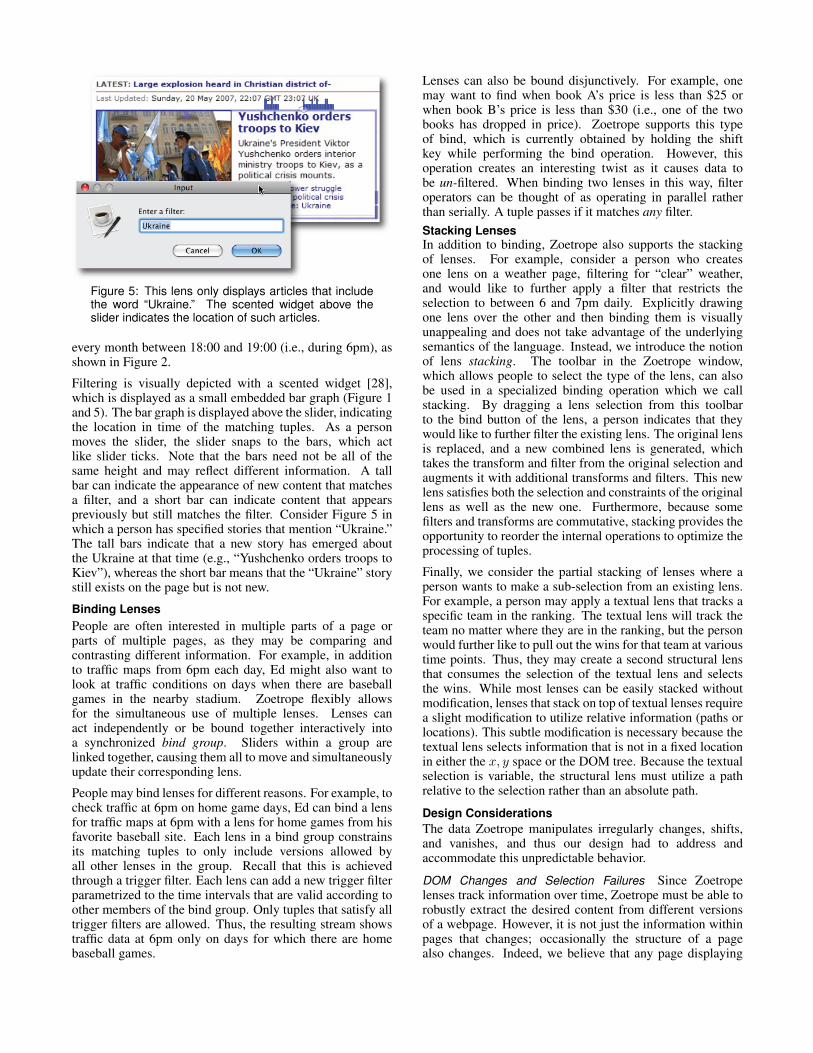
Figure 5: This lens only displays articles that includethe word “Ukraine.” The scented widget above theslider indicates the location of such articles.
every month between 18:00 and 19:00 (i.e., during 6pm), asshown in Figure 2.
Filtering is visually depicted with a scented widget [28],which is displayed as a small embedded bar graph (Figure 1and 5). The bar graph is displayed above the slider, indicatingthe location in time of the matching tuples. As a personmoves the slider, the slider snaps to the bars, which actlike slider ticks. Note that the bars need not be all of thesame height and may reflect different information. A tallbar can indicate the appearance of new content that matchesa filter, and a short bar can indicate content that appearspreviously but still matches the filter. Consider Figure 5 inwhich a person has specified stories that mention “Ukraine.”The tall bars indicate that a new story has emerged aboutthe Ukraine at that time (e.g., “Yushchenko orders troops toKiev”), whereas the short bar means that the “Ukraine” storystill exists on the page but is not new.
Binding LensesPeople are often interested in multiple parts of a page orparts of multiple pages, as they may be comparing andcontrasting different information. For example, in additionto traffic maps from 6pm each day, Ed might also want tolook at traffic conditions on days when there are baseballgames in the nearby stadium. Zoetrope flexibly allowsfor the simultaneous use of multiple lenses. Lenses canact independently or be bound together interactively intoa synchronized bind group. Sliders within a group arelinked together, causing them all to move and simultaneouslyupdate their corresponding lens.
People may bind lenses for different reasons. For example, tocheck traffic at 6pm on home game days, Ed can bind a lensfor traffic maps at 6pm with a lens for home games from hisfavorite baseball site. Each lens in a bind group constrainsits matching tuples to only include versions allowed byall other lenses in the group. Recall that this is achievedthrough a trigger filter. Each lens can add a new trigger filterparametrized to the time intervals that are valid according toother members of the bind group. Only tuples that satisfy alltrigger filters are allowed. Thus, the resulting stream showstraffic data at 6pm only on days for which there are homebaseball games.
Lenses can also be bound disjunctively. For example, onemay want to find when book A’s price is less than $25 orwhen book B’s price is less than $30 (i.e., one of the twobooks has dropped in price). Zoetrope supports this typeof bind, which is currently obtained by holding the shiftkey while performing the bind operation. However, thisoperation creates an interesting twist as it causes data tobe un-filtered. When binding two lenses in this way, filteroperators can be thought of as operating in parallel ratherthan serially. A tuple passes if it matches any filter.Stacking LensesIn addition to binding, Zoetrope also supports the stackingof lenses. For example, consider a person who createsone lens on a weather page, filtering for “clear” weather,and would like to further apply a filter that restricts theselection to between 6 and 7pm daily. Explicitly drawingone lens over the other and then binding them is visuallyunappealing and does not take advantage of the underlyingsemantics of the language. Instead, we introduce the notionof lens stacking. The toolbar in the Zoetrope window,which allows people to select the type of the lens, can alsobe used in a specialized binding operation which we callstacking. By dragging a lens selection from this toolbarto the bind button of the lens, a person indicates that theywould like to further filter the existing lens. The original lensis replaced, and a new combined lens is generated, whichtakes the transform and filter from the original selection andaugments it with additional transforms and filters. This newlens satisfies both the selection and constraints of the originallens as well as the new one. Furthermore, because somefilters and transforms are commutative, stacking provides theopportunity to reorder the internal operations to optimize theprocessing of tuples.
Finally, we consider the partial stacking of lenses where aperson wants to make a sub-selection from an existing lens.For example, a person may apply a textual lens that tracks aspecific team in the ranking. The textual lens will track theteam no matter where they are in the ranking, but the personwould further like to pull out the wins for that team at varioustime points. Thus, they may create a second structural lensthat consumes the selection of the textual lens and selectsthe wins. While most lenses can be easily stacked withoutmodification, lenses that stack on top of textual lenses requirea slight modification to utilize relative information (paths orlocations). This subtle modification is necessary because thetextual lens selects information that is not in a fixed locationin either the x, y space or the DOM tree. Because the textualselection is variable, the structural lens must utilize a pathrelative to the selection rather than an absolute path.
Design ConsiderationsThe data Zoetrope manipulates irregularly changes, shifts,and vanishes, and thus our design had to address andaccommodate this unpredictable behavior.
DOM Changes and Selection Failures Since Zoetropelenses track information over time, Zoetrope must be able torobustly extract the desired content from different versionsof a webpage. However, it is not just the information withinpages that changes; occasionally the structure of a pagealso changes. Indeed, we believe that any page displaying
interesting, dynamic content will eventually undergo atemplate change which is sufficiently large that most extractionschemes will fail [6]. Others have responded to this challengeby constructing increasingly sophisticated extraction andtracking systems (e.g. [4, 17, 21]). These methods mightbe readily integrated into Zoetrope, however, by designZoetrope can partially sidestep this problem. Zoetrope’s real-time feedback allows a person to immediately see whether adesired selection effect was obtained. This is only possiblebecause Zoetrope works over historical data and need not berobust in the face of unknown future changes.
A unique feature of Zoetrope is that we have targeted datathat is changing quickly and thus requires crawling at afairly rapid rate relative to other systems (currently once perhour). It is therefore worth briefly examining the amount ofstructural change that occurs in this type of data. Using ourtest collection, we attempted to track the stability of DOMpaths. We examined the first crawl of each page and collectedall of the leaf DOM nodes. We also looked at a re-crawlfrom an hour later to remove formatting nodes (e.g., “bold”or “italic”) that quickly vanish and are not part of the page’stemplate. The remaining DOM nodes were tested againstversions of the webpages a full day, a full week, five weeks,and a nearly a year later. We found that the median survivalrate of DOM elements within a page is 98% after one day(87% mean), 95% after one week (83%), 63% after fiveweeks (61%), and 11% after one year (23%). The differencesbetween the median and mean survival rates indicate outliersin both directions (pages where nearly all elements disappearwithin a day and pages where nearly all elements remain aftera year). Between the initial crawl and the crawl at the end offive weeks, we see that vanished DOM elements, on average,contained 53 characters of text (38% of vanished characterswere within links, each link averaging 17 characters). DOMelements that survived, on the other hand, had an average of131 characters, suggesting greater stability in larger DOMelements. The tremendous amount of path death after ayear is unsurprising. It confirms that websites undergosignificant template changes that cause extractor failures.Anecdotally, however, we find, as did [6], that although somepages (e.g., www.bankrate.com or money.cnn.com) undergomajor HTML structural changes, the visual placement of keyfeatures (e.g., a box of mortgage interest rates) is constanteven after a year. While we hope that Zoetrope’s interactionstyle allows people to quickly validate their extractions, wealso wish to improve our extractors by augmenting DOMpaths with visual and textual features.
Extraction failures may occur even when a page is sampledfrequently over a short interval. The best response dependson whether such a failure is believed to be permanentor intermittent. Intermittent failures may be caused byrandomization of page data (e.g., in a temporary promotion,Amazon interjects a counter of Harry Potter book sales onthe front page). The simplest solution for addressing suchtransient effects is to introduce a dummy (blank) image whenan element does not exist. In our experiments, however, wefound that introducing blank images for failures results in adisconcerting visual oscillation—the motion appears muchlike a low frame rate animation. Zoetrope instead displays
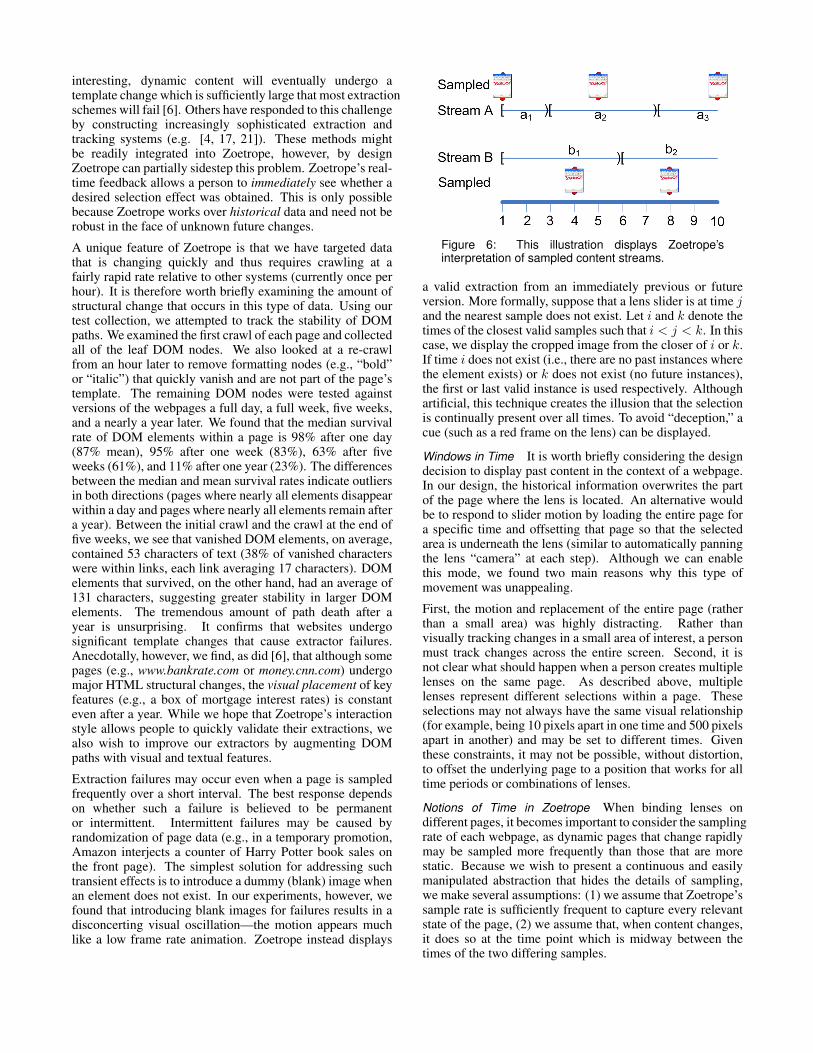
Figure 6: This illustration displays Zoetrope’sinterpretation of sampled content streams.
a valid extraction from an immediately previous or futureversion. More formally, suppose that a lens slider is at time jand the nearest sample does not exist. Let i and k denote thetimes of the closest valid samples such that i < j < k. In thiscase, we display the cropped image from the closer of i or k.If time i does not exist (i.e., there are no past instances wherethe element exists) or k does not exist (no future instances),the first or last valid instance is used respectively. Althoughartificial, this technique creates the illusion that the selectionis continually present over all times. To avoid “deception,” acue (such as a red frame on the lens) can be displayed.
Windows in Time It is worth briefly considering the designdecision to display past content in the context of a webpage.In our design, the historical information overwrites the partof the page where the lens is located. An alternative wouldbe to respond to slider motion by loading the entire page fora specific time and offsetting that page so that the selectedarea is underneath the lens (similar to automatically panningthe lens “camera” at each step). Although we can enablethis mode, we found two main reasons why this type ofmovement was unappealing.
First, the motion and replacement of the entire page (ratherthan a small area) was highly distracting. Rather thanvisually tracking changes in a small area of interest, a personmust track changes across the entire screen. Second, it isnot clear what should happen when a person creates multiplelenses on the same page. As described above, multiplelenses represent different selections within a page. Theseselections may not always have the same visual relationship(for example, being 10 pixels apart in one time and 500 pixelsapart in another) and may be set to different times. Giventhese constraints, it may not be possible, without distortion,to offset the underlying page to a position that works for alltime periods or combinations of lenses.
Notions of Time in Zoetrope When binding lenses ondifferent pages, it becomes important to consider the samplingrate of each webpage, as dynamic pages that change rapidlymay be sampled more frequently than those that are morestatic. Because we wish to present a continuous and easilymanipulated abstraction that hides the details of sampling,we make several assumptions: (1) we assume that Zoetrope’ssample rate is sufficiently frequent to capture every relevantstate of the page, (2) we assume that, when content changes,it does so at the time point which is midway between thetimes of the two differing samples.
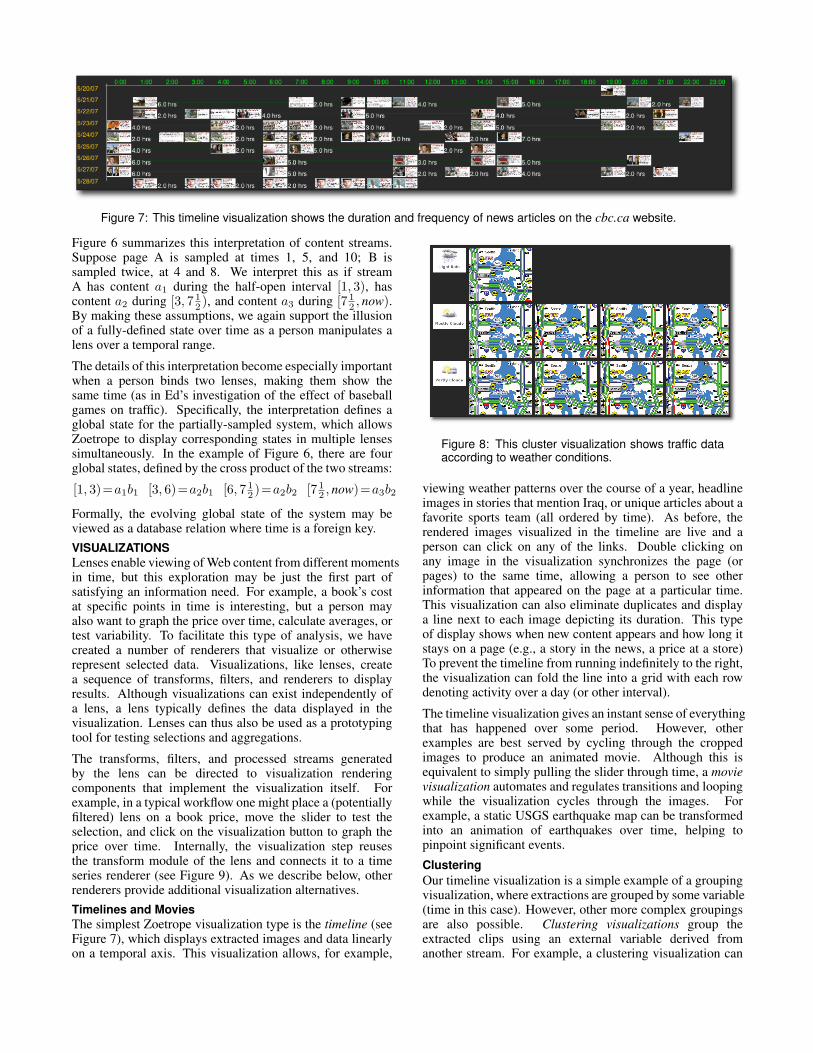
Figure 7: This timeline visualization shows the duration and frequency of news articles on the cbc.ca website.
Figure 6 summarizes this interpretation of content streams.Suppose page A is sampled at times 1, 5, and 10; B issampled twice, at 4 and 8. We interpret this as if streamA has content a1 during the half-open interval [1, 3), hascontent a2 during [3, 7 1
2 ), and content a3 during [7 12 , now).
By making these assumptions, we again support the illusionof a fully-defined state over time as a person manipulates alens over a temporal range.
The details of this interpretation become especially importantwhen a person binds two lenses, making them show thesame time (as in Ed’s investigation of the effect of baseballgames on traffic). Specifically, the interpretation defines aglobal state for the partially-sampled system, which allowsZoetrope to display corresponding states in multiple lensessimultaneously. In the example of Figure 6, there are fourglobal states, defined by the cross product of the two streams:
[1, 3)=a1b1 [3, 6)=a2b1 [6, 7 12 )=a2b2 [7 1
2 , now)=a3b2
Formally, the evolving global state of the system may beviewed as a database relation where time is a foreign key.VISUALIZATIONSLenses enable viewing of Web content from different momentsin time, but this exploration may be just the first part ofsatisfying an information need. For example, a book’s costat specific points in time is interesting, but a person mayalso want to graph the price over time, calculate averages, ortest variability. To facilitate this type of analysis, we havecreated a number of renderers that visualize or otherwiserepresent selected data. Visualizations, like lenses, createa sequence of transforms, filters, and renderers to displayresults. Although visualizations can exist independently ofa lens, a lens typically defines the data displayed in thevisualization. Lenses can thus also be used as a prototypingtool for testing selections and aggregations.
The transforms, filters, and processed streams generatedby the lens can be directed to visualization renderingcomponents that implement the visualization itself. Forexample, in a typical workflow one might place a (potentiallyfiltered) lens on a book price, move the slider to test theselection, and click on the visualization button to graph theprice over time. Internally, the visualization step reusesthe transform module of the lens and connects it to a timeseries renderer (see Figure 9). As we describe below, otherrenderers provide additional visualization alternatives.Timelines and MoviesThe simplest Zoetrope visualization type is the timeline (seeFigure 7), which displays extracted images and data linearlyon a temporal axis. This visualization allows, for example,
Figure 8: This cluster visualization shows traffic dataaccording to weather conditions.
viewing weather patterns over the course of a year, headlineimages in stories that mention Iraq, or unique articles about afavorite sports team (all ordered by time). As before, therendered images visualized in the timeline are live and aperson can click on any of the links. Double clicking onany image in the visualization synchronizes the page (orpages) to the same time, allowing a person to see otherinformation that appeared on the page at a particular time.This visualization can also eliminate duplicates and displaya line next to each image depicting its duration. This typeof display shows when new content appears and how long itstays on a page (e.g., a story in the news, a price at a store)To prevent the timeline from running indefinitely to the right,the visualization can fold the line into a grid with each rowdenoting activity over a day (or other interval).
The timeline visualization gives an instant sense of everythingthat has happened over some period. However, otherexamples are best served by cycling through the croppedimages to produce an animated movie. Although this isequivalent to simply pulling the slider through time, a movievisualization automates and regulates transitions and loopingwhile the visualization cycles through the images. Forexample, a static USGS earthquake map can be transformedinto an animation of earthquakes over time, helping topinpoint significant events.
ClusteringOur timeline visualization is a simple example of a groupingvisualization, where extractions are grouped by some variable(time in this case). However, other more complex groupingsare also possible. Clustering visualizations group theextracted clips using an external variable derived fromanother stream. For example, a clustering visualization can
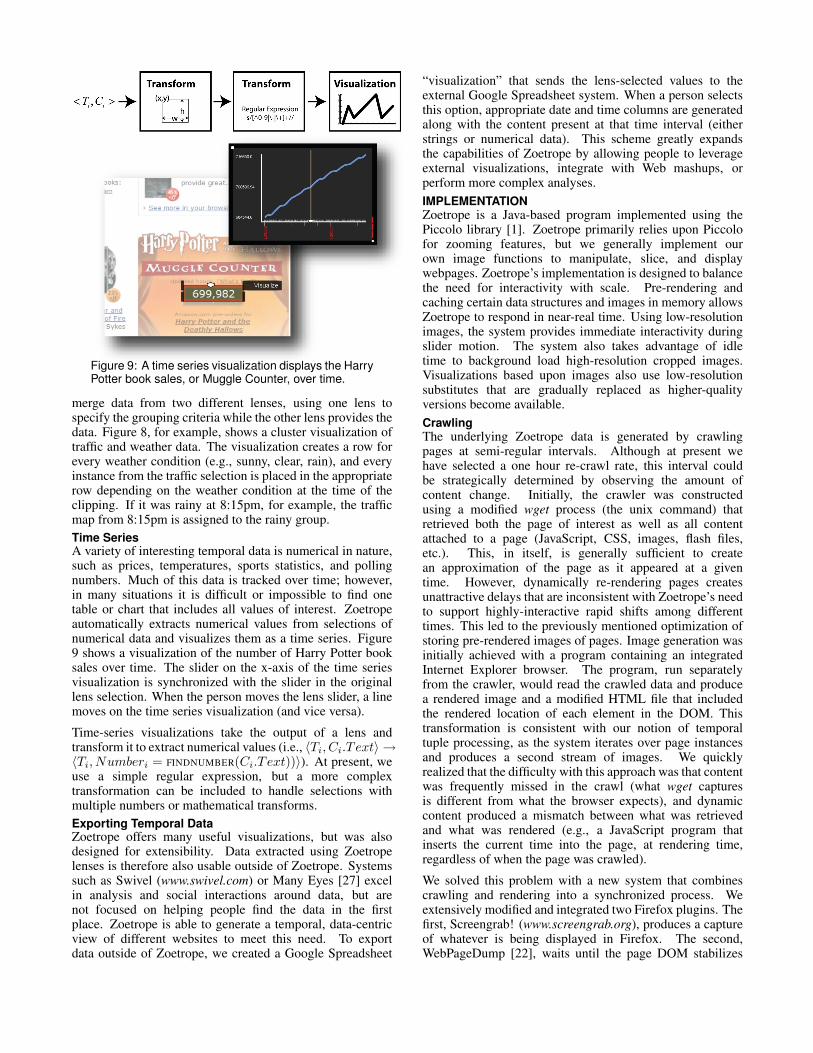
Figure 9: A time series visualization displays the HarryPotter book sales, or Muggle Counter, over time.
merge data from two different lenses, using one lens tospecify the grouping criteria while the other lens provides thedata. Figure 8, for example, shows a cluster visualization oftraffic and weather data. The visualization creates a row forevery weather condition (e.g., sunny, clear, rain), and everyinstance from the traffic selection is placed in the appropriaterow depending on the weather condition at the time of theclipping. If it was rainy at 8:15pm, for example, the trafficmap from 8:15pm is assigned to the rainy group.Time SeriesA variety of interesting temporal data is numerical in nature,such as prices, temperatures, sports statistics, and pollingnumbers. Much of this data is tracked over time; however,in many situations it is difficult or impossible to find onetable or chart that includes all values of interest. Zoetropeautomatically extracts numerical values from selections ofnumerical data and visualizes them as a time series. Figure9 shows a visualization of the number of Harry Potter booksales over time. The slider on the x-axis of the time seriesvisualization is synchronized with the slider in the originallens selection. When the person moves the lens slider, a linemoves on the time series visualization (and vice versa).
Time-series visualizations take the output of a lens andtransform it to extract numerical values (i.e., 〈Ti, Ci.T ext〉 →〈Ti, Numberi = FINDNUMBER(Ci.T ext))〉). At present, weuse a simple regular expression, but a more complextransformation can be included to handle selections withmultiple numbers or mathematical transforms.Exporting Temporal DataZoetrope offers many useful visualizations, but was alsodesigned for extensibility. Data extracted using Zoetropelenses is therefore also usable outside of Zoetrope. Systemssuch as Swivel (www.swivel.com) or Many Eyes [27] excelin analysis and social interactions around data, but arenot focused on helping people find the data in the firstplace. Zoetrope is able to generate a temporal, data-centricview of different websites to meet this need. To exportdata outside of Zoetrope, we created a Google Spreadsheet
“visualization” that sends the lens-selected values to theexternal Google Spreadsheet system. When a person selectsthis option, appropriate date and time columns are generatedalong with the content present at that time interval (eitherstrings or numerical data). This scheme greatly expandsthe capabilities of Zoetrope by allowing people to leverageexternal visualizations, integrate with Web mashups, orperform more complex analyses.IMPLEMENTATIONZoetrope is a Java-based program implemented using thePiccolo library [1]. Zoetrope primarily relies upon Piccolofor zooming features, but we generally implement ourown image functions to manipulate, slice, and displaywebpages. Zoetrope’s implementation is designed to balancethe need for interactivity with scale. Pre-rendering andcaching certain data structures and images in memory allowsZoetrope to respond in near-real time. Using low-resolutionimages, the system provides immediate interactivity duringslider motion. The system also takes advantage of idletime to background load high-resolution cropped images.Visualizations based upon images also use low-resolutionsubstitutes that are gradually replaced as higher-qualityversions become available.CrawlingThe underlying Zoetrope data is generated by crawlingpages at semi-regular intervals. Although at present wehave selected a one hour re-crawl rate, this interval couldbe strategically determined by observing the amount ofcontent change. Initially, the crawler was constructedusing a modified wget process (the unix command) thatretrieved both the page of interest as well as all contentattached to a page (JavaScript, CSS, images, flash files,etc.). This, in itself, is generally sufficient to createan approximation of the page as it appeared at a giventime. However, dynamically re-rendering pages createsunattractive delays that are inconsistent with Zoetrope’s needto support highly-interactive rapid shifts among differenttimes. This led to the previously mentioned optimization ofstoring pre-rendered images of pages. Image generation wasinitially achieved with a program containing an integratedInternet Explorer browser. The program, run separatelyfrom the crawler, would read the crawled data and producea rendered image and a modified HTML file that includedthe rendered location of each element in the DOM. Thistransformation is consistent with our notion of temporaltuple processing, as the system iterates over page instancesand produces a second stream of images. We quicklyrealized that the difficulty with this approach was that contentwas frequently missed in the crawl (what wget capturesis different from what the browser expects), and dynamiccontent produced a mismatch between what was retrievedand what was rendered (e.g., a JavaScript program thatinserts the current time into the page, at rendering time,regardless of when the page was crawled).
We solved this problem with a new system that combinescrawling and rendering into a synchronized process. Weextensively modified and integrated two Firefox plugins. Thefirst, Screengrab! (www.screengrab.org), produces a captureof whatever is being displayed in Firefox. The second,WebPageDump [22], waits until the page DOM stabilizes

in memory and subsequently outputs a single JavaScript-freeHTML page, images, and a single CSS document describingall necessary layout constraints. As before, the HTMLpage is modified to contain the coordinates of all renderedDOM elements. Based upon both of these plugins, ourcurrent Firefox-based crawler captures both an accuraterepresentation of the page as it looked at the time of retrievaland sufficient content so that the page can be correctlyre-rendered if necessary. Using a Firefox plugin has thefurther advantage that people can add to their own databaseas they browse the Web.
Our experimental dataset includes 250 pages and over 1000samples per page. Each page requires, on average, storing92Kb (68Kb median) per crawl beyond the original page,which requires an average of 320Kb. This includes allcontent necessary to render any crawled version of the page(e.g., HTML, all images, Flash files). The first page crawl ismuch larger, because in subsequent crawls we check linkedfiles, such as CSS and image files, for changes and onlydownload them when they have changed. We compute anMD5 checksum to check for changes. Subsequent crawlsare thus only about 28% of the size of the original crawl.Most of the new data, 92%, is due to HTML changes ratherthan changes in linked files. We believe that our datasetsize is artificially high for a number of reasons: (1) thepages in our dataset were selected because they are known tochange frequently, (2) we do not currently throw out contentthat is duplicated between pages from the same website,and (3) we do not compress any files. If we eliminatethese inefficiencies, we believe that crawls and storage spacerequirements could be significantly improved. For example,if we compress the pages using rzip, which takes advantageof repetitions across files, the average HTML page crawled 5weeks after the original visit requires only an additional 2Kbof storage (272 bytes median) over the compressed version ofthe original page (15% of the size of the original compressedpage).
BackendThe DOM for each version of a page are loaded into anin-memory XML database. Saxon (www.saxonica.com),provides XPath query functionality and allows us to rapidlyfind matching elements or entire versions of pages. Anin-memory index also tracks DOM elements by their renderedx and y coordinates. This structure allows us to quickly findwhich elements are clicked or selected.
RELATED WORKResearch on the evolution of change on the Web [10]indicates both a high rate of change and large variance inthe degree of change. After changing, information on theWeb generally vanishes for all intents and purposes. Evenarchive systems like the Internet Archives (www.archive.org)and Google’s cache only preserve a partial history. Previouscopies, such as they are, are not generally accessible in auseful way, but instead require a person to manually searchfor and individually collect each page.
In response to the need for temporal data, a number ofsolutions have emerged in the research community. Arguablyone of the first, the AT&T Difference Engine [9] archivedpages and displayed differences between consecutive versions
of pages. Because HTML is semi-structured, researchers inthe database and data mining communities have expandedideas on XML differencing to HTML/Web differences(extensively surveyed in [12]). Zoetrope is not explicitlydesigned for comparing two page versions to each other(though this can certainly be implemented). Rather, we areinterested in many instances of a given page.
Another related area of research includes Web-clippingsystems that allow people to monitor webpage regionsof interest [13, 24, 26]. These systems are typicallyfocused on tracking future changes rather than workingwith previous versions of webpages. These efforts havealso inspired commercial efforts, such as Internet Explorer8’s WebSlices. Multi-page clipping and mashup/extractionapplications (e.g., [7, 8, 14, 15]) are valuable tools forextracting and combining data from the present Web, but arenot designed for historical versions. Of notable exceptionare programming by demonstration (PBD) systems such asKoala [17], which must take into account the changing Webto preserve the validity of macros and scripts going forward.Zoetrope implements Web-clipping features in a number ofvisualizations (time lines, clusters, etc). Our architecture iswell-suited to such applications and we hope to investigatethem further in the future.
A second major area of research has been the visual displayof temporal differences in information. Certain solutionsare targeted at news while others act more generally torepresent differences between versions of webpages. Theseinclude techniques for converting textual information intotime series [11], spatio-temporal visualizations [23], andother difference visualizations (e.g., [18, 19]).
Architecturally, a number of database visualization systemsare related to the stream and operator design in Zoetrope.Particularly, DEVise [20] was originally constructed tooperate on streams of data that required visualization.Similarly, Polaris [25] operates to visualize relational data.In both, the operators provided by the system are primarilytargeted at the rendering step (deciding how graphs, charts,and other visualizations should be constructed). Zoetropeinstead focuses on unstructured temporal Web content fromwhich data can be extracted for these types of visualizations.Other systems-focused research that could support futureadditions to Zoetrope include work on automation andscalability issues of large-scale Web archiving (e.g., [5]) andfull-text search (e.g., [2]).
Finally, although these approaches have not been targetedat temporal Web data, we draw inspiration from the VideoCube [16] and Magic Lenses work [3]. The former allowsvideo stream frames to be layered and “sliced” to find anabstraction of the video. In the latter, a magic lens is a widgetthat can be placed directly on a document to illuminatethe underlying representation while maintaining the visualcontext of the document.
CONCLUSIONS
This paper presents Zoetrope, a system for interactingwith the ephemeral Web. Zoetrope allows people tointeractively access and manipulate a historical record ofthe evolving Web. Familiar pages, which have previously
existed only in the present, now have the added dimensionof time. To help manage and utilize this multi-versionWeb, Zoetrope implements a number of interactions basedin lenses and visualizations that allow people to accessand analyze historical information through contextualizedselections and extractions. Furthermore, developers canuse Zoetrope to rapidly prototype and test temporal queriesthrough Zoetrope’s visual query interface. With the Zoetropesystem, we introduce a novel semantics for dealing withtemporal Web data and show a small number of operatorsthat can be utilized for many different tasks. Our presentimplementation of Zoetrope has only scratched the surfaceof potential lenses and visualizations. By creating anunderlying language for selecting and processing temporalpage data, we hope to inspire and enable others to explorenew interactions and applications in this domain.
In addition to continuing to build new visualizations andextractors, we are extending the semantics of the underlyinglanguage to support more sophisticated queries and bindingoperations for specifying temporal logic operations andfunctions (e.g., the gas price for two days after oil pricesare $60 per barrel). Also, the highly regular sampling ofour dataset allowed for a number of assumptions in oursemantics, and we hope to further explore irregular crawlrates and interpolating data as necessary.
ACKNOWLEDGMENTSWe would like to thank our reviewers for their helpfulcomments and advice. Additional thanks to Jaime Teevan,Susan Dumais, Rob Miller, Adam Weld, and the GRAILgroup for their feedback on this work. This work is partiallysupported by the WRF / TJ Cable Professorship. Eytan Adaris supported by an NSF Graduate Fellowship and by ARCS.
REFERENCES1. Bederson, B. B., Grosjean, J., and Meyer, J. (2004). Toolkit
Design for Interactive Structured Graphics. IEEE Trans.Softw. Eng., 30(8), 535-546.
2. Berberich, K., Bedathur, S., Neumann, T., and Weikum, G.(2007). A Time Machine for Text Search. SIGIR ’07. 519-526.
3. Bier, E. A., Stone, M. C., Pier, K., Buxton, W., and DeRose,T. D. (1993). Toolglass and Magic Lenses: The See-ThroughInterface. SIGGRAPH ’93. 73-80.
4. Bolin, M., Webber, M., Rha, P., Wilson, T., and Miller, R. C.(2005). Automation and Customization of Rendered WebPages. UIST ’05. 163-172.
5. Boyapati, V., Chevrier, K., Finkel, A., Glance, N., Pierce,T., Stockton, R., and Whitmer, C. (2002). ChangeDetector:A Site-Level Monitoring Tool for the WWW. WWW ’02.570-579.
6. Dontcheva, M., Drucker, S. M., Salesin, D., and Cohen, M. F.(2007). Changes in Webpage Structure over Time. TechnicalReport TR2007-04-02, UW CSE.
7. Dontcheva, M., Drucker, S. M., Salesin, D., and Cohen, M. F.(2007). Relations, Cards, and Search Templates: User-GuidedWeb Data Integration and Layout. UIST ’07. 61-70.
8. Dontcheva, M., Drucker, S. M., Wade, G., Salesin, D., andCohen, M. F. (2006). Summarizing Personal Web BrowsingSessions. UIST ’06. 115-124.
9. Douglis, F., Ball, T., farn Chen, Y., and Koutsofios, E. (1998).The AT&T Internet Difference Engine: Tracking and ViewingChanges on the Web. World Wide Web, 1(1), 27-44.
10. Fetterly, D., Manasse, M., Najork, M., and Wiener, J.(2003). A Large-Scale Study of the Evolution of Web Pages.WWW ’03. 669-678.
11. Fitzpatrick, J. A., Reffell, J., and Aydelott, M. (2003).BreakingStory: Visualizing Change in Online News. CHI ’03.900-901.
12. Grandi, F. Introducing an Annotated Bibliography onTemporal and Evolution Aspects in the World Wide Web.(2004). SIGMOD Rec., 33(2), 84-86.
13. Greenberg, S. and Boyle, M. (2006). GeneratingCustom Notification Histories by Tracking Visual DifferencesBetween Web Page Visits. GI ’06. 227-234.
14. Hartmann, B., Wu, L., Collins, K., and Klemmer, S. R.(2007). Programming by a Sample: Rapidly Creating WebApplications with d.mix. UIST ’07. 241-250.
15. Huynh, D., Mazzocchi, S., and Karger, D. (2005). PiggyBank: Experience the Semantic Web Inside Your WebBrowser. ISWC ’05. 413-430.
16. Klein, A. W., Sloan, P.-P. J., Finkelstein, A., and Cohen, M. F.(2002). Stylized Video Cubes. SCA ’02. 15-22.
17. Little, G., Lau, T. A., Cypher, A., Lin, J., Haber, E. M.,and Kandogan, E. (2007). Koala: Capture, Share, Automate,Personalize Business Processes on the Web. CHI ’07.943-946.
18. Liu, B., Zhao, K., and Yi, L. (2002). Visualizing Web SiteComparisons. WWW ’02. 693-703.
19. Liu, L., Pu, C., and Tang, W. (2000). WebCQ-Detectingand Delivering Information Changes on the Web. CIKM ’00.512-519.
20. Livny, M., Ramakrishnan, R., Beyer, K., Chen, G.,Donjerkovic, D., Lawande, S., Myllymaki, J., and Wenger, K.(1997). DEVise: Integrated Querying and Visual Explorationof Large Datasets. SIGMOD Rec., 26(2), 301-312.
21. Phelps, T. A. and Wilensky, R. (2000). Robust Hyperlinks andLocations. D-Lib Magazine, 6(7/8).
22. Pollak, B. and Gatterbauer, W. Creating PermanentTest Collections of Web Pages for Information ExtractionResearch. SOFSEM ’07. 103-115.
23. Rennison, E. (1994). Galaxy of News: An Approach toVisualizing and Understanding Expansive News Landscapes.UIST ’94. 3-12.
24. schraefel, m.c., Zhu, Y., Modjeska, D., Wigdor, D., and Zhao,S. (2002). Hunter Gatherer: Interaction Support for theCreation and Management of Within-Web-Page Collections.WWW ’02. 172-181.
25. Stolte, C., Tang, D., and Hanrahan, P. (2002). Polaris:A System for Query, Analysis, and Visualization ofMultidimensional Relational Databases. IEEE Trans. on Vis.and Comp. Graphics, 8(1), 52-65.
26. Sugiura, A. and Koseki, Y. (1998). Internet Scrapbook:Automating Web Browsing Tasks by Demonstration.UIST ’98. 9-18.
27. Viegas, F. B., Wattenberg, M., van Ham, F., Kriss, J., andMcKeon, M. (2007). ManyEyes: A Site for Visualizationat Internet Scale. IEEE Trans. on Vis. and Comp. Graphics,13(6), 1121-1128.
28. Willett, W., Heer, J., and Agrawala, M. Scented Widgets:Improving Navigation Cues with Embedded Visualizations.IEEE Trans. on Vis. and Comp. Graphics, 13(6), 1129-1136.