ZIMBABWE MONTHLY ECONOMIC REVIEW - AfDB
12
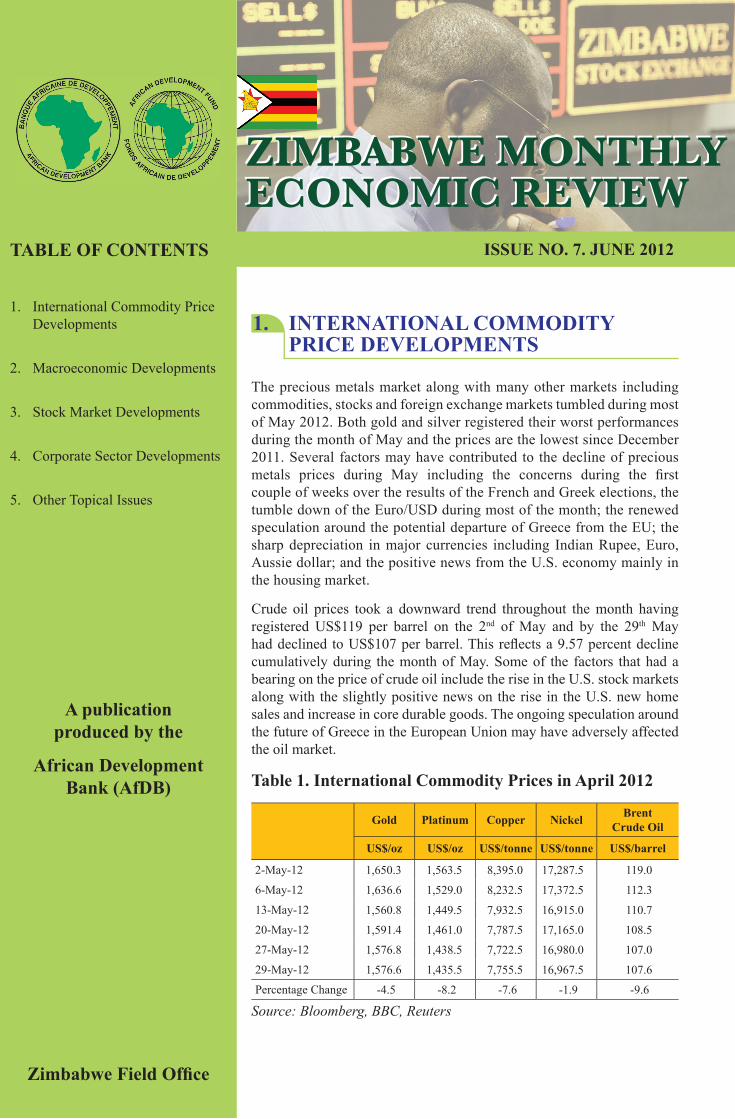
1. INTERNATIONAL COMMODITY PRICE DEVELOPMENTS The precious metals market along with many other markets including commodities, stocks and foreign exchange markets tumbled during most of May 2012. Both gold and silver registered their worst performances during the month of May and the prices are the lowest since December 2011. Several factors may have contributed to the decline of precious metals prices during May including the concerns during the first couple of weeks over the results of the French and Greek elections, the tumble down of the Euro/USD during most of the month; the renewed speculation around the potential departure of Greece from the EU; the sharp depreciation in major currencies including Indian Rupee, Euro, Aussie dollar; and the positive news from the U.S. economy mainly in the housing market. Crude oil prices took a downward trend throughout the month having registered US$119 per barrel on the 2 nd of May and by the 29 th May had declined to US$107 per barrel. This reflects a 9.57 percent decline cumulatively during the month of May. Some of the factors that had a bearing on the price of crude oil include the rise in the U.S. stock markets along with the slightly positive news on the rise in the U.S. new home sales and increase in core durable goods. The ongoing speculation around the future of Greece in the European Union may have adversely affected the oil market. Table 1. International Commodity Prices in April 2012 Gold Platinum Copper Nickel Brent Crude Oil US$/oz US$/oz US$/tonne US$/tonne US$/barrel 2-May-12 1,650.3 1,563.5 8,395.0 17,287.5 119.0 6-May-12 1,636.6 1,529.0 8,232.5 17,372.5 112.3 13-May-12 1,560.8 1,449.5 7,932.5 16,915.0 110.7 20-May-12 1,591.4 1,461.0 7,787.5 17,165.0 108.5 27-May-12 1,576.8 1,438.5 7,722.5 16,980.0 107.0 29-May-12 1,576.6 1,435.5 7,755.5 16,967.5 107.6 Percentage Change -4.5 -8.2 -7.6 -1.9 -9.6 Source: Bloomberg, BBC, Reuters ISSUE NO. 7. JUNE 2012 ZIMBABWE MONTHLY ECONOMIC REVIEW ZIMBABWE MONTHLY ECONOMIC REVIEW TABLE OF CONTENTS 1. International Commodity Price Developments 2. Macroeconomic Developments 3. Stock Market Developments 4. Corporate Sector Developments 5. Other Topical Issues A publication produced by the African Development Bank (AfDB) Zimbabwe Field Office
Transcript of ZIMBABWE MONTHLY ECONOMIC REVIEW - AfDB
1. INTERNATIONAL COMMODITY PRICE DEVELOPMENTS
The precious metals market along with many other markets including commodities, stocks and foreign exchange markets tumbled during most of May 2012. Both gold and silver registered their worst performances during the month of May and the prices are the lowest since December 2011. Several factors may have contributed to the decline of precious metals prices during May including the concerns during the fi rst couple of weeks over the results of the French and Greek elections, the tumble down of the Euro/USD during most of the month; the renewed speculation around the potential departure of Greece from the EU; the sharp depreciation in major currencies including Indian Rupee, Euro, Aussie dollar; and the positive news from the U.S. economy mainly in the housing market.
Crude oil prices took a downward trend throughout the month having registered US$119 per barrel on the 2nd of May and by the 29th May had declined to US$107 per barrel. This refl ects a 9.57 percent decline cumulatively during the month of May. Some of the factors that had a bearing on the price of crude oil include the rise in the U.S. stock markets along with the slightly positive news on the rise in the U.S. new home sales and increase in core durable goods. The ongoing speculation around the future of Greece in the European Union may have adversely affected the oil market.
Table 1. International Commodity Prices in April 2012
Gold Platinum Copper Nickel BrentCrude Oil
US$/oz US$/oz US$/tonne US$/tonne US$/barrel
2-May-12 1,650.3 1,563.5 8,395.0 17,287.5 119.0
6-May-12 1,636.6 1,529.0 8,232.5 17,372.5 112.3
13-May-12 1,560.8 1,449.5 7,932.5 16,915.0 110.7
20-May-12 1,591.4 1,461.0 7,787.5 17,165.0 108.5
27-May-12 1,576.8 1,438.5 7,722.5 16,980.0 107.0
29-May-12 1,576.6 1,435.5 7,755.5 16,967.5 107.6
Percentage Change -4.5 -8.2 -7.6 -1.9 -9.6
Source: Bloomberg, BBC, Reuters
ISSUE NO. 7. JUNE 2012
ZIMBABWE MONTHLY ECONOMIC REVIEWZIMBABWE MONTHLY ECONOMIC REVIEW
TABLE OF CONTENTS
1. International Commodity Price Developments
2. Macroeconomic Developments
3. Stock Market Developments
4. Corporate Sector Developments
5. Other Topical Issues
A publicationproduced by the
African Development Bank (AfDB)
ZimbabweFieldOffice

2 Zimbabwe Monthly Economic Review June 2012
The international grain council (IGC) reports that the month of May was characterised by uncertainty about the outlook for global grains and oilseeds production dominated the market activity resulting in heightened price volatility, also partly reflecting deepening concerns about the world economy, amid Euro zone problems. It further reports that grain marketing was affected by an associated marked strengthening of the US dollar, contributing to movements in dollar-denominated export quotations. While prospects for world wheat production were initially considered mostly favourable, markets turned abruptly higher as crop perceptions deteriorated.
The Food and Agricultural Organization (FAO) reported that wheat prices fell most following improved weather conditions and influenced by maize prices, which plunged following the release of the United States Department of Agriculture (USDA) report projecting a record maize crop in the United States. According to the IGC, an equally sharp rebound followed, boosted by tight nearby supplies and strength in wheat, but the market turned lower again, weighed by good early growing conditions. By contrast, international rice prices rose slightly, mainly on increased purchases ahead of the Ramadan period.
Table 2. Maize and Wheat Prices (USA), Fob, Gulf in May 2012
DateMaize (USA), Fob, Gulf Wheat HRW (USA) Fob, Gulf
US$/tonne US$/tonne15-May-12 275 26717-May-12 287 28521-May-12 284 30123-May-12 272 29025-May-12 260 30029-May-12 253 288
Source: International Grain Council
2. MACROECONOMIC DEVELOPMENTS
2.1 Overview of the Economy
Several factors threaten the achievement of the economic growth target for 2012. These include, among others: liquidity constraints; underperformance of the mining sector in the first quarter of 2012; and, electricity shortages.
2.2 Agriculture Sector Developments
The 2012 tobacco selling season has continued on a positive note, a development which has benefited the farmers. The average price of tobacco went up by 39 percent from an average of US$2.69 per kg in May 2011 to US$3.74 per kg in May 2012. This has propelled the total value of tobacco sales for May 2012 by 48 percent from US$284 million in 2011 to US$421.6 million. An improvement in tobacco growing and handling mainly by small-scale farmers has also seen a massive 23 percent decline in the rejection of bales (see Table 3).
Table 3. Tobacco Deliveries by 5 June 2012
Tobacco Sales Floors Bales Laid Bales Sold Rejected Bales Mass Sold (kg) Value (US$) Average Price
US$/kgTSF 225,286 205,564 19,722 15,156,798 55,753,457 3.7BTF 207,195 193,154 14,041 13,690,108 48,824,819 3.6MTF 116,205 108,069 8,136 7,851,505 28,627,550 3.7PTF 128 115,819 11,788 8,419,384 30,766,962 3.7CONTRACT 775,562 753,749 21,813 67,528,446 257,649,208 3.8Total 2012 1,451,855 1,376,355 61,459 112,646,241 421,621,996 3.7
Source: Tobacco Industry Marketing Board
TSF-Tobacco Sales Floor; BTF-Boka Tobacco Floor; MTF-Millennium Tobacco Floor; PTF-Premier Tobacco Floor
June 2012 Zimbabwe Monthly Economic Review 3
2.2 Mining Sector Developments
In line with the Indigenisation and Economic Empowerment regulations, Caledonia Mining disposed 15 percent of its stake in Blanket gold mine to a local consortium, Flemiro Investment, and 10 percent to the Gwanda Community Share Ownership Trust. A local investor also acquired a 15 percent stake in Freda Rebecca Gold Mine from Mwana Africa for US$405,000. Mwana Africa is the major shareholder in Freda Rebecca. The deal would help Mwana meet the country’s indigenization laws as it is yet to comply with government directive after its proposal was turned down. The holding company now holds 85 percent stake in the gold mine.
Coal mining giant, Hwange Colliery, has secured markets to supply more than 40,000 metric tonnes of coal in Asia and Europe as a strategy to grow the company’s revenues. The company has started transporting coal to India and Europe through Mozambique through a contracted port
terminal. Hwange Colliery usually exports coal to its traditional markets in the Democratic Republic of Congo, Zambia and South Africa. The price of coal on the international market has been firming at around US$100/tonne.
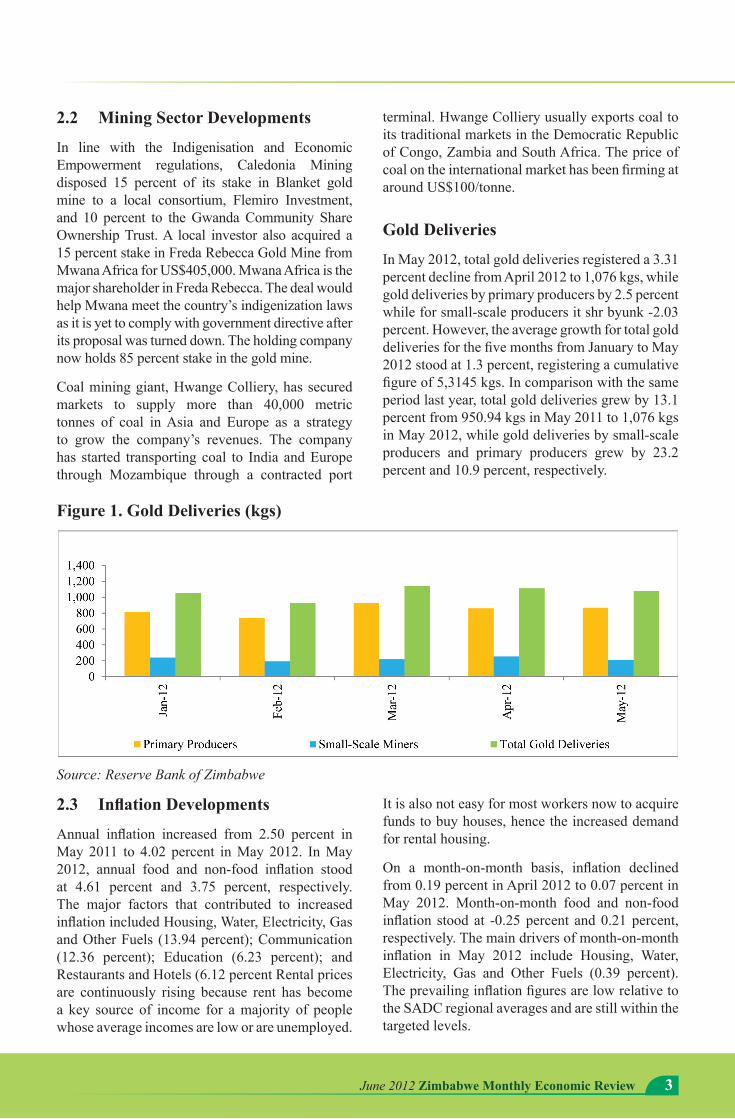
Gold Deliveries
In May 2012, total gold deliveries registered a 3.31 percent decline from April 2012 to 1,076 kgs, while gold deliveries by primary producers by 2.5 percent while for small-scale producers it shr byunk -2.03 percent. However, the average growth for total gold deliveries for the five months from January to May 2012 stood at 1.3 percent, registering a cumulative figure of 5,3145 kgs. In comparison with the same period last year, total gold deliveries grew by 13.1 percent from 950.94 kgs in May 2011 to 1,076 kgs in May 2012, while gold deliveries by small-scale producers and primary producers grew by 23.2 percent and 10.9 percent, respectively.
Figure 1. Gold Deliveries (kgs)
Source: Reserve Bank of Zimbabwe
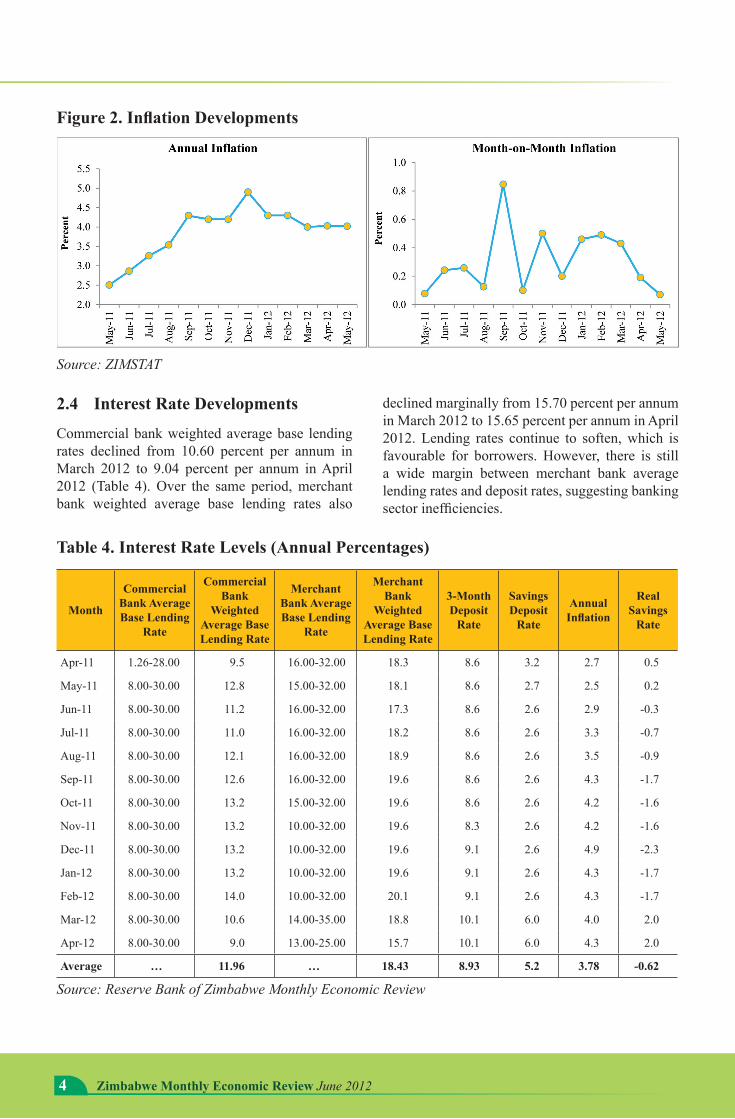
2.3 InflationDevelopments
Annual inflation increased from 2.50 percent in May 2011 to 4.02 percent in May 2012. In May 2012, annual food and non-food inflation stood at 4.61 percent and 3.75 percent, respectively. The major factors that contributed to increased inflation included Housing, Water, Electricity, Gas and Other Fuels (13.94 percent); Communication (12.36 percent); Education (6.23 percent); and Restaurants and Hotels (6.12 percent Rental prices are continuously rising because rent has become a key source of income for a majority of people whose average incomes are low or are unemployed.
It is also not easy for most workers now to acquire funds to buy houses, hence the increased demand for rental housing.
On a month-on-month basis, inflation declined from 0.19 percent in April 2012 to 0.07 percent in May 2012. Month-on-month food and non-food inflation stood at -0.25 percent and 0.21 percent, respectively. The main drivers of month-on-month inflation in May 2012 include Housing, Water, Electricity, Gas and Other Fuels (0.39 percent). The prevailing inflation figures are low relative to the SADC regional averages and are still within the targeted levels.
4 Zimbabwe Monthly Economic Review June 2012
Figure2.InflationDevelopments
Source: ZIMSTAT
2.4 Interest Rate Developments
Commercial bank weighted average base lending rates declined from 10.60 percent per annum in March 2012 to 9.04 percent per annum in April 2012 (Table 4). Over the same period, merchant bank weighted average base lending rates also
declined marginally from 15.70 percent per annum in March 2012 to 15.65 percent per annum in April 2012. Lending rates continue to soften, which is favourable for borrowers. However, there is still a wide margin between merchant bank average lending rates and deposit rates, suggesting banking sector inefficiencies.
Table 4. Interest Rate Levels (Annual Percentages)
Month
Commercial Bank Average Base Lending
Rate
Commercial Bank
Weighted Average Base Lending Rate
Merchant Bank Average Base Lending
Rate
Merchant Bank
Weighted Average Base Lending Rate
3-Month Deposit
Rate
Savings Deposit
Rate
Annual Inflation
Real Savings
Rate
Apr-11 1.26-28.00 9.5 16.00-32.00 18.3 8.6 3.2 2.7 0.5
May-11 8.00-30.00 12.8 15.00-32.00 18.1 8.6 2.7 2.5 0.2
Jun-11 8.00-30.00 11.2 16.00-32.00 17.3 8.6 2.6 2.9 -0.3
Jul-11 8.00-30.00 11.0 16.00-32.00 18.2 8.6 2.6 3.3 -0.7
Aug-11 8.00-30.00 12.1 16.00-32.00 18.9 8.6 2.6 3.5 -0.9
Sep-11 8.00-30.00 12.6 16.00-32.00 19.6 8.6 2.6 4.3 -1.7
Oct-11 8.00-30.00 13.2 15.00-32.00 19.6 8.6 2.6 4.2 -1.6
Nov-11 8.00-30.00 13.2 10.00-32.00 19.6 8.3 2.6 4.2 -1.6
Dec-11 8.00-30.00 13.2 10.00-32.00 19.6 9.1 2.6 4.9 -2.3
Jan-12 8.00-30.00 13.2 10.00-32.00 19.6 9.1 2.6 4.3 -1.7
Feb-12 8.00-30.00 14.0 10.00-32.00 20.1 9.1 2.6 4.3 -1.7
Mar-12 8.00-30.00 10.6 14.00-35.00 18.8 10.1 6.0 4.0 2.0
Apr-12 8.00-30.00 9.0 13.00-25.00 15.7 10.1 6.0 4.3 2.0
Average … 11.96 … 18.43 8.93 5.2 3.78 -0.62
Source: Reserve Bank of Zimbabwe Monthly Economic Review
June 2012 Zimbabwe Monthly Economic Review 5
The 3-month deposit rates increased to 10.10 percent per annum in April 2012 from 10.05 percent per annum in March 2012. Savings deposit rates increased marginally from 6percent per annum to 6.01 percent per annum in April 2012. It is estimated that a significant amount of money is still circulating outside the formal banking sector. There is therefore a need to increase deposit rates to entice savers to bring money into the formal banking institutions.
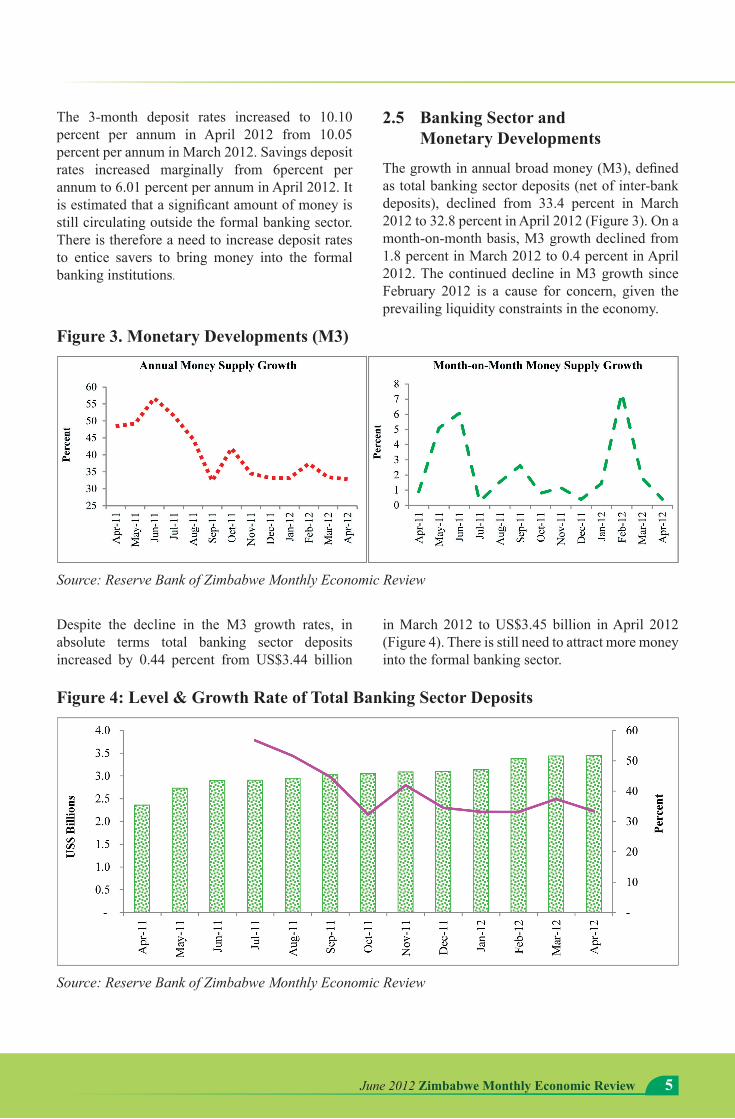
2.5 Banking Sector and Monetary Developments
The growth in annual broad money (M3), defined as total banking sector deposits (net of inter-bank deposits), declined from 33.4 percent in March 2012 to 32.8 percent in April 2012 (Figure 3). On a month-on-month basis, M3 growth declined from 1.8 percent in March 2012 to 0.4 percent in April 2012. The continued decline in M3 growth since February 2012 is a cause for concern, given the prevailing liquidity constraints in the economy.
Figure 3. Monetary Developments (M3)
Source: Reserve Bank of Zimbabwe Monthly Economic Review
Despite the decline in the M3 growth rates, in absolute terms total banking sector deposits increased by 0.44 percent from US$3.44 billion
in March 2012 to US$3.45 billion in April 2012 (Figure 4). There is still need to attract more money into the formal banking sector.
Figure 4: Level & Growth Rate of Total Banking Sector Deposits
Source: Reserve Bank of Zimbabwe Monthly Economic Review

6 Zimbabwe Monthly Economic Review June 2012
In terms of lending to the private sector, bank loans are concentrated in a select number of economic sectors. As of April 2012, the distribution of bank loans was as follows: Distribution (23.2 percent); Agriculture (22.2 percent); Manufacturing (21.7 percent) and Other Sectors (18.6 percent). Banking sector loans
and advances constitute a significant proportion of bank credit to the private sector. As of April 2012, bank credit to the private sector was distributed as loans and advances (84.4 percent); mortgages (7.4 percent); bankers acceptances (3.0 percent); bills discounted (2.6 percent) and other investments (2.5 percent).
Figure 5. Sectoral Distribution of Banking Sector Loans in April 2012
Source: Reserve Bank of Zimbabwe Monthly Economic Review
There is a need to diversify bank loans and advances as concentration may be risky in case of shocks such as droughts or poor harvest in agriculture.
There is also need to revitalize other specialised institutions to fund sectors such as agriculture so that banks are not pressurized to fund agriculture.
Table 5. Total Banking Sector Deposits (US$ Billion)
Type of Deposit Jan-12 Feb-12 Mar-12 Apr-12 Monthly Increase (Absolute) US$ Billion
Monthly Increase (Percent)
Demand Deposits 1.87 2.01 1.93 1.92 0.00 0.16
Saving and Short-Term Deposits 1.01 1.07 0.98 1.06 0.07 7.61
Long-Term Deposits 0.26 0.30 0.53 0.47 -0.06 -10.68
Total Deposits 3.15 3.38 3.44 3.45 0.02 0.44
Source: Reserve Bank of Zimbabwe Monthly Economic Review
Long-term deposits declined by 10.68 percent from US$0.53 billion in March 2012 to US$0.47 billion in April 2012. This development is unfavourable in an environment where borrowers require long-term funding. Most of the borrowers are in the agricultural sector where farmers require long-term finance because the agricultural season is long.
There is still a need to find ways of mobilizing long-term finance.
In April 2012 the composition of total banking sector deposits were: 55.67 percent for demand deposits; 30.63 percent for saving and short-term deposits and 13.7 percent in long-term deposits.

June 2012 Zimbabwe Monthly Economic Review 7
Figure 6. Composition of Total Banking Sector Deposits (Percent of Total Deposits) in April 2012
Source: Reserve Bank of Zimbabwe Monthly Economic Review
The loan-to-deposit ratio increased from 83.8 percent in March 2012 to 84.0 percent in April 2012. Given the prevailing non-performing loans, there is
need for cautiousness by banks in advancing more loans to clients who are already facing challenges in servicing some of the loans.
Figure 7. Loan-to-Deposit Ratio
Source: Reserve Bank of Zimbabwe Monthly Economic Review
2.6 Financial Sector Developments
The Genesis Investment Bank voluntarily surrendered its banking licence to the Reserve Bank of Zimbabwe (RBZ) on 11 June 2012. The Genesis Investment Bank is reported to have failed to realize adequate financing from partners that the bank has been courting since 2009. The RBZ has commenced modalities on liquidating the bank. On 11 June 2012, the RBZ also declared Interfin Bank Limited (IBL) as unsafe and unsound, and subsequently placed it under recuperative curatorship. According to the RBZ, among the reasons underlying Interfin’s unsafe and unsound financial position are: inadequate capitalisation;
concentrated shareholding; abuse of corporate structures; high level of non-performing insider and related party loan exposures; chronic liquidity; income generating challenges; poor board; and, management oversight and violation of banking laws and regulations.
The cases of these two institutions and that of the Renaissance Merchant Bank (RMB) suggest that banking sector vulnerabilities still prevail in the economy, although the systemic effects of these cases is considered small.
On the indigenization of the banking sector, the RBZ has maintained its stance against the current

8 Zimbabwe Monthly Economic Review June 2012
equity-based indigenisation of foreign banks. The RBZ’s argument is that the banking sector is already indigenised, given that only 7 out of 26 banking institutions are foreign owned. The RBZ is advocating for a supply-side indigenisation model.
2.7 Fiscal Performance
For the month of April 2012, total Government revenues amounted to US$247.73 million, which was slightly lower than the US$287.86 million realised in March 2012. This was mainly on account
of corporate tax payments by companies which amounted to US$49.08 million in March 2012 compared to the US$21.18 million in April 2012. On the expenditure front, total expenditures for April 2012 amounted to US$312.71 million against planned expenditures of US$293.01 million. This was on account of employment costs which overshot the planned budget of US$125.91 million at US$135.28 million. Total expenditures for April 2012 were the highest in 2012, they averaged US$240.40 million (Figure 8). As a result, the Government incurred a fiscal deficit of US$64.98 million.
Figure 8. Zimbabwe’s Fiscal Developments
Source: Ministry of Finance, Zimbabwe
For the period under review, cumulative Government revenues amounted to US$1.019 billion against cumulative expenditures of US$1.034 billion, resulting in a cumulative deficit of US$15.01 million.
Going forward there is need to ensure that total expenditures are contained within the available resource envelop given limited sources of financing to finance any expenditure overruns.
2.8 Tourism Sector Developments
On the 29th of May 2012, Zimbabwe, Zambia and the United Nations World Tourism Organizations (UNWTO) signed a trilateral host agreement in Victoria Falls. This compliments the efforts of the Government as it steps up its state of preparedness for the hosting of the UNWTO general meeting to be held in August 2013. This has seen the Government releasing funds for the expansion of the Victoria Falls Airport and the Victoria Falls District Hospital. About US$2.5 million has been set aside
to refurbish the Victoria Falls Airport runway and the construction of a new terminal and a tower. A further US$15 million was availed to refurbish the water reticulation system including the upgrading of sewer plants, construction of a 1,000 cubic meter reservoir for Mkhosana and sewer ponds.
The Tourism sector is also preparing for the Sanganai /Hlanganani –an annual international tourism showcase- to be held from the 18th to the 21st of October 2012. Last year a total of 23 countries were represented; most exhibitors came from China and USA. From the 12-15 May 2012, 34 Zimbabwean companies (hotels, tour operators, car hirers, parks and lodges) exhibited at the Tourism Indaba in South Africa. . Zimbabwean companies will also participate in the following: World Tourism Market in London in November 2012; China International Tourism Market in China in November 2012; and, Gateway in South Africa in September 2012. The main reasons for attending these tourism events are to market Zimbabwe’s tourist destinations and to learn about new tourism

June 2012 Zimbabwe Monthly Economic Review 9
developments in other countries. It is envisaged that this will go a long way towards achieving the Tourism projected growth rate of 13.7 percent for 2012.
2.9 External Sector Developments
Zimbabwe’s external sector position remains subdued with the country importing more than it is
exporting leaving the balance of payment susceptible to external shocks. The first four months of 2012 saw Zimbabwe remaining a net importer of goods and services. Current statistics from ZIMSTAT show that the month of April recorded the highest figure for net imports followed by January (Table 6). The Zimbabwean exports remain skewed towards primary products and intermediate goods which basically have low value.
Table 6. Imports and Exports in US$ Value
Jan-12 Feb-12 Mar-12 Apr-12Exports 394,564,325 366,873,425 371,063,585 272,053,370Imports 598,628,842 464,135,767 504,991,549 482,997,091Net Exports -204,064,517 -97,262,342 -133,927,964 -210,943,721
Source: ZIMSTAT
During the period under review, the country imported mostly from South Africa with total cumulative imports valued at US$871.55 million, while the total exports to South Africa was US$1.05 billion. The other major sources of imports in the region is Zambia and Mozambique, where Zimbabwe imported a total of US$145.3 million and exported a total of US$63.7 million to the two countries.
3. STOCK MARKET DEVELOPMENTS
The stock market continued on a subdued trend which began in the last quarter 2012. The mining index fell to below half its level compared to the
same month in 2011. In May 2011, the index averaged about 200 and has been averaging below 100 in 2012 (Figure 9). This trend has been a result of cautious trading on mining counters by investors developing a wait-and-see attitude pending the clearance of uncertainties regarding the implementation of the indeginisation policy in the sector. In the same way, the industrial index fell, though by a lower margin than its mining counterpart, from an average above 150 in May 2011 to about 130 in May 2012. Overall, the indices have been tracing the overall performance of the manufacturing and financial sector which have been constrained by liquidity challenges.
Figure 9. Industrial and Mining Indices for May 2011 and May 2012
Source: Zimbabwe Stock Exchange
10 Zimbabwe Monthly Economic Review June 2012
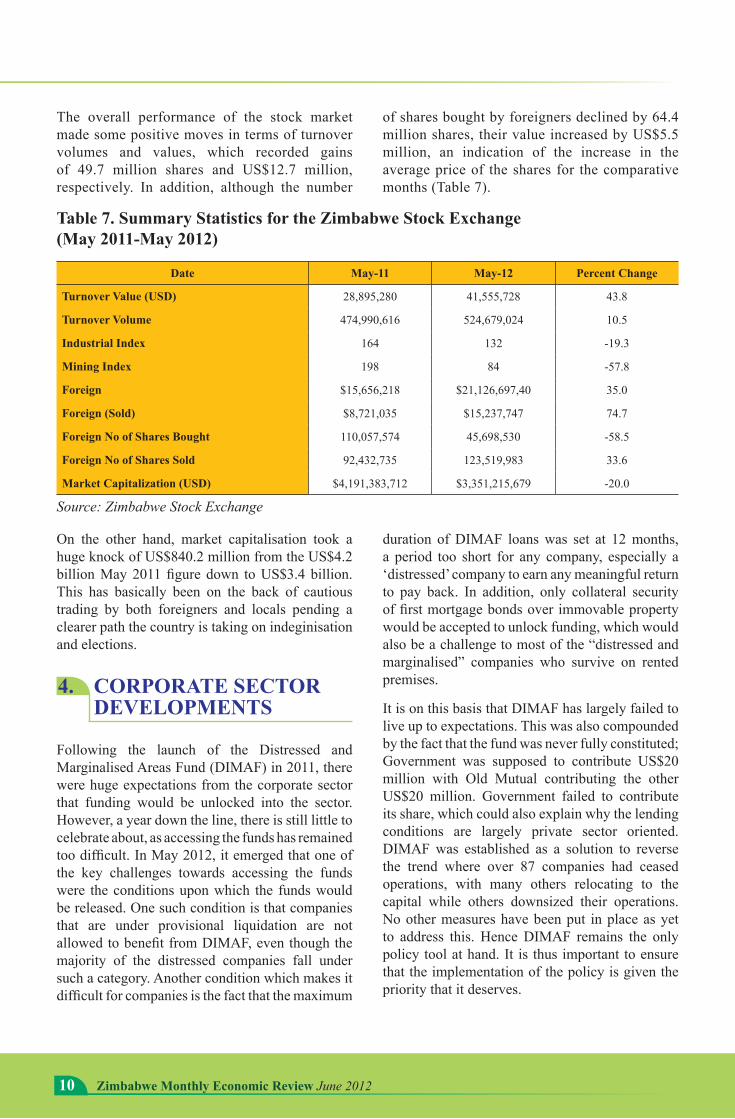
The overall performance of the stock market made some positive moves in terms of turnover volumes and values, which recorded gains of 49.7 million shares and US$12.7 million, respectively. In addition, although the number
of shares bought by foreigners declined by 64.4 million shares, their value increased by US$5.5 million, an indication of the increase in the average price of the shares for the comparative months (Table 7).
Table 7. Summary Statistics for the Zimbabwe Stock Exchange (May 2011-May 2012)
Date May-11 May-12 Percent Change
Turnover Value (USD) 28,895,280 41,555,728 43.8
Turnover Volume 474,990,616 524,679,024 10.5
Industrial Index 164 132 -19.3
Mining Index 198 84 -57.8
Foreign $15,656,218 $21,126,697,40 35.0
Foreign (Sold) $8,721,035 $15,237,747 74.7
Foreign No of Shares Bought 110,057,574 45,698,530 -58.5
Foreign No of Shares Sold 92,432,735 123,519,983 33.6
Market Capitalization (USD) $4,191,383,712 $3,351,215,679 -20.0
Source: Zimbabwe Stock Exchange
On the other hand, market capitalisation took a huge knock of US$840.2 million from the US$4.2 billion May 2011 figure down to US$3.4 billion. This has basically been on the back of cautious trading by both foreigners and locals pending a clearer path the country is taking on indeginisation and elections.
4. CORPORATE SECTOR DEVELOPMENTS
Following the launch of the Distressed and Marginalised Areas Fund (DIMAF) in 2011, there were huge expectations from the corporate sector that funding would be unlocked into the sector. However, a year down the line, there is still little to celebrate about, as accessing the funds has remained too difficult. In May 2012, it emerged that one of the key challenges towards accessing the funds were the conditions upon which the funds would be released. One such condition is that companies that are under provisional liquidation are not allowed to benefit from DIMAF, even though the majority of the distressed companies fall under such a category. Another condition which makes it difficult for companies is the fact that the maximum
duration of DIMAF loans was set at 12 months, a period too short for any company, especially a ‘distressed’ company to earn any meaningful return to pay back. In addition, only collateral security of first mortgage bonds over immovable property would be accepted to unlock funding, which would also be a challenge to most of the “distressed and marginalised” companies who survive on rented premises.
It is on this basis that DIMAF has largely failed to live up to expectations. This was also compounded by the fact that the fund was never fully constituted; Government was supposed to contribute US$20 million with Old Mutual contributing the other US$20 million. Government failed to contribute its share, which could also explain why the lending conditions are largely private sector oriented. DIMAF was established as a solution to reverse the trend where over 87 companies had ceased operations, with many others relocating to the capital while others downsized their operations. No other measures have been put in place as yet to address this. Hence DIMAF remains the only policy tool at hand. It is thus important to ensure that the implementation of the policy is given the priority that it deserves.
June 2012 Zimbabwe Monthly Economic Review 11
5. OTHER TOPICAL ISSUES
Eastern and Southern Arica (ESA)-European Union (EU) Economic Partnership Agreement (EPA) came into effect
On the 14th of May 2012, the first interim Economic Partnership Agreement (EPA) between the EU and four Eastern and Southern African states (Mauritius, Madagascar, Seychelles and Zimbabwe) came into effect. The agreement is in line with the Cotonou Agreement, in which African, Caribbean and Pacific (ACP) countries and the EU opted for a more ambitious trade and development relationship which will also cater for trade in services instead on focusing only on trade in goods in trade negotiations. Under the Partnership Agreement, exports from Mauritius, Madagascar, Seychelles and Zimbabwe will have duty and quota free access to EU market whilst in return the African countries will gradually open their markets to European goods over a period of 15 years, with the exception of certain goods deemed sensitive. However, the opening up of domestic markets to European markets through the elimination of tariffs will expose local producers to competition from EU firms as their ability will be highly limited due to severe supply side constraints and also the country’s ability to use its tariff policy will be bound by the EPA.
Financial Inclusion Survey
FinMark Trust of South Africa in partnership with the Ministry of Finance embarked on a FinScope survey which was conducted by the Zimbabwe
Statistical Agency (ZIMSTAT) from July 2011 to November 2011. The objective of the study was to measure the level of financial inclusion in Zimbabwe. According to the survey results, 40 percent of adults are financially excluded and only 24 percent are banked. 38 percent of the adults are formally served including both banked and other formal bank products and services.
However, there was a significant difference between rural and urban levels of financial inclusion. Only 22 percent of adults in rural areas have access to formal banking and non-bank products, against 38 percent in urban areas despite the fact that 65 percent of Zimbabwe’s population resides in rural areas. The disparity between urban areas and rural areas shows that banking products seem to focus on adults who have a regular source of income. Access to banking services in Zimbabwe according to the study is mainly driven by transactional and saving products, with 19 percent of banked adults using transactional products, 17 percent savings products, 5 percent banking for remittance purposes and only 3 percent use credit banking products. In terms of access and uptake of risk and insurance products, the study showed that 69 percent of adult Zimbabweans do not have any kind of financial cover, whilst 12 percent rely only on informal mechanisms such as burial societies and19 percent have some form of financial risk cover.
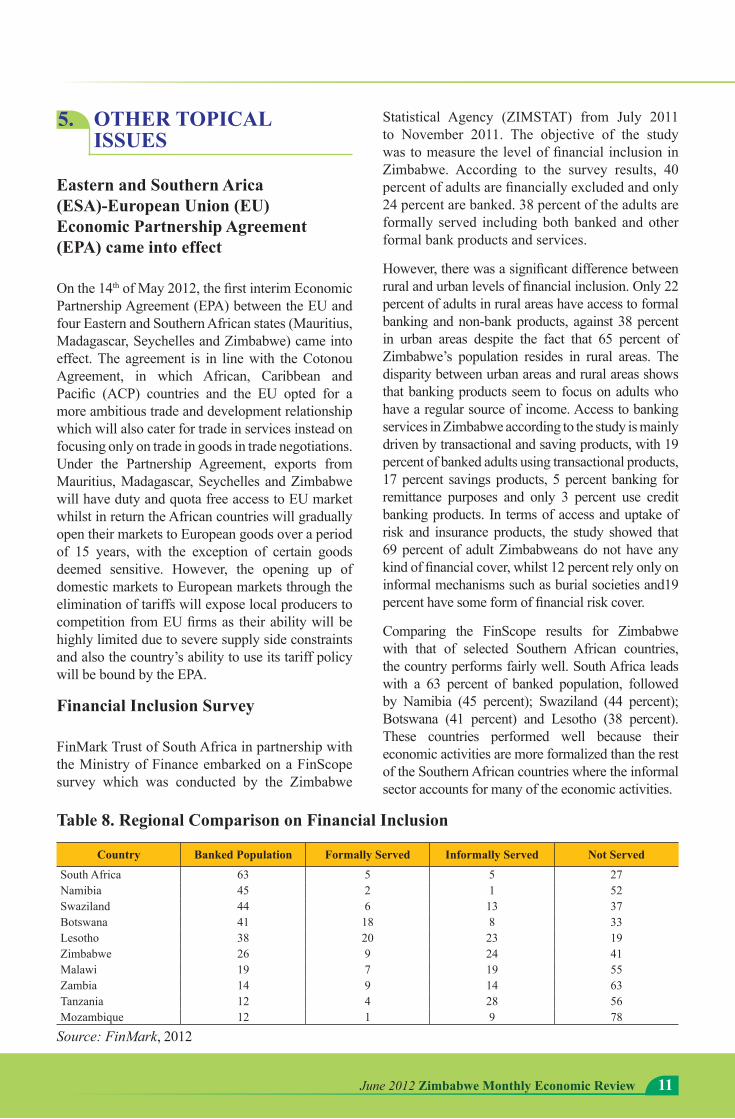
Comparing the FinScope results for Zimbabwe with that of selected Southern African countries, the country performs fairly well. South Africa leads with a 63 percent of banked population, followed by Namibia (45 percent); Swaziland (44 percent); Botswana (41 percent) and Lesotho (38 percent). These countries performed well because their economic activities are more formalized than the rest of the Southern African countries where the informal sector accounts for many of the economic activities.
Table 8. Regional Comparison on Financial Inclusion
Country Banked Population Formally Served Informally Served Not Served
South Africa 63 5 5 27Namibia 45 2 1 52Swaziland 44 6 13 37Botswana 41 18 8 33Lesotho 38 20 23 19Zimbabwe 26 9 24 41Malawi 19 7 19 55Zambia 14 9 14 63Tanzania 12 4 28 56Mozambique 12 1 9 78
Source: FinMark, 2012