ZHAW 2016 - OCCI for monitoring
64
OCCI Monitoring Extension OCCI Monitoring Extension 4th ZWAH summer school in Cloud Computing Augusto Ciuffoletti University of Pisa July, 2016
-
Upload
augusto-ciuffoletti -
Category
Technology
-
view
94 -
download
1
Transcript of ZHAW 2016 - OCCI for monitoring

OCCI Monitoring Extension
OCCI Monitoring Extension4th ZWAH summer school in Cloud Computing
Augusto CiuffolettiUniversity of Pisa
July, 2016
OCCI Monitoring Extension
Monitoring cloud resources: admin and userperspective
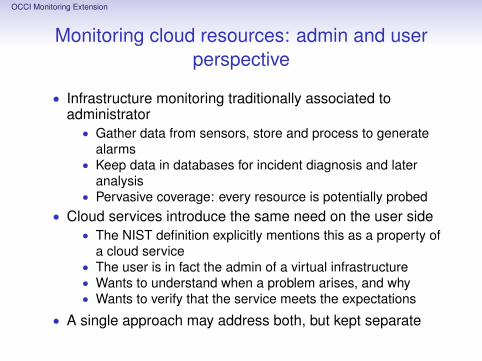
• Infrastructure monitoring traditionally associated toadministrator
• Gather data from sensors, store and process to generatealarms
• Keep data in databases for incident diagnosis and lateranalysis
• Pervasive coverage: every resource is potentially probed• Cloud services introduce the same need on the user side
• The NIST definition explicitly mentions this as a property ofa cloud service
• The user is in fact the admin of a virtual infrastructure• Wants to understand when a problem arises, and why• Wants to verify that the service meets the expectations
• A single approach may address both, but kept separate
OCCI Monitoring Extension
Nagios as a practical solution
• Nagios has long been an excellent solution forinfrastructure monitoring
• modular software design• remote probe deployment and control• highly adaptable using plugins (possibly user-defined)• separates the collection and the management of data
• But it does not scale sufficiently well• difficult to modularize the monitoring infrastructure
• Awkward to dinamically configure• it is based on a configuration file

OCCI Monitoring Extension
Beyond Nagios: new requirements
• De-compose the monitoring infrastructure in subsystems• Big-data aware: consider the presence of aggregation
steps in the data path• Allow the presence of separate planes and data paths for
the user and the admin• On-demand configuration on both planes• Address a multi-provider (federated) environment

OCCI Monitoring Extension
Cloud monitoring
A cloud user wants to have a functional feedback from cloudsourced resources:
• not only to verify service quality, but also to:• control a scalable resource,• provide feedback to the users,• trigger compensating actions
• NIST indicates monitoring as one of the distinctive featuresof cloud computing
OCCI Monitoring Extension
Our option: on demand monitoring
• Provide monitoring as part of the service• Give the user wide possibilities to configure a monitoring
infrastructure• Which metrics are captured and how data are
preprocessed and retrieved• Scale from simple to complex infrastructures
• Do not overkill the problem when the use case is simple• Cope with complex infrastructures
• Resource agnostic• Basic functionalities plus unlimited pluggable extensions

OCCI Monitoring Extension
Summarizing: a IaaS provisioning
• IaaS is just for the example: could be PaaS or anythingelse
OCCI Monitoring Extension
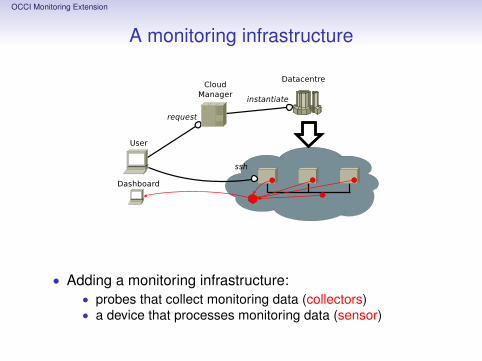
A monitoring infrastructure
• Adding a monitoring infrastructure:• probes that collect monitoring data (collectors)• a device that processes monitoring data (sensor)

OCCI Monitoring Extension
A cloud interface
• we need an interface• an open, extensible standard exists: OCCI
OCCI Monitoring Extension
The OCCI framework
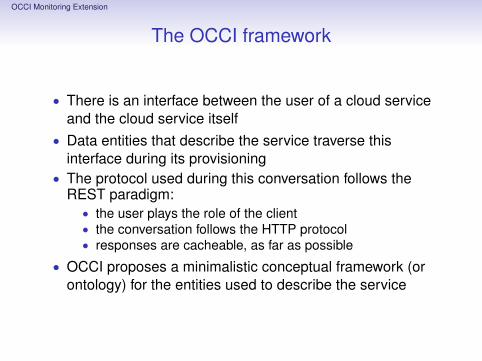
• There is an interface between the user of a cloud serviceand the cloud service itself
• Data entities that describe the service traverse thisinterface during its provisioning
• The protocol used during this conversation follows theREST paradigm:
• the user plays the role of the client• the conversation follows the HTTP protocol• responses are cacheable, as far as possible
• OCCI proposes a minimalistic conceptual framework (orontology) for the entities used to describe the service
OCCI Monitoring Extension
The OCCI core concepts
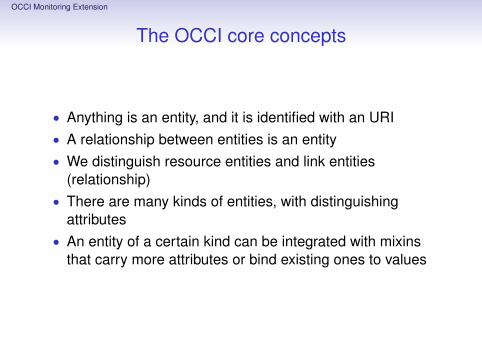
• Anything is an entity, and it is identified with an URI• A relationship between entities is an entity• We distinguish resource entities and link entities
(relationship)• There are many kinds of entities, with distinguishing
attributes• An entity of a certain kind can be integrated with mixins
that carry more attributes or bind existing ones to values

OCCI Monitoring Extension
Basic monitoring operation
• Monitoring is made of three basic activities:• extract operational parameters from a Resource• gather performance parameters and compute the metric of
interest• deliver the measurement to the relevant party
• The last two steps consist of the aggregation andrendering of data
• this makes a candidate for a Resource• The first step entails the collaboration among resources
• this makes a candidate for a Link• The resource is named Sensor, and the link Collector
• and this is bare minimum to compose a monitoringinfrastructure from standard building blocks
OCCI Monitoring Extension
A Sensor
• It is a distiguished activity that needs the provision of cloudresources
• Tightly integrated in cloud infrastructure• Under control of the provider• Tuned using user requests
• The user that wants to exert monitoring instantiates (andpays for) a Sensor
• OCCI role in that is the description of the monitoringinfrastructure
OCCI Monitoring Extension
Describing a Sensor
• Any Sensor has a few generic features• ...they can be included in a standard definition of a Sensor• When the sensor operates• How frequently the sensor produces a new measurement• They are timing attributes
• Other features are specific for the provider• ...they are defined as mixins for the sensor• How data are filtered (low pass, patterns etc.)• How data are rendered (archive, email, streaming etc.)
• There is no limit to the semantics of the mixins• however the hooks to connect a Sensor to a Collector must
be defined
OCCI Monitoring Extension
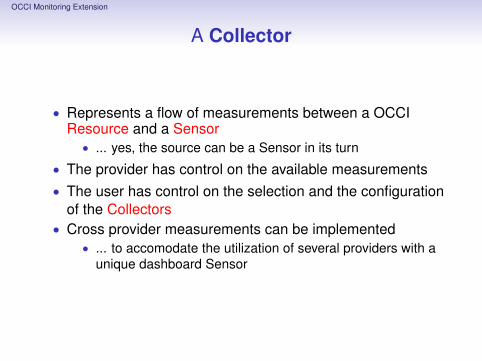
A Collector
• Represents a flow of measurements between a OCCIResource and a Sensor
• ... yes, the source can be a Sensor in its turn
• The provider has control on the available measurements• The user has control on the selection and the configuration
of the Collectors• Cross provider measurements can be implemented
• ... to accomodate the utilization of several providers with aunique dashboard Sensor

OCCI Monitoring Extension
Describing a Collector
• As in the case of the Sensor there are generic attributes ofa collector:
• The sampling period• The accuracy of the sampling period• ... again, just timing
• Other attributes are defined by provider-specific mixinswith an arbitrary semantic
• ...the metric that is measured (throughput, free space,temperature etc.)

OCCI Monitoring Extension
The overall picture (kinds)
• Two entity kinds• Sensor aggregates and delivers measurements• Collector produces measurements

OCCI Monitoring Extension
The overall picture (mixins)
• Three mixin types• Aggregator mixins describe the aggregation activity of a
Sensor• Publisher mixins describe the rendering activity of a Sensor• Metric mixins describe the measurement activity of a
Collector• The two Kinds have a http://schemas.ogf.org/occi/monitoring
schema associated• ...they are standard entities
• The three Mixins may be associated with a providerspecific schema
• ...but we do not exclude that some of them may be part ofanother standard
OCCI Monitoring Extension
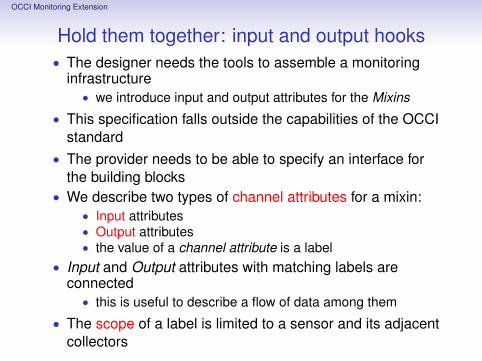
Hold them together: input and output hooks• The designer needs the tools to assemble a monitoring
infrastructure• we introduce input and output attributes for the Mixins
• This specification falls outside the capabilities of the OCCIstandard
• The provider needs to be able to specify an interface forthe building blocks
• We describe two types of channel attributes for a mixin:• Input attributes• Output attributes• the value of a channel attribute is a label
• Input and Output attributes with matching labels areconnected
• this is useful to describe a flow of data among them
• The scope of a label is limited to a sensor and its adjacentcollectors

OCCI Monitoring Extension
Step by step design of a monitoring infrastructure
An example:• One sensor collects measurementes from two resources• Results are rendered through two different channels (e.g.,
streaming and database)• Two distinct meters are applied to each of the two
resources (total four meters)• We combine a metric from both resources (e.g., average
load)
OCCI Monitoring Extension
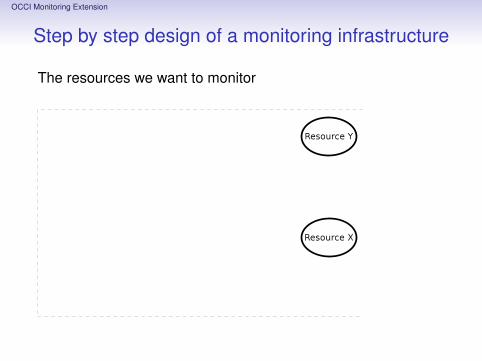
Step by step design of a monitoring infrastructure
The resources we want to monitor
OCCI Monitoring Extension
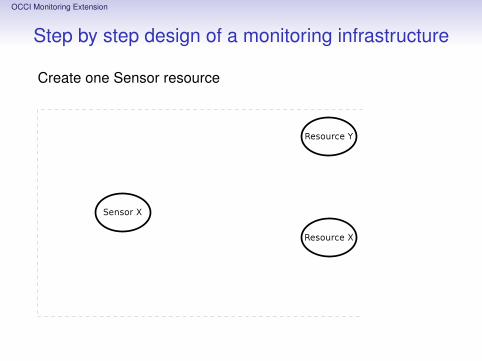
Step by step design of a monitoring infrastructure
Create one Sensor resource

OCCI Monitoring Extension
Step by step design of a monitoring infrastructure
Use two collectors to define the measurement activiy
OCCI Monitoring Extension
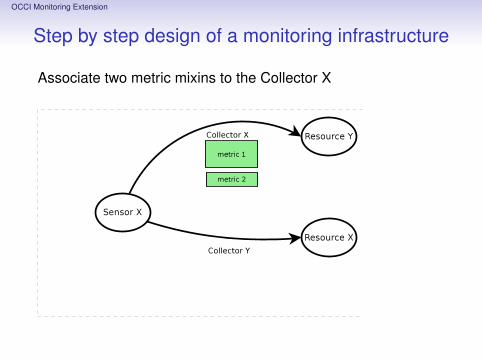
Step by step design of a monitoring infrastructure
Associate two metric mixins to the Collector X
OCCI Monitoring Extension
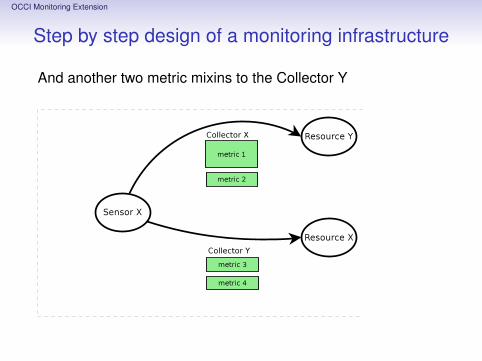
Step by step design of a monitoring infrastructure
And another two metric mixins to the Collector Y
OCCI Monitoring Extension
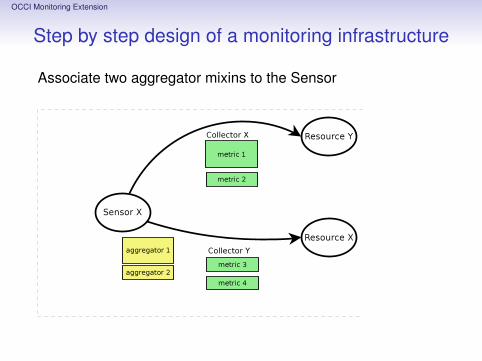
Step by step design of a monitoring infrastructure
Associate two aggregator mixins to the Sensor

OCCI Monitoring Extension
Step by step design of a monitoring infrastructure
One publisher is going to use raw data from the collector

OCCI Monitoring Extension
Step by step design of a monitoring infrastructure
Another is going to receive measurements from theaggregators
OCCI Monitoring Extension
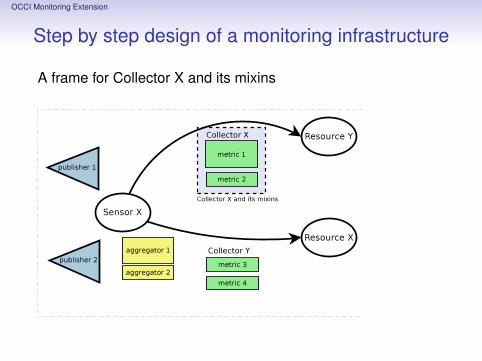
Step by step design of a monitoring infrastructure
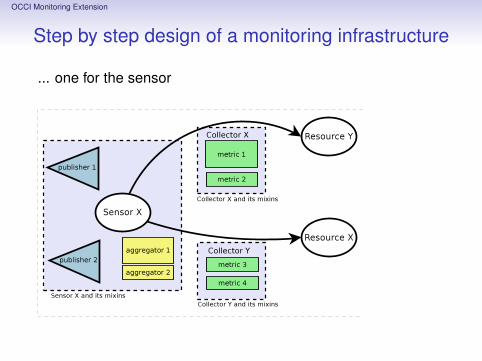
A frame for Collector X and its mixins

OCCI Monitoring Extension
Step by step design of a monitoring infrastructure
... one for Collector Y...
OCCI Monitoring Extension
Step by step design of a monitoring infrastructure
... one for the sensor

OCCI Monitoring Extension
Step by step design of a monitoring infrastructure
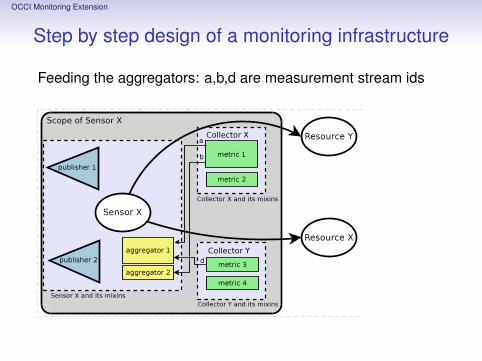
The scope of the Sensor (for metric streams ids)
OCCI Monitoring Extension
Step by step design of a monitoring infrastructure
Feeding the aggregators: a,b,d are measurement stream ids
OCCI Monitoring Extension
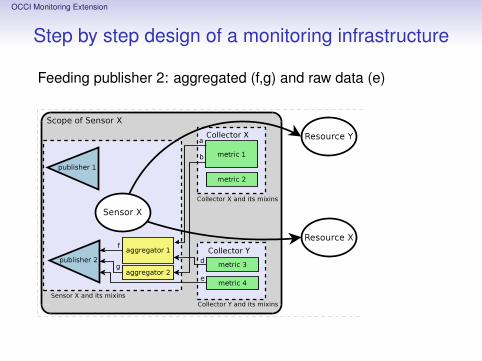
Step by step design of a monitoring infrastructure
Feeding publisher 2: aggregated (f,g) and raw data (e)

OCCI Monitoring Extension
Step by step design of a monitoring infrastructure
Feeding publisher 1: measurement stream b is multicast
OCCI Monitoring Extension
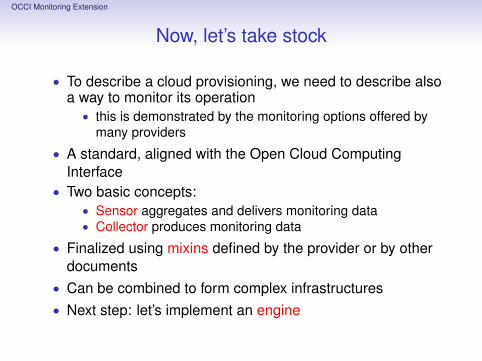
Now, let’s take stock
• To describe a cloud provisioning, we need to describe alsoa way to monitor its operation
• this is demonstrated by the monitoring options offered bymany providers
• A standard, aligned with the Open Cloud ComputingInterface
• Two basic concepts:• Sensor aggregates and delivers monitoring data• Collector produces monitoring data
• Finalized using mixins defined by the provider or by otherdocuments
• Can be combined to form complex infrastructures• Next step: let’s implement an engine
OCCI Monitoring Extension
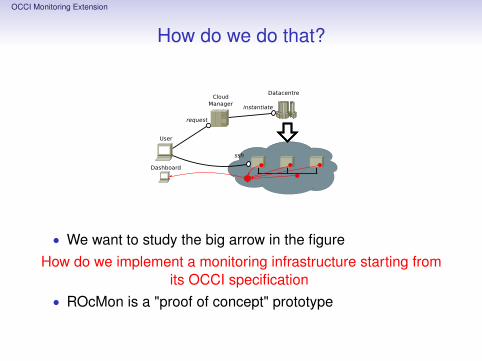
How do we do that?
• We want to study the big arrow in the figureHow do we implement a monitoring infrastructure starting from
its OCCI specification• ROcMon is a "proof of concept" prototype
OCCI Monitoring Extension
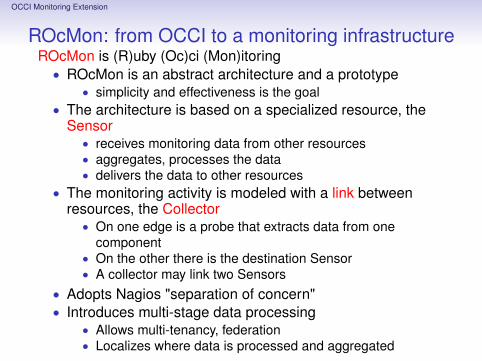
ROcMon: from OCCI to a monitoring infrastructureROcMon is (R)uby (Oc)ci (Mon)itoring
• ROcMon is an abstract architecture and a prototype• simplicity and effectiveness is the goal
• The architecture is based on a specialized resource, theSensor
• receives monitoring data from other resources• aggregates, processes the data• delivers the data to other resources
• The monitoring activity is modeled with a link betweenresources, the Collector
• On one edge is a probe that extracts data from onecomponent
• On the other there is the destination Sensor• A collector may link two Sensors
• Adopts Nagios "separation of concern"• Introduces multi-stage data processing
• Allows multi-tenancy, federation• Localizes where data is processed and aggregated
OCCI Monitoring Extension
Why ROcMon has an OCCI interface?
• To allow dynamic configuration we need to provide aninterface
• A dashboard GUI is not a solution• An API gives full flexibility:
• Software defined monitoring infrastructure• User transparent when needed• Automatic control based on feedback
• OCCI-monitoring provides an effective model for the API:• simple, customizable and expandable• based on an adopted standard• A Sensor is a resource entity• A Collector is a link entity
OCCI Monitoring Extension
Architecture of ROcMon: analysis
• Monitoring is by nature split into small components(remember Nagios)
• monitoring probes are small components, possiblyembedded
• monitoring data crosses a pipe of processors(anonymization, aggregation etc)
• data is finally published using an endpoint reachable fromthe outside (database, web service)
• Each component is supported by a specific technology• e.g., network monitoring vs storage monitoring
• The on demand nature requires agility in deployment• the cloud user that obtains a new resource may want to
monitor it
There is a match betweenmicroservices and on demand monitoring

OCCI Monitoring Extension
Ex cursus about microservices
• A design paradigm for distributed system• a book in O’Reilly "animal series" by S Newman
• Principles:• each component (hosted by a container) in the system is
designed to provide one small, well defined service• each component is a stand alone entity that interacts with
others across a network with a well defined interface
OCCI Monitoring Extension
Reasons to adopt the microservices paradigm
• simplifies maintenance• e.g., upgrade one single container
• agility in deployment• e.g., to scale up or down
• each container may use a different technology• e.g., for technical or performance reasons
• simplifies development• e.g., each container configured by a distinct team
• robustness• e.g., if one container fails there is a chance that the system
still works
OCCI Monitoring Extension
Architecture of ROcMon: sensors as containers
• A sensor represents an autonomous activity• It is implemented by an autonomous Docker container
• configured with required computing capabilities• easy to instantiate/destroy on the fly• allows the implementation of security measures• interacts with standard Internet protocols
• OCCI attributes for a Sensor.• only timing and timing accuracy• specific operation configured with mixins

OCCI Monitoring Extension
OCCI monitoring remind
• A Sensor is a subtype of the Resource type• A Collector is a subtype of the Link type• Add Mixins to specify the type of activity
• Legenda:• the sensor (red) is an OCCI resource• the collectors (blue) are OCCI links• computing boxes and the network are OCCI resources too
OCCI Monitoring Extension
Architecture of ROcMon: sensor mixins• Mixins are one of the tools provided by OCCI for
expandibility• A mixin is a feature that is dynamically added to an entity
(e.g. a sensor)• A mixin can be provided by the service provider
• the provider has control on the functions added to thesensor
• The provider may allow the user to add new mixins• however the operation is still controlled by the provider
• Two kinds of mixin for the Sensor• Aggregator – takes data from a collector and processes the
data• can be used for anonymization, compression, filtering etc.
• Publisher – delivers the results to the outside with givenformat and protocol
• can be used for logging, storage, visualization, triggering,and forwarding to another sensor

OCCI Monitoring Extension
Architecture of ROcMon: mixins as threads
• A Sensor mixin is a defined activity (not a passive resourcefeature)
• In ROcMon a sensor mixin is represented as a thread thatimplements a functionality
• A Sensor may host several mixins, that may be instantiatedon the fly
• Using Ruby reflection mechanisms it is possible toinstantiate a new thread based on a request receivedacross the API

OCCI Monitoring Extension
Architecture of ROcMon: channels as WebSockets
• Monitoring consists of:• the measurement of a number of metrics• their processing along a pipe of functions that extract
relevant information (sensors)• the final delivery or utilization
Relevant paper: NISTIR 8063: Primitives and Elements ofInternet of Things Trustworthiness
• The provisioning of communication along the pipe is part ofthe monitoring service
• ROcMon uses WebSockets for this:• Standard protocol• Uses the same server (sinatra) used for REST configuration• Encrypted communication is immediate (https)

OCCI Monitoring Extension
Architecture of ROcMon: probes as collector mixins
• In the OCCI monitoring document:• The Collector link represents the communication of
measurements between a probe and a sensor• The measured metrics are represented as Collector mixins
• One collector edge is a probe• The probe is implemented as a thread hosting single
measurement tools as sub-threads• Communication is based on WebSockets:
• The probe end opens a WebSocket with the Sensor• The WebSocket on Sensor side routes incoming data to
aggregators and publishers
OCCI Monitoring Extension
ROcMon sandbox
• The VirtualBox VM is our private cloud provider• Exposes a very basic OCCI interface
• remember: it is designed for testing and educationalpurposes
• Two kinds of resources available as Docker images:• generic: a generic compute resource• sensor: the sensor resource we know
• One kind of links available:• collector: the collector link we know
OCCI Monitoring Extension
Docker image construction
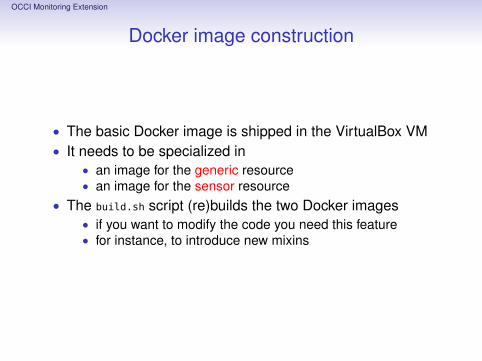
• The basic Docker image is shipped in the VirtualBox VM• It needs to be specialized in
• an image for the generic resource• an image for the sensor resource
• The build.sh script (re)builds the two Docker images• if you want to modify the code you need this feature• for instance, to introduce new mixins
OCCI Monitoring Extension
ROcMon sandbox operation
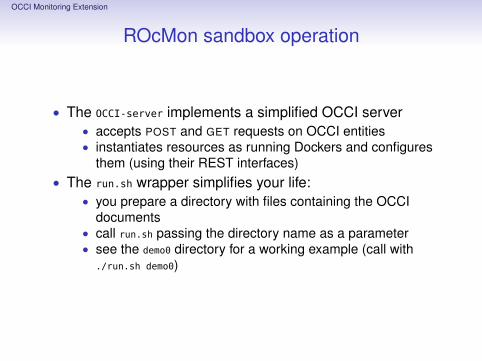
• The OCCI-server implements a simplified OCCI server• accepts POST and GET requests on OCCI entities• instantiates resources as running Dockers and configures
them (using their REST interfaces)• The run.sh wrapper simplifies your life:
• you prepare a directory with files containing the OCCIdocuments
• call run.sh passing the directory name as a parameter• see the demo0 directory for a working example (call with
./run.sh demo0)
OCCI Monitoring Extension
Demo0 layout
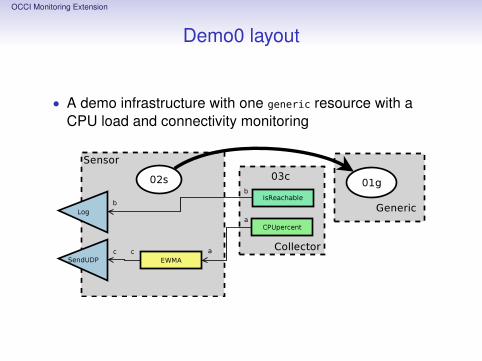
• A demo infrastructure with one generic resource with aCPU load and connectivity monitoring

OCCI Monitoring Extension
Demo0 directory: content
• Contents:• an additional run.sh: displays some info and starts a UDP
socket to receive monitoring results• 01g.json the generic computing resource• 02s.json this sensor: computes the moving average of the
measurements and sends to the UDP socket above• 03c.json the collector: collects two metrics from the generic
resource: CPU load and google pings.• Conventions:
• The prefix digits are used to enforce an ordering inactivation
• The json prefix is mandatory for the documents to beuploaded to the OCCI server
OCCI Monitoring Extension
Demo0 files: the generic computing resource 01g
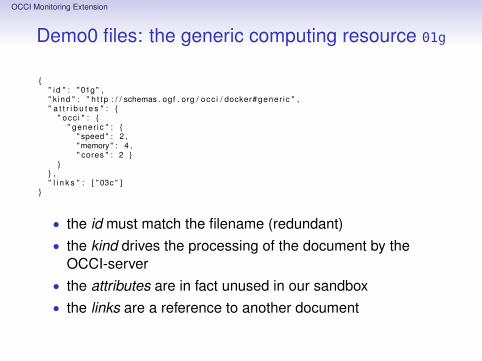
{" i d " : " 01g " ," k ind " : " h t t p : / / schemas . ogf . org / occ i / docker#gener ic " ," a t t r i b u t e s " : {
" occ i " : {" gener ic " : {
" speed " : 2 ,"memory" : 4 ," cores " : 2 }
}} ," l i n k s " : [ " 03c " ]
}
• the id must match the filename (redundant)• the kind drives the processing of the document by the
OCCI-server• the attributes are in fact unused in our sandbox• the links are a reference to another document
OCCI Monitoring Extension
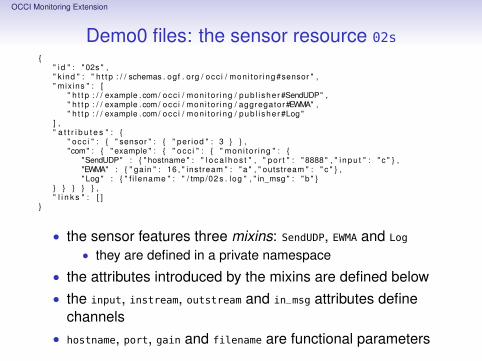
Demo0 files: the sensor resource 02s{
" i d " : " 02s " ," k ind " : " h t t p : / / schemas . ogf . org / occ i / mon i to r ing #sensor " ," mix ins " : [
" h t t p : / / example . com/ occ i / mon i to r ing / pub l i she r #SendUDP" ," h t t p : / / example . com/ occ i / mon i to r ing / aggregator#EWMA" ," h t t p : / / example . com/ occ i / mon i to r ing / pub l i she r #Log "
] ," a t t r i b u t e s " : {
" occ i " : { " sensor " : { " per iod " : 3 } } ,"com" : { " example " : { " occ i " : { " mon i to r ing " : {
"SendUDP" : { " hostname " : " l o c a l h o s t " , " po r t " : " 8888 " , " i npu t " : " c " } ,"EWMA" : { " gain " : 16 , " inst ream " : " a " , " outstream " : " c " } ," Log " : { " f i lename " : " / tmp /02 s . log " , " in_msg " : " b " }
} } } } } ," l i n k s " : [ ]
}
• the sensor features three mixins: SendUDP, EWMA and Log
• they are defined in a private namespace
• the attributes introduced by the mixins are defined below• the input, instream, outstream and in_msg attributes define
channels• hostname, port, gain and filename are functional parameters
OCCI Monitoring Extension
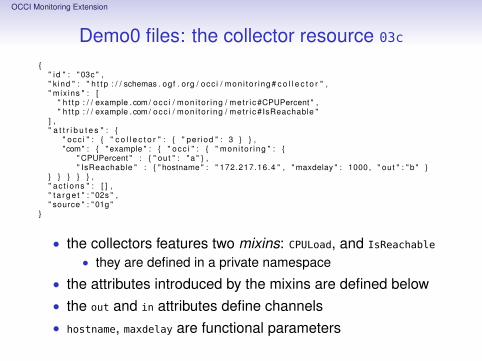
Demo0 files: the collector resource 03c
{" i d " : " 03c " ," k ind " : " h t t p : / / schemas . ogf . org / occ i / mon i to r ing # c o l l e c t o r " ," mix ins " : [
" h t t p : / / example . com/ occ i / mon i to r ing / met r i c #CPUPercent " ," h t t p : / / example . com/ occ i / mon i to r ing / met r i c #IsReachable "
] ," a t t r i b u t e s " : {
" occ i " : { " c o l l e c t o r " : { " per iod " : 3 } } ,"com" : { " example " : { " occ i " : { " mon i to r ing " : {
" CPUPercent " : { " out " : " a " } ," IsReachable " : { " hostname " : " 172.217.16.4 " , " maxdelay " : 1000 , " out " : " b " }
} } } } } ," ac t i ons " : [ ] ," t a r g e t " : " 02s " ," source " : " 01g "
}
• the collectors features two mixins: CPULoad, and IsReachable
• they are defined in a private namespace
• the attributes introduced by the mixins are defined below• the out and in attributes define channels• hostname, maxdelay are functional parameters
OCCI Monitoring Extension
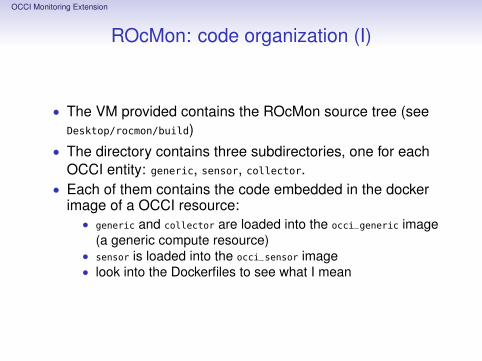
ROcMon: code organization (I)
• The VM provided contains the ROcMon source tree (seeDesktop/rocmon/build)
• The directory contains three subdirectories, one for eachOCCI entity: generic, sensor, collector.
• Each of them contains the code embedded in the dockerimage of a OCCI resource:
• generic and collector are loaded into the occi_generic image(a generic compute resource)
• sensor is loaded into the occi_sensor image• look into the Dockerfiles to see what I mean
OCCI Monitoring Extension
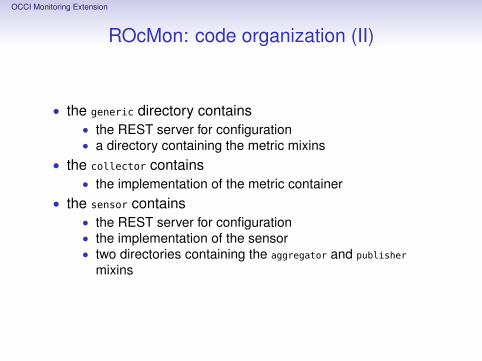
ROcMon: code organization (II)
• the generic directory contains• the REST server for configuration• a directory containing the metric mixins
• the collector contains• the implementation of the metric container
• the sensor contains• the REST server for configuration• the implementation of the sensor• two directories containing the aggregator and publisher
mixins

OCCI Monitoring Extension
ROcMon: mixins commons
• They finalize the definition of abstract methods of the classcorresponding to the mixin tag
• A hash with the operational parameters is an instance@variable
• Input is received through channels• Hash entries correspond to mixin parameters• Output is
• returned to the caller (metric)• forwarded through a channel (aggregator and publisher)
OCCI Monitoring Extension
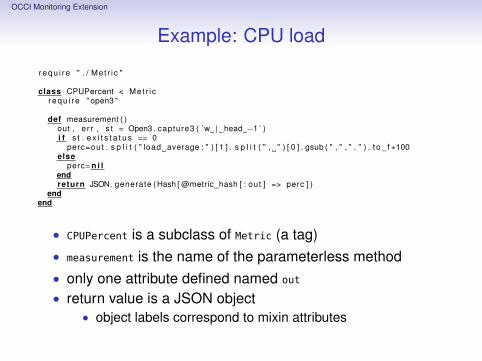
Example: CPU load
r equ i re " . / Met r i c "
class CPUPercent < Met r i crequ i re " open3 "
def measurement ( )out , er r , s t = Open3 . capture3 ( ’w | head −1 ’ )i f s t . e x i t s t a t u s == 0
perc=out . s p l i t ( " load average : " ) [ 1 ] . s p l i t ( " , " ) [ 0 ] . gsub ( " , " , " . " ) . t o _ f∗100else
perc= n i lendreturn JSON. generate ( Hash [ @metric_hash [ : out ] => perc ] )
endend
• CPUPercent is a subclass of Metric (a tag)• measurement is the name of the parameterless method• only one attribute defined named out
• return value is a JSON object• object labels correspond to mixin attributes

OCCI Monitoring Extension
Example: EWMA (I)
r equ i re " . / Aggregator "class EWMA < Aggregator
def i n i t i a l i z e ( sensor_hash , aggregator_hash , syncChannels )superbegin
addChannel ( @aggregator_hash [ : inst ream ] . to_sym )addChannel ( @aggregator_hash [ : outstream ] . to_sym )
rescue Except ion => eputs " Problems adding a channel : #{e . message } "puts e . backtrace . inspec t
endend
• EWMA is a subclass of Aggregator (a tag)• first execute superclass initialize to fill instance variables• the initialize method uses channel labels to create
internal queues• note that instream and outstream are the channel attributes
names
OCCI Monitoring Extension
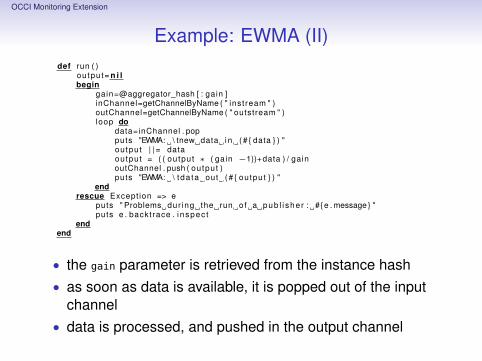
Example: EWMA (II)def run ( )
output= n i lbegin
gain=@aggregator_hash [ : gain ]inChannel=getChannelByName ( " inst ream " )outChannel=getChannelByName ( " outstream " )loop do
data=inChannel . popputs "EWMA: \ tnew data i n ( # { data } ) "output | | = dataoutput = ( ( output ∗ ( gain −1))+data ) / gainoutChannel . push ( output )puts "EWMA: \ tda ta out ( # { output } ) "
endrescue Except ion => e
puts " Problems dur ing the run of a pub l i she r : #{e . message } "puts e . backtrace . inspec t
endend
• the gain parameter is retrieved from the instance hash• as soon as data is available, it is popped out of the input
channel• data is processed, and pushed in the output channel
OCCI Monitoring Extension
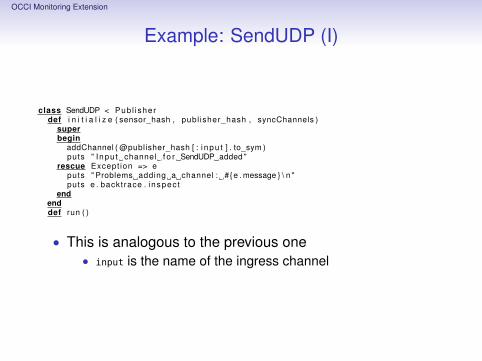
Example: SendUDP (I)
class SendUDP < Pub l i sherdef i n i t i a l i z e ( sensor_hash , publ isher_hash , syncChannels )
superbegin
addChannel ( @publisher_hash [ : i npu t ] . to_sym )puts " Inpu t channel f o r SendUDP added "
rescue Except ion => eputs " Problems adding a channel : #{e . message } \ n "puts e . backtrace . inspec t
endenddef run ( )
• This is analogous to the previous one• input is the name of the ingress channel

OCCI Monitoring Extension
Example: SendUDP (II)
beginsocket = UDPSocket . newinChannel=getChannelByName ( : i npu t )loop do
data=inChannel . popputs "UDPSOCKET: \ tnew data rece ived ( # { data } ) "begin
socket . send ( " data="+data . to_s+" \ n " ,0 ,@publisher_hash [ : hostname ] ,@publisher_hash [ : po r t ]
)rescue Except ion => e
puts " Problems sending wi th UDP( 2 ) : #{e . message } "puts e . backtrace . inspec t
endputs "UDPSOCKET: \ tda ta sent to socket ( # { data } ) "
endrescue Except ion => e
puts " Problems sending wi th UDP: #{e . message } "puts e . backtrace . inspec t
endend
• Slightly more complex than the previous: need to managea UDP socket!