
Zero Trends: Health as a Serious Economic Strategy
40
Realizing the promise and Competitive Advantage of: “Creating and Maintaining a Thriving and Sustainable Workplace and Workforce” 1 June 4, 2013 ©2013 Edington Associates Edington Associates LLC Zero Trends: Health as a Serious Economic Strategy
Transcript of Zero Trends: Health as a Serious Economic Strategy

Realizing the promise and Competitive Advantage of: “Creating and Maintaining a Thriving and Sustainable Workplace and Workforce”
1 June 4, 2013
©2013 Edington Associates
Edington Associates LLC
Zero Trends: Health as a Serious Economic Strategy

©2012 Edington Associates 2
Future Economic Strategy for Health
Strategies to cope with Healthcare as an
Economic Strategy
And Health as a Strategy to Build a
Thriving, High Performing and Sustainable
Individual, Family, Workforce
Workplace, Community, State, … Past to Current Strategies to Disruption Innovation

©2012 Edington Associates 3
Wellness Continuum: 1970-2013
Chronic Signs &
Symptoms Feeling OK
Premature Sickness, Death, Disability
High-Level Wellness, Energy, Vitality
Edington. 1983, Modified 2008

©2012 Edington Associates 4
Natural Flow of a Population
Challenge!
Can you beat the Natural Flow
of decreasing population
health status?

©2012 Edington Associates 5
Estimated Prevalence of Health Risks
OVERALL RISK LEVELS
Low Risk = 0-2 risks
Medium Risk = 3-4 risks
High Risk = 5 or more
From the UM-HMRC Medical Economics Report Estimates based on the age-gender distribution of a specific corporate employee population
Health Risk Measure
Body Weight Stress Safety Belt Usage Physical Activity Blood Pressure Life Satisfaction Smoking Perception of Health Illness Days Existing Medical Problem Cholesterol Alcohol Zero Risk
High Risk
41.8% 31.8% 28.6% 23.3% 22.8% 22.4% 14.4% 13.7% 10.9% 9.2% 8.3% 2.9% 14.0%

©2012 Edington Associates 6
Natural Flow: by Risk Status
1640 (35.0%)
4,163 (39.0%)
678 (14.4%)
High Risk (>4 risks)
Low Risk (0 - 2 risks)
Medium Risk (3 - 4 risks)
2,373 (50.6%)
21,750 (77.8%)
4,546 (42.6%)
10,670 (24.6%)
4,691 (10.8%)
27,951 (64.5%)
11,495 (26.5%)
5,226 (12.1%)
26,591 (61.4%)
892 (3.2%)
1,961 (18.4%)
5,309 (19.0%)
Modified from Edington, AJHP. 15(5):341-349, 2001
Average of three years between measures

©2012 Edington Associates 7
Natural Flow by Risks-Costs-Age
$0
$3,000
$6,000
$9,000
$12,000
19-34 35-44 45-54 55-64 65-74 75+
$1,776 $2,193 $2,740
$3,734 $4,613 $5,756
$1,414 $2,944 $3,800
$5,212
$6,636 $8,110
$2,565 $3,353
$4,620
$6,625
$7,989 $8,927
$5,114 $5,710
$7,991
$10,785 $11,909 $11,965
Low
Annual Medical Costs
Med Risk
Age Range
High
Non-Participant
Edington. AJHP. 15(5):341-349, 2001

Population Health Management Strategy
0
1000
2000
3000
4000
5000
6000
7000
8000
9000
Q_12 Q_10 Q_8 Q_6 Q_4 Q_2 Q0 Q2 Q4 Q6 Q8 Q10 Q12
Serious CostsMedium CostLow Cost
Health Management --healthy stay healthy --don’t get worse
Disease Management --stay on protocol --don’t get worse
Sickness Management --reduce errors --coordinate services
Where is the economic strategy?

9
Don’t Get Worse
Help the Low-Risk
stay Low-Risk
Help the High-Risk move to Low-Risk
Recommendations for the Population after 30 years of work 1977-2009
(Zero Trends)

©2012 Edington Associates 10
Medical and Wellness Strategies
Wait for Disease or Health Risks and then Treat
In Quality terms this strategy translates into “wait for defects
and then fix the defects”

©2012 Edington Associates 11
What’s Next?
Change the questions
Get to a new level of thinking
Adjust our vision of the future
Have courage to change our definitions
Lead, follow or get out of the way
…it’s time for Disruption Innovation

©2012 Edington Associates 12
Where Do We Go Next
The world we have made as the result of the level of thinking we have done thus far creates problems we cannot solve at the same level of thinking at which we created them.
- Albert Einstein

13
Business Strategy for Health
©2012 Edington Associates

©2012 Edington Associates 14
Health Strategies for 2013 and Beyond
Integrate the Whole Person into the Environment and Culture and Engage in Population Health
(Follow the lead of Safety and Quality)
(…in Quality terms this strategy translates into “fix the systems that lead to the
defects”) (Deming, Drucker, Blanchard)

15
Vision from Zero Trends
Zero Trends provides a
transformational approach
Organizations throughout
the world live within a thriving and sustainable
workplace and workforce
Based upon over 800 Publications and Presentations

Enterprise Wide Engagement
Employer of Choice
Health and Wellbeing
All Employees engaged
Human Resources
Senior Leaders
Strategy Talent
Progress and Feedback
All Managers
Quality
Alignment
Safety
The whole is greater than the sum of the parts!!!
Culture and Environment

©2012 Edington Associates 17
Thriving and Sustainable Workplace and Workforce for 2013 and Beyond: Strategic
Create a Thriving and Healthy Workforce
Champion Company
Gains in Organizational Objectives
Health Status Economics Absence Worker’s Comp. Presenteeism Financial Metrics Engaged Workers Recruitment Retention Happiness Company Visibility Social Responsibility
1981, 1995, 2000, 2006, 2008, 2012 Edington Associates
Create a Supportive Environment and Culture
Create the Vision and Strategy
Move Healthy Well-Being into the Culture •Senior Leadership •Operations Leadership •Self-Leadership •Recognize Positive Acts •Quality Assurance

18
Four Stakeholders of Health Management and the Communications Between Them
Senior Leadership
Associates
Managers
Learning / Human
Resources
Spouses Dependents

Organizational Barriers
Senior Leadership Lack of support Lack of clear vision
Operations Leadership Supervisor lack of support Lack of supportive culture Incomplete Communication
Self Leadership Don’t understand why Lack of self-efficacy
Lack of time, convenience
Recognize Positives Lack of positive recognition
Quality Assurance Lack of feedback on progress Lack of shared values, vision 19
Fix The Barriers to Healthy, Thriving and Sustainable Workplaces and Workforces

Strategic-Systematic-Systemic-Sustainable
Vision Builder
Capture and Store Objectives
Administration of Audit and Surveys (Culture, Environment,
Community)
Tracks progress toward goals for: • Pillars • Process • Outcomes • Views for all
Stakeholders
4) Work Teams to Address Gaps
Qualitative Inquiry
Perception of Culture Survey
Environmental Audit
20
1) Strategic Session with CEO and C-Suite
2) Executive Steering Committee
4) Train all Stakeholders
4) Wellness Program Audit
Develop vision and purpose Outline objectives and Metrics
3) Present Gap Analysis Findings
Engage a committee to expand to initiative to a strategic and enterprise level initiative
Present results and Strategic recommendations to senior stakeholders
5) Organizational Positioning system
On- or off-line Administration
“Real-time” tracking of Journey process
Define and track success targets
3) Conduct Organizational Health Assessment
©2012 Edington Associates
Existing Wellness Program
Existing or New Wellness Program

Principles of Senior Leadership
Step #1 Strategic Create the Vision
• Connect vision to business strategy
• Provide measures to get to vision
• Commitment to healthy culture
• Provide adequate resources
• Leadership ownership and engaged
“Establish the business value of a healthy and high performing organization and workplace as
a world-w ide competitive advantage” ©2010: Health Transformation Group, LLC 21

Alignment of Policies with Vision • Assess Organizational Health • Fix the gaps in the environment and
culture • Train all employees in What, Why, How • Conduct a wellness program audit • Brand health management strategies
“You can’t put a changed person back into the same environment and expect the change to hold”
Principles of Operations Leadership
Step #2 Systematic, Systemic
22 ©2010: Health Transformation Group, LLC Not for Distribution

The EA Organizational Health Assessment
Environmental Audit
• Assess what exists and doesn’t exist in current environment and culture
• Conduct audit with wellness professionals and human resource representatives
• Survey entire employee population
• Assesses employees’ and managers’ perception of supportive environment and culture
• Employee focus groups
• Individual interviews with key stakeholders
• One-on-one interactions with key stakeholders
GAP ONE: Perceptions of current
environmental & cultural practices compared to
“Ideal”
GAP TWO: Manager’s perceptions of environment
& culture compared to vision
GAP THREE: Employee’s perceptions of
environment, culture and management support compared to vision
Qualitative Inquiry Perception of Culture
Health management strategy based on addressing these key gaps
Additional qualitative information to help
identify opportunities for improvement

©2012 Edington Associates 24
Fix the Gaps and Beware of the Barriers

EA Core Content • Champion Company Journey • Environment and Culture • Positive examples/Powerful stories • Self-leadership skills
Managers • Positive role modeling • Encouraging success • Intrinsic/Extrinsic motivators
Employees • Self-leadership skills • Resilience and strengths • Everyday decisions
Wellness Leaders • Support networks • Community of change • Wellness conversations
Senior Leaders • Zero Trends • Drivers of Impact • Shared Vision/Values/Mission
Operations Leaders • Communications/Branding • Strategic planning • Maximizing engagement
Training Suite: What, Why, How
©2012 Edington Associates 26
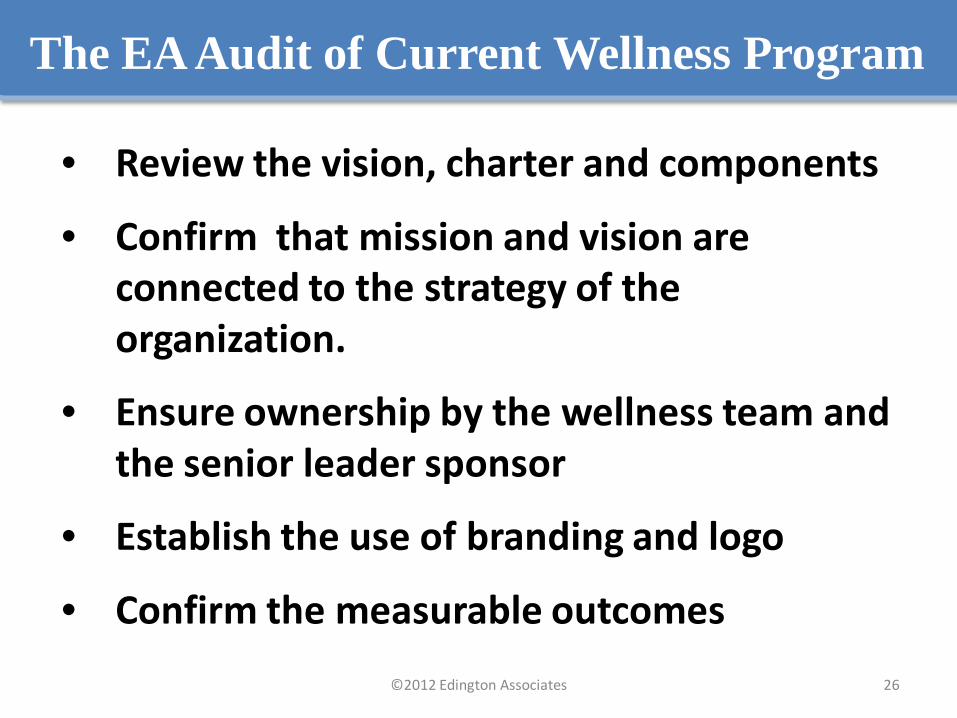
The EA Audit of Current Wellness Program
• Review the vision, charter and components
• Confirm that mission and vision are connected to the strategy of the organization.
• Ensure ownership by the wellness team and the senior leader sponsor
• Establish the use of branding and logo
• Confirm the measurable outcomes

©2012 Edington Associates 27
Lifestyle Scale for Populations: Beyond Zero Trends
Chronic Signs &
Symptoms Feeling OK
Premature Sickness, Death & Disability
High-Level Wellness, Energy, Vitality
Edington. 1983, Modified 2008, Modified 2012
Chronic Signs &
Symptoms Feeling OK
Premature Sickness,
High-Level Wellness
Self-Leader Thriving Sustainable Energetic Well-Being

28
Incorporate Determinates of Health
Individual Supportive Community
Supportive Family and
Friends
Supportive Workplace
Thriving Employee
©2012 Edington Associates Living and Thriving Assessment

Systemic
Create Winners •Help people not get worse •Help health people stay healthy •Train in basic concepts of living and Thriving •Provide improvement, wellness and maintenance programs
“Create winners, one step at a time and the first step is don’t get worse’
Principles of Self-Leadership
29 ©2010: Health Transformation Group, LLC Not for Distribution
Step #3

Vision for Self-Leadership
Personal Control
Optimism
Self-Leadership
Resilience
Confidence/ Self-efficacy
Self-Esteem
Knowledge Health Literacy Negotiation Skills
Vitality/Vigor
Consumerism Engaged
patient role
Social Support −Colleagues −Community −Family
Environment and culture
30 © 2012 Edington Associates
Other characteristics: Change, Integrity, Trust, Thrive, Enthusiasm, Ethical, Spiritual, Creative, Flexible,
Low-Risks and Behaviors
Purpose, Values, Mission, Vision

Positive Outlook
Happiness
Brain Health
Emotions & Intuitions
Mental
Shortcuts and Biases
Environment
Values
Purpose
Vision
Focusing on Strengths
Positive
Reframing
Creating a Plan for Change
Fundamental Skills for Self-Leaders

Ray Grace April Will
User-tested Design Elements
© 2012 Edington Associates 32

Systemic, Sustainable
Reinforce the Culture of Health •Alignment of recognition to the vision
• Reward champions
• Set incentives for healthy choices
• Reinforce at every touch point
“What is rewarded is what is sustained”
Principles of Positive Actions
33 ©2010: Health Transformation Group, LLC Not for Distribution
Step #4

Sustainable • Integrate all data
• Evaluate program outcomes
• Use a conceptual outcomes framework
• Provide feedback on how progress was obtained and steps to get to vision
• Feedback on leadership, culture, self-leadership, positive actions, economic outcomes
“Supports decisions with evidence”
Principles of Quality Assurance
34 ©2010: Health Transformation Group, LLC Not for Distribution
Step #5

©2012 Edington Associates 35
CPS Platform-Organizational Health
Program Process Data3
Environmental Audit
Perception of Culture Survey
Health Assessment
Data1
Productivity Data2
Service Utilization2
Self-Leadership Modules3
Inputs
Proprietary Algorithms
Consolidated Data
Comprehensive and Timely Feedback
Guides the Journey
Edington Engine
1Health assessment data can be collected via the Healthy Life Assessment, or HRA data from an external source can be mapped and uploaded.
2Assessments in CPS collect self-reported information. Data from external sources (i.e., short- and Long-term disability claims, medical and pharmacy claims, etc., can be mapped and uploaded as needed. 3External data feeds
• Trends and Metrics
• Reports • Scorecards for…
Outputs
Outcomes Based on a Comprehensive
Evaluation Framework

36
Comprehensive Impact Framework
Engagement in Health*
Engagement in Work**
Foundations Senior Leadership
Healthy Environment, Healthy Culture
Engaged Employees
I. Evaluate the Foundations
II. Evaluate Process and Engagement III. Evaluate Impact
Continuous Feedback
Loop
Operations Leadership
Self-Leadership Recognition Quality Assurance
Knowledge comes when Relationships are Connected to Outcomes
Psychosocial Impact Health Status Health and Safety Behaviors
Healthy People: Health and Well-Being Metrics
Productivity
Work Satisfaction
Service Utilization Healthy Company
Short-term Moderate-Term Longer-Term
Family and Home Impact
Community Impact
Financial Outcomes
Overall Satisfaction

Where do we want to go?
Where are we now?
How do we get there?
Dashboards and Reports: • Foundations – Pillars • Process and Engagement • Outcomes - Leading and
Lagging Indicators of Impact
CLIENT USER INTERFACE

38
Thriving Workforce
100%
GPS for Populations
Healthy Workplace 100%
Disengagement and Stress
<50%
Provides a clear view of: • Where you are today (Gap Analysis) • Where you want to go (Vision, Objectives) • How you plan get there (Strategic Planning) • Roadblocks, Detours (Ongoing Evaluation) • Are we on track (Reports, Dashboards) • Are we there yet? (Success Metrics)
How Does the CPS Work?
3 Strategic Vision from
Leaders
Systematic & Thriving
Culture
Systemic Engage all
in the Culture
Recognize Positive Actions,
WorkTeam
Sustained Progress
in all areas
2 Speech from
Leader
Internal Wellness Program
Screenings & Reduce High-Risks Coaching
Incent High-Risk Reduction
Change in Risks, ROI
1 Inform Leader
Out-source Wellness
Screenings & Reduce High-Risks
Incent High-Risk Reduction
Change in Risks
0 Do Nothing
Do Nothing
Do Nothing
Do Nothing
Do Nothing
Pillar 1 Pillar 2 Pillar 3 Pillar 4 Pillar 5
Which Sustainability Level is for You Sustainability Rating
Do Nothing
Core to the Organization
Comprehensive
Traditional
Senior Leadership
Operations Leadership
Self-Leadership
Rewards for Positive
Actions
Quality Assurance
Five Pillars

Phone: 734.476.7332 (USA) 734.998.8326 (USA)
Email: [email protected]
Website: www.edingtonassociates.com
Edington Associates LLC University of Michigan North Campus Research Center 1600 Huron Parkway Ann Arbor MI 48109
©2012 Edington Associates 40
Thank you for your attention


