Zero-field paramagnetic resonance of trivalent gadolinium ... · variety of trivalent-metal-ion...
16
PHYSICAL 8KVIKN 8 j. JUNK 1975 Zero-field paramagnetic resonance of trivalent gadolinium in several lanthanide tris(ethylsulfate) nonahydrates and nonadeuterates: Determination of crystal-field and hyyerfine-structure parameters*l 6 E. R. Bernstein and G. M. Dobbs~ Department of Chemistry, Princeton University, Princeton, New Jersey 08540 (Received 5 June 1974) Employing isotopically pure trivalent '"Gd, "7Gd, and '6 Gd as impurities in dilute mixed crystals of lanthanum tris(ethylsulfate) nonahydrate [La(C,HSSO4)3 ~ 9H, O], it has been possible to determine both accurate zero-field splitting parameters of crystal-field origin and hyperfine-structure constants due to magnetic dipole and electric quadrupole interaction terms. The zero-field paramagnetic-resonance spectroscopic method employed herein, has allowed the absolute signs of the hyperfine parameters to be determined. Thus the magnitude and sign of all diagonal parameters of the zero-field effective spin Hamiltonian are accurately known. It is reasoned that the quadrupole hyperfine constant is due, almost entirely, to lattice contributions; moreover, it is shown to be of the expected order of magnitude and sign. The hyperfine anomaly is discussed and is shown to be slightly less than the experimental error limits (three standard deviations). A set of crystal-field parameters are reported for the first time for Gd in crystals of La(C2H&804), ~ 9D,O, which differ significantly from those of the hydrate. Variations of crystal-field parameters with various lanthanide host ions are also observed. Finally, a few comments concerning zero-field linewidths and their measurement are made. I. INTRODUCTION Zero-field paramagnetic resonance (ZFPMR) is an imPortant technique for observing magnetic-di- pole transitions in the microwave region of the spectrum. These transitions are usually between energy levels split by crystal-field and hyperfine interactions in transition metal, lanthanide, and actinide ions. To date, such systems have been mainly studied by conventional electron-paramag- netic-resonance (EPR) spectroscopy in the presence of a strong Zeeman perturbation which forces dif- ferences in energy levels to match the energy of a source oscillator. In ZppMR the microwave source is tuned to match the energy spacings of the sample. The data presented in this work empha- size the comparison between high- and zero-field paramagnetic resonance, particularly for improved hyperfine-structure resolution and crystal-field- splitting determinations. One of the long-standing problems of EPB spec- troscopy of ions in crystals is that of the unexpected and unexplained crystal field a,nd hyperfine struc- ture of 8-state ious (1, e, ~ tons with haU-filled shells such as 4f'), particularly in the lanthanide series. The usual lanthanide 8-state ions are Eu~, Gd ', and Tb '; of these three 4f 8-state ions Gd ' 18 the most widely and readily obtainable chemi- cally. Its lattice substitutional properties in a variety of trivalent-metal-ion crystal-host materi- als' makes Gd" an ideal choice for such a study. In the treatment of gadolinium paramagnetic reso- nance a flctltlous spin 8 = & ls used ln con]unction with a spin Hamiltonian to describe the spectrum in an empirical manner. This convenient descrip- tion is possible because the spectrum always dis- plays the site symmetry of the ion. An exhaustive tabulation has been provided by Buckmaster and Shing. ' Many mechanisms have been proposed for the splitbng, but no single one can account for the mag- nitude and sign of the observed splitting. This area of intense research has been many times reviewed and discussed in detail. '7 In order to evaluate a given theoretical mechanism for crystal-field split- ting of the 897&~ ground state of Gd ', the calculated over-all splitting should be compared with the mea- sured value (this work)' 725S. 4+ 9. 6 MHz for La(C2H, SO4)3 ~ QH~O: Gds'. All mechanisms proposed to account for crystal- field splitting of Gds' could, until very recently, be classified into three groups: much too large, much too small, and about the right magnitude but of the wrong sign. However, using an effective oper- ator technique, Newman and Urban~' were able to calculate "intrinsic spin-Hamiltonian parameters. " It is their contention that, due to geometric factors and a linear superposition of contributions from neighboring ligands, measured crystal-field pa- rameters, especially quadrupolar ones, may or may not have the same sign as calculated (intrin- sic) ones. It is clear that these concepts give both sign and rough order-of-magnitude agreement be- tween crystal-field spin-Hamiltonian parameters obtained from theory and experiment. '~3 The con- clusion is that, at least for YVO4, YPO4, tuPO4, LuAsO„and Car~, correlation and relativistic crystal-f ield effects contribute most significantly to the observed splittings. Indeed, these authors indicate that the previous calculation by %'ybourne
-
Upload
duongnguyet -
Category
Documents
-
view
219 -
download
0
Transcript of Zero-field paramagnetic resonance of trivalent gadolinium ... · variety of trivalent-metal-ion...

PHYSICAL 8KVIKN 8 j. JUNK 1975
Zero-field paramagnetic resonance of trivalent gadolinium in several lanthanidetris(ethylsulfate) nonahydrates and nonadeuterates: Determination of crystal-field and
hyyerfine-structure parameters*l6
E. R. Bernstein and G. M. Dobbs~Department of Chemistry, Princeton University, Princeton, New Jersey 08540
(Received 5 June 1974)
Employing isotopically pure trivalent '"Gd, "7Gd, and '6 Gd as impurities in dilute mixed crystals oflanthanum tris(ethylsulfate) nonahydrate [La(C,HSSO4)3 ~ 9H,O], it has been possible to determine bothaccurate zero-field splitting parameters of crystal-field origin and hyperfine-structure constants due tomagnetic dipole and electric quadrupole interaction terms. The zero-field paramagnetic-resonancespectroscopic method employed herein, has allowed the absolute signs of the hyperfine parameters to bedetermined. Thus the magnitude and sign of all diagonal parameters of the zero-field effective spinHamiltonian are accurately known. It is reasoned that the quadrupole hyperfine constant is due, almost
entirely, to lattice contributions; moreover, it is shown to be of the expected order of magnitude andsign. The hyperfine anomaly is discussed and is shown to be slightly less than the experimental errorlimits (three standard deviations). A set of crystal-field parameters are reported for the first time for
Gd in crystals of La(C2H&804), ~ 9D,O, which differ significantly from those of the hydrate.Variations of crystal-field parameters with various lanthanide host ions are also observed. Finally, a few
comments concerning zero-field linewidths and their measurement are made.
I. INTRODUCTION
Zero-field paramagnetic resonance (ZFPMR) isan imPortant technique for observing magnetic-di-pole transitions in the microwave region of thespectrum. These transitions are usually betweenenergy levels split by crystal-field and hyperfineinteractions in transition metal, lanthanide, andactinide ions. To date, such systems have beenmainly studied by conventional electron-paramag-netic-resonance (EPR) spectroscopy in the presenceof a strong Zeeman perturbation which forces dif-ferences in energy levels to match the energy of asource oscillator. In ZppMR the microwavesource is tuned to match the energy spacings of thesample. The data presented in this work empha-size the comparison between high- and zero-fieldparamagnetic resonance, particularly for improvedhyperfine-structure resolution and crystal-field-splitting determinations.
One of the long-standing problems of EPB spec-troscopy of ions in crystals is that of the unexpectedand unexplained crystal field a,nd hyperfine struc-ture of 8-state ious (1,e, ~
tons with haU-filledshells such as 4f'), particularly in the lanthanideseries. The usual lanthanide 8-state ions are Eu~,Gd ', and Tb '; of these three 4f 8-state ions Gd '18 the most widely and readily obtainable chemi-cally. Its lattice substitutional properties in avariety of trivalent-metal-ion crystal-host materi-als' makes Gd" an ideal choice for such a study.In the treatment of gadolinium paramagnetic reso-nance a flctltlous spin 8 =
&ls used ln con]unction
with a spin Hamiltonian to describe the spectrumin an empirical manner. This convenient descrip-
tion is possible because the spectrum always dis-plays the site symmetry of the ion. An exhaustivetabulation has been provided by Buckmaster andShing. '
Many mechanisms have been proposed for thesplitbng, but no single one can account for the mag-nitude and sign of the observed splitting. This areaof intense research has been many times reviewedand discussed in detail. '7 In order to evaluate agiven theoretical mechanism for crystal-field split-ting of the 897&~ ground state of Gd ', the calculatedover-all splitting should be compared with the mea-sured value (this work)' 725S.4+ 9.6 MHz forLa(C2H, SO4)3 ~ QH~O: Gds'.
All mechanisms proposed to account for crystal-field splitting of Gds' could, until very recently, beclassified into three groups: much too large, muchtoo small, and about the right magnitude but of thewrong sign. However, using an effective oper-ator technique, Newman and Urban~' were able tocalculate "intrinsic spin-Hamiltonian parameters. "It is their contention that, due to geometric factorsand a linear superposition of contributions fromneighboring ligands, measured crystal-field pa-rameters, especially quadrupolar ones, may ormay not have the same sign as calculated (intrin-sic) ones. It is clear that these concepts give bothsign and rough order-of-magnitude agreement be-tween crystal-field spin-Hamiltonian parametersobtained from theory and experiment. '~3 The con-clusion is that, at least for YVO4, YPO4, tuPO4,LuAsO„and Car~, correlation and relativisticcrystal-f ield effects contribute most significantlyto the observed splittings. Indeed, these authorsindicate that the previous calculation by %'ybourne

E. R. BERNSTEIN AND G. M. DQBBS
when interpreted by their method, gives reasonableagreement between theory and experiment. Sincethe only quantitative treatment of these conceptshas been for Gd'-H and Gd'-F in CaF, tetragonalsites, it still remains to be seen if general agree-ment for a larger number of situations will obtain.
It is possible that results presented herein canmake a positive contribution to this area as themeasured crystal-field parameters are differentfor Ln(C2H, SO,), ~ 9H~O: Gd" and Ln(C, H,SO,),~ 9D~Q: Gds' where Ie is a lanthanide. ~3 Severalmechanisms are suggested (end of Sec. III) by whichthis effect could occur.
Curiously enough, hyperfine structure mas neverconclusively observed for Gds' in these hosts in
spite of its observation in many others. Since thespectral splittings produced are greater in zerothan in high field when compared to the observedlinewidths, it was possible to measure hyperfineconstants for the first time. A detailed analysisof the spectrum and the constants themselves ispresented in Secs. III and IV. The constants arediscussed from the point of view of the theory of
hyperf ine interactions.As a conclusion to this introduction, it is per-
haps appropriate to mention at least briefly pre-vious work on Gds' in the ethylsulfate-host-crys-tal system. The field has indeed had a long historycommencing with studies in the late 1940's and
early 1950's. The nom famous work of Bleaney,Elliott, Stevens, and co-workers genuinely initi-ates EPR spectroscopy as a general physical tech-nique for the study of solids. 34 ~8 Studies over the
years have produced many interesting results forthese salts. The works that directly bear on
the present investigation are an early work of
Bleaney and co-workers which suggested that thezero-field splitting (ZFS) co~Id not be character-ized by spin-Hamiltonian parameters obtained athigh field; a ZFPMR ' study of Gd ' in lanthanumtris (ethylsulfate) nonahydrate (I ES), of large ex-perimental uncertainty (+ 25 MHz in transition fre-tluency), which indicated such a discrepency didnot exist but which observed no hyperfine struc-ture; a high-field experiment which demonstratedgadolinium-gadolinium and gadolinium-mater protoneoupling36; and finally, recent low-field measure-ments37'38 reinvestigate the adequacy of fit of thehigh-field spin-Hamiltonian parameters to lom-
field spectra. Qne interesting aspect of these lat-ter results is the suggestion that field-frequencyplots for one of the transitions may be nonlinearin fields below 10 G. Qther work has been re-viemed in Ref. 39.
II. EXPERIMENTAL METHODS AND CRYSTALSTRUCTURE
The ZFPMH spectra used in this work mere takenat room temperature, 7'7, 4. 2, and 2 K in the
ZFPMR spectrometer previously described. ' Ineach specific case below the micromave structure'used to record the spectrum mill be given.
Ethylsulfate crystals used in this research meregenerally prepared according to the method ofErickson. In the case of the deuterated ethylsul-fates 99.V-at. %, Merck, Sharp, and Dohme Canada,Ltd. deuterium oxide was used not only for the re-action but also for mashing the diethylsulfate. Thesesamples were kept out of the atmosphere as muchas possible to minimize isotopic exchange.
The bismuth magnesium double nitrate (BMDN)sgmple was prepared according to the method ofGerkin and Thorsell. 8 The magnesium used wasResearch Organic/Inorganic Chemical Corp. 99. 99%%uo
magnesium-metal crystals. The bismuth used wasAlfa Inorganics 99.99995% bismuth-metal shot. Thenitric acid used was duPont reagent grade.
In the case of the isotopieally enriched crystalsfor either of the above hosts, Union Carbide QakRidge National Laboratory stable isotope oxideswere used. The '"G120, used was 99.7% in '"Gd,0, 08% in "'Gd, and the balance I=0 isotopes. The' 'Gd used was 99.82% in "'Gd, 0. OV% in "Gd, andthe balance I= 0 isotopes. The ' OGd used mas99. 99'%%uo in ' Gd.
The lanthanide tris (ethylsulfate) nonahydratesare an isomorphic series of compounds, and assuch have a special importance in the EPB of tran-sition ions, especially the rare earths. The tri-valent lanthanide ion, Lns', may be any memberof the rare-earth series and sits at a site of Cszsymmetry. The nine mater molecules form a tri-angular prism, with the oxygens in the mirrorplane at a greater distance from the threefold axisthan the oxygens forming the end triangles. Gooddiagrams may be found in the crystal-structurepapers of Ketelaar and Fitzmater and Rundle. 3'
The mater protons are p~obawy hydrogen bonded tothe oxygens of the sulfate groups, but have not beenlocated experimentally. There are two formulaunits per unit cell, with approximately 18 nearest-neighbor sulfate oxygens about the lanthanide ion.The ethylsulfate anions are arranged in such a man-ner to make the space group P6~/m(C~o„). Thewaters of hydration may be replaced with D3Q whenthe crystal is synthesized, without deuteration ofthe ethylsulfate chains.
III. CRYSTAL FIELD
A. Gd and natural gadolinium in La(C285 SO4)3'9820/. Results
ZFPMR spectra of gadolinium-doped LES wherethe gadolinium ions have either the naturally oc-curring isotopic composition or are 99.99% "Gd~'
(I = 0) are presented first. These studies weremade fol three reasons. First. , lt is necessary toascertain if hyperfine structure from the two odd
ZERO- FILLED PARAMAGNETIC RESONANCE OF TRIVALENT. . . 4625
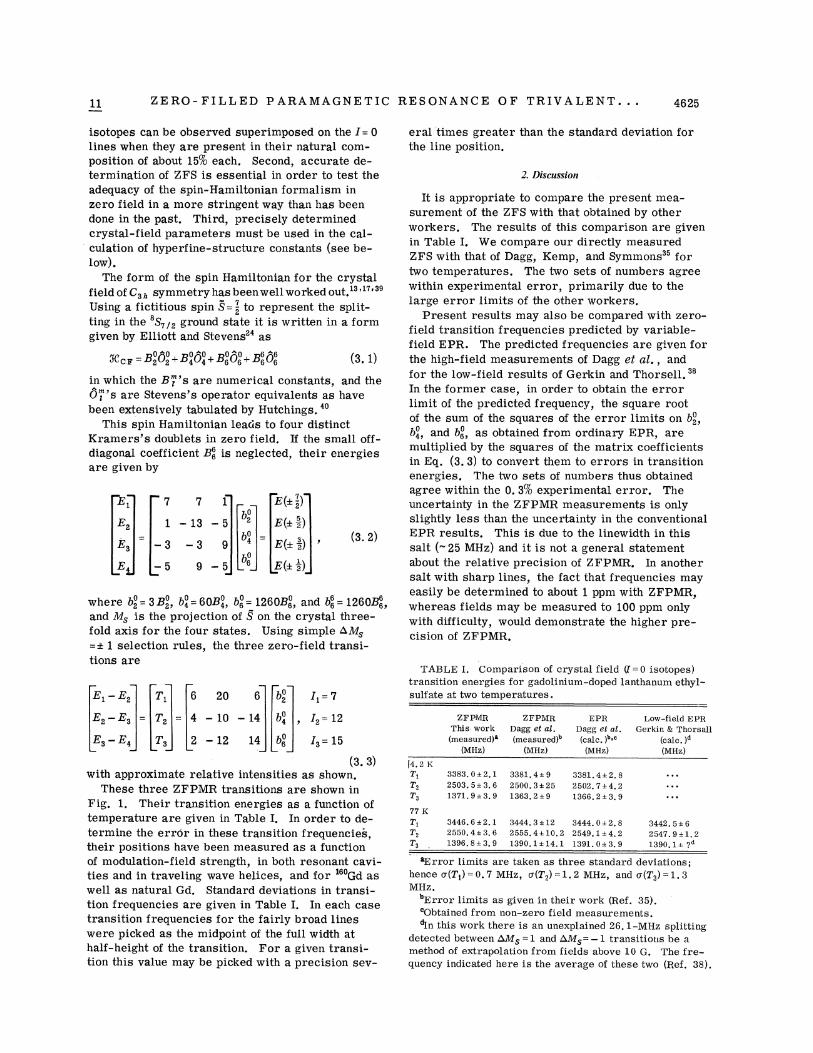
isotopes can be observed superimposed on the I= 0lines when they are present in their natural com-position of about i5% each. Second, accurate de-termination of ZFS is essential in order to test theadequacy of the spin-Hamiltonian formalism inzero field in a more stringent way than has beendone in the past. Third, precisely determinedcrystal-field parameters must be used in the cal-culation of hyperf inc-structure constants (see be-low).
The form of the spin Hamiltonian for the crystalfieldof C» symmetryhasbeenwellworkedout. ' ' ' 'Using a fictitious spin S =
2 to represent the split-ting in the S,&2 ground state it is written in a formgiven by Elliott and Stevens 4 as
SIC ~ = B202+ B404+ B606+B6060 0 0 0 0 0 6 6 (s. i)
in which the B, 's are numerical constants, and the0, 's are Stevens's operator equivalents as havebeen extensively tabulated by Hutchings. '
This spin Hamiltonian leais to four distinctKramers's doublets .in zero field. If the small off-diagonal coefficient B6 is neglected, their energiesare given by
5
7 i E(+',-)
—is —3 E(+ —.)b0
y0—s g ' E(+ —,')b
g -5 ' E(+-,')
(3. 2)
T2
T3
6 20 6 b20
4 -10 —14 54
2 -12 14 b6
I, =v
I2 ——12
I3 ——15
(s. 3)with approximate relative intensities as shown.
These three ZFPMR transitions are shown inFig. 1. Their transition energies as a function oftemperature are given in Table I. In order to de-termine the error in these transition frequencies,their positions have been measured as a functionof modulation-field strength, in both resonant cavi-ties and in traveling wave helices, and for Qd aswell as natural Gd. Standard deviations in transi-tion frequencies are given in Table I. In each casetransition frequencies for the fairly broad lineswere picked as the midpoint of the full width athalf-height of the transition. For a given transi-tion this value may be picked with a precision sev-
where b, = 3B,', b4=60B,', 56= 12608,', and b~=1260B~,and M~ is the projection of S on the crystal three-fold axis for the four states. Using simple &M~=+ 1 selection rules, the three zero-field transi-tions are
eral times greater than the standard deviation forthe line position.
2. Discussion
It is appropriate to compare the present mea-surement of the ZFS with that obtained by otherworkers. The results of this comparison are givenin Table I. %e compare our directly measuredZFS with that of Dagg, Kemp, and Symmons" fortwo temperatures. The two sets of numbers agreewithin experimental error, primarily due to thelarge error limits of the other workers.
Present results may also be compared with zero-field transition frequencies predicted by variable-field EPR. The predicted frequencies are given forthe high-field measurements of Dagg et al. , andfor the low-field results of Gerkin and Thorsell.In the former case, in order to obtain the errorlimit of the predicted frequency, the square rootof the sum of the squares of the error limits on b2,
b4, and b6, as obtained from ordinary EPR, aremultiplied by the squares of the matrix coefficientsin Eq. (3.3) to convert them to errors in transitionenergies. The bvo sets of numbers thus obtainedagree within the 0. 3% experimental error. Theuncertainty in the ZFPMR measurements is onlyslightly less than the uncertainty in the conventionalEPR results. This is due to the linewidth in thissalt (-25 MHz) and it is not a general statementabout the relative precision of ZFPMR. In anothersalt with sharp lines, the fact that frequencies mayeasily be determined to about 1 ppm with ZFPMR,whereas fields may be measured to 100 ppm onlywith difficulty, would demonstrate the higher pre-cision of ZFPMR.
TABLE I. Comparison of crystal field (l =0 isotopes)transition energies for gadolinium-doped lanthanum ethyl-sulfate at two temperatures.
)4. 2 KTiT2
T3
ZFPMR ZFPMBThis work Dagg et al.(measured)~ (measured)"
(MHR) (MHz)
3383, 0+ 2, 1 3381.4 + 92503. 5 + 3.6 2500, 3 + 251371.9 + 3.9 1363.2 + 9
EPRDagg et al.(calc. )b '
(MHz)
3381.4 + 2. 82502. 7+ 4.21366.2+3. 9
Low-field EPRGerkifi & Thorsall
(calc. )d
(MHz)
77 KTiT2
Ts
3446. 6 +2.1 3444 ~ 3+12 3444. 0+2. 82550. 4 + 3.6 2555. 4 + 10.2 2549. 1 + 4. 21396.8+3.9 1390.1+14.1 1391.0+ 3.9
3442. 5+ 62547. 9+l. 21390.1+ ~
~Error limits are taken as three standard deviations;hence o(T&)=0.7 MHz, o(T&)=1.2 MHz, and o(T3) 1.3MHz.
"Error limits as given in their work (Ref. 35).Obtained from non-zero field measurements.In this work there is an unexplained 26. 1-MHz splitting
detected between ~&=1 and AM+= —1 transitions be amethod of extrapolation from fields above 10 G. The fre-quency indicated here is the average of these two (pef. 38).

4626 E. R. BERNSTE IN AND G. M. DOBB8
(a)
XOI-Q.KOthCl
IO MHz
I-
FREQUENCY (MHg)
ID (b)
FR
(c}XOI-CLKOM
f f
LUX
EQUENCY {MHz)
The low-field results of Gerkin and Thorsell aresomewhat more problematical. These workers ob-served a 26. 1-MHz splitting between the ~M~ = 1and the &M~ = —1 transition energies for T3 by ex-trapolation from measurements taken above 10 G.Results from our measurements do not confirm theexistence of these splittings. This additional com-plication may be the reason that the predicted fre-
FIG. 1. ZFPMH, spectrum of La(C2H5SO4)3 ~ 9H20:0. 1-mole/& '6 Gd ' at 4 K. Net absorption in. arbitrary unitsis shown with net zero-field absorption directed up and
net low-field absorption directed down. . (a) T& transitionM& =+ 2 -+—. This spectrum was taken in a helix with
210-A modulation current and 10-JLf, Vlockin amplifier sen-sitivity. (b) T2 transition M~ =+2 -+ 2. This spectrumwas taken in a helix with 10-A modulation current and 50-pV lockin amplifier snnsitivity. (c) T3 transition M&
This spectrum was taken in a cavity with 10-A modulation current and 100-pV lockin amplifier sensi-tivity. Under these conditions there is some overlap be-
, tween zero and low-field absorption peaks. The true zero-field line shape is not completely resolved; hence, at thistime it is premature to analyze the partially resolvedfine structure of each line in terms of superhyperfinestructure or other effects.
quencies from low-field EPR lie just outside theerror limits of our measurements. The errorlimits used by these workers of less than 1 MHz
may be somewhat optimistic.For the treatment of hyperfine structure pre-
sented below, crystal-field parameters appropriateto these zero-field measurements will be necessary.This determination is not possible in closed formsince, in C» symmetry, it is necessary to deter-mine four crystal-field parameters with three zero-field transitions. This situation, however, becomestractable because the b', coefficient is so small. Ifwe use a typical value of —4. 25&& 10 cm ' as de-termined by Dagg et al. ,
"the coefficient 86 = l. 01X10 MHz. The other three crystal-field coeffi-cients may then be varied to fit exactly the threeZFS transitions. Neglect of the off-diagonal matrixelements connecting the +-' levels with the e —,
' levels~ 6
2via 06 leaves the best-fit crystal-field parametersinvariant to about five significant figures. Indeed,second-order perturbation theory shows that thiscoefficient can lead to a position shift for the+ &
or a~ energy levels of about 0. 5 MHz, which is onthe order of the standard deviation of transition fre-quencies. Considering the slow temperature de-pendence of B6 (- 0. Ol kHz/K), the 77-K value isemployed at both 77 and 4. 2 K with little error.The best least-squares-fit crystal-field parametersare given in Table II.
The standard deviations in these parameters arederived from standard deviations in transition fre-quencies by taking the absolute value of the inverseof the matrix of coefficients in Eq. (3.3). Theerror is the square root of the sum of the squaresof the terms obtained by multiplying this matrix bya column vector of standard deviations of transitionfrequencies. These are also given in Table II.
B. Natural gadolinium in various Ln(C2H, SO&)3 9D20
l. Introduction and results
It has recently been pointed out by Gerkin andThorsell' that crystals of La(C2H, SO4) ~ 9D30 showa Gd ' linewidth up to a factor of 2 less than thecorresponding hydrate. They therefore used suchcrystals in place of hydrated crystals in their low-field EPR studies of Gd3' in I ES. It is not obviousfrom ordinary EPR or even low-field EPR, but itis immediately apparent from ZFPMR that thecrystal field Paramete-rs for the deuterate are dif-ferent from those of the hydrate This differe.nceis immediately obvious using ZFPMR, since onemeasures the ZFS directly without recourse tocomputations based on variable-field data.
Inasmuch as the origin of crystal-field splittingof Gd ' is still an open question, it becomes im-portant to pursue the nature of this deuteration ef-fect on the crystal parameters. Accordingly, both
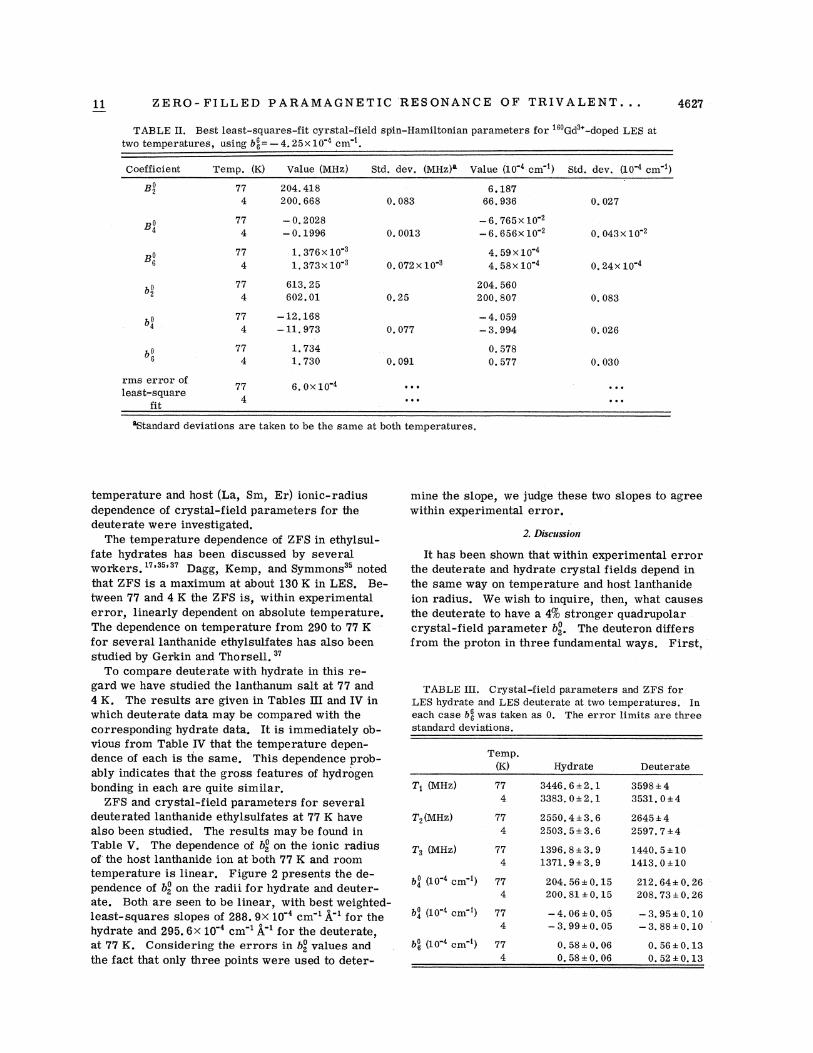
ZERO- FII.LED PARAMAGNETIC RESONANCE OF TRIVALENT. . .TABI E II. Best least-squares-fit cyx'stRI-field spin-HaIMltonian pal aIDeters fox' Gd -doped LES at
two temperatures, using b~~= —4. 25x 10"4 cm"~.
Coefficient Temp. (K) Value (MHz)
204. 418200. 668
Std. dev. (MHz)~ Value (10 4 cm ) Std. dev. (10"4 cm"~)
-0.2028—0.1996
1.376x 10 ~
1,373x 10"3
613.25602.01
1.7341.730
0.072x10 3
-6.765x10 '-6.656x 10"2
4. 59x10 4
4. 58x10 4
204. 560200. 807
-4.059-3.994
0. 5780.577
0. 043x10 '
0.24x 10"4
0. 083
0. 030
6.0x10 4
'Standard deviations are taken to be the same at both temperatures.
temperature and host (La, Sm, Er) ionic-radiusdependence of crystal-fxeld pR1Rmetel s for thedeuterate mere investigated.
The temperature dependence of ZFS in ethylsul-fate hydrates has been discussed by severalworkers. ' 'O' Dagg, Kemp, and 8ymmons notedthat ZFS is a maximum at about 130K in LES. Be-tween VV and 4 K the ZFS is, within experimentalerror, linearly dependent on absolute temperature.The dependence on temperature from 290 to VV Kfor several lanthanide ethylsulfates has also beenstudied by Gerkin and Thorsell. 37
To compare deuterate with hydrate in this re-gard me have studied the lanthanum salt at VV and4 K. The results are given in Tables III and IV inWhich deuterRte dRtR mRy be compared with thecorresponding hydrate data, It is immediately ob-vious from TaMe IV that the temperature depen-dence of each is the same. This dependence prob-ably indicates that the gross features of hydrogenbonding in each are quite similar.
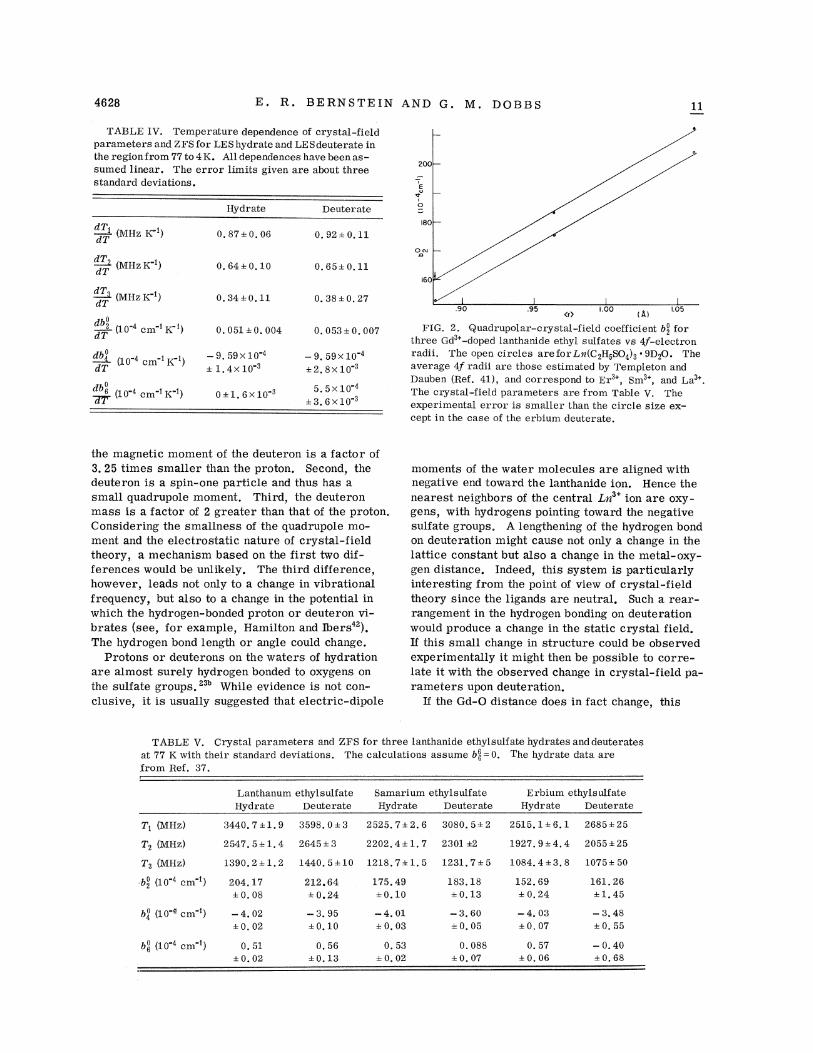
ZFS Rnd crystRl-f xeld pR1 Rmetel s for severRldeuterated lanthanide ethylsulfates at VV K havealso been studied. The results may be found inTable V. The dependence of bso on the ionic radiusof the host lanthanide ion at both VV K and roomtemperature is linear. Figure 2 presents the de-pendence of b3 on the radix for hydrate and deuter-ate. Both are seen to be linear, with best weighted-l.east-squares slopes of 288. 9X ].0 cm ' A ' for thehydrate and 295. 6X 10 cm ' A"' for the deuterate,at VV K. Considering the errors in bso values Rnd
the fact that only three points frere used to deter-
TABI E III. Crystal-field parameters and ZFS forLES hydrate and I ES deuterate at two temperatures. In.each case F66 was taken as 0. The error limits axe threestandard deviations.
Tl (MHz)
r, IIMHz)
Temp.00 Hydrate
3446. 6+ 2. 13383.0+2, 1
2550.4+ 3.62503. 5+ 3.61396.8+ 3.91371.9+3.9204. 56 + 0.15200. 81 + 0.15
1440.5+101413.0+10
212.64 + 0.26208. 73 + 0.26
b', go-4 cm-') 774
Sos g.0-4 cm-') 774
—4. 06 + Q. 05—3„99+0. 05
0. 58+0.060.58+0.06
—3.95 + 0. 10—3.88+0.10
0.56+ 0.130.52 + 0. 13
mine the slope, we judge these two slopes to agreewithin experimental error.
2. DiSeNSSion
It has been shown that within experimental errorthe deuterate and hydrate crystal fieMs depend inthe same way on temperature and host lanthanideion radius. We wish to inquire, then, what causesthe deuterate to have a 4% stronger quadrupoiarcrystal-field parameter b3. The deuteron differsfrom the proton in three fundamental ways. First,
E. R. BERNSTEIN AND G. M. DOBBS
TABLE IV. Temperature dependence of crystal-fieldparameters and ZFS for LES hydrate and LESdeuterate inthe region from 77 to 4K. All dependences have beenas-sumed linear. The error limits given are about threestandard deviations.
200
' (MHz K-')dT
' {MHz K-')dT
' (MHz K-')dT
db'2 {104 cm ~ K ')
db'4 g.O' 'K')
dT
db'6 (10 4 cm 'K"')
dT
Hydrate
0. 87+ 0. 06
0. 64+ 0. 10
0.34+0.11
0. 051 +0. 004
—9. 59x10"4+ 1.4xl0 ~
0+1.6x10 3
Deuter ate
0. 92+ 0. 11
0.65+ 0. 11
0. 38+0.27
0. 053+0.007
—9. 59 x 10"4
+2. 8x 10 3
5. 5x10 4
+3.6xl0 3
I
O
leo
0 oJ
l60
I.OO.90 .95(rP (A)
FIG. 2. Quadrupolar-crystal-field coefficient b2 forthree Gd~'-doped lanthanide ethyl sulfates vs 4f-electron.radii. The open circles are for Ln(C2H5SO4)3 ~ 9D20. Theaverage 4f radii are those estimated by Templeton andDauben (Ref. 41), and correspond to Er3', Sms', and I a3'.The crystal-field parameters are from Table V. Theexperimental error is smaller than the circle size ex-cept in. the case of the erbium deuterate.
the magnetic moment of the deuteron is a factor of3. 25 times smaller than the proton. Second, thedeuteron is a spin-one particle and thus has asmall quadrupole moment. Third, the deuteronmass is a factor of 2 greater than that of the proton.Considering the smallness of the quadrupole mo-ment and the electrostatic nature of crystal-fieldtheory, a mechanism based on the first two dif-ferences would be unlikely. The third difference,however, leads not only to a change in vibrationalfrequency, but also to a change in the potential inwhich the hydrogen-bonded proton or deuteron vi-brates (see, for example, Hamilton and Ibers42).The hydrogen bond length or angle could change.
Protons or deuterons on the waters of hydrationare almost surely hydrogen bonded to oxygens onthe sulfate groups. 3" While evidence is not con-clusive, it is usually suggested that electric-dipole
moments of the water molecules are aligned withnegative end toward the lanthanide ion. Hence thenearest neighbors of the central Ln ' ion are oxy-gens, with hydrogens pointing toward the negativesulfate groups. A lengthening of the hydrogen bondon deuteration might cause not only a change in thelattice constant but also a change in the metal-oxy-gen distance. Indeed, this system is particularlyinteresting from the point of view of crystal-fieldtheory since the ligands are neutral. Such a rear-rangement in the hydrogen bonding on deuterationwould produce a change in the static crystal field.If this small change in structure could be observedexperimentally it might then be possible to corre-late it with the observed change in crystal-field pa-rameters upon deuteration.
If the Gd-0 distance does in fact change, this
TABLE V. Crystal parameters and ZFS for three lanthanide ethylsulfate hydrates and deuteratesat 77 K with their standard deviations. The calculations assume b66=0. The hydrate data arefrom Ref. 37.
Lanthanum ethylsulfateHydrate Deuterate
Samarium ethylsulfateHydra, te Deuterate
Erbium ethylsulfateHydr ate Deuterate
T, (MHz)
Tg (MHz)
T, {MHz)
:bo {104 cm )
2547. 5+ 1.4 2645+ 3 2202. 4 ~ 1.7 2301 +2 1927.9 + 4. 4 2055 + 25
1390.2 +1.2 1440. 5 +10 1218.7+ 1.5 1231.7+ 5 1084.4+3.8 1075+ 50
204. 17+0. 08
212.64+ 0.24
175.49+0.10
183.18+ 0.13
152.69+0.24
161.26+ l. 45
3440. 7 +1.9 3598.0 +3 2525. 7+ 2. 6 3080. 5+ 2 2515.1+6. 1 2685+25
b,' {10'cm')
b,' (10' cm')
—4. 02+0. 02
0. 51+0.02
—3.95+0.10
0. 56+0.13
—4. 01+0.03
0. 53+ 0. 02
—3.60~0. 05
0. 088+0.07
—4. 03+0. 07
0. 57+0.06
—3.48+0. 55
—0. 40+0.68

ZE RO- FILLED P ARAMAGNE T IC RE SONANC E OF TRIVA I.E N T. . . 4629
would have important consequences for diffractioncrystalography. It is customary in x-ray or neu-tron-diffraction studies to hold the metal-oxygendistance constant when simultaneously refining thestructure for protonated and deuterated species. 3'
By this simple mechanism, the effect of deutera-tion might be the same as a change in lattice sizewith temperature or hydrostatic pressure. '"
Even if the Gd-0 distance does not change, it ispossible that the positions of the deuterons do. Itis known that the water hydrogens are close enoughto the gadolinium ion to allow dynamic nuclear-polarization experiments to be performed. 36 In abinitio calculation of crystal-field parameters bylattice summations, results are quite sensitive tohow the water dipole moment is treated. ' Gen-erally, it is accommodated by assuming that thewater molecule is composed of fractional chargesplaced so the entire molecule is neutral. Clearly,a change in the water bond angle would cause b~ tochange. Less-accurate calculations include thenearest-neighbor oxygens only, predicting no ef-fect for a change in hydrogen-bond orientation.
If equilibrium positions of neither oxygens norhydrogens change when the structure for the hy-drate and deuterate are refined independently, onemight have to resort to a dynamic crystal-fieldtheory to account for the difference by consideringa change in the oxygen-hydrogen vibration fre-quency.
Measurement of the dependence of the nuclear-quadrupole-coupling parameter on deuteration, hostlattice, and hydrostatic pressure would yield infor-mation on the contribution of the lattice or crystalelectric-field gradient eq, to the total field gradi-ent. A change due to these effects would be dif-ficult to see for the deuterate in LES because itsmagnitude would be about the same size as thepresently available standard deviation of P, due tolinewidth.
TABLE VI. Approximate hvperfine energy levels forS = —' and I= —[R = (- A -AP+ P ) ]
2 4
Levels
E42
E44
Energies
4A+ P+ E4
—A -P+E4—-A -P+E41?
—4A+ R+E4
Kets in eigenfunction
I—2 —2)
I—2 2)
I—2 2)
—4A —R+ E41
fore, is a 32' 32 matrix when represented in thecomplete set of high-field states, ~ MIMI ) = ~Mz) ~ Mz)quantized along the three-fold crystal symmetryaxis.
In order to obtain an approximate analysis of thezero-field spectra, it would be very useful to haveapproximate analytical expressions for the zero-field energy levels. It was shown above that theoff-diagonal term in the crystal field is quite small,so it will be temporarily neglected. Zero-fieldstates can then be treated as pure high-field states
I Mz Mz). For convenience, elements off diagonalin the hyperfine operator if M~ 4+ —, will also beneglected. This approximation is worse than theneglect of off-diagonal crystal-field terms, but itwill be adequate for an approximate set of hyper-fine constants from which to initiate a least-squaresanalysis of the exact diagonalization of the full 32
&& 32 matrix. These off-diagonal elements causeshifts on the order of 3. 5 MHz. Under these twoapproximations the matrix breaks up into subma-tricies of size no greater than 2&&2. The energy-level formulas are given in Table VI. Using &M~=+ 1, &M, = 0 selection rules one may then calcu-late the spectrum. A 15-line spectrum is pre-dicted, with crystal-field transition T, splitting
IV. HYPERFINE SPECTRA OF ~55 Gd AND ~57Gd
A. Results and analysis
Hyperfine structure was not resolved in thenaturally occurring gadolinium spectra. In orderto determine whether it was really absent, or mea-sure its magnitude if present, isotopically enrichedcrystals of 0. 1-mole%%uo concentration were pre-pared. Since g is isotropic to five decimal places, 'the hyperfine-structure Hamiltonian in axial sym-metry may be represented as'
K hf, = AS,I, + ~ A (S,I + S I, ) + P[I, —3I(1+ 1)],(4. l)
in which A is the isotropic hyperfine constant, andP is the nuclear-electric-quadrupole constant, andX is the nuclear-spin operator. For these isotopesI= —', and as before $=2. The Hamiltonian, there-
E32
E33
E21
E23
E24
—A+P+E34
4A —P+E3—gA —P+ E33
——A+ P+Eq
-'A+P+E24
-A -P+E,54
—A —P+E2—A+ P+E24
-A+P+E(4
-A -P+E(?
-A —P+Ei
4A+P+Ei
I—' -')3 1 )
I2 —2),
I2 —2),
-,'),I5 1)
I2 —2),
l? 1)I-' —-')
I? 3)
I—3
I —2 2)
I5 3)
I ——' —-')
I —2 2)I ——,. —,)
2
I———2)2
7
2
?2
4630 E. R. BERNSTEIN AND G. M. DPBBS
TABLE VII. Hyperfine transitions for 8=&, I=2 ac-cording to a Mf& =+&, ~I=I selection rule. The energylevel formulas are from Table VI. The first subscriptof a T~„ indicates from which crystal-field transition itis derived.
(a)
XOI-L,K0fJ)CQ
TII. =—E(l —E2I = Tl ITI3 ——Ef3 E23 T$ g A
T2i = E2& —E3I = T2+ $A
T23 —=E23-E33 T2 gA
T2
T„=—E„—E22 = T, +-,'A
TI4 ——EI4 —E24 = TI —2 A
22 22 32 2
T24 ——E24 —E34 = T2 —gA
E QUENCY (MHz)
0 MHz
T3g —= E33 —E43 = T3 + -A72
T33 E32 E45 = T3 +A —P + R
T35 E34 E44 T3 —2A + P —R
T37 =—E33 —E42 = T3 —gA8
T3
T32 E32 E44 = T3 +A —P —R
T34 =—E3I —E4i = T3+ 2A
T36 =—E34 —E45 = T3 —2A +P + RZoI-CL
otKl
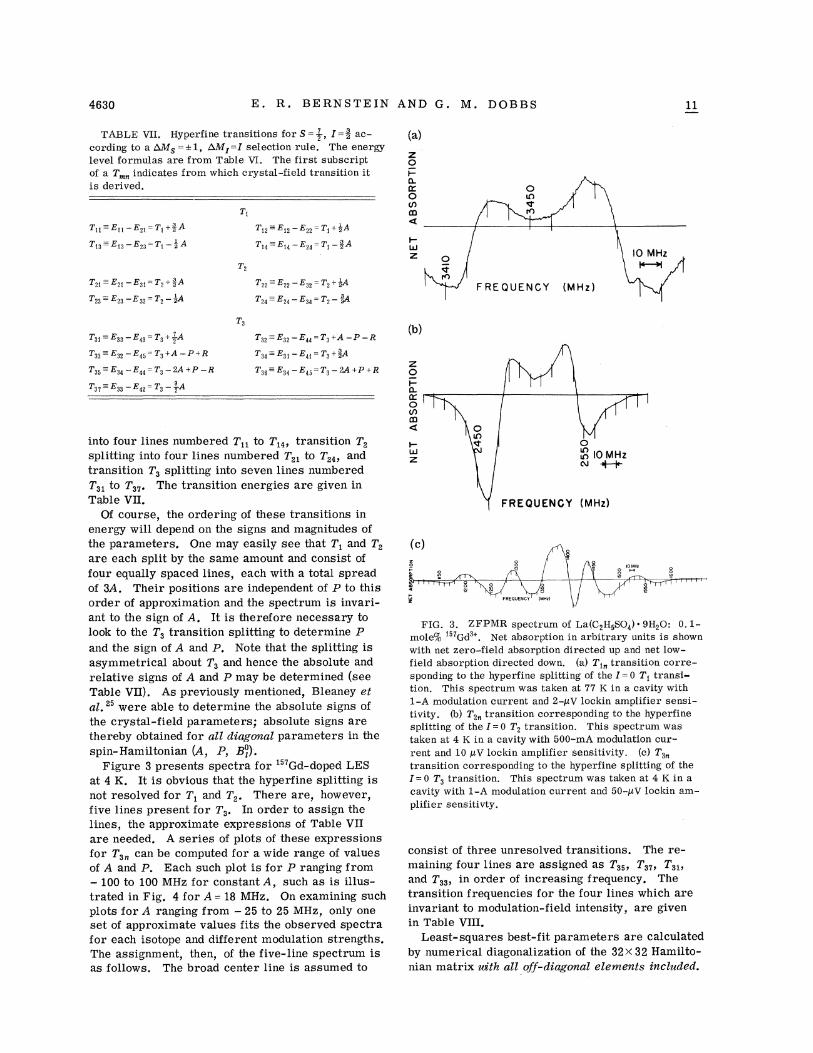
into four lines numbered Tyy to T,4, transitio~ T,splitting into four lines numbered TpI to Tp4 andtransition T3 splitting into seven lines numbered
T3] to T37 ~ The transition energies are given inTable VII.
Of course, the ordering of these transitions inenergy will depend on the signs and magnitudes ofthe parameters. One may easily see that T, and T~are each split by the same amount and consist offour equally spaced lines, each with a total spreadof 3A. Their positions are independent of P to thisorder of approximation and the spectrum is invari-ant to the sign of A. It is therefore necessary tolook to the T3 transition splitting to determine Pand the sign of A and P. Note that the splitting isasymmetrical about T3 and hence the absolute and
relative signs of A and P may be determined (seeTable VII). As previously mentioned, Bleaney etal. "were able to determine the absolute signs ofthe crystal-field parameters; absolute signs arethereby obtained for a// diagona/ parameters in thespin-Hamiltonian (A, P, Bo).
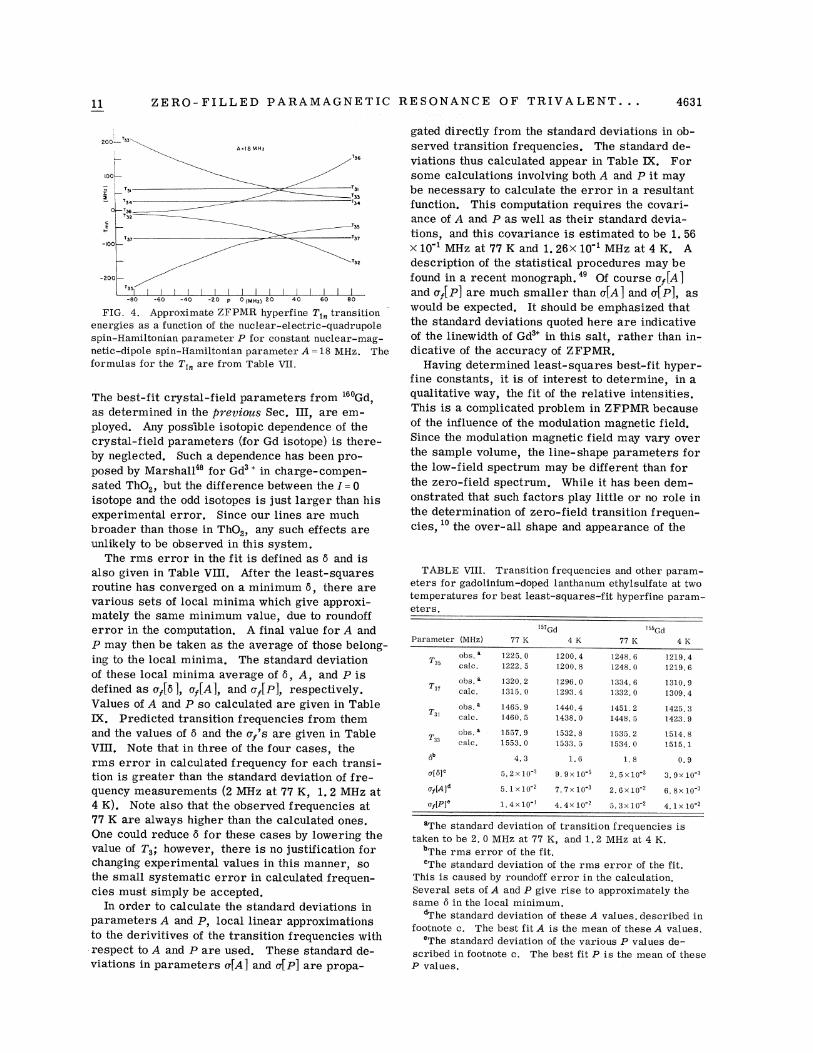
Figure 3 presents spectra for "7Gd-doped LESat 4 K. It is obvious that the hyperfine splitting isnot resolved for T, and T~. There are, however,five lines present for T,. In order to assign thelines, the approximate expressions of Table VIIare needed. A series of plots of these expressionsfor T,„can be computed for a wide range of valuesof A and P. Each such plot is for P ranging from—100 to 100 MHz for constant A, such as is illus-trated in Fig. 4 for A = 18 MHz. On examining suchplots for A ranging from —25 to 25 MHz, only oneset of approximate values fits the observed spectrafor each isotope and different modulation strengths.The assignment, then, of the five-line spectrum isas follows. The broad center line is assumed to
I-LLJz
og) IQ MHzg 8 L
l I
REQUENGY (MHz)
(c)zO
g-, ;,4
Z
Io MHr
O
I t I I ( I
FIG. 3. ZFPMR spectrum of La(C2HsSO4) ~ 9H20: 0. 1-mole% '57Gd '. Net absorption in arbitrary units is shownwith net zero-field absorption directed up and net low-field absorption directed down. (a) T« transition corre-sponding to the hyperfine splitting of the I = 0 T~ transi-tion. This spectrum was taken at 77 K in a cavity with1-A modulation current and 2-pV lockin amplifier sensi-tivity. (b) T&„ transition corresponding to the hyperfinesplitting of the I=O T2 transition. This spectrum wastaken at 4 K in a cavity with 500-mA modulation cur-rent and 10 pV lockin amplifier sensitivity. (c) T3gg
transition corresponding to the hyperfine splitting of the5 =0 T3 transition. This spectrum was taken at 4 K in acavity with 1-A modulation current and 50-pV lockin am-plifier sensitivty.
consist of three unresolved transitions. The re-maining four lines are assigned as T35 T37 T3$,and T33p in order of increasing frequency. Thetransition frequencies for the four lines which areinvariant to modulation-field intensity, are givenin Table VIII.
Least-squares best-fit parameters are calculatedby numerical diagonalization of the 32~ 32 Hamilto-nian matrix nits alt off diagonal efements -included
ZERO- FILLED PARAMAGNETIC RESONANCE OF TRIVALENT. . . 4631
I
200'—»T
T3s
100—
T 32
E1-
T37-100—
T31
T34
T33
T37
-200—
I I I I I I I I I I I
-80 -60 -40 -20 p 0 (MH&) 20 40 60 80
FIG. 4. Approximate ZFI'MH hyperfine T&„ transitionenergies as a function. of the nuclear-electric-quadrupolespin. -Hamiltonian parameter P for constant nuclear-mag-netic-dipole spin-Hamiltonian parameter A =18 MHz. Theformulas for the T&„are from Table Vll.
The best-fit crystal-field parameters from ' Gd,as determined in the previous Sec. III, are em-ployed. Any possible isotopic dependence of thecrystal-field parameters (for Gd isotope) is there-by neglected. Such a dependence has been pro-posed by Marshall4 for Gd ' in charge-compen-sated Th02, but the difference between the I=0isotope and the odd isotopes is just larger than hisexperimental error. Since our lines are muchbroader than those in Th02, any such effects areunlikely to be observed in this system.
The rms error in the fit is defined as 6 and isalso given in Table VIII. After the least-squaresroutine has converged on a minimum 5, there arevarious sets of local minima which give approxi-mately the same minimum value, due to roundofferror in the computation. A final value for A andP may then be taken as the average of those belong-ing to the local minima. The standard deviationof these local minima average of 5, A, and P isdefined as oz[5], a&[A], and o&[P], respectively.Values of A and P so calculated are given in TableIX. Predicted transition frequencies from themand the values of 5 and the cr&'s are given in TableVIII. Note that in three of the four cases, therms error in calculated frequency for each transi-tion is greater than the standard deviation of fre-quency measurements (2 MHz at 77 K, l. 2 MHz at4 K). Note also that the observed frequencies at77 K are always higher than the calculated ones.One could reduce 5 for these cases by lowering thevalue of T3; however, there is no justification forchanging experimental values in this manner, sothe small systematic error in calculated frequen-cies must simply be accepted.
In order to calculate the standard deviations inparameters A and P, local linear approximationsto the derivitives of the transition frequencies withrespect to A and P are used. These standard de-viations in parameters o[A] and o[P] are propa-
gated directly from the standard deviations in ob-served transition frequencies. The standard de-viations thus calculated appear in Table IX. Forsome calculations involving both A and P it maybe necessary to calculate the error in a resultantfunction. This computation requires the covari-ance of A and P as well as their standard devia-tions, and this covariance is estimated to be 1.56x10 ' MHz at 77 K and 1.26&&10"' MHz at 4 K. Adescription of the statistical procedures may befound in a recent monograph. " Of course o&[A]and oz[P] are much smaller than o[A] and o[P], aswould be expected. It should be emphasized thatthe standard deviations quoted here are indicativeof the linewidth of Gd3' in this salt, rather than in-dicative of the accuracy of ZFPMR.
Having determined least-squares best-fit hyper-fine constants, it is of interest to determine, in aqualitative way, the fit of the relative intensities.This is a complicated problem in ZFPMR becauseof the influence of the modulation magnetic field.Since the modulation magnetic field may vary overthe sample volume, the line-shape parameters forthe low-field spectrum may be different than forthe zero-field spectrum. While it has been dem-onstrated that such factors play little or no role inthe determination of zero-field transition frequen-cies, ' the over-all shape and appearance of the
TABLE VIII. Transition frequencies and other param-eters for gadolinium-doped lanthanum ethylsulfate at twotemperatures for best least-squares-fit hyperfine pararn-eters.
'57cd 155Gd
Parameter (MHz) 77 K 4K 77 K 4 K
obs. 1225. 0 1200.4 1248. 6 1219.4calc. 1222. 5 1200. 8 1248. 0 1219, 6
obs. a 1320.2 1296.0 1334.6 1310.9calc. 1315.0 1293.4 1332.0 1309.4
obs. a
cal.c.obs. a
cale.
1465. 91460. 5
1557.91553. 0
1440. 41438. 0
1532.81533.5
1451.21448. 5
1535.21534. 0
1425. 31423. 9
1514.81515.1
1.6 1. 8 0. 9
0[~)'
op[A I
fTyP'1'
5.2x10-'
5. 1x10 2
1.4x10 '
9, 9x10 5
7. 7x 10"2
4. 4x10 '
2. 5 x10-'
x10 2
5. 3x10 2
3. 9x10 3
6. 8x10 3
4. 1x10 2
'The standard deviation of transition frequencies istaken to be 2. 0 MHz at 77 K, and 1.2 MHz at 4 K.
"The rms error of the fit.The standard deviation. of the rrns error of the fit.
This is caused by roundoff error in the calculation.Several sets of A and P give rise to approximately thesame 6 in the local minimum.
The standard deviation of these A values. described infootnote c. The best fit A is the mean of these A values.
'The standard deviation of the various P values de-scribed in footnote c. The best fit P is the mean of theseP values.

4632 E. R. BERNSTEIN AND G. M. DOBBS
TABLE IX. Best-fit hyperfine constants at two tem-peratures. For definition of symbols, see text.
(a)00
Isotope
'"GD157Gd
155Gd
155Gd
Temp. (K)
774
774
18.2618.1014.5914.33
0. 370.220. 370.22
—52. 86—53. 09—48. 01—51.16
fr[A]L P
l. 260.76l. 260. 76
UnitSb
MHzMHzMHzMHz
zOI-Q.
oo
OOoJ o oI o
157Gd
157Gd
155Gd
155Gd
157Gd
'"Gd155Gd
'"Gd
774
77
774
774
6. 096 ~ 0344. 864 ~ 78
6. 556.495.235.14
0, 120. 070.120. 07
0. 130. 080. 130. 08
—17.63—17.71—16.01—17.06
—18.96—19, 04—17.22—18.35
0. 42 10 4
0. 25 10 4
0.42 10 4
0.25 10 4
0.45 G0.27 G0 ~ 45 G0.27 G
cm-'cm'cm-'cm'
I-LLJz
REQUENCY (MHz)
~Based on an averaged standard deviation of 2 MHztransition frequencies at 77 K, and l. 2 MHz at 4 K.
~Conversion of MHz to G was accomplished using afactor of 1.9919 [Ref. 39(a)].
for
spectra vary greatly with modulation-field strength.The most stringent test of the quality of calculatedparameters is thus a complete synthesis of ob-served total spectrometer output. Therefore,many calculated spectra have been plotted assum-ing various effective modulation fields and variousGaussian linewidths for the zero- and low-fieldspectra. A typical result is shown in Fig. 5(a).While the fit is qualitatively correct in many re-spects, it is not an exact fit (compare with Fig. 3).Of course, spectra for low fields may depend on theangles between modulation field and crystal axes,and, as such, on whether single crystals wereused. To illustrate the angular effect, Fig. 5(b)contains a spectrum with the modulation field per-pendicular to the crystal axis. It is clear that foran exact computation of the spectrum would have tointegrate over the entire sample volume to accountfor the field magnitude and angular variations.
Approximate expressions for transition energiesindicated that T, and T, should each be split intofour equally spaced lines with total spread 3A.The theoretical line-shape calculations show thatobserved spectra do not contradict this conclusion.Indeed, starting with the best fit A, one may cal-culate the spectrum shown in Fig. 5(c), after suit-able choice of line shapes. The "doublet" spec-trum arises from the large linewidth in this salt.
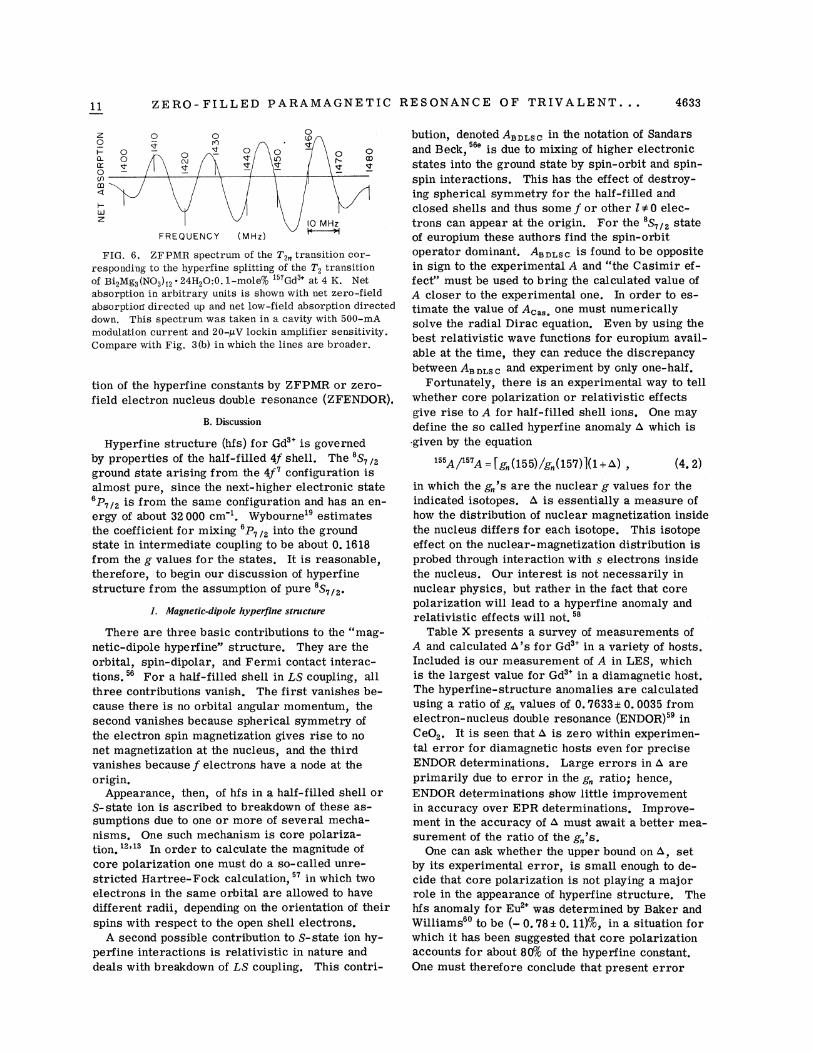
It is particularly interesting to examine a saltwith sharper lines but still characterized by asimilar Hamiltonian. The expected zero-fieldspectrum for BiaMg3(NOs), 2. 24H20, bismuth mag-nesium double-nitrate (BMDN), is very similar,even though the symmetry is approximately C3;(exactly C,) rather than Cs„. o '3 The correspond-ing hyperfine split T2 transition is shown in Fig. 6.Total spread in the spectrum is consistent withrecent ENDOR measurement of the hyperfine con-stants of this sample by Butti et a/. The T3
O 0p~- p
u [
poJ
p0 p
V '
ZFLV/ 25G
p p0 g) 040
FREQUENCY (MHz)
LW* 50 G
0I-CLKOfIJCl
LLJ
(c) 00 0 ~ 0 000 C) ~ ~ 0
ctOJ OJ PJ
FREQUENCY (MHz)
transition, from which a measurement of the quad-rupole parameter P could be made, lies at about750 MHz. The recent availability of crystal-fieldparameters for a variety of gadolinium-dopedlanthanide double nitrates" (LMDN) makes it par-ticularly interesting to determine the series varia-
FIG. 5. Computer-synthesized ZFPMR spectra of Gd '-doped La(C2H&S04)3 ~ 9H20 at 4 K, using the best least-squares fit spin-Hamiltonian parameters. Net absorp-tion in arbitrary units is shown. with net zero-field absorp-tion directed up and net low-field absorption directeddown. Effective conditions were chosen to give qualitativeagreement with line intensity and shape. (a) T« transi-tions at an effective modulation field of 5 G directed paral-lel to the crystal-symmetry axis. The effective zero-field linewidth is 25 G and the effective low-field linewidthis 60 G. Compare with Fig. 3(c). (b) T&„ transitions atan effective modulation field of 10 G directed perpendicu-lar to the crystal symmetry axis. The effective zero-field linewidth is 25 G and the effective low-field line-width is 50 G. Compare with Fig. 3(c). (c) T2„ transi-tions at an effective modulation. field of 5 G directed paral-lel to the crystal symmetry axis. The effective zero-fieldlinewidth is 20 G and the effective low-field linewidth is40 G. Compare with Fig. 3(b).
y'E RO- FILLED PARAMAGNETIC RESONANCE OF TRIVALENT. . .
OOI— 0i .—/ILJZ.'
FREQUENCY (MHz)
FIG. 6. ZFPMR spectrum of the T2„ transition cor-responding to the hyperfine splitting of the T2 transitionof Bi2Mg3(NO3)(2 ~ 24820:0.1-mole% Gd + at 4 K. Netabsorption in. arbitrary units is shown with net zero-fieldabsorption directed up and net low-field absorption directeddown. This spectrum was taken in a cavity with 500-mAmodulation current and 20-pV lockin amplifier sensitivity.Compare with Fig. 3(b) in which the lines are broader.
tion of the hyperfine constants by ZFPMR or zero-field electron nucleus double resonance (ZFENDOR).
8. Discussion
Hyperfine structure (hfs) for Gd~' is governedby properties of the half-filled 4f shell. The SS,
&~
ground state arising from the 4f' configuration isalmost pure, since the next-higher electronic stateP7 /2 is from the same conf iguration and has an en-
ergy of about 32 000 cm"'. Wybourne' estimatesthe coefficient for mixing P, &2 into the groundstate in intermediate coupling to be about 0. 1618from the g values for the states. It is reasonable,therefore, to begin our discussion of hyperfinestructure from the assumption of pure '$, &~.
1. Magnetic-dipoie byperfine structure
There are three basic contributions to the "mag-netic-dipole hyperfine"' structure. They are theorbital, spin-dipolar, and Fermi contact interac-tions. ' For a half-filled shell in 1.$ coupling, allthree contributions vanish. The first vanishes be-cause there is no orbital angular momentum, thesecond vanishes because spherical symmetry ofthe electron spin magnetization gives rise to nonet magnetization at the nucleus, and the thirdvanishes because f electrons have a node at theorigin.
Appearance, then, of hfs in a half-filled shell orS-state ion is ascribed to breakdown of these as-sumptions due to one or more of several mecha-nisms. One such mechanism is core polariza-tion. ' In order to calculate the magnitude ofcore polarization one must do a so-called unre-stricted Hartree-Fock calculation, '7 in which twoelectrons in the same orbital are allowed to havedifferent radii, depending on the orientation of theirspins with respect to the open shell electrons.
A second possible contribution to S-state ion hy-perfine interactions is relativistic in nature anddeals with breakdown of I.S coupling. This contri-
' 'A /' A = t g„(155)/g„(157)](1+&), (4. 2)
in which the g 's are the nuclear g values for theindicated isotopes. 4 is essentially a measure ofhow the distribution of nuclear magnetization insidethe nucleus differs for each isotope. This isotopeeffect on the nuclear-magnetization distribution isprobed through interaction with s electrons insidethe nucleus. Our interest is not necessarily innuclear physics, but rather in the fact that corepolarization will lead to a hyperfine anomaly andrelativistic effects will not.
Table X presents a survey of measurements ofA and calculated 6's for Gds' in a variety of hosts.Included is our measurement of A in LES, whichis the largest value for Gd' in a diamagnetic host.The hyperfine-structure anomalies are calculatedusing a ratio of g„values of 0. 7633+ 0.0035 fromelectron-nucleus double resonance (ENDOR)5 inCeO, . It is seen that ~ is zero within experimen-tal error for diamagnetic hosts even for preciseENDOR determinations. Large errors in 4 areprimarily due to error in the g„ratio; hence,ENDOR determinations show little improvementin accuracy over EPR determinations. Improve-ment in the accuracy of & must await a better mea-surement of the ratio of the g„'s.
One can ask whether the upper bound on &, setby its experimental error, is small enough to de-cide that core polarization is not playing a majorrole in the appearance of hyperfine structure. Thehfs anomaly for Eu~' was determined by Baker andWilliams" to be (- 0. 78 + 0. 11)%, in a situation forwhich it has been suggested that core polarizationaccounts for about 80%%uo of the hyperfine constant.One must therefore conclude that present error
bution, denoted A»Lac in the notation of Sandarsand Beck, ' is due to mixing of higher electronicstates into the ground state by spin-orbit and spin-spin interactions. This has the effect of destroy-ing spherical symmetry for the half-filled andclosed shells and thus some f or other l 40 elec-trons can appear at the origin. For the S,&, stateof europium these authors find the spin-orbitoperator dominant. A»»c is found to be oppositein sign to the experimental A and "the Casimir ef-fect" must be used to bring the calculated value ofA closer to the experimental one. In order to es-timate the value of A~„one must numericallysolve the radial Dirac equation. Even by using thebest relativistic wave functions for europium avail-able at the time, they can reduce the discrepancybetween ABDLsc and experiment by only one-half.
Fortunately, there is an experimental way to tellwhether core polarization or relativistic effectsgive rise to A for half-filled shell ions. One maydefine the so called hyperfine anomaly 4 which is
~given by the equation

E. R. BERNSTEIN AND G. M. DQBBS
TABLE X. Magnetic dipolar hyperfine constants for gadolinium as determined by EPB, ENDOR, and other techniques. ~
Material andtechnique
Th02
Ce02
BaOMgOCaoCa%04ZrSi04
HfSi04ThSi04CaCO,BMDN
LES
YPO4GdN(nmr)
atom Gd {opt)atom Gd(opt)atom Gd(beam)
Bef." Temp. (K)
29077
23001477
Boom
15.97 +0.33—15.816+0.008
15.752+ 0.11215.21 + 0.2815.809+ 0. 00514.38+ 0. 5615.17+ 0. 1516,1+0.316.2+ 0, 05516.922+ 0. 08412.63+0. 02717.006 +0. 05516.643+ 0. 05515.897 + 0. 01216.486 ~ 0.00314.89+ 0. 4818.26 + G. 3718.10+ 0.22
—16.98+ G. 0819.567
ll. 85+ 0.42—12. 063+ 0. 008
12. 044+ 0. 084ll. 62+ 0. 2812.048+ 0. 00310.96 + 0. 56ll. 542+ 0. 1512.35 j:0.312.40~ 0.05512.907 + 0. 0559.67+0. 027
12.964 + 0.05512.657 ~ 0. 05512.122 + 0. 01312.559 + 0. 00211.15+ 0. 8414.59 + 0.3714.33+ 0.22
—13.02+ 0. 0814.734
0. 742+0. 0420. 7627+ 0. 00090. 765 + 0. 0110. 764+ G. 0320. 7621+ 0. 00040. 762+ 0.0690. 761 + 0. 03.70. 767+ 0. 0060. 7654+ 0. 0060. 7627+ 0.0070. 7656+ 0, 0040. 7623+ 0. 00570. 7605+ 0. 00580. 7625 + 0. 00140. 76180+ 0. 000260. 749+ 0. 080. 799 +0. 0370.791+0. 0220. 7668 +0.00830. 753+0, 0040. 80+0. 020. 79+0. 020. 76252+ 0. 00013
—.&'Pa)
2. 8+5. 80. 08+0. 3
—0. 17+1,9—0. 09+4. 7
0. 16+0.510. 14+ 90. 32+ 2. 7
—0. 5+4, 8—0.28+1.2
0. 07+1.3-0.3+ 0. 95
0.13+l. 20.37+1.2
0. 1+0.640. 2+0.51,9+ll
-4.7+5.3—3.7+3.4—0.45+0. 63
l. 35+ l. 03—4. 8+3.1—3. 5+3.1
0. 102 + 0.48
Some data for this table are taken from Befs. 59 and 15. If no technique is mentioned EPB or ENDOB was used."(1) Bef. 80; (2) Bef. 48; (3) Bef. 31; (4) I. V. Vinokurov, Z. N. Zonn, and V. A. Ioffe, Sov. Phys. -Solid State 7,
814 (1965); (5) Bef. 59; (6) K. E. Mann and I. V. Holroyd, Phys. Status Solidi 28, K27 (1968); (7) M. M. Abraham, L.A. Boatner, Y. Chen, J. L. Kolopus, and B. 9f. Beynolds, Phys. Bev. B 4, 2853 (1971); (8) A. T. Omlinson, thesisUniversity of Keele 1968; (unpublished); (9) C. F. Hempstead and K. D. Bowers, Phys. Bev. 118, 131 (1960),: (10) M.M. Abraham, G. W. Clark, C. B. Finch, B. W. Beynolds, and H. Zeldes, J. Chem. Phys. 50, 2057 (1969); (ll) D. B.Button and G. J. Troup, Brit. J. Appl. Phys. 15, 405 (1964); (12) S. A. Marshall and B. A. Serway, Phys. Bev. 171,345 (1968); (13) Bef. 54; (14) W. I,ow, Phys. Bev. 103, 1309 (1956); (15) This work; (16) Bef. 67; (17) E. L. Boyd andB. J. Gambino, Phys. Bev. Lett. 12, 20 {1964); (18) Bef. 7G; (19) Bef. 69; (20) Bef. 72.
'6 was calculated using a ratio of g„ factors of,' 0.7633+0. 0035 from Bef. 59.
limits on & are not as yet small enough for a mean-ingful decision about the extent of core polarizationin Gd" to be made. Such a determination mustawait more precise experiments to measure thevarious contributions to A. , and must await accurateunrestricted Hartree-Fock and relativistic wavefunctions to calculate these contributions from firstprinciples.
It is unfortunate that the ZFPMR experimentalerror is greater than the difference between themeasured A values for VV and 4 K. Theoxies havebeen developed for the temperature dependence ofthe hyperfine constant for $-state ions, ~ whichyield a 2/o decrease in A for Eu2' in CaF~ on goingfrom 4 to VV K, due to temperature-dependent con-figuration mixing by the orbit-lattice interaction.ZFENDOR should allow precise enough measure-ments to determine temperature dependence forlower than cubic symmetry by reducing the prob-lem of broad lines in LES. Qf course, this tem-perature dependence may be especially well studied
in ThO and BMDN for which magnetic resonancelines are considerably sharper than in I ES.
2. Quadrupole intemetion
The electric-quadrupole term in the Hamiltonianrepresents the energy of interaction of the electric-field gradient (EFG) at the nucleus with the nuclear-electric-quadrupole moment and is written as ~
eq= eq, (l- y„)+eq„(1—8,),in which eq, is the EFG due to the external crystalfield about the ion, eq„ is the EFG due to the val-ence-shell electrons, and e is the charge on theelectron. The two parameters y„and B areSternheimer antishielding factors which accountfor the effect of distortion of the closed shells ofelectrons by the gradients. They may have eithersign and hence may reverse the direction of thefield gradient.
Since q, is proportional to the quadrupolar crys-tal-field parameter A~, it must vanish in cubi. c
ZERO- FILLED PARAMAGNETIC RESONANCE OF TRIVALENT. . . 4635
symmetry. (A discussion of the relation betweenA", ' s and B, 's can be found in Ref. 40. ) Many ofthe hosts in Table X are cubic, and hence observa-tion of a small quadrupole term in their EPR would
be due to the second part of Eq. (4. 3). However,in the nonrelativistic limit of LS coupling, the sec-ond term in Eq. (4. 3) would also vanish~ due tothe spherical symmetry of the half-filled shell.We know of only one case for which a quadrupolar-interaction term has been measured for Gd
' incubic symmetry; namely, the ENDOR investigationin ThO~ by Hurrell. He was able to obtain spectrafor the ' Gd ' isotope only and measured the quad-rupole constant for the appropriate cubic spinHamiltonian B=—0.687+0. 18 MHz. The othertwo rare-earth S-state ions have somewhat largerconstants.
Evans, Sandars, and Woodgate have calculatedthe various contributions to the quadrupolar con-stant for the S-state atoms, "Mn, and both odd
europium isotopes. They ascribe nonzero contri-butions to the quadrupole interaction to a break-down of LS coupling, and to a breakdown of thenonrelativisti. c approximation. Using relativisticwave functions it is possible to calculate a contri-bution called the Casimir effect indicated by Bc~,which in both cases was found to dominate thebreakdown of LS coupling.
Since the quadrupole interaction is so small incubic symmetry for which the first part in Eq.(4. 3) vanishes, it may be expected that the firstterm will dominate the second in symmetry lowerthan cubic. There are only three cases for whichthis interaction has been measured. Using a stan-dard quadrupole term of the form P [I2 —&I(f+ 1)],Danner, Ranon, and Stamires and Rannon andStamires were able to measure I
"7PI = 53.7 + 0. 3
MHz and ~" P t = 50.4+ 0. 3 MHz in YPO4 by ordi-nary EPR. It is interesting to note that the ZFPMRstudies of Kahle et al. ' did not reveal the existenceof hyperfine structure in the spectrum of this salt.Using high-field ENDOR, Butti et a/. '4 measured
P = 26. 527 + 0. 003 MHz and ' 'P = 24. 905+ 0. 002MHz in BMD¹ For convenience, the value ob-tained in this work is restated: "'P= —53.09+ 0.76MHz and P= —51.16a0.76 MHz in LES. Therelatively large reported error (3o) is mostly de-termined by the linewidth of Gd ' transitions inLES.
P may be written as 3Qeaq/4I(2l 1). Hence, a-ratio of P values for two isotopes should equal theratio of quadrupole moments for each, if they havethe same spin and are positioned in the same EFG.Thus one can compare the ratio of P's with theratio of nuclear-electric-quadrupole moments,R(Q)=- "'Q/"'Q. There are four measurements ofR(Q). They are the optical determination byKaliteevskie of 1.28 + 0. 02, the optical determina-
tion by Speck of 0. 80+0.02, the Mossbauer de-termination by Prangev' of 0.78+ 0.06, and the ac-curate atomic beam measurement by Unsworth 2 of1.06534 + 0. 00003.
The ratio of P values, R(P) =-"'P/"'P, fromabove are 1.065+ 0. 012 for YPO4, 1.06513+ 0. 00021for BMDN, and 1.038+ 0. 030 for LES. The opticaldeterminations are mutually inconsistent. Eventhough one of them is consistent with the Mossbauervalue, all three are inconsistent with the accuratebeam value. Moreover, all three R(P)'s agree with
the beam measurement within experimental error.It is interesting to note that except possibly for
sign, the P values for YPO4 and LES agree with
each other within experimental error. If eq, werethe only gradient contributing to the quadrupoleterm, then the A,' values for each salt would haveto be the same if y„were the same for both. Infact, estimates lead one to conclude that this isroughly correct with 90 cm '
~Az (z~) & 100 cm 'for both YPO4 and LES. While b~ for these sys-tems are quite different [b~~(YPO~) = 3. 5 b2(LES) ]it must be remembered that A~ is the importantcrystal-field parameter for the quadrupole- inter-action constant. It can be demonstrated that therelationship between these two parameters is nei-ther direct nor simple. Indeed, higher-order andindirect terms may invalidate lattice summationsand even simple decomposition of mechanisms; itis perhaps possible that in low-symmetry (noncubic)crystals an apparent q, is enhanced. This latterpoint would most simply explain the fact thatIP(YPO~) I
= IP(LES) I for Gds'. lt would be par-ticularly useful if ZFPMR could be employed toobtain a sign for P in YPO4.
Finally, it is appropriate to inquire whether thequadrupole coefficients for LES are of about theright magnitude in an absolute sense. The EFG atthe La3' nucleus of diamagnetic LES has been mea-sured by NMR and, based on this determination, aprocedure has been developed for estimating theionic contribution to P for any lanthanide ion inLES. Also, the lattice contribution to P, P,«,.,for "9G13' in neodynium ethylsulfate (NdES) hasbeen measured by nuclear-alignment techniques. ~'
Block and Shirley find Pg,tt for ' Gd' to be-43.2+ 1.5 MHz for Gd in NdES using a quad-rupole moment of 1.56 b. Since this isotope hasthe same spin as those of interest here, one maypredict P equal to -44. 0+V. 3 MHz using Q= 1.59+ 0. 16 b. Considering the approximationsin the above calculation and the fact that the hostlanthanide ion is different, observed and predictedmagnitude and absolute sign of P are judged to bein agreement.
It is possible to evaluate P in another way. IfAz is a quadrupolar-lattice sum, one can write(using the notation of Edmonds )

E. R. BERNSTEIN AND G. M. DOBBS
P,~t, = 3QAmy„/l(2I —1), (4. 4)
Linewidths for Gd-doped LES are essentially thesame for ZFPMR transitions as EPR transitions(-20-30 MHz). Thus, inhomogeneity in the exter-nal field contributes in only a small way to the line-width. Also, since the linewidth is largely inde-pendent of temperature and the strength of the ex-ternal field, one may rule out broadening by spin-lattice relaxation as the cause of broad lines. In-deed, the observed linewidth of 25 MHz sets a 32. V
nsec lower bound on the relaxation times. Thespin-lattice relaxation time has been investigatedby several workersv and found to be four or fiveorders of magnitude slower than this lower limit.The linewidth of gadolinium in various hosts isknown to depend on concentration, at concentrationsabove about 0. 1 mole%).
The residual linewidth in LES is caused by in-homogeneous broadening of. the resonance line; thisbroadening is much greater than in other hosts.One can presume it to result from two factors;namely, the statistical variation of the crystal-field parameters due to lattice strains and dipolarinteraction with the neighboring nuclear moments.
On this basis, then, one might be willing to sug-gest that the broadening in gadolinium-doped LESmust be entirely due to dipolar broadening. This
in which y~= 1 —y„and is assumed to be + 21.5 forLES. The negative sign is usually chosen to agreewith antishielding calculations. Experimental crys-tal-field parameters from optical experiments aredefined as Vz= y~Az(r ) (r. ) is the expectationvalue of the radius of the open-shell 4f electrons.Edmonds's y&Az is equal to Freeman and Watson'sAq. Powell and Orbach ' obtain V&=100.6 cmand Freeman and Watson's best Hartree-Fock esti-mate of (r ) is 0. 785ao, ysAz for Gd then becomes128ao cm (ao is the Bohr radius). Finally, Ed-monds estimates y„(La)/ys(La) equal to —550, whichyields A~y„(Gd) = —550Aays(Gd) = (-7.04m 10 )aocm ~. Therefore, with the measurement of ~"Q=1.59+0. 16 b, a value of Py gt equal to —110MHz obtains.
This estimate is just over a factor of 2 from ourmeasurements of 'P. Allowing for generous errorlimits at each step in the above procedure, andallowing for the fact that no account of q„has beenmade, once again the measured value and sign ofP appear reasonable. For gadolinium in crystalsof less than cubic symmetry, the hyperfine spec-trum may be expected to be dominated by the quad-rupole interaction, in contrast to the more usualsituation, for which P is much smaller than A.This quadrupole interaction is composed almost ex-clusively from lattice contributions.
V. LINEWIDTHS
is, however, not the case, as Nd-doped LES showsa linewidth of 8-10 MHz for many of its lines. '
Since transitions are not observed between crystal-field levels in Nd (the first low-lying crystal-fieldlevel is 100 cm ~ above the ground state), inhomo-geneties in the crystal potential must play a greatlyreduced role in the Nd line broadening. Hence amajor part of the linewidth for gadolinium mustarise from variation in the crystal field. If relaxa-tion times contributed significantly to the linewidth,one would expect Nd to have wider lines than Gd be-cause the relaxation time of the former is consider-ably faster.
The effect of the surrounding nuclear magneticmoments associated with water of hydration in LEScan be seen in several ways. The linewidth of Gd-doped BMDN is on the order of 10 MHz. This com-parative sharpness can be explained by the fact thatthere are only six neighboring nitrogens in BMDN,but there are 18 neighboring protons in LES. Ad-ditionally, the magnetic moment of ~'N is seventimes smal]. er than that of H. The protons of thewater molecules are tightly coupled to the gadolin-ium ion, since one may observe their dynamicnuclear orientation. Sharpening of the spectrumon deuteration is accounted for by the magnetic mo-ment of the deuteron being 3. 25 times smaller thanthat of the proton. The fact that there is only a20-50/o sharpening is probably associated with thesubstantial inhomogeneties of the crystal field inLES. It is thus clear that both dipolar and crystal-field mechanism contribute roughly equally to theobserved Gd in LES zero-field linewidth.
In the series of ethylsulfates in which the hostion is varied, a great variety of linewidths are ob-served. In this instance observed linemidths area complicated function of the magnetic moment andrelaxation time of the host lanthanide. The de-tailed explanation of the trends as a function ofhost, temperature, and transition involved mustawait a suitable theory for paramagnetic relaxa-tion of rare-earth S-state ions in either zero orhigh field.
VI. CONCLUSION
Both crystal-field and hyperfine interactions in
Gd -doped LES hydrate have been studied. It wasshown that the zero-field spin Hamiltonian agreeswith the high-field spin Hamiltonian to a higherdegree of accuracy than has previously beenachieved. The available signal-to-noise ratio en-abled both the magnitude and absolute sign of thedipole- and electric-quadrupole hyperfine interac-tion constants for this system to be determined forthe first time. These constants had previouslygone unobserved during 23 years of conventionalEPR experiments. These parameters mere dis-cussed from the viewpoint of the theory of hfs, and

ZERQ- FILLED PARAMAGNETIC RESQNANCE QF TRIVALENT. . .
their magnitudes and signs were argued to be rea-sonable in comparison with other systems. Indeed,it is shown that for systems of lower than cubicsymmetry, the quadrupole interaction should domi-nate the dipole interaction in the spectrum. Whilethe size of I' can be determined in high field byplacing H perpendicular to the crystal symmetryaxis, its sign remains indeterminate except at ex-tremely low temperatures {-0. 001 K).
Finally, a previously unnoticed effect was re-
ported. The crystal field parametexs of gadoliniumin various lanthanide ethylsulfates change on deuteration of the waters of hydration. Some mechanismswere discussed which cause this change as well aslinewidths for the isomorphic series of lanthanideethylsulfates. For the diamagnetic LES the Gdlinewidths are shown to arise from at least twoseparate and distinct factors; crystal-field inhomo-geneities and magnetic dipole-dipole {local-field)coupling with neighboring nuclei.
*Supported in part by grants from The Research Corpora-tion. , Army Research Office-Durham, Office of NavalResearch, and the National Science Foundation.
tPresented in part at the Tgeenty-ninth Symposium onMolecular Stmctmre and Spectroscopy, 10 June 1974(Paper TD9).
IPresent address: Department of Chemistry, Massa-chusetts Institute of Technology, Cambridge, Massa-chusetts 02139.E. P. Bernstein. and G. M. Dobbs, Rev. Sci. Instrurn.44, 1314 (1973).
28. A. Marshall, S. V. Nistor, C. Y. Huang, and T.Marshall, Phys. Status Solidi B 59, 55 (1973).E. R. Bernstein and D. S. Franceschetti, Phys. Rev.B 9, 3678 (1974).
4L. E. Erickson. , Phys. Rev. 143, 295 (1966).J. M. Baker, W. Hayes, and M. C. M. O' Brien. , Proc.R.. Soc. Lond. A 254, 273 (1960).
6R. W. Brandon, R. E. Gerkin, an.d C. A. Hutchison,J. Chem. Phys. 3V, 447 (1962).
VC. A. Hutchison, Jr. , in. The Triple State, edited by A.B. ZBMan (Cambridge U. P. , Cambridge, England,1967), p. 63; C. A. Hutchison, Jr. , S. V. Nicholas,and G. W. Scott, J. Chem. Phys. 53, 1906 (1970).
M. A. El.-Sayed, in MTP International Review@ of Science-Physical Chemistry, edited by A. D. Buckingham andD. A. Bamsay (Butterworths, London, 1972), Ser. 1,Vol. 3, p. 119.
armer s U Ranon~ Rnd D. N. Stamlres, PhysRev. B 3, 2141 (1971).
QE. R. Bernstein and G. M. Dobbs (unpublished); G.M. Dobbs, Ph. D. thesis (Princeton University, 1974),(unpublished).G. F. Koster and H. Statz, Phys. Rev. 113, 445 (1959);H. Statz and G. F. . Koster ibid. 115, 1568 (1959); F. K.Kneubiihl, Phys. Kondens. Mater. 1, 410 (1963); T.Ray, Proc. R. Soc. Lond. A 277, 76 (1964); H. Wu-Han, L. Fu-Cheng and Z. Ji-Kang, Proc. Phys. Soc.Lond. 84, 661 (1964); W. J. C. Grant and M. W. P.Strandberg, J. Phys. Chem. Solids 25, 635 (1964);F. K. KneubuM, Phys. Kondens. Mater. 4, 5O O.e65};A. Bieri and F. K. Kneubuhl, ibid. 4, 230 (1965); G.A. Woonton and G. L. Dyer, Can. . J. Phys. 45, 2265(1967); J. S. M. Harvey and H. Kiefte, J. Phys. B 3,1326 (1evo).S. Geschwind, in Hyperfine Interactions, edited by A.J. Freeman and R. B. Frankel (Academic, New York,1967), p. 225.
'3A. Abragaxn and B. Bleaney, Elect~on ParamagneticResonance of Transition Ions (Clarendon, Oxford, .
England, 1970).
See, for example, G. H. Dieke, Spectra and EnergyLevels of Rare Earth Ions in Crystals (Interscience,New York, 1968).
5H. A. Buckmaster and Y. H. Shing, Phys. StatusSolidi A 12, 325 (1972).
6M. M. Abraham, L. A. Boatner, C. B. Finch, E. J.Lee, and R. A. Weeks, J. Phys. Chem. Solids 28, 81(196v).
'~H. A. Buckmaster, R. Chatterjee, and Y. H. Shing,Can. J. Phys. 50, 991 (1972).
8Through this paper all + numbers are rms errors, de-fined as three times the standard devation 0.' B. G. Wybourne, Phys. Rev. 148, 317 (1966).T. J. Menne, J. Phys. Chem. Solids 28, 1629 (1967);C. Y. Huang, Phys. Rev. 159, 683 (1967); T. J. Menneibid. 170, 356 (1968); P. Schlottman and M. C. G. Pas-seggl, Phys. Status Solidi B 52, K107 (1972); H. Bill,R. Chatterjee, and J. M. Dixon, ibid. B 57, K51 (1973);T. Lulek, Acta Phys. Pol. 36, 551 (1969); T. Lulek,Phys. Status Solidi 39, K105 (1970); H. A. Buckmaster,R. Chatterjee, and Y. H. Shing, Can. J. Phys. 50, 78(1972); D. J. Newman. and M. M. Ellis, Phys. Lett. 23,46 (1966}; D. J. Newman. , Chem. Phys. Lett. 6, 288(1970); D. R. Johnston, E. Y. Wong, and O. M. Staf-sudd, J. Chem. Phys. 44, 2693 (1966).D. J. Newman and W. Urban, J. Phys. C 5, 3101(1972).
2D. J. Newman, J. Phys. C 6, L271 (1973); Adv. Phys.2o, 1ev (1971).
23(a) J. A. A. Ketelaar, Physica 4, 619 (1937); (b) D. R.Fitzwater and 8,. E. Rundle, Z. Kristallogr. 112, 362(1959).R. J. Elliott and K. W. H. Stevens, Proc. Phys. Soc.Zona. A 64, 205 (1951).
'B. Bleaney, R. J. Elliott, and H. E. D. Scovil, Proc.Phys. Soc. Lond. A 64, 933 (1951).
268. Bleaney, R. J. Elliott, H. E. D. Scovil, and E. S.Trenam, Philos. Mag. 42, 1062 (1951).
7R. J. Elliott and K. W. H. Stevens, Proc. R. Soc,Lond. A 219, 387 (1953).B. Bleaney, H. E. D. Scovil, and R. S. Trenam, Proc.R. Soc. I ond. A 223, 15 (1954).
2 H. A. Buckmaster, Can. . J. Phys. 34, 150 (1956);34, 341 (1956).
3QH. A. Buckmaster, in Paramagnetic Resonance, Pro-ceedings of the I'irst International Conference, Jem-salem, 1962, edited by W. Low (Academic, New York,1963), Vol. 1, p. 217.
3 M. M. Abraham, E. J. Lee, and R. A. Weeks, J.Phys. Chem. Solids 26, 1249 (1965).J. Dweck and G. Seidel, Phys. Rev. 151, 289 (1966).

4638 E. R. BERNSTEIN AND G. M. DOBBS
H. A. Buckmaster and Y. H. Shing, Proceedings ofthe Seventh Rare Earth Research Conference, 1968(Natl. Tech. Info. Ser. , Washington, D. C. , 1969),Vol. 1, p. 323.
34C. R. Viswanthan and E. Y. Wong, J. Chem. Phys. 49,966 (1968).
35I. R. Dagg, R. C. Kemp, and H. F. Symmons, J. Phys.C 2, 1098 (1969).
3 R. J. Richardson, Ph. D. thesis (St. Louis University,1969) (un.published); R. J. Richardson and S. Lee, Phys.Rev. B 1, 108 (1970).B. E. Gerkin and D. L. Thorsell, J. Chem. Phys. 57,2665 O.972).R. E. Gerkin. and D. L. Thorsell, J. Chem. Phys. 57,188 (1972).(a) H. A. Buckmaster, R. Chatterjee, and Y. H. Shing,J. Phys. C 4, 832 (1971); (b) H. A. Buckmaster, R.Chatterjee, and Y. H. Shing, J. Mag. Res. 4, 85 (1971).M. T. Hutchings, in Solid State Physics, edited by F.Seitz and D. Turnbull (Academic, New York, 1964), Vol.16, p. 227.
4 D. H. Templeton and C. H. Dauben, J. Am. Chem.Soc. 76, 5237 (1954).
42W. C. Hamilton and J. A. Ibers, Hydrogen Bondingin Solids (Benjamin, New York, 1968).
3W. C. Hamilton and J. A. Ibers, Acta Crystallogr. 16,1209 (1963).
44R. G. Delaplane, J. A. Ibers, J. R. Ferraro, and J.J. Rush, J. Chem. Phys. 50, 1920 (1969).
4~W. Hillmer and W. Urban, Phys. Status Sol.idi 39, 527(1970).
46P. Nowicki, W. Hillmer, and W. Urban, Phys. StatusSolidi B 47, 549 (1971).
4~G. Burns, Phys. Rev. 128, 2121 (1962); J. Chem.Phys. 42, 377 (1965).S. A. Marshall, Phys. Bev. 159, 191 (1967).
49P. Diehl, H. Kellerhals, and E. Lusting, in NMRBasic Principles and Progress, edited by P. Diehl, E.Fluck, and B. Kosfeld (Springer Verlag, New York,1972), Vol. 6, p. 1.
5 H. A. Buckmaster, J. C. Dering, and D. J. I. Fry, J.Phys. C 1, 599 (1968).
5~J. E. Lowther, Phys. Status Solidi B 46, K19 (1971).~2M. L. Meil'man, Fiz. Tverd. Tela 14, 3055 (1972)
[Sov. Phys. -Solid State 14, 2612 (1972)].53A. Zalkin, J. D. Forrester, and D. H. Templeton, J.
Chem. Phys. 39, 2881 (1963). The reason for the sharplines compared to the ethylsulfates is not understood,except to say that since the trivalent gadolinium is sur-rounded by the nitrate groups, its nearest neighbors arenot hydrogen bonded. The Gd3' substitutes for the triva-lent bismuth and the structure may be considered as[B&(NO,),], [Mg(H, O),], ~ 6H,O.C. H. Butti, C. A. Swarts, D. van Ormondt, and R.deBeer, Phys. Lett. A 45, 247 (1973).
~5S. Misumi, T. Isobe, and T. Higa, Nippon KagakuKaishi 1973, 2039 (1973).
6(a) R. E. Trees, Phys. Rev. 92, 308 (1953); (b) A.Abragam, J. Horowitz, and M. H. L. Pryce, Proc. R.Soc. Lond. A 230, 169 (1955); (c) C. Schwartz, Phys.Bev. 97, 380 (1955); Phys. Bev. 105, 173 (1957); (d)
S. M. Blinder, Adv. Quantum Chem. 2, 47 (1965); (e)P. G. H. Sandars and J. Beck, Proc. B. Soc. Lond. A289, 97 (1966).C. M. Moser, in Hype+ineInteractions, edited by A.J. Freeman and R. B. Frankel (Academic, New York,1967), p. 95.B. Bleaney, Colloq. Int. Cent. Natl. Rech. Sci. 164,13 (1966).
59J. M. Baker, G. M. Copland, and B. M. Wanklyn, J.Phys. C 2, 862 (1969).
6 J. M. Baker and F. I. B. Williams, Proc. R. Soc.Lond. 267, 283 (1962).T. J. Menne, Phys. Rev. 180, 350 (1969); T. J. Menne,D. P. Ames, and S. Lee, ibid. 169, 333 (1968).R. E. Watson and A. J. Freeman, inHyperfineInter-actions, edited by A. J. Freeman and B. B. Frankel(Academic, New York, 1967), p. 53.
63B. Bleaney, in Hyperfine Interactions, edited by A. J.Freeman and R. B. Frankel (Academic, New York,1967), p. 1.
64J. P. Hurrell, Brit. J. Appl. Phys. 16, 755 (1965).6 J. M. Baker, J. R. Chadwick, G. Garton. , and J. P.
Hurrell, Proc. R. Soc. Lond. A 286, 352 (1965).66L. Evans, P. G. H. Sandars, and G. K. Woodgate,
Proc. B. Soc. Lond. A 289, 108, 114 (1966).U. Ranon. an.d D. ¹ Stamires, Chem. Phys. Lett. 5,221 (i.970).
~ H. G. Kahle, V. Koch, J. Plamper, and W. Urban, J.Chem. Phys. 49, 2702 (1968); H. G. Kahle, H. C.Schopper, W. Urban, and W. Wuchner, Phys. StatusSolidi 38, 815 (1970).
69N. I. Kaliteevski, M. P. Chaika, I. Kh. Pacheva, and
E. E. Fradkin, Zh. Eksp. Teor. Fiz. 37, 882 (1959)[Sov. Phys. —JETP 10, 629 (1960)].
7 D. B. Speck, Phys. Bev. 101, 1725 (1956).7~H. Prange, Z. Phys. 212, 415 (1968).7 P. J. Un. sworth. , J. Phys. B 2, 122 (1969).3Compare Bef. 13, p. 304 and 305 with D. Kruse, Z.Phys. 203, 49 (1967); W. Hintzmann, ibid. 230, 213(1970); C. Brecker, H. Samelson, R. Riley, and A.Lewpicki, J. Chem. Phys. 49, 303 (1968).
74D. T. Edmonds, Phys. Bev. Lett. 10, 129 (1963).7~J. Block and D. A. Shirley, J. Chem. Phys. 39, 1128
(1963); Phys. Rev. 143, 278 (1966).76A. J. Freeman and B. E. Watson, Phys. Bev. 127,
2058 (1962).7M. J. D. Powell and B. Orbach, Proc. Phys. Soc.Lond. 78, 753 (1961).G. Feher and H. E. D. Scovil, Phys. Rev. 105, 760(1957); C. F. Davis, Jr. , M. W. P. Strandberg, and
R. L. Kyhl, ibid. 111, 1268 (1958); G. V. Marr and P.Swarup, Can. . J. Phys. 38, 495 (1960); S. A. Peskovat-skii and A. N. Chernets, Fiz. Tverd. Tela 4, 657(1962); 4, 665 (1972).[Sov. Phys. -Solid State 4, 479(1962); 4, 484 (1962)].
+Yu E. Pol'skii, Fiz. Tverd. Tela 6, 842 (1964) [Sov.Phys. -Solid State 6, 651 (1964)].W. Low and D. Shaltiel, J. Phys. Chem. Solids 6, 315(1958). It is a general feature of S-state ion high-fieldspectra that linewidths increase for higher Ms values,due to the increasing effect of the crystal field.