Zero emission technologies for pneumatic controllers in ... · Zero emission technologies for...
43
Zero emission technologies for pneumatic controllers in the USA Applicability and cost effectiveness
Transcript of Zero emission technologies for pneumatic controllers in ... · Zero emission technologies for...

Zero emission technologies for pneumatic controllers in the USA
Applicability and cost effectiveness
Zero emission technologies for pneumatic controllers in the USA 1
This report was prepared by Carbon Limits AS. Project title: Zero emission technologies for pneumatic controllers in the USA
Client: CATF Project leader: Stephanie Saunier Project members: Hesam Darani, Anders Pederstad Report title: Zero emission controllers in the USA Version 2.0 Finalized: 1st August 2016
Øvre Vollgate 6
NO-0158 Oslo
Norway
carbonlimits.no
Registration/VAT no.: NO 988 457 930
Carbon Limits is a consulting company with long standing experi-
ence in supporting energy efficiency measures in the petroleum
industry. In particular, our team works in close collaboration with
industries, government, and public bodies to identify and address
inefficiencies in the use of natural gas and through this to
achieve reductions in greenhouse gas emissions and other air
pollutants.
Zero emission technologies for pneumatic controllers in the USA 2
Table of contents
Executive Summary.............................................................................................................................3
Abbreviations and Notes on Units ........................................................................................................5
1. Introduction .....................................................................................................................................6
1.1 What is the problem? ...................................................................................................................... 6
1.2 Objective of this project ................................................................................................................... 6
1.3 Approach and methodology ............................................................................................................. 7
2. Gas Driven Pneumatic controllers – What are we talking about? ......................................................7
2.1 Definition ......................................................................................................................................... 7
2.2 Typology of controllers .................................................................................................................... 8
2.3 Number of controllers and emission factors – Brief literature review. ................................................ 9
3. Zero emission technologies – Description and technical applicability .............................................. 12
3.1 Overview of the zero emission technology presented. ................................................................... 12
3.2 Electronic controllers (solar powered and grid powered) ................................................................ 13
3.3 Instrument air ................................................................................................................................ 17
3.4 Other technologies ........................................................................................................................ 19
4. Cost effectiveness of electronic controllers and instrument air ........................................................ 20
4.1 Analytical approach ....................................................................................................................... 20
4.2 Main findings – electronic controllers ............................................................................................. 23
4.3 Main findings – Instrument air ........................................................................................................ 29
4.4 Summary of the analysis ............................................................................................................... 33
5. Reference list ................................................................................................................................ 36
6. Appendix ....................................................................................................................................... 37
6.1 Quantitative assumptions for the model ......................................................................................... 37
6.2 Other assumptions for the model ................................................................................................... 38
6.3 Detailed sensitivity analysis ........................................................................................................... 39
6.4 List of site configurations with abatement cost superior to the social cost of methane .................... 41
Zero emission technologies for pneumatic controllers in the USA 3
Executive Summary
Natural gas-driven pneumatic controllers are used widely in the oil and natural gas industry to control liquid
level, temperature, and pressure during the production, processing, transmission, and storage of natural
gas and petroleum products. However, these devices release methane into the atmosphere. Pneumatic
controllers are the second-largest source of methane from the US oil and gas industry, behind only
component leaks, according to US EPA’s Greenhouse Gas Inventory.
US Federal rules require that new continuous-bleed controllers be low-bleed (defined as designed to emit
less than six standard cubic feet/hour) at production sites and compressor stations and be zero-bleed at
processing plants. Unfortunately, recent measurements have demonstrated that many controllers currently
in field use are emitting more than would be expected based on design specifications.
This study was undertaken to determine whether cost-effective non-emitting technologies are available to
eliminate this major emissions source. We find that these technologies have evolved considerably over the
past decade and are now available and actively in use in oil and gas fields in the United States and
Canada. Two technologies are mature, proven, and in relatively wide use, and as we discuss in this report,
these technologies provide a cost-effective way to eliminate emissions of methane and other pollutants
from pneumatic controllers.
Major findings include:
• Zero emission technologies can virtually eliminate emissions from pneumatic devices.
• A number of technologies are available. The two most promising, which this report focuses on, are
electronic controllers – both solar and grid powered – and instrument air.
Electronic controllers can be installed both at sites connected to the electric grid and at
sites isolated from the grid.
Instrument air technology is a well-established, mature solution to run pneumatic control
systems and is widely applied globally. The technology requires a reliable power supply,
either from the grid or from generators on the site.
• Currently, electronic controllers are generally used at smaller sites while instrument air is used at
larger sites, due to the technical limitations of air compressors. These two technologies are on the
market today, from multiple suppliers.
• Due to the market conditions, providers of electronic controllers have so far focused mainly on the
development of solutions for small sites in remote locations. There thus seems to be much less
field experience with using electronic controllers at medium and large sites; however, no technical
barriers were identified for this type of installation.
• A number of other zero emission solutions are available today with more limited applicability (e.g.
self-contained devices) or fewer documented implementations (e.g. solar-powered instrument air).
Depending on the site specificities, these options can represent useful alternatives to instrument
air or electronic controllers.
• Operators have successfully installed hundreds of systems. They report positive experiences on
both new and retrofit sites, valuing zero emission solutions for their low maintenance costs and
reliability.
• An economic analysis, assuming conservative average emission factors for pneumatic controllers,
was performed for 2032 site configurations with 1 to 40 controllers (excluding emergency
Zero emission technologies for pneumatic controllers in the USA 4
shutdown devices). Both retrofit and new installations, with and without electricity on-site, were
considered.
o Zero emission solutions have abatement costs below the social cost of methane used by
US EPA ($1354/tCH4, mean value calculated for 2020 with a 3% discount rate in 2016
USD) in the vast majority of the site configurations considered (2008 out of 2032 site
configurations).
o The abatement costs, calculated as described above, exceed the social cost of methane
used by US EPA primarily at very small sites – those with less than three controllers
(excluding emergency shutdown devices). However, if higher emission factors, as
reported from recent field measurements, are used, the abatement costs at even the very
small sites will fall below the social cost of methane.
Overall, we find that zero emission solutions are available today and are cost effective to implement in
nearly every situation.
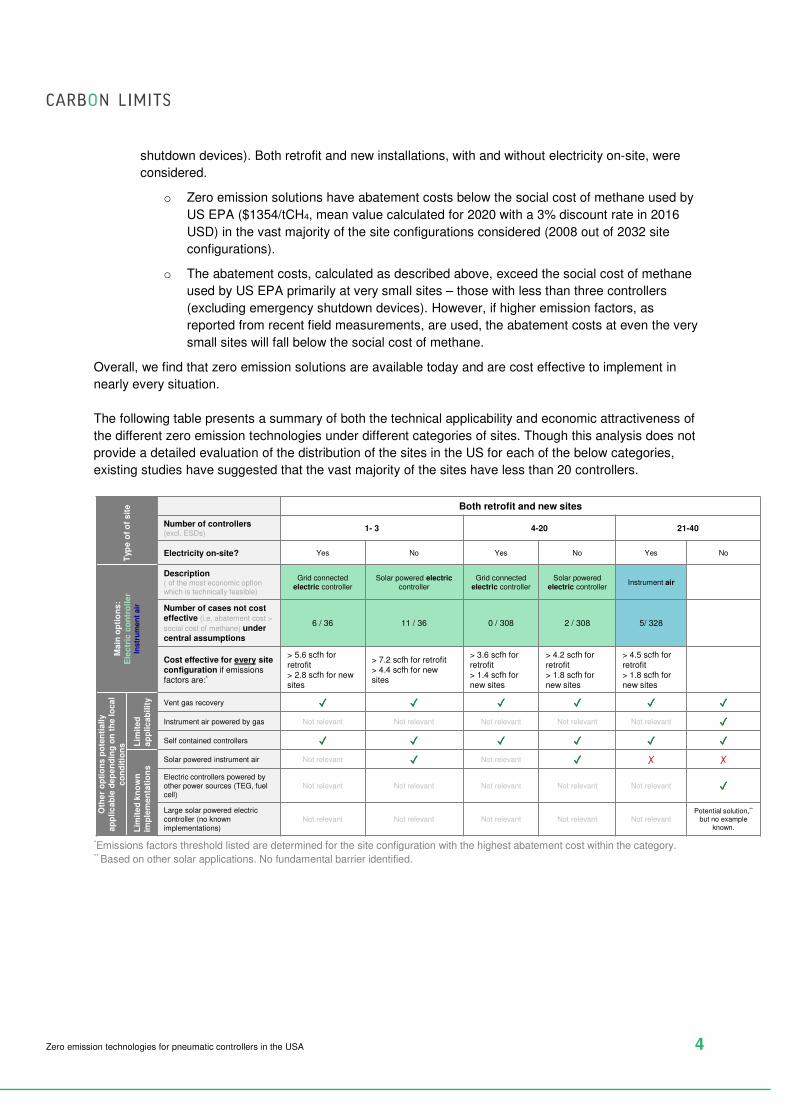
The following table presents a summary of both the technical applicability and economic attractiveness of
the different zero emission technologies under different categories of sites. Though this analysis does not
provide a detailed evaluation of the distribution of the sites in the US for each of the below categories,
existing studies have suggested that the vast majority of the sites have less than 20 controllers.
*Emissions factors threshold listed are determined for the site configuration with the highest abatement cost within the category. ** Based on other solar applications. No fundamental barrier identified.
Typ
eo
f o
f s
ite Both retrofit and new sites
Number of controllers (excl. ESDs)
1- 3 4-20 21-40
Electricity on-site? Yes No Yes No Yes No
Main
op
tio
ns:
Ele
ctr
ic c
on
tro
ller
Instr
um
en
tair
Description( of the most economic option which is technically feasible)
Grid connectedelectric controller
Solar powered electriccontroller
Grid connectedelectric controller
Solar powered electric controller
Instrument air
Number of cases not cost effective (i.e. abatement cost >
social cost of methane) undercentral assumptions
6 / 36 11 / 36 0 / 308 2 / 308 5/ 328
Cost effective for every site configuration if emissions factors are:*
> 5.6 scfh for retrofit> 2.8 scfh for new sites
> 7.2 scfh for retrofit> 4.4 scfh for new sites
> 3.6 scfh for retrofit> 1.4 scfh for new sites
> 4.2 scfh for retrofit> 1.8 scfh for new sites
> 4.5 scfh for retrofit> 1.8 scfh for new sites
Oth
er
op
tio
ns
po
ten
tia
lly
ap
plic
ab
le d
ep
en
din
g o
n t
he lo
cal
co
nd
itio
ns L
imit
ed
ap
plic
ab
ilit
y Vent gas recovery ✓✓✓✓ ✓✓✓✓ ✓✓✓✓ ✓✓✓✓ ✓✓✓✓ ✓✓✓✓
Instrument air powered by gas Not relevant Not relevant Not relevant Not relevant Not relevant ✓✓✓✓
Self contained controllers ✓✓✓✓ ✓✓✓✓ ✓✓✓✓ ✓✓✓✓ ✓✓✓✓ ✓✓✓✓
Lim
ite
d k
no
wn
imp
lem
en
tati
on
s
Solar powered instrument air Not relevant ✓✓✓✓ Not relevant ✓✓✓✓ ✗ ✗
Electric controllers powered by other power sources (TEG, fuelcell)
Not relevant Not relevant Not relevant Not relevant Not relevant ✓✓✓✓
Large solar powered electric controller (no knownimplementations)
Not relevant Not relevant Not relevant Not relevant Not relevantPotential solution,**
but no exampleknown.
Zero emission technologies for pneumatic controllers in the USA 5
Abbreviations and Notes on Units
CAPEX Capital Expenditure
CH4 Methane
CO2eq Carbon dioxide equivalent
EF Emission Factor
ESD Emergency shut down
GHGRP Greenhouse Gas Reporting Program – US EPA
GOR Gas/oil ratio
Mscf Thousands standard cubic feet
MMscf Million standard cubic feet
MMscfd Million standard cubic feet per day
MMT Million tons
OPEX Operational expenditure
SCADA Supervisory Control and Data Acquisition
Scfh Standard cubic feet/hour
USD US dollars
VOC Volatile Organic compound
VRU Vapor Recovery Unit
Notes on units:
All the data are presented in metric tons
All monetary figures are presented in US dollars, denoted as $
Social Cost of Methane: This report uses the social cost of methane, as reported by US EPA in recent
regulatory analyses, as a benchmark for the cost-effectiveness of measures to abate methane emissions.
We use the mean value calculated at the 3% discount rate for emissions in year 2020. EPA calculates this
as $1300 per metric ton in 2012 USD. We have converted this to $1354 per metric ton in 2016 USD, using
a cumulative rate of inflation of 4.2%.
Zero emission technologies for pneumatic controllers in the USA 6
1. Introduction
1.1 What is the problem?
Natural gas-driven pneumatic controllers are used widely in the oil and natural gas industry to control liquid
level, temperature, and pressure during the production, processing, transmission, and storage of natural
gas and petroleum products. However, these devices vent methane into the atmosphere. Pneumatic
controllers are the second-largest source of methane from the US oil and gas industry, behind only
component leaks, according to US EPA’s Greenhouse Gas Inventory [1].
Over the last few years, regulators have worked to reduce the emission of methane and volatile organic
compounds (VOCs) from pneumatic controllers. US Federal rules require that new continuous-bleed
controllers be low-bleed (defined as designed to emit less than 6 scfh) at production sites and compressor
stations and zero-bleed at processing plants. Wyoming goes further to include intermittent-vent controllers
in its requirement that all new controllers are designed to emit less than 6 scfh. It also requires the
replacement of existing high-emitting controllers in some areas and caps allowable emissions in other
areas. Recently Colorado required that existing high-continuous-bleed controllers be replaced with low-
bleed controllers statewide, and other states are currently considering similar measures. Finally, some
operators have reported voluntary replacements of high-bleed controllers with low-bleed controllers to
programs such as US EPA’s Natural Gas STAR.
Unfortunately, recent measurement studies [2,3,4] have reported higher emissions from low-bleed
controllers than expected. Some controllers that are considered low-bleed according to manufacturer
specifications actually bleed above the low-bleed threshold of 6 scfh. Indeed, a number of controllers
appear to malfunction, emitting significantly more than they are designed to emit.
Moreover, as a class, intermittent-vent controllers, which are largely unregulated, far outnumber
continuous-bleed controllers, and EPA estimates that emissions from intermittent-vent controllers are
considerably higher than emissions from continuous-bleed controllers [1]. Recent work has demonstrated
that some controllers designed to emit intermittently fail and begin leaking natural gas continually [2,5].
Given the wide range of applications of pneumatic controllers, their typical installation in remote,
unmanned sites, and the limited resources of air quality regulators, it is very challenging for air quality
regulators to ensure compliance to emissions standards for pneumatic controllers. Currently, new
continuous-bleed controllers are in compliance with EPA rules, if they are designed to emit below the EPA
threshold of six cubic feet per hour. In practice, they may emit more depending on installation parameters
(such as the pressure of the supply-gas), malfunctions, or even tampering, e.g. production workers modify
controllers bleed rates when they believe that it will improve reliability [9]. Finally, it is inherently difficult to
quantify the emissions from intermittent-vent controllers, as their actuation frequency is variable and may
change over time.
1.2 Objective of this project
Zero emission technologies have the potential to virtually eliminate this emission source. They have
evolved extensively over the last few years, as operators have gained experience using them. Yet,
although zero emission technologies are often mentioned in best practices documentation and reports,
there is very limited information on overall applicability and costs (with the exception of instrument air).
Zero emission technologies for pneumatic controllers in the USA 7
This report documents how zero emission technologies are being used in gas and oil fields, and discusses
the zero emissions technologies that are suitable for wide usage in common applications at oil and gas
production facilities and compressor stations. The main objectives include:
• Presentation of zero emission technologies that are currently available on the market.
• Discussion of the applicability and the technical barriers to the implementation of these
technologies.
• Estimates of implementation and methane abatement costs of these technologies for new
installations and retrofits.
1.3 Approach and methodology
In addition to a comprehensive literature review, this report relies on interviews with a number of relevant
stakeholders and a detailed cost-benefit analysis.
Interviews: Seventeen interviews were conducted. Nine were with technology providers, and eight with
both small and large oil and gas companies. The interviews gathered information on field experience with
the implementation of zero emission technologies, in particular on their applicability, technical barriers
experienced, and actual costs and benefits.
Cost-benefit analysis of zero emission technology implementation: Based on the information
gathered during the interviews, literature reviews, and online equipment quotes, a cost-benefit analysis
was performed covering a wide range of possible site configurations.
The cost-benefit analysis is presented in section 4 of this report. Prior to that, section 2 includes an
introduction to controller typologies, followed by a brief literature review of emissions from controllers.
Section 3 presents the different zero emission controller technologies and includes a description of field
experiences with these technologies. The report concludes with a brief overview of existing applicability
and costs under a range of circumstances.
2. Gas Driven Pneumatic controllers – What are we talking about?
2.1 Definition
A process controller is a device that senses a physical state and then operates automatically to regulate
that state1, based on an established set-point in its control logic. Process controllers can regulate a variety
of physical parameters – or process variables – including fluid pressure, liquid level, fluid temperature, and
differential pressure. An example of a common type is a separator dump valve controller, which operates
when it senses that liquid has reached a certain level. Process controllers can be electric, hydraulic,
pneumatic or a combination of them. An example of a combination controller would be an electrohydraulic
controller operating an electric valve to send liquid pressure to a hydraulic end-device.
Pneumatic controllers convert an input signal to a pneumatic pressure output using gas pressure. The
end-device, i.e. the control valve, is adjusted by the actuator in response to signal from the controller.
A pneumatic controller uses gas pressure to open or close a mechanical device, such as a valve, when it
senses the need to regulate a process condition such as liquid level, pressure, temperature, or flow.
1 In complex control systems, other process control variables might be modulated to regulate the state of that process variable.
Zero emission technologies for pneumatic controllers in the USA 8
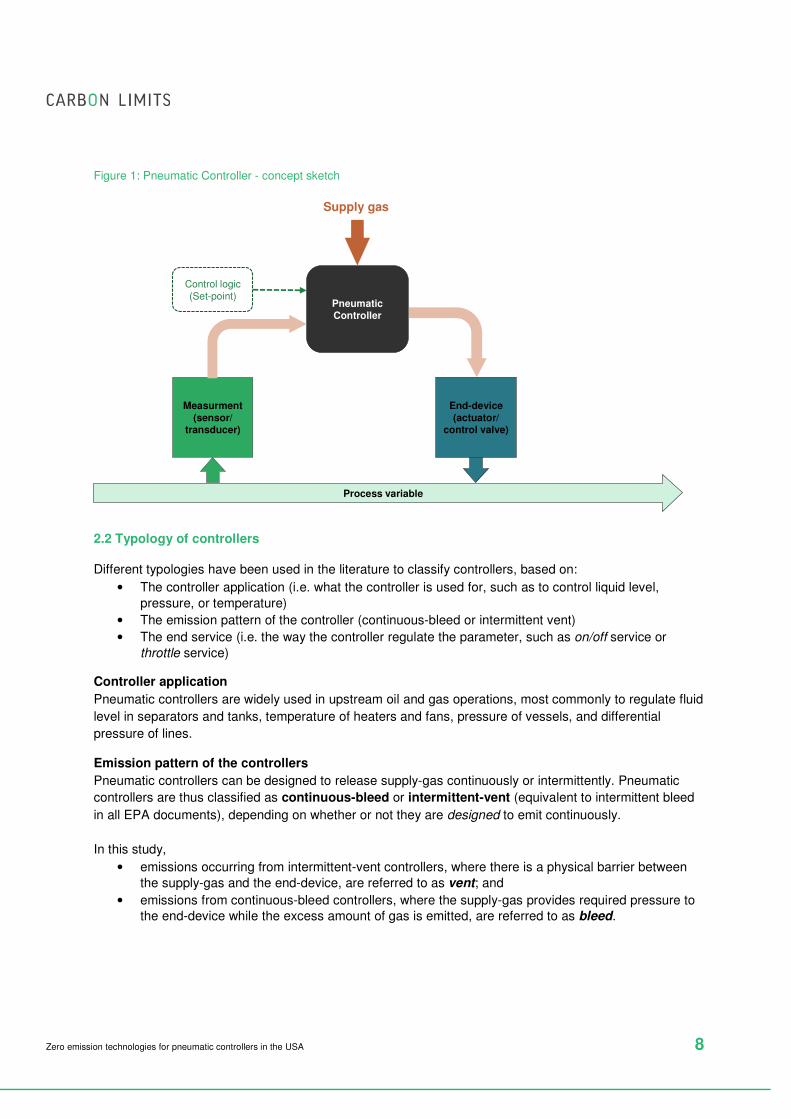
Figure 1: Pneumatic Controller - concept sketch
2.2 Typology of controllers
Different typologies have been used in the literature to classify controllers, based on:
• The controller application (i.e. what the controller is used for, such as to control liquid level,
pressure, or temperature)
• The emission pattern of the controller (continuous-bleed or intermittent vent)
• The end service (i.e. the way the controller regulate the parameter, such as on/off service or
throttle service)
Controller application
Pneumatic controllers are widely used in upstream oil and gas operations, most commonly to regulate fluid
level in separators and tanks, temperature of heaters and fans, pressure of vessels, and differential
pressure of lines.
Emission pattern of the controllers
Pneumatic controllers can be designed to release supply-gas continuously or intermittently. Pneumatic
controllers are thus classified as continuous-bleed or intermittent-vent (equivalent to intermittent bleed
in all EPA documents), depending on whether or not they are designed to emit continuously.
In this study,
• emissions occurring from intermittent-vent controllers, where there is a physical barrier between
the supply-gas and the end-device, are referred to as vent; and
• emissions from continuous-bleed controllers, where the supply-gas provides required pressure to the end-device while the excess amount of gas is emitted, are referred to as bleed.
Process variable
Pneumatic Controller
Measurment (sensor/
transducer)
End-device(actuator/
control valve)
Control logic(Set-point)
Supply gas
Zero emission technologies for pneumatic controllers in the USA 9
The continuous-bleed controllers are classified into high-bleed and low-bleed in this report, depending on
whether or not the controller is deemed to have a bleed rate above or below 6 scfh, in line with EPA
regulations.2
The typology used in this report differs from the one presented in Allen et al. [2] where controllers are
classified depending on their measured emissions pattern as opposed to their designed emissions pattern.
End-service typology
The end-device can be in on/off service or throttle service, depending on the process requirements. An
example of on/off service is a dump-valve that controls the level of a vessel. In the “on” state, the valve is
completely open to “dump” liquid. When the desired level has been achieved, the valve completely closes
to its “off” state. An example of throttle service is a pressure control valve, which increases or decreases
the flow of gas as needed to maintain line pressure at a fixed value. Both continuous-bleed and
intermittent-vent controllers are commonly used to perform both on/off and throttling services.
A summary of pneumatic controller typology is presented in the table below. As this study focuses on
eliminating emissions from these devices, only the emission pattern typology is used in the rest of the
report.
Table 1: Summary of controller typology (mainly based on [6])
Type of Service
On/Off Throttling
Em
issio
n c
hara
cte
risti
cs
Intermittent-vent
- Gas vented at de-actuation
- Designed to emit no gas between de-actuation instances
- De-actuation frequency depends on process variability
- Gas vented when end-device needs to throttle-off
- Designed to emit no gas between throttle-off instances
- Throttling frequency depends on process fluctuations
High-bleed continuous controller
- Gas emitted continuously with higher bleed rates when end-device needs “off” service
- Nevertheless, the average bleed amount is constant
- Bleed rates are by definition deemed to be higher than 6 scfh
- Gas emitted continuously with higher bleed rates end-device needs to throttle-off
- Nevertheless, the average bleed amount is constant
- Bleed rates are by definition deemed to be higher than 6 scfh
Low-bleed continuous controller
- Gas emitted continuously with higher bleed rates when end-device needs “off” service
- Nevertheless, the average bleed amount is constant
- Bleed rates are by definition deemed to be lower than 6 scfh
- Gas emitted continuously with higher bleed rates end-device needs to throttle-off
- Nevertheless, the average bleed amount is constant
- Bleed rates are by definition deemed to be lower than 6 scfh
2.3 Number of controllers and emission factors – Brief literature review.
Important work has been taking place over the last few years to measure and understand methane and
VOC emissions from pneumatic controllers. This work includes measurement surveys [2,3,4,7], count of
controllers per facility [1,2,8], and engineering calculations [8]. The methodology and the sampling
approach vary significantly between different sources of information; thus comparisons should be made
with particular care [8].
2 It should be noted that the bleed rate is not a specification of the controller only, but also depends on the pressure and flow-rate of the supply-gas in addition to the size of the restriction orifice.
Zero emission technologies for pneumatic controllers in the USA 10
How many controllers per site?
The number of controllers per site varies depending on the number of wells and more generally the
number and type of equipment used. Recent studies have demonstrated that the vast majority of sites
have less than 20 controllers.
Most of the existing studies have focused only on emitting controllers [3,5,7], thus underestimating the
number of controllers reported for each site, since some intermittent-bleed controllers actuate infrequently
(e.g., controllers for emergency shut-down valves) and are unlikely to do so while a site is being surveyed.
Two studies have performed a thorough count of the number of controllers per site [2,8]. The distribution of
controller functions reported by these studies varied, perhaps due to differences in the types of sites
sampled in the studies, but the overall distribution of controller counts at production sites were quite similar
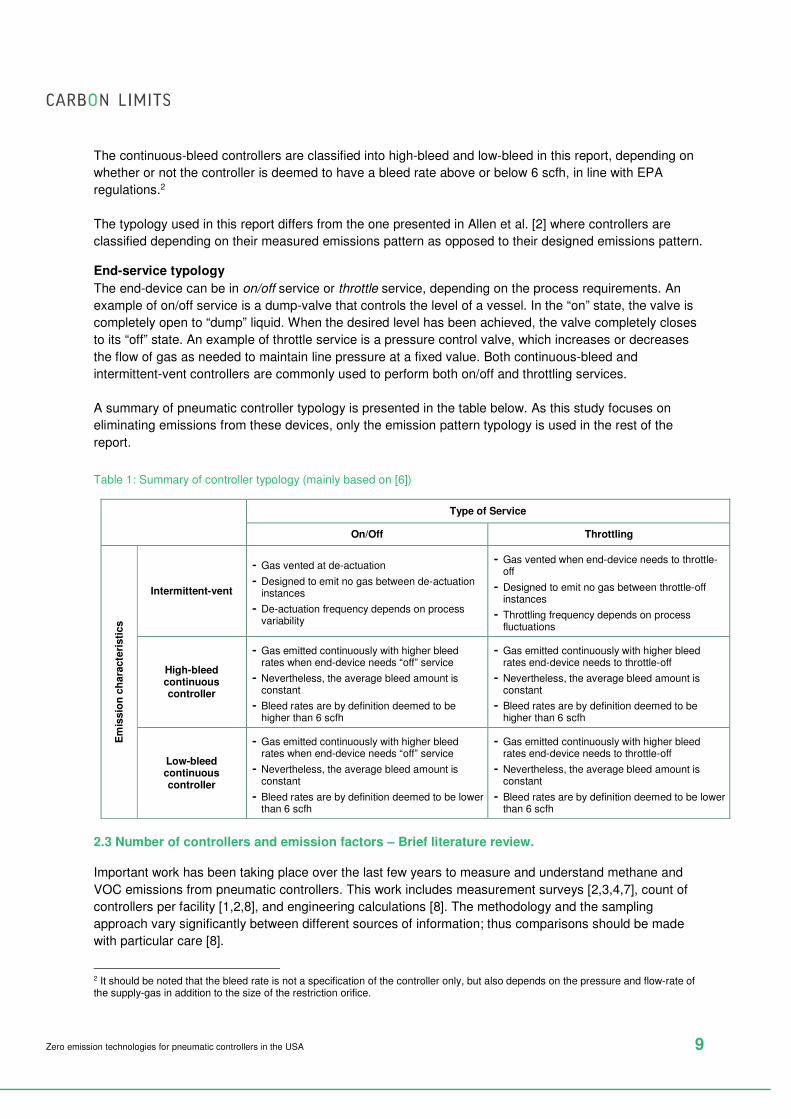
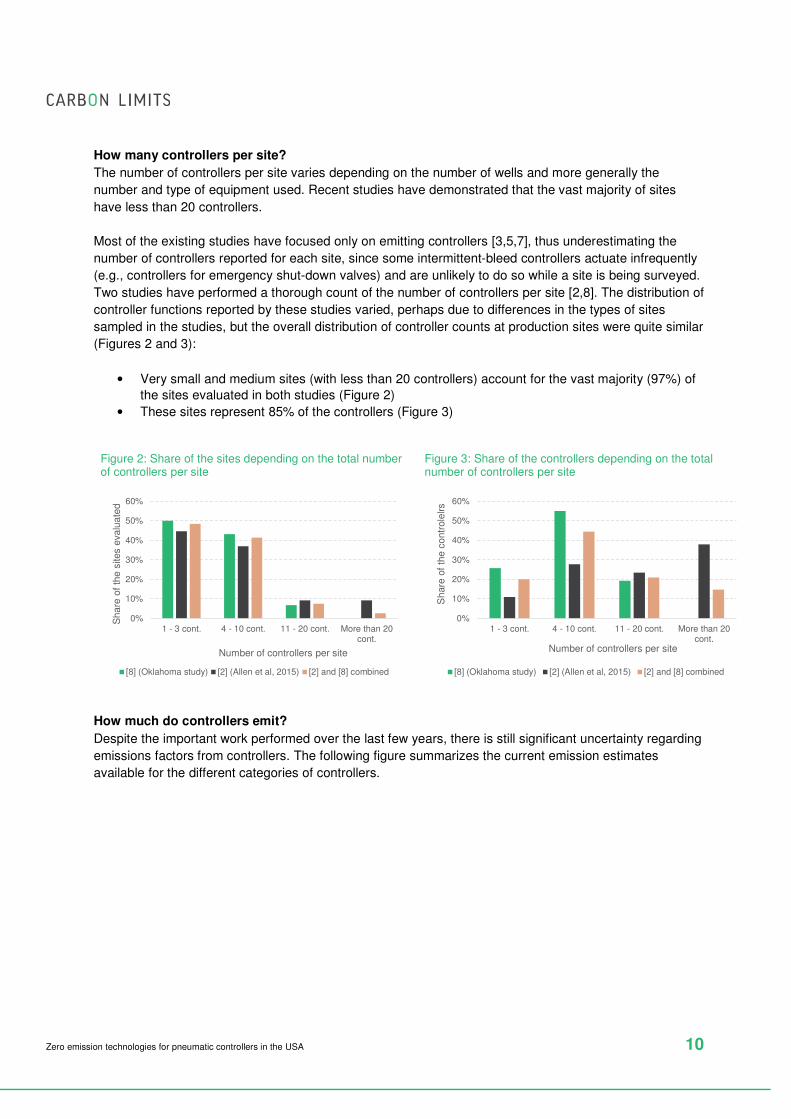
(Figures 2 and 3):
• Very small and medium sites (with less than 20 controllers) account for the vast majority (97%) of
the sites evaluated in both studies (Figure 2)
• These sites represent 85% of the controllers (Figure 3)
Figure 2: Share of the sites depending on the total number of controllers per site
Figure 3: Share of the controllers depending on the total number of controllers per site
How much do controllers emit?
Despite the important work performed over the last few years, there is still significant uncertainty regarding
emissions factors from controllers. The following figure summarizes the current emission estimates
available for the different categories of controllers.
0%
10%
20%
30%
40%
50%
60%
1 - 3 cont. 4 - 10 cont. 11 - 20 cont. More than 20cont.
Sh
are
of
the
sites e
valu
ate
d
Number of controllers per site
[8] (Oklahoma study) [2] (Allen et al, 2015) [2] and [8] combined
0%
10%
20%
30%
40%
50%
60%
1 - 3 cont. 4 - 10 cont. 11 - 20 cont. More than 20cont.
Sh
are
of
the
co
ntr
ole
lrs
Number of controllers per site
[8] (Oklahoma study) [2] (Allen et al, 2015) [2] and [8] combined
Zero emission technologies for pneumatic controllers in the USA 11
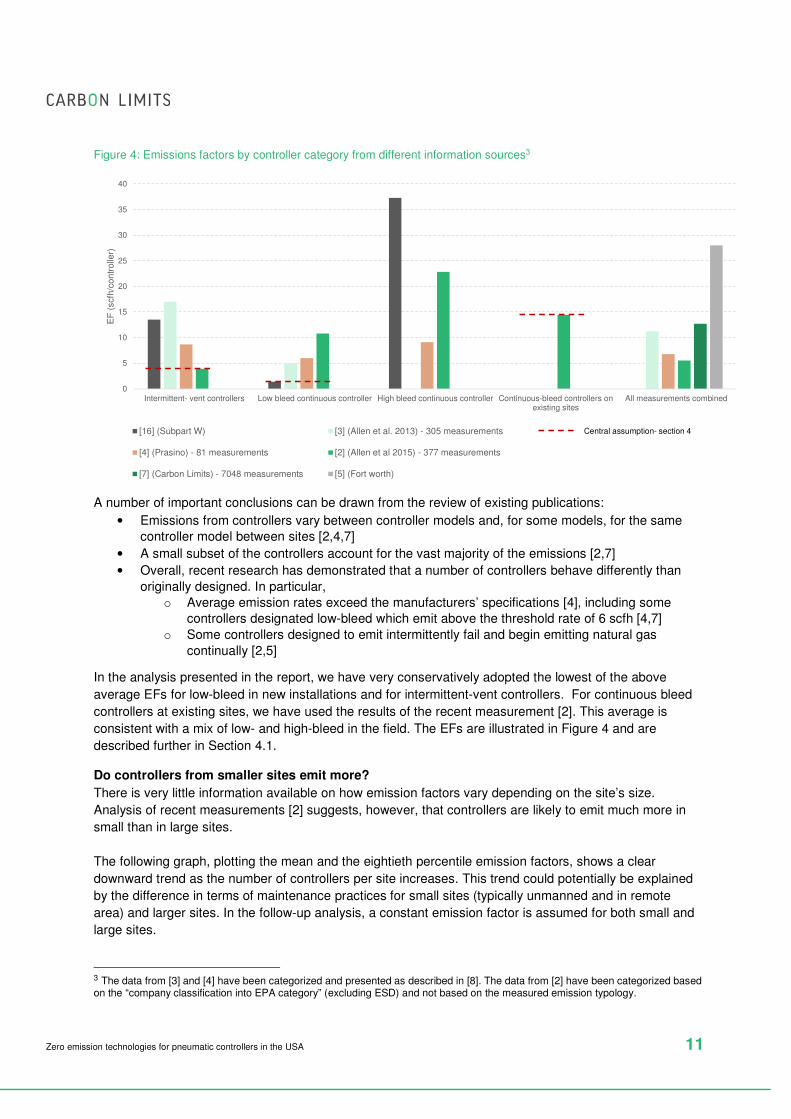
Figure 4: Emissions factors by controller category from different information sources3
A number of important conclusions can be drawn from the review of existing publications:
• Emissions from controllers vary between controller models and, for some models, for the same
controller model between sites [2,4,7]
• A small subset of the controllers account for the vast majority of the emissions [2,7]
• Overall, recent research has demonstrated that a number of controllers behave differently than
originally designed. In particular,
o Average emission rates exceed the manufacturers’ specifications [4], including some
controllers designated low-bleed which emit above the threshold rate of 6 scfh [4,7]
o Some controllers designed to emit intermittently fail and begin emitting natural gas
continually [2,5]
In the analysis presented in the report, we have very conservatively adopted the lowest of the above
average EFs for low-bleed in new installations and for intermittent-vent controllers. For continuous bleed
controllers at existing sites, we have used the results of the recent measurement [2]. This average is
consistent with a mix of low- and high-bleed in the field. The EFs are illustrated in Figure 4 and are
described further in Section 4.1.
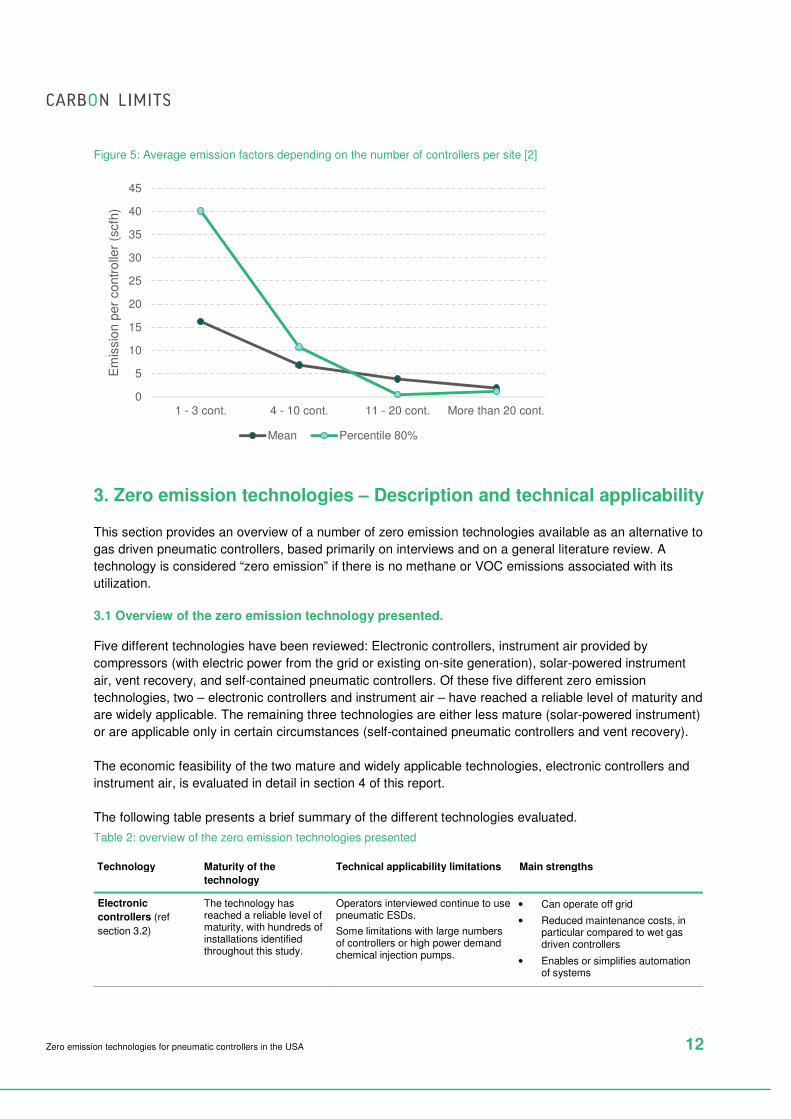
Do controllers from smaller sites emit more?
There is very little information available on how emission factors vary depending on the site’s size.
Analysis of recent measurements [2] suggests, however, that controllers are likely to emit much more in
small than in large sites.
The following graph, plotting the mean and the eightieth percentile emission factors, shows a clear
downward trend as the number of controllers per site increases. This trend could potentially be explained
by the difference in terms of maintenance practices for small sites (typically unmanned and in remote
area) and larger sites. In the follow-up analysis, a constant emission factor is assumed for both small and
large sites.
3 The data from [3] and [4] have been categorized and presented as described in [8]. The data from [2] have been categorized based on the “company classification into EPA category” (excluding ESD) and not based on the measured emission typology.
0
5
10
15
20
25
30
35
40
Intermittent- vent controllers Low bleed continuous controller High bleed continuous controller Continuous-bleed controllers onexisting sites
All measurements combined
EF
(scfh
/contr
olle
r)
[16] (Subpart W) [3] (Allen et al. 2013) - 305 measurements
[4] (Prasino) - 81 measurements [2] (Allen et al 2015) - 377 measurements
[7] (Carbon Limits) - 7048 measurements [5] (Fort worth)
Central assumption- section 4
Zero emission technologies for pneumatic controllers in the USA 12
Figure 5: Average emission factors depending on the number of controllers per site [2]
3. Zero emission technologies – Description and technical applicability
This section provides an overview of a number of zero emission technologies available as an alternative to
gas driven pneumatic controllers, based primarily on interviews and on a general literature review. A
technology is considered “zero emission” if there is no methane or VOC emissions associated with its
utilization.
3.1 Overview of the zero emission technology presented.
Five different technologies have been reviewed: Electronic controllers, instrument air provided by
compressors (with electric power from the grid or existing on-site generation), solar-powered instrument
air, vent recovery, and self-contained pneumatic controllers. Of these five different zero emission
technologies, two – electronic controllers and instrument air – have reached a reliable level of maturity and
are widely applicable. The remaining three technologies are either less mature (solar-powered instrument)
or are applicable only in certain circumstances (self-contained pneumatic controllers and vent recovery).
The economic feasibility of the two mature and widely applicable technologies, electronic controllers and
instrument air, is evaluated in detail in section 4 of this report.
The following table presents a brief summary of the different technologies evaluated.
Table 2: overview of the zero emission technologies presented
Technology Maturity of the
technology
Technical applicability limitations Main strengths
Electronic
controllers (ref
section 3.2)
The technology has reached a reliable level of maturity, with hundreds of installations identified throughout this study.
Operators interviewed continue to use pneumatic ESDs.
Some limitations with large numbers of controllers or high power demand chemical injection pumps.
• Can operate off grid
• Reduced maintenance costs, in particular compared to wet gas driven controllers
• Enables or simplifies automation of systems
0
5
10
15
20
25
30
35
40
45
1 - 3 cont. 4 - 10 cont. 11 - 20 cont. More than 20 cont.
Em
issio
n p
er
co
ntr
olle
r (s
cfh
)
Mean Percentile 80%
Zero emission technologies for pneumatic controllers in the USA 13
Instrument air
(ref section 3.3)
Extensive global experience for many years
Requires a reliable source of power
Limited to installations with an air compressor > 5 HP
• Reliability
• Reduced maintenance costs, in particular compared to wet gas driven controllers
Solar-powered
Instrument air
(ref section 3.4)
Less than 100 installations identified
Compressor up to ~20 scfh • Operates off grid
• Reduced maintenance costs, in particular compared to wet gas driven controllers
Vent Recovery
(ref section 3.4)
The study identified less
than 100 installations, with
uncertain performance
Requires the presence of a VRU or a
gas engine on site
• Reliability
Self-contained
pneumatic
controllers (aka
“Bleed to Pressure”
or integral
controllers)
(ref section 3.4)
Although this solution has
been deployed since early
2000s and is considered a
relatively well-developed
technology, controllers of
this type are only available
for certain specific
applications
Applicability is limited by a number of
conditions (e.g. pressure differential,
downstream pressure, etc.)
• Low-cost solution
3.2 Electronic controllers (solar powered and grid powered)
Electronic controllers adjust the position of the end-device by sending an electric signal to an electric
actuator or positioner (as compared to pneumatic controllers which send a pneumatic signal to a
pneumatic actuator or positioner). A motor powers the electric actuator to adjust the control valve to the
desired position.
This section provides a description of the benefits, costs, and applicability of electronic controllers to both
new sites and existing sites, where retrofits would be required. The description is based mainly on
interviews with four oil and gas production companies that have installed these systems in their operations
(from 3 to 40 installations per operator interviewed), complemented by interviews with technology
providers.
Description of the technology
Electronic controllers can be installed both at sites connected to the electric grid, and at remote sites
isolated from the grid. These systems typically include a control panel, electric actuators, electronic
controllers, control valves, relevant switches (e.g. pressure, level or temperature switch) and a power
source – connection to the grid, solar panels and batteries, or power generation on site. An electronic
control system is generally designed to completely replace all pneumatically powered devices with
electronic controls (with the exception of ESD, see below).
Electrically powered sites: Electronic controllers can be powered using 120 VAC or 220 VAC input from
the grid or from on-site generation (three-phase power is not needed).
Remote sites: Solar control systems are driven by solar power cells that actuate mechanical devices using
electric power. Systems can be customized for every application; those installed to date include up to
three solar panels and eight batteries [9]. Use of solar-powered chemical injection pumps has become
widespread over the past years.
Zero emission technologies for pneumatic controllers in the USA 14
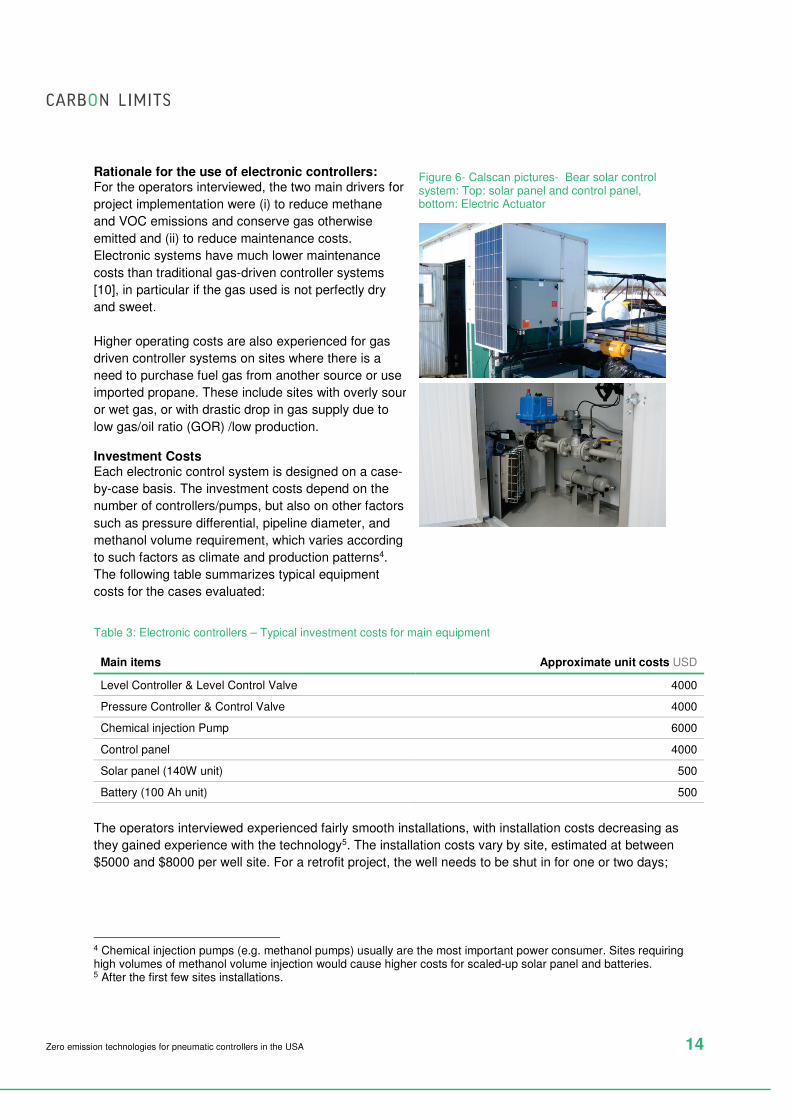
Rationale for the use of electronic controllers: For the operators interviewed, the two main drivers for
project implementation were (i) to reduce methane
and VOC emissions and conserve gas otherwise
emitted and (ii) to reduce maintenance costs.
Electronic systems have much lower maintenance
costs than traditional gas-driven controller systems
[10], in particular if the gas used is not perfectly dry
and sweet.
Higher operating costs are also experienced for gas
driven controller systems on sites where there is a
need to purchase fuel gas from another source or use
imported propane. These include sites with overly sour
or wet gas, or with drastic drop in gas supply due to
low gas/oil ratio (GOR) /low production.
Investment Costs Each electronic control system is designed on a case-
by-case basis. The investment costs depend on the
number of controllers/pumps, but also on other factors
such as pressure differential, pipeline diameter, and
methanol volume requirement, which varies according
to such factors as climate and production patterns4.
The following table summarizes typical equipment
costs for the cases evaluated:
Figure 6- Calscan pictures- Bear solar control system: Top: solar panel and control panel, bottom: Electric Actuator
Table 3: Electronic controllers – Typical investment costs for main equipment
Main items Approximate unit costs USD
Level Controller & Level Control Valve 4000
Pressure Controller & Control Valve 4000
Chemical injection Pump 6000
Control panel 4000
Solar panel (140W unit) 500
Battery (100 Ah unit) 500
The operators interviewed experienced fairly smooth installations, with installation costs decreasing as
they gained experience with the technology5. The installation costs vary by site, estimated at between
$5000 and $8000 per well site. For a retrofit project, the well needs to be shut in for one or two days;
4 Chemical injection pumps (e.g. methanol pumps) usually are the most important power consumer. Sites requiring high volumes of methanol volume injection would cause higher costs for scaled-up solar panel and batteries. 5 After the first few sites installations.
Zero emission technologies for pneumatic controllers in the USA 15
retrofit will generally take place when other maintenance is scheduled, to take advantage of that shut-
down time. Solar powered electric systems do not require back-up generators6.
Maintenance costs
The major maintenance costs include the replacement of batteries and panels. Most batteries last three to
six years, while solar panels last twenty to thirty years. The operators interviewed highlighted that they
experienced minimal maintenance costs on the sites converted to electronic controllers over the last five
years.
Benefits of electronic controllers
Operators highlighted a number of benefits:
• Revenue from the sale of gas: Electronic controllers eliminate methane and VOC emissions and
thus increase the volume of gas available for sale.
• Automation: Electronic control systems can provide additional benefits by enabling or simplifying
the installation of automation systems (SCADA, Supervisory Control and Data Acquisition), though
these systems are not required in order to use electronic controllers. This can potentially reduce
the need for site inspections, reducing those costs for operators. For example, an alarm can be
programmed to warn the operator if the dump has been open for more than 10 min. The system
can be as sophisticated or as simple as required. (Note that we have not included any estimate of
these cost reductions in the calculations of cost-effectiveness discussed in Section 4.)
• Reliability: As highlighted above, operators report that the electronic system is more reliable than a
gas driven pneumatic control system, as operation of the latter with even slightly wet gas can lead
to condensation issues, which over time will impact the performance of the system. One operator
reported corrosion issues with sour gas used for pneumatic controllers and pumps.
Technical challenges with electronic controllers
• Snow: One operator reported that snow can be a problem with solar panel and battery lifetime.
• Theft or damage: Solar panels have reportedly been stolen or used as targets for shooting.
• Chemical injection pumps: Pumps consume far more energy than controllers/actuators. Sites with
a large number of pumps or with pumps with high energy or power demand may represent a
challenge for 100% solar powered electric systems. In addition, shortly after completion, some
wells may require high volumes of methanol injection, and powering pumps to inject this high
volume can strain these systems. Some of the operators interviewed reported that this technical
barrier can be solved by bringing a portable stand-alone generator to the site for a few weeks to
ensure that the power requirement is met.
• Safety considerations: Due to the very low voltage of the system, the safety risks are considered
acceptable by the operator who evaluated this risk.
Applicability of electronic controllers
According to interviews with operators, this solution can technically be implemented on any well site.
Generally, for the sites with these systems in place, the pressure differential is up to 2000 psi and the pipe
diameters are between 2- 3 inches, but the system can be designed for larger pressure drops and larger
diameters as required.
6 When properly designed (e.g. with sufficient reserve margin in the batteries), recent solar powered electric systems do not require back-up generators, due to the reduced cost of solar-panels and the availability of low-power components. These systems are routinely installed without back-up generators in North America, including in Northern Canada where in winter there is only 1 to 2 hours of full sunlight a day. [9]
Zero emission technologies for pneumatic controllers in the USA 16
The only general limitation is the incremental costs. According to the operators, given the current gas
prices, implementation costs are not compensated by the value of the gas saved. The project can be
economical when other factors such as lower maintenance costs improve the return on investment.
Note on Emergency Shut-Down Valves (ESD): As a rule, electric controllers/actuators will stay in position
if the system fails and power is lost, wires are cut, or other failures occur. This differs from some other
solutions that can be designed so that valves close (or open) if the system fails (for example if the supply
gas pressure is lost). Although Calscan is developing a “fail safe” electric ESD, operators have reportedly
been using pneumatic or hydraulic ESD valves, as they are “fail-safe”.
Sunlight: In northern latitudes (e.g. northern Alberta) and when the energy demand is high (e.g. several
pumps), solar panels may not generate enough power, in particular for chemical injection pumps. Other
power sources such as thermal electric generators or methanol fuel cells have been used in pilot
implementations.
Electronic controllers at medium and large sites: Due to the market conditions, providers have so far
focused mainly on the development of solutions for small sites in remote locations. There thus seems to
be much less field experience with using electronic controllers at medium and large sites. No technical
barriers were identified for the installation of electronic controllers in sites with available electricity. Given
the recent progress in both solar panel technologies and large battery solutions, solar-powered solutions
may also be appropriate for large sites without available power. However, we are not aware of any such
installations. Therefore, to be conservative, we do not examine the use of electronic controllers at large
sites without electricity available.
Medium or large sites may also be the result of a combination of a number of small sites (e.g. several well
pads). In practice, several small independent electronic controller installations can thus be installed on one
medium to large site.
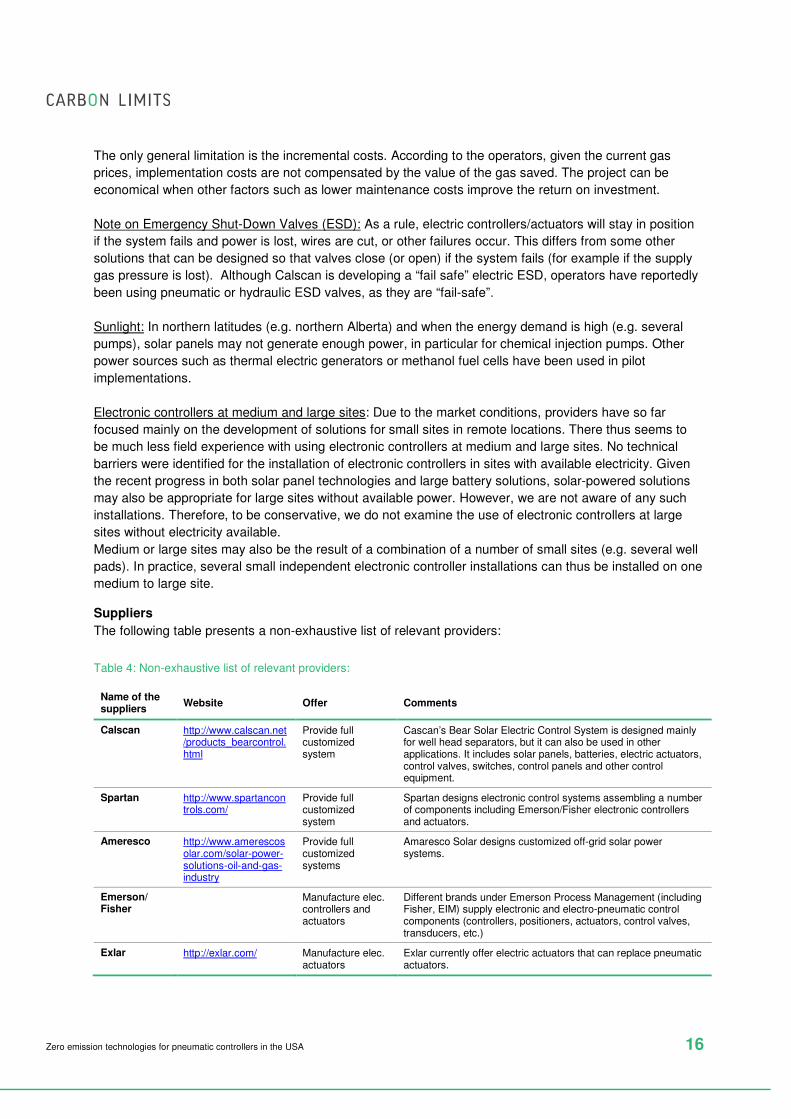
Suppliers
The following table presents a non-exhaustive list of relevant providers:
Table 4: Non-exhaustive list of relevant providers:
Name of the suppliers
Website Offer Comments
Calscan http://www.calscan.net/products_bearcontrol.html
Provide full customized system
Cascan’s Bear Solar Electric Control System is designed mainly for well head separators, but it can also be used in other applications. It includes solar panels, batteries, electric actuators, control valves, switches, control panels and other control equipment.
Spartan http://www.spartancontrols.com/
Provide full customized system
Spartan designs electronic control systems assembling a number of components including Emerson/Fisher electronic controllers and actuators.
Ameresco http://www.amerescosolar.com/solar-power-solutions-oil-and-gas-industry
Provide full customized systems
Amaresco Solar designs customized off-grid solar power systems.
Emerson/ Fisher
Manufacture elec. controllers and actuators
Different brands under Emerson Process Management (including Fisher, EIM) supply electronic and electro-pneumatic control components (controllers, positioners, actuators, control valves, transducers, etc.)
Exlar http://exlar.com/ Manufacture elec. actuators
Exlar currently offer electric actuators that can replace pneumatic actuators.
Zero emission technologies for pneumatic controllers in the USA 17
3.3 Instrument air
Instrument air controllers are systems where pressurized natural gas is replaced with compressed air as a
source of energy and signaling medium for pneumatic controllers and pneumatic actuators. Since
controllers use air, instead of natural gas, they only vent air to the atmosphere, eliminating emissions from
pneumatic controllers. Instrument air controllers are applicable to both new sites and existing sites;
however, the technology can only be implemented when a reliable power supply is available.
This section provides a description of the benefits, the costs, and the applicability of instrument air
controllers and is mainly based on interviews with oil companies, reviewing their recent experience
installing instrument air systems.
Description of the technology
Instrument air technology is a well-established mature solution to run pneumatic control systems and is
widely applied globally. In many countries (e.g. Norway, Iran, Kazakhstan [11]), the majority of the
pneumatic control systems run on instrument air.
Systems typically include:
• Heavy-duty industrial air compressors. Two compressors are generally installed for redundancy,
but for cost reasons, an operator has reported using only one.
• Air dryers - part of the air compressor package.
• Wet air receiver tank - part of the air compressor package.
• Dry air receiver tank - helps provide a buffer to secure longer system autonomy in the event of a
power outage or demand surge.
Investment costs
Interviewers highlighted that the investment costs for instrument air installation vary significantly from site
to site, depending on the layout and the type of equipment already on site. Investment costs can be
classified as follows:
• Air compressor package: This includes the purchase of the main equipment (compressors, dryers
and air receiver tanks). The size of compressors, dryers, and other equipment depends on the
number of pneumatic controllers to be supplied with compressed air, and on their specifications
(i.e., their demand for compressed air). A small compressor station would require around 5 HP of
air compression capacity, while a larger facility would require up to 20 HP. This system can be
purchased as individual components or as a package, for between $20,000 and $70,000 [12].
• Mechanical & installation costs: Mechanical and civil work may be required, depending on the
layout of the existing facility. These costs are often higher for older facilities and can include:
o Pipe cleaning and upgrades.
o Trenching and tubing installation, since large sites may have several independent natural
gas supply systems for controllers and pumps, and air would need to be piped through
the full site.
• Electrical/instrumentation equipment and supplies: Depending on the site and the specific project
requirement, this category may include:
o Remote terminal unit or SCADA system installation or upgrade. The control system for
some plants (e.g. shutdown/start-up, safety systems etc.) may have to be upgraded to
accommodate the air compressor package.
o Upgrades and wiring needed to add the additional electrical loads from the air
compressor motors.
o Repair/replacement of a controller in case of malfunctioning controller.
• Engineering/consulting: The site might require additional expenditures for electrical engineering
and consulting.
Zero emission technologies for pneumatic controllers in the USA 18
Although air compressors and their auxiliary equipment represent a large part of the CAPEX, the
engineering, preparation and installation costs can comprise up to 70% of the total upfront investment.
Installation and preparation costs may include electrical and instrumentation supplies, mechanical and civil
works, additional wiring, piping, valves and fittings. These costs are higher for older facilities that are not
capable of handling the extra power, or don’t have a suitable layout for utilities. Overall, the total cost for a
project varies between $50,000 and $250,000 [10].
Maintenance costs
Maintenance costs typically include:
• Power consumption
• Air compressor servicing, generally every 6 months.
Benefits of instrument air controllers
Operators highlight a number of benefits:
• Revenue from the sale of gas: Instrument air eliminates methane and VOC emissions and thus
increases the volume of gas available for sale.
• Reliability: The instrument air system is a highly reliable alternative to a natural gas driven
pneumatic system for grid-connected facilities.
• Reduced maintenance costs: Although there are some additional operating costs with the
deployment of air systems, some maintenance expenses are cut as a result of stopping the use of
natural gas, particularly wellhead gas (or separator gas). Due to fluctuations in the GOR, some
operators reported gas shortages on-site and thus they had to use other sources, such as
propane, or to purchase gas from an adjacent field. Maintenance costs due to liquids condensing
in the system or sour gas damage are also avoided by replacing untreated natural gas with air.
Applicability of instrument air controllers
Two main applicability limitations were identified during the interviews:
Size of the installation:
Instrument air controllers require heavy duty industrial air compressor packages designed for continuous
duty (24/7). This in effect precludes the use of air compressors smaller than 5 HP, since available 2-3 HP
air compressor packages present reliability problems. One operator reported that the one-year lifetime of a
smaller compressors makes them unacceptable, so a minimum of 5 HP is assumed.
Access to power
Instrument air systems may only be used in locations with access to a sufficient and consistent supply of
electrical power. Operators have used instrument air at:
• Grid connected sites.
• Sites with onsite power generation. Many sites (e.g. compressor plants) have power generation for
other purposes: lighting, automation and control systems, etc. The same system can also be used
for instrument air if generation capacity is available. We note that a sufficient, reliable, good
quality gas stream is required for power generation. Wet or sour gas may not always be used for
on-site power generation, depending on the specification of generator engines, etc.
In theory, diesel powered instrument air could be installed; however, this project identified no concrete
examples of this technology. One operator stated he considered, and then rejected, the use of diesel to
run air compressors, due to the high costs and low perceived environmental benefits.
Zero emission technologies for pneumatic controllers in the USA 19
3.4 Other technologies
This section reviews other “zero emission” technologies at various stages of maturity. In general these
technical options are either (i) not widely applicable (such as self-contained controllers and vent gas
recovery) or (ii) fewer than 100 installations were identified as part of this project (such as solar powered
instrument air).
Solar powered instrument air
This study identified about 40 installations of small, energy efficient motor-compressors powered by solar
panels/batteries, to replace natural gas with instrument air as the pneumatic medium. TRIDO industries,
the technology provider interviewed as part of this study, indicated that these systems have a maximum
capacity of ~20 scfh, making them suitable for some small to medium sites which use a few low-emitting
controllers. High-bleed controllers have to be retrofitted to reduce air consumption in order to reach the
feasible level. Despite the lack of extensive deployment so far, an attraction of this solution lies in the fact
that controllers and actuators do not need to be replaced.
Instrument air powered by other power sources
Other power sources, such as thermal electric generators or methanol fuel cells, have been used in pilot
implementations to power traditional instrument air systems.
Vent Gas Recovery
Re-routing to VRU
Vapor Recovery Units (VRUs) have a long, well-established track record in the upstream oil and gas
industry to recover VOCs and methane from vented sources. Typically, they consist of capturing and
piping equipment, a de-liquefaction drum, and compressor(s) to inject the recovered gas into pipelines. In
theory, all vent lines can be connected to the VRU, including pneumatic controllers’ lines.
Nevertheless, there have been limited implementations (only one example identified in this study) of well-
site vent gas recovery projects using the recovered gas from pneumatic controllers in non-engine
applications. SlipStream®, as further presented below, is a technology that facilitates recovery of the gas
and use of it in gas-fired engines. Another technology, Cata-Dyne™, utilizes the recovered gas as a feed
to a small, flameless appliance that converts natural gas or propane into infrared radiant heat that is
usable if industrial heating is required.
SlipStream®
Spartan’s SlipStream® system captures vented hydrocarbons and uses them as a supplementary fuel
source for natural gas-fired engines, reducing fuel consumption. This technology can thus be applied only
to sites with gas-fired engines, e.g. compressor engines. Despite concerns about costs, one operator
emphasized specifically the reliability of the technology, as it reportedly does not interfere with normal
operations. Nevertheless, if the volume of gas emitted by the combined vents (including the controllers)
exceeds the engine fuel requirements, natural gas would still be vented or otherwise controlled.
Self-contained (aka Bleed-to-Pressure or Integral Pneumatic Controllers)
Self-contained systems are designed to contain the gas typically vented from controllers and then
discharge it to the control valve’s downstream piping, thus resulting in zero emission.
A number of operational requirements limit the applicability of self-contained systems, the most important
of which is the need for a high differential pressure across the control valve [6,13]. For instance, GE’s
Bleed-to-Pressure system requires more than 80 psi, and both GE and VRG Controls require a
downstream pressure of maximum 300 psi [13]. Also, sour or untreated gas could cause disturbances in
Zero emission technologies for pneumatic controllers in the USA 20
the operation of self-contained controllers. Nevertheless, if applicable, the technology may be cost-
effective or economical in cases where the total baseline emissions are high.7
Due to the limited applicability or the lack of widespread field experience, the technologies described
above are not further analyzed in this report. However, depending on the site specifics, these options may
be applicable and cost-effective, and can represent useful alternatives to instrument air or electronic
controllers; thus they are presented as potential alternative options in section 4.4.
4. Cost effectiveness of electronic controllers and instrument air
This section presents an analysis of the cost-effectiveness – net cost in USD per ton of avoided pollution –
of employing the two main zero emission technologies, air-driven pneumatic controllers and electronic
controllers, instead of natural gas-driven pneumatic controllers at new and existing sites. These results are
applicable at both oil and gas production sites (well pads) and compressor stations.
4.1 Analytical approach
The cost-effectiveness of zero emission technologies will vary with the number and type of controllers at a
site, in addition to many other factors, as we discuss below. Given the variety of site configurations
(number and type of controllers per site, connection to the grid, type of gas handled) across the US, and
the lack of information on the frequency of occurrence of these configurations, we opted to carry out cost-
effectiveness assessments for both electronic and instrument air controllers for a broad spectrum of
permutations of those site configuration parameters.
A number of assumptions have been made for the analysis. Key assumptions are discussed in the section
below; all assumptions are detailed in the Appendix.
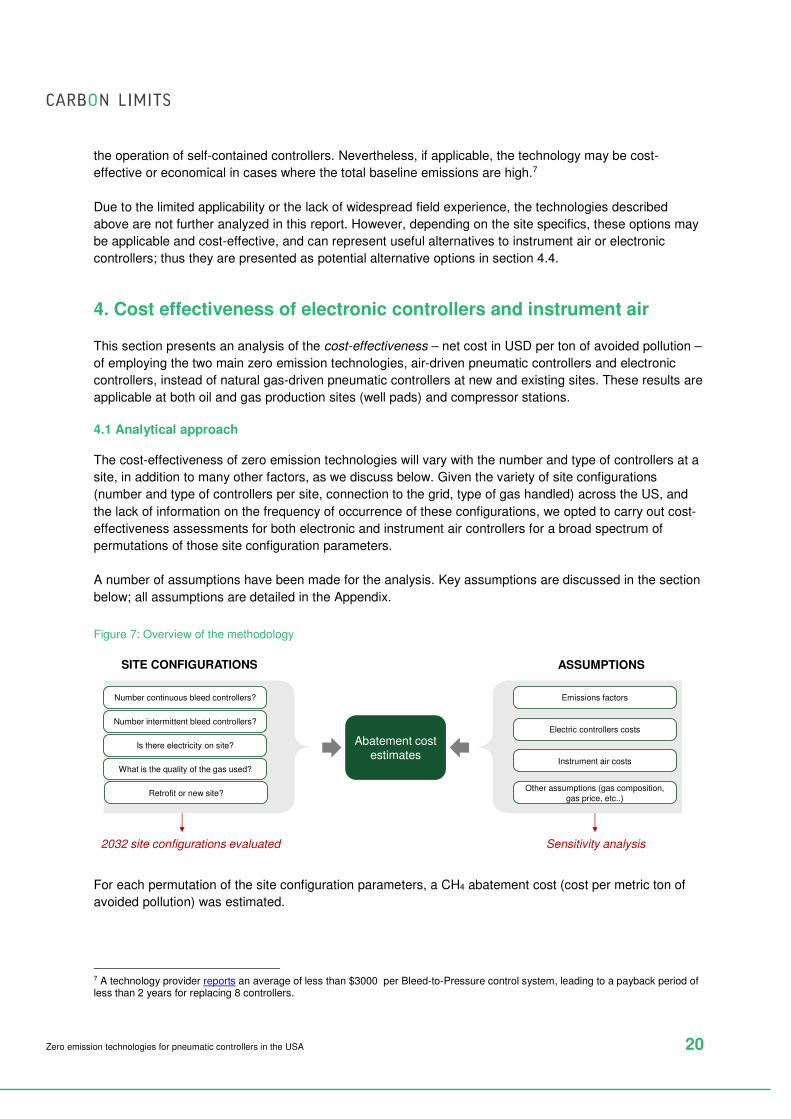
Figure 7: Overview of the methodology
For each permutation of the site configuration parameters, a CH4 abatement cost (cost per metric ton of
avoided pollution) was estimated.
7 A technology provider reports an average of less than $3000 per Bleed-to-Pressure control system, leading to a payback period of less than 2 years for replacing 8 controllers.
Emissions factors
Electric controllers costs
Instrument air costs
ASSUMPTIONSSITE CONFIGURATIONS
Abatement cost estimates
Other assumptions (gas composition, gas price, etc..)
Number continuous bleed controllers?
Retrofit or new site?
Number intermittent bleed controllers?
Is there electricity on site?
What is the quality of the gas used?
Sensitivity analysis2032 site configurations evaluated
Zero emission technologies for pneumatic controllers in the USA 21
For this analysis, a zero emission technology implementation is considered • “economical” if the CH4 abatement cost is negative (i.e. if the project NPV is positive) • “cost effective” if the CH4 abatement cost (net cost per ton of abated pollution) is lower than
the social cost of methane that EPA has used in recent regulatory analyses [19] (Social cost of methane for 2020, calculated with a 3% discount rate, $1354 (2016 USD). 8
The following sections provide more insight on:
• The abatement cost calculation
• The main assumptions
• The site configurations evaluated.
Abatement cost calculation – methodology
For each site configuration, the following were estimated:
• The CAPEX and OPEX of the zero emission technology implementation (either electronic
controllers or instrument air)
• The CAPEX and OPEX of the baseline scenario (i.e. the cost incurred by the operator if the
conventional pneumatic technology had been used instead of zero emission systems)
• The emissions of CH4 and VOC under the baseline scenario
Since methane and VOC emissions will be zero if the zero emission technology is used, the abatement
cost (in $/t CH4) is then estimated as follows:
����������� = −���(���ℎ������������������ �!" − ���ℎ���#$��%����!$�����)
���('�(��(�#$��%����!$�����)
This approach, and its underlying assumptions, is compared to the annualized cost approach typically
used by EPA in the appendix.
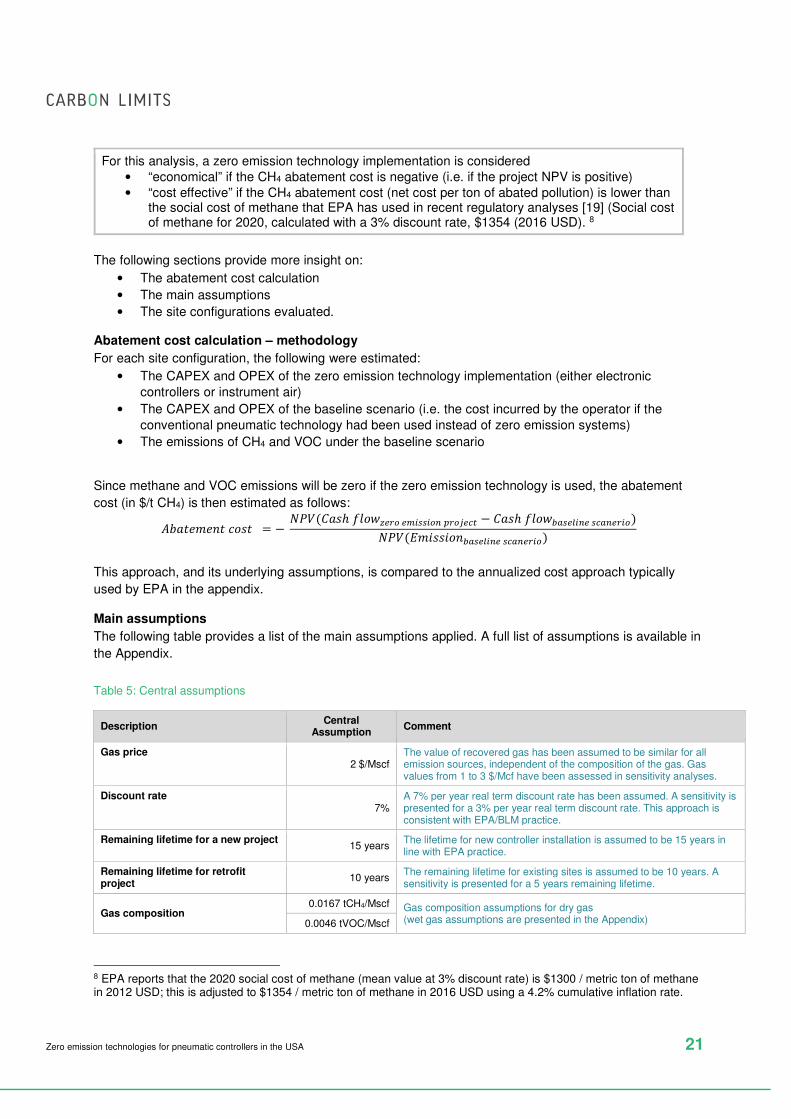
Main assumptions
The following table provides a list of the main assumptions applied. A full list of assumptions is available in
the Appendix.
Table 5: Central assumptions
Description Central
Assumption Comment
Gas price 2 $/Mscf
The value of recovered gas has been assumed to be similar for all emission sources, independent of the composition of the gas. Gas values from 1 to 3 $/Mcf have been assessed in sensitivity analyses.
Discount rate 7%
A 7% per year real term discount rate has been assumed. A sensitivity is presented for a 3% per year real term discount rate. This approach is consistent with EPA/BLM practice.
Remaining lifetime for a new project 15 years
The lifetime for new controller installation is assumed to be 15 years in line with EPA practice.
Remaining lifetime for retrofit project
10 years The remaining lifetime for existing sites is assumed to be 10 years. A sensitivity is presented for a 5 years remaining lifetime.
Gas composition 0.0167 tCH4/Mscf Gas composition assumptions for dry gas
(wet gas assumptions are presented in the Appendix) 0.0046 tVOC/Mscf
8 EPA reports that the 2020 social cost of methane (mean value at 3% discount rate) is $1300 / metric ton of methane in 2012 USD; this is adjusted to $1354 / metric ton of methane in 2016 USD using a 4.2% cumulative inflation rate.
Zero emission technologies for pneumatic controllers in the USA 22
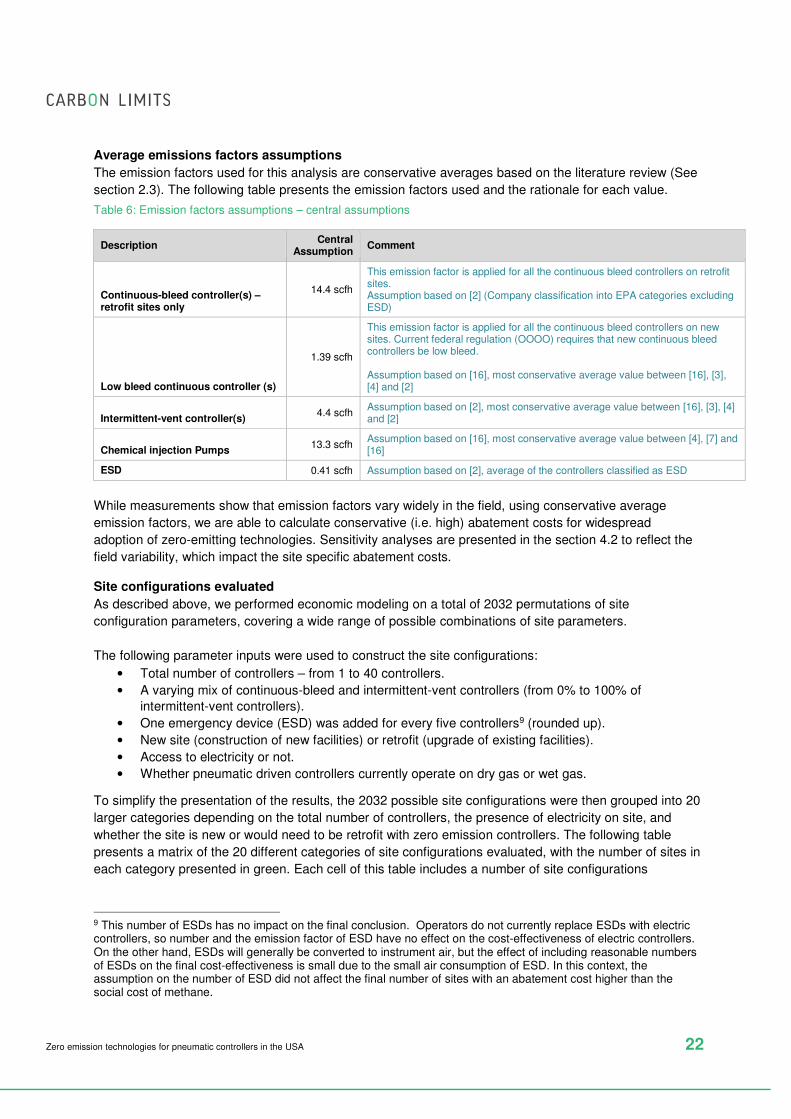
Average emissions factors assumptions
The emission factors used for this analysis are conservative averages based on the literature review (See
section 2.3). The following table presents the emission factors used and the rationale for each value.
Table 6: Emission factors assumptions – central assumptions
Description Central
Assumption Comment
Continuous-bleed controller(s) – retrofit sites only
14.4 scfh
This emission factor is applied for all the continuous bleed controllers on retrofit sites. Assumption based on [2] (Company classification into EPA categories excluding ESD)
Low bleed continuous controller (s)
1.39 scfh
This emission factor is applied for all the continuous bleed controllers on new sites. Current federal regulation (OOOO) requires that new continuous bleed controllers be low bleed. Assumption based on [16], most conservative average value between [16], [3], [4] and [2]
Intermittent-vent controller(s) 4.4 scfh
Assumption based on [2], most conservative average value between [16], [3], [4] and [2]
Chemical injection Pumps 13.3 scfh
Assumption based on [16], most conservative average value between [4], [7] and [16]
ESD 0.41 scfh Assumption based on [2], average of the controllers classified as ESD
While measurements show that emission factors vary widely in the field, using conservative average
emission factors, we are able to calculate conservative (i.e. high) abatement costs for widespread
adoption of zero-emitting technologies. Sensitivity analyses are presented in the section 4.2 to reflect the
field variability, which impact the site specific abatement costs.
Site configurations evaluated
As described above, we performed economic modeling on a total of 2032 permutations of site
configuration parameters, covering a wide range of possible combinations of site parameters.
The following parameter inputs were used to construct the site configurations:
• Total number of controllers – from 1 to 40 controllers.
• A varying mix of continuous-bleed and intermittent-vent controllers (from 0% to 100% of
intermittent-vent controllers).
• One emergency device (ESD) was added for every five controllers9 (rounded up).
• New site (construction of new facilities) or retrofit (upgrade of existing facilities).
• Access to electricity or not.
• Whether pneumatic driven controllers currently operate on dry gas or wet gas.
To simplify the presentation of the results, the 2032 possible site configurations were then grouped into 20
larger categories depending on the total number of controllers, the presence of electricity on site, and
whether the site is new or would need to be retrofit with zero emission controllers. The following table
presents a matrix of the 20 different categories of site configurations evaluated, with the number of sites in
each category presented in green. Each cell of this table includes a number of site configurations
9 This number of ESDs has no impact on the final conclusion. Operators do not currently replace ESDs with electric controllers, so number and the emission factor of ESD have no effect on the cost-effectiveness of electric controllers. On the other hand, ESDs will generally be converted to instrument air, but the effect of including reasonable numbers of ESDs on the final cost-effectiveness is small due to the small air consumption of ESD. In this context, the assumption on the number of ESD did not affect the final number of sites with an abatement cost higher than the social cost of methane.
Zero emission technologies for pneumatic controllers in the USA 23
depending on the number of intermittent-vent or continuous-bleed controllers and the type of gas used to
power the controllers.
Table 7: Site configurations categories (number of site configurations presented in green)
* Based on the analysis presented in section 3, we did not model either technology for larger sites (≥21 controller excluding ESD)
without electricity on-site
• Electronic controllers were modeled at sites of all sizes with electricity available, and smaller to
medium sites (up to 20 controllers) with no electricity available. Medium and large sites with
electricity on-site are presented, as no technical barriers were identified for the installation of
electronic controllers in such installations. However, there seems to be much less field experience
for these types of installations compared to smaller sites.
• Instrument air was presented at larger sites with electricity available. For sites smaller than 20
controllers, electronic controllers were always more cost efficient than instrument air (see below).
This approach reflects the current industry experience and practice as presented by the interviewees. It is,
however, important to highlight that the threshold in terms of number of controllers (20 in the analysis),
depends in reality on site-specific parameters, and should only be considered as an illustrative threshold
based on information available.
4.2 Main findings – electronic controllers
The findings of the cost-benefit analysis for electronic controllers are presented in four different sections:
• First, the full cost-benefit analysis is presented for one site configuration, to illustrate the
methodology by exploring one example in detail.
• Second, a sensitivity analysis is performed for the same site configuration to show the impact of
the main assumptions.
• An overview of the results for all the site configurations evaluated is then presented.
• Finally, the impact of the emission factors assumptions is described.
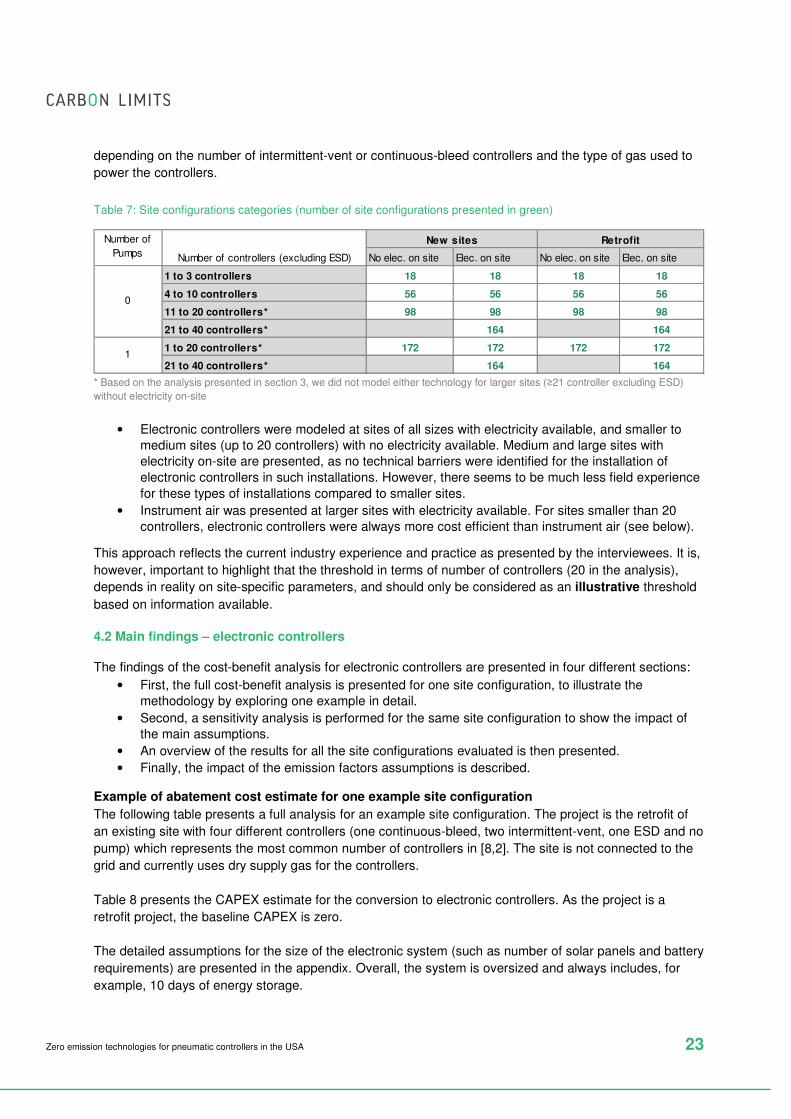
Example of abatement cost estimate for one example site configuration
The following table presents a full analysis for an example site configuration. The project is the retrofit of
an existing site with four different controllers (one continuous-bleed, two intermittent-vent, one ESD and no
pump) which represents the most common number of controllers in [8,2]. The site is not connected to the
grid and currently uses dry supply gas for the controllers.
Table 8 presents the CAPEX estimate for the conversion to electronic controllers. As the project is a
retrofit project, the baseline CAPEX is zero.
The detailed assumptions for the size of the electronic system (such as number of solar panels and battery
requirements) are presented in the appendix. Overall, the system is oversized and always includes, for
example, 10 days of energy storage.
No elec. on site Elec. on site No elec. on site Elec. on site
1 to 3 controllers 18 18 18 18
4 to 10 controllers 56 56 56 56
11 to 20 controllers* 98 98 98 98
21 to 40 controllers* 164 164
1 to 20 controllers* 172 172 172 172
21 to 40 controllers* 164 164
0
1
Number of
Pumps Number of controllers (excluding ESD)
New sites Retrofit
Zero emission technologies for pneumatic controllers in the USA 24
Table 8: CAPEX estimates for electronic controller implementation (central assumptions)
Item Assumption # Total USD
Controllers $ 4000/unit 3 12 000
Control Panel $ 4000/unit 1 4 000
140 W Solar Panel
$500 /Unit 1 500
100 Amh battery
$400 /Unit 3 1 200
Installation and
engineering costs
20% of equipment
costs NA 3 540
Total CAPEX 21 240
Table 9: Emissions estimates (central assumptions, new sites)
Whole gas emissions in scfh EF
assumption # Total
Intermittent – vent controllers 4.43 2 8.9
Continuous –bleed controller 14.4 1 14.4
Total gas emissions 23.3
In terms of OPEX, it is assumed that batteries are replaced every 4 years and solar panels every 10 years.
Given the operators’ reports of minimal maintenance for electronic controllers, it has thus been assumed,
conservatively, that general maintenance costs for are similar to those for continuous-bleed controllers
functioning properly10. We do not include any estimate of savings in inspection costs due to automation
(conservative assumption). Table 9 above presents emission estimates for the baseline scenario and
finally Table 10 includes the abatement costs estimated.
Table 10: Final results – central assumptions
Item Unit Value USD
CAPEX $ 21 240
Value of the gas saved $/year 408
NPV of the OPEX $ 1 672
NPV $ -19 266
ABATEMENT COSTS $/tCH4 751
As presented in Table 10, for the small and remote site configuration presented, the abatement costs is
well below the social cost of methane as defined above. The abatement cost for same site configuration,
but at a new facility, as opposed to a retrofit, is estimated to be $847/ton CH4. The difference is due to the
difference in baseline costs and baseline emissions between new and retrofit sites (see below).
10 Which is lower than the maintenance costs for continuous bleed controllers operating with wet supply gas.
Zero emission technologies for pneumatic controllers in the USA 25
Info Box 1: Electric conversion of pneumatic pumps
Pumps at well sites and well pads are typically used for methanol, corrosion inhibitor, de-waxing agents, or soap injection. Federal regulation (OOOOa) rules already require that emissions from new and modified chemical injection pumps be controlled in a number of circumstances.
As highlighted in Section 3, conversion of chemical injection pumps to electric is both a mature and a cost effective technology.
In the analysis presented in this section, the conversion of one chemical injection pump per site is presented as a potential added benefit for the project developer. In cases with many pumps, or of major energy requirements for the pumps, the conversion of pumps to zero emission technologies could be assessed as a separate emission reduction project.
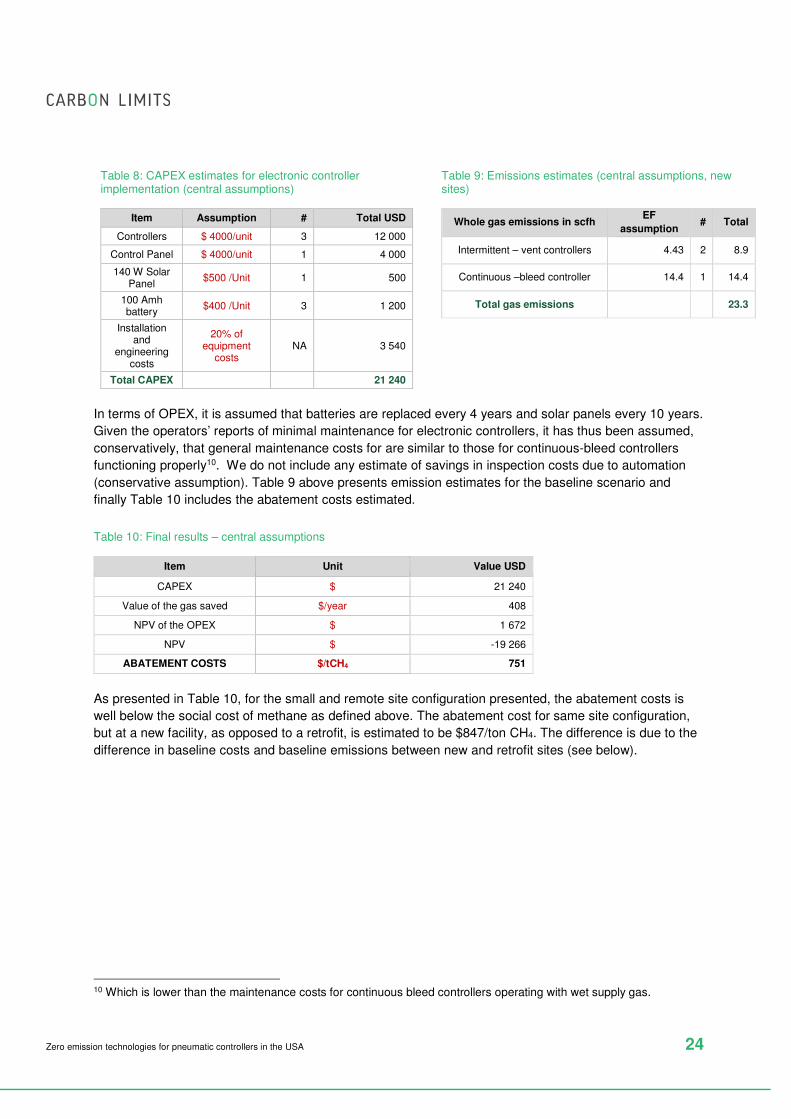
Sensitivity analysis for one example site configuration
In this analysis, a number of assumptions have been made which impact the abatement cost. The
following figures present sensitivity analyses for the site configuration described in the previous section, for
both the retrofit case and the new site case. We examine the sensitivity of the abatement cost to changes
to a few key sensitivities. A more exhaustive sensitivity analysis is presented in the appendix.
Figure 8: sensitivity analysis – electronic controllers - retrofit
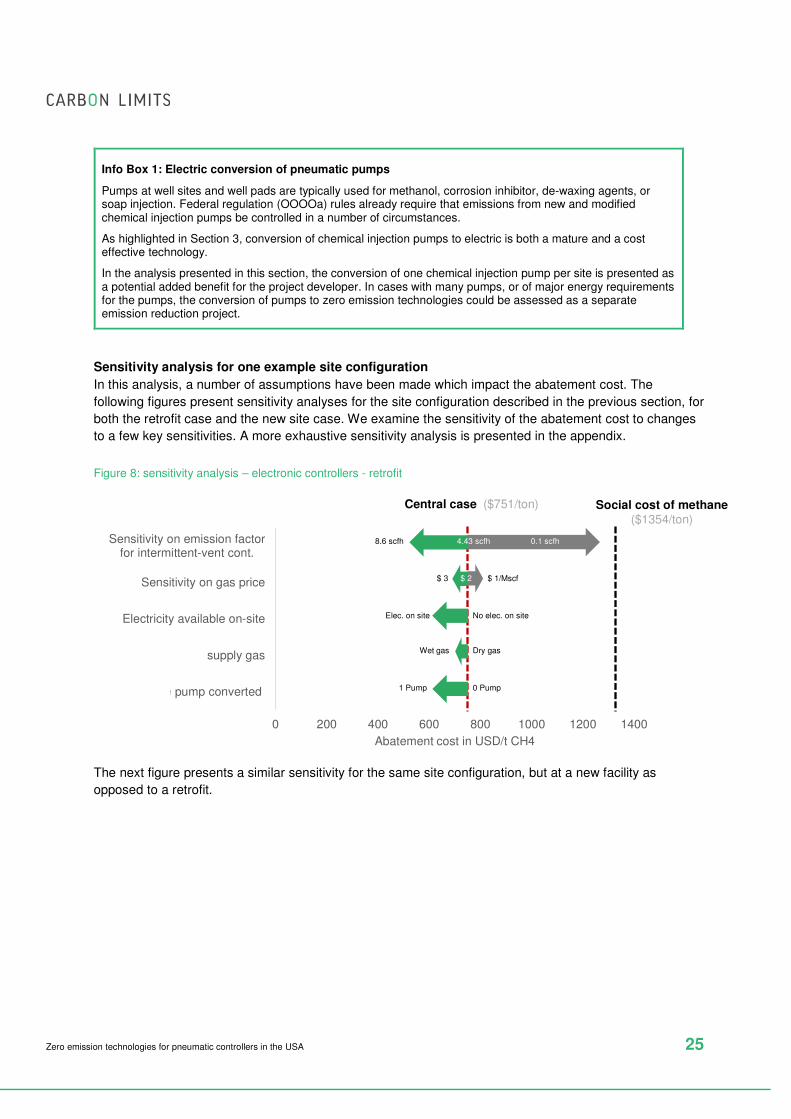
The next figure presents a similar sensitivity for the same site configuration, but at a new facility as
opposed to a retrofit.
0 200 400 600 800 1000 1200 1400
One pump converted
Wet supply gas
Electricity available on-site
Sensitivity on gas price
Sensitivity on emission factorfor intermittent-vent cont.
Abatement cost in USD/t CH4
8.6 scfh
$ 3 $ 1/Mscf
Social cost of methane($1354/ton)
Central case ($751/ton)
4.43 scfh
$ 2
No elec. on siteElec. on site
Dry gasWet gas
0 Pump1 Pump
0.1 scfh4.43 scfh
$ 2
Zero emission technologies for pneumatic controllers in the USA 26
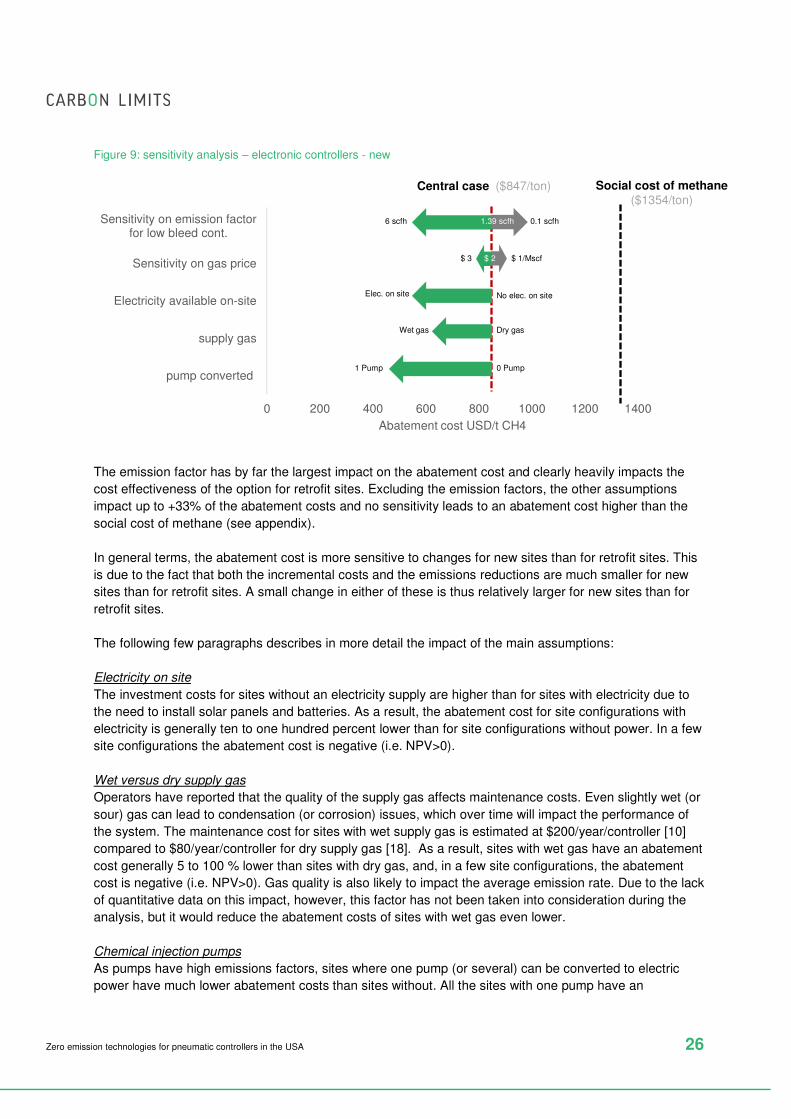
Figure 9: sensitivity analysis – electronic controllers - new
The emission factor has by far the largest impact on the abatement cost and clearly heavily impacts the
cost effectiveness of the option for retrofit sites. Excluding the emission factors, the other assumptions
impact up to +33% of the abatement costs and no sensitivity leads to an abatement cost higher than the
social cost of methane (see appendix).
In general terms, the abatement cost is more sensitive to changes for new sites than for retrofit sites. This
is due to the fact that both the incremental costs and the emissions reductions are much smaller for new
sites than for retrofit sites. A small change in either of these is thus relatively larger for new sites than for
retrofit sites.
The following few paragraphs describes in more detail the impact of the main assumptions:
Electricity on site
The investment costs for sites without an electricity supply are higher than for sites with electricity due to
the need to install solar panels and batteries. As a result, the abatement cost for site configurations with
electricity is generally ten to one hundred percent lower than for site configurations without power. In a few
site configurations the abatement cost is negative (i.e. NPV>0).
Wet versus dry supply gas
Operators have reported that the quality of the supply gas affects maintenance costs. Even slightly wet (or
sour) gas can lead to condensation (or corrosion) issues, which over time will impact the performance of
the system. The maintenance cost for sites with wet supply gas is estimated at $200/year/controller [10]
compared to $80/year/controller for dry supply gas [18]. As a result, sites with wet gas have an abatement
cost generally 5 to 100 % lower than sites with dry gas, and, in a few site configurations, the abatement
cost is negative (i.e. NPV>0). Gas quality is also likely to impact the average emission rate. Due to the lack
of quantitative data on this impact, however, this factor has not been taken into consideration during the
analysis, but it would reduce the abatement costs of sites with wet gas even lower.
Chemical injection pumps
As pumps have high emissions factors, sites where one pump (or several) can be converted to electric
power have much lower abatement costs than sites without. All the sites with one pump have an
0 200 400 600 800 1000 1200 1400
One pump converted
Wet supply gas
Electricity available on-site
Sensitivity on gas price
Sensitivity on emission factorfor low bleed cont.
Abatement cost USD/t CH4
Central case ($847/ton)
$ 3 $ 1/Mscf
4.43 scfh
$ 2
No elec. on site
Dry gasWet gas
0 Pump
$ 2
6 scfh 0.1 scfh1.39 scfh
Elec. on site
1 Pump
Wet gas
Social cost of methane($1354/ton)
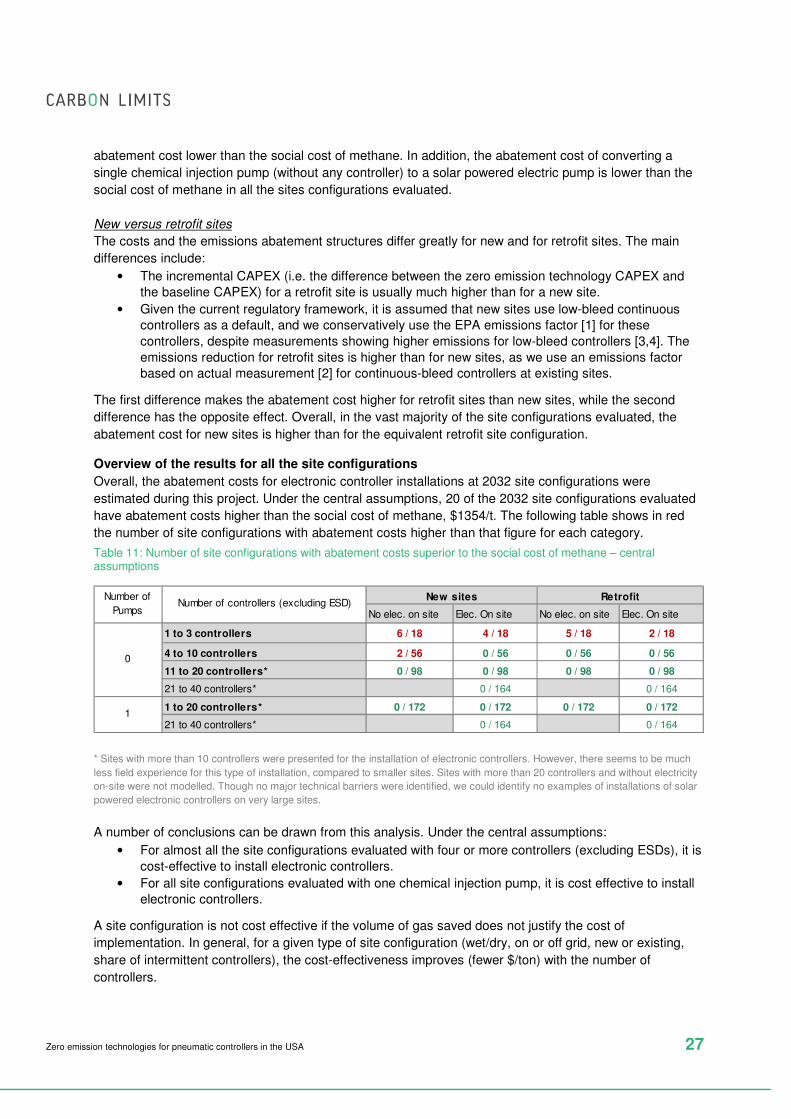
Zero emission technologies for pneumatic controllers in the USA 27
abatement cost lower than the social cost of methane. In addition, the abatement cost of converting a
single chemical injection pump (without any controller) to a solar powered electric pump is lower than the
social cost of methane in all the sites configurations evaluated.
New versus retrofit sites
The costs and the emissions abatement structures differ greatly for new and for retrofit sites. The main
differences include:
• The incremental CAPEX (i.e. the difference between the zero emission technology CAPEX and
the baseline CAPEX) for a retrofit site is usually much higher than for a new site.
• Given the current regulatory framework, it is assumed that new sites use low-bleed continuous
controllers as a default, and we conservatively use the EPA emissions factor [1] for these
controllers, despite measurements showing higher emissions for low-bleed controllers [3,4]. The
emissions reduction for retrofit sites is higher than for new sites, as we use an emissions factor
based on actual measurement [2] for continuous-bleed controllers at existing sites.
The first difference makes the abatement cost higher for retrofit sites than new sites, while the second
difference has the opposite effect. Overall, in the vast majority of the site configurations evaluated, the
abatement cost for new sites is higher than for the equivalent retrofit site configuration.
Overview of the results for all the site configurations
Overall, the abatement costs for electronic controller installations at 2032 site configurations were
estimated during this project. Under the central assumptions, 20 of the 2032 site configurations evaluated
have abatement costs higher than the social cost of methane, $1354/t. The following table shows in red
the number of site configurations with abatement costs higher than that figure for each category.
Table 11: Number of site configurations with abatement costs superior to the social cost of methane – central assumptions
* Sites with more than 10 controllers were presented for the installation of electronic controllers. However, there seems to be much
less field experience for this type of installation, compared to smaller sites. Sites with more than 20 controllers and without electricity
on-site were not modelled. Though no major technical barriers were identified, we could identify no examples of installations of solar
powered electronic controllers on very large sites.
A number of conclusions can be drawn from this analysis. Under the central assumptions:
• For almost all the site configurations evaluated with four or more controllers (excluding ESDs), it is
cost-effective to install electronic controllers.
• For all site configurations evaluated with one chemical injection pump, it is cost effective to install
electronic controllers.
A site configuration is not cost effective if the volume of gas saved does not justify the cost of
implementation. In general, for a given type of site configuration (wet/dry, on or off grid, new or existing,
share of intermittent controllers), the cost-effectiveness improves (fewer $/ton) with the number of
controllers.
No elec. on site Elec. On site No elec. on site Elec. On site
1 to 3 controllers 6 / 18 4 / 18 5 / 18 2 / 18
4 to 10 controllers 2 / 56 0 / 56 0 / 56 0 / 56
11 to 20 controllers* 0 / 98 0 / 98 0 / 98 0 / 98
21 to 40 controllers* 0 / 164 0 / 164
1 to 20 controllers* 0 / 172 0 / 172 0 / 172 0 / 172
21 to 40 controllers* 0 / 164 0 / 164
0
Number of
Pumps
1
New sites RetrofitNumber of controllers (excluding ESD)
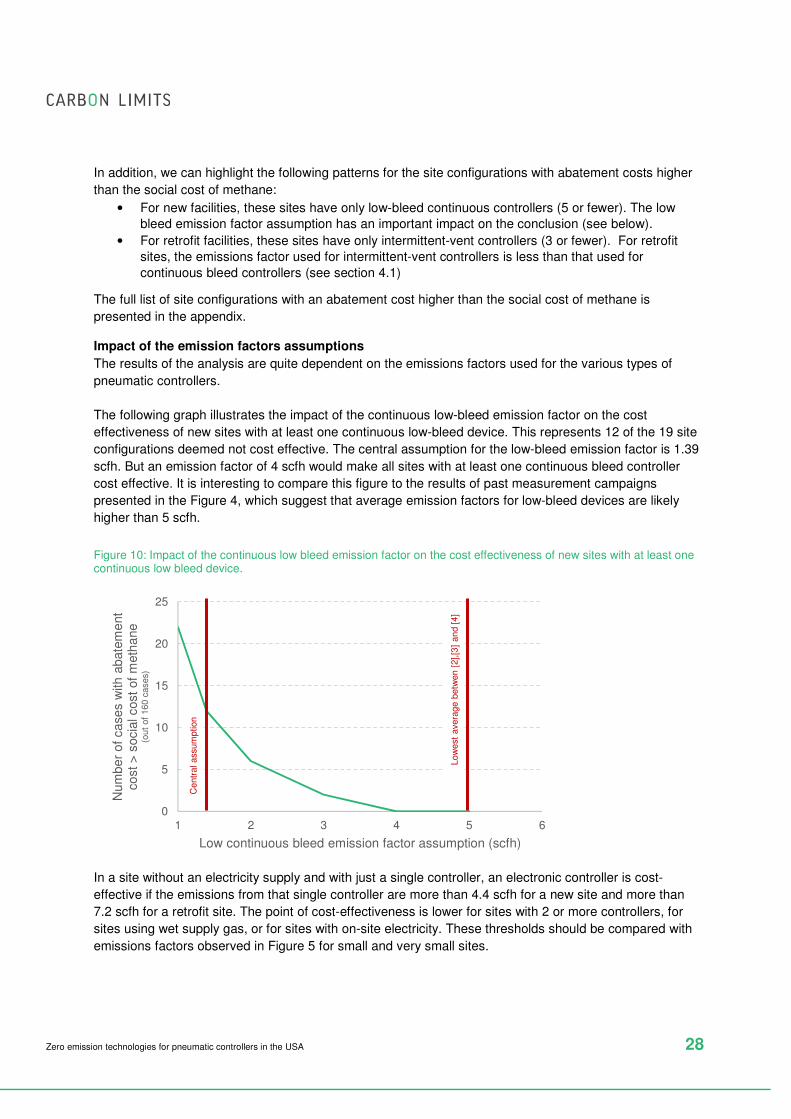
Zero emission technologies for pneumatic controllers in the USA 28
In addition, we can highlight the following patterns for the site configurations with abatement costs higher
than the social cost of methane:
• For new facilities, these sites have only low-bleed continuous controllers (5 or fewer). The low
bleed emission factor assumption has an important impact on the conclusion (see below).
• For retrofit facilities, these sites have only intermittent-vent controllers (3 or fewer). For retrofit
sites, the emissions factor used for intermittent-vent controllers is less than that used for
continuous bleed controllers (see section 4.1)
The full list of site configurations with an abatement cost higher than the social cost of methane is
presented in the appendix.
Impact of the emission factors assumptions
The results of the analysis are quite dependent on the emissions factors used for the various types of
pneumatic controllers.
The following graph illustrates the impact of the continuous low-bleed emission factor on the cost
effectiveness of new sites with at least one continuous low-bleed device. This represents 12 of the 19 site
configurations deemed not cost effective. The central assumption for the low-bleed emission factor is 1.39
scfh. But an emission factor of 4 scfh would make all sites with at least one continuous bleed controller
cost effective. It is interesting to compare this figure to the results of past measurement campaigns
presented in the Figure 4, which suggest that average emission factors for low-bleed devices are likely
higher than 5 scfh.
Figure 10: Impact of the continuous low bleed emission factor on the cost effectiveness of new sites with at least one continuous low bleed device.
In a site without an electricity supply and with just a single controller, an electronic controller is cost-
effective if the emissions from that single controller are more than 4.4 scfh for a new site and more than
7.2 scfh for a retrofit site. The point of cost-effectiveness is lower for sites with 2 or more controllers, for
sites using wet supply gas, or for sites with on-site electricity. These thresholds should be compared with
emissions factors observed in Figure 5 for small and very small sites.
0
5
10
15
20
25
1 2 3 4 5 6
Nu
mb
er
of
ca
se
s w
ith a
bate
me
nt
co
st >
socia
l cost
of
meth
ane
(out
of
160 c
ases)
Low continuous bleed emission factor assumption (scfh)
Centr
al assum
ption
Low
est
avera
ge
betw
en
[2],[3
] an
d [
4]
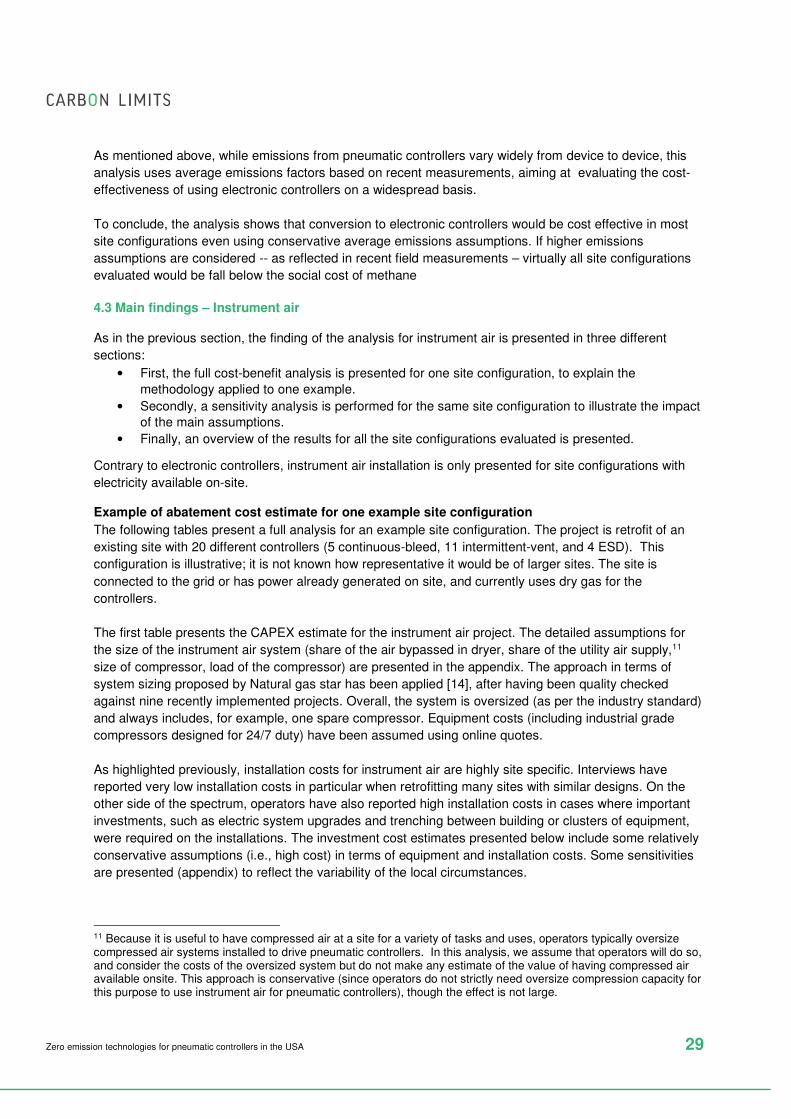
Zero emission technologies for pneumatic controllers in the USA 29
As mentioned above, while emissions from pneumatic controllers vary widely from device to device, this
analysis uses average emissions factors based on recent measurements, aiming at evaluating the cost-
effectiveness of using electronic controllers on a widespread basis.
To conclude, the analysis shows that conversion to electronic controllers would be cost effective in most
site configurations even using conservative average emissions assumptions. If higher emissions
assumptions are considered -- as reflected in recent field measurements – virtually all site configurations
evaluated would be fall below the social cost of methane
4.3 Main findings – Instrument air
As in the previous section, the finding of the analysis for instrument air is presented in three different
sections:
• First, the full cost-benefit analysis is presented for one site configuration, to explain the
methodology applied to one example.
• Secondly, a sensitivity analysis is performed for the same site configuration to illustrate the impact
of the main assumptions.
• Finally, an overview of the results for all the site configurations evaluated is presented.
Contrary to electronic controllers, instrument air installation is only presented for site configurations with
electricity available on-site.
Example of abatement cost estimate for one example site configuration
The following tables present a full analysis for an example site configuration. The project is retrofit of an
existing site with 20 different controllers (5 continuous-bleed, 11 intermittent-vent, and 4 ESD). This
configuration is illustrative; it is not known how representative it would be of larger sites. The site is
connected to the grid or has power already generated on site, and currently uses dry gas for the
controllers.
The first table presents the CAPEX estimate for the instrument air project. The detailed assumptions for
the size of the instrument air system (share of the air bypassed in dryer, share of the utility air supply,11
size of compressor, load of the compressor) are presented in the appendix. The approach in terms of
system sizing proposed by Natural gas star has been applied [14], after having been quality checked
against nine recently implemented projects. Overall, the system is oversized (as per the industry standard)
and always includes, for example, one spare compressor. Equipment costs (including industrial grade
compressors designed for 24/7 duty) have been assumed using online quotes.
As highlighted previously, installation costs for instrument air are highly site specific. Interviews have
reported very low installation costs in particular when retrofitting many sites with similar designs. On the
other side of the spectrum, operators have also reported high installation costs in cases where important
investments, such as electric system upgrades and trenching between building or clusters of equipment,
were required on the installations. The investment cost estimates presented below include some relatively
conservative assumptions (i.e., high cost) in terms of equipment and installation costs. Some sensitivities
are presented (appendix) to reflect the variability of the local circumstances.
11 Because it is useful to have compressed air at a site for a variety of tasks and uses, operators typically oversize compressed air systems installed to drive pneumatic controllers. In this analysis, we assume that operators will do so, and consider the costs of the oversized system but do not make any estimate of the value of having compressed air available onsite. This approach is conservative (since operators do not strictly need oversize compression capacity for this purpose to use instrument air for pneumatic controllers), though the effect is not large.
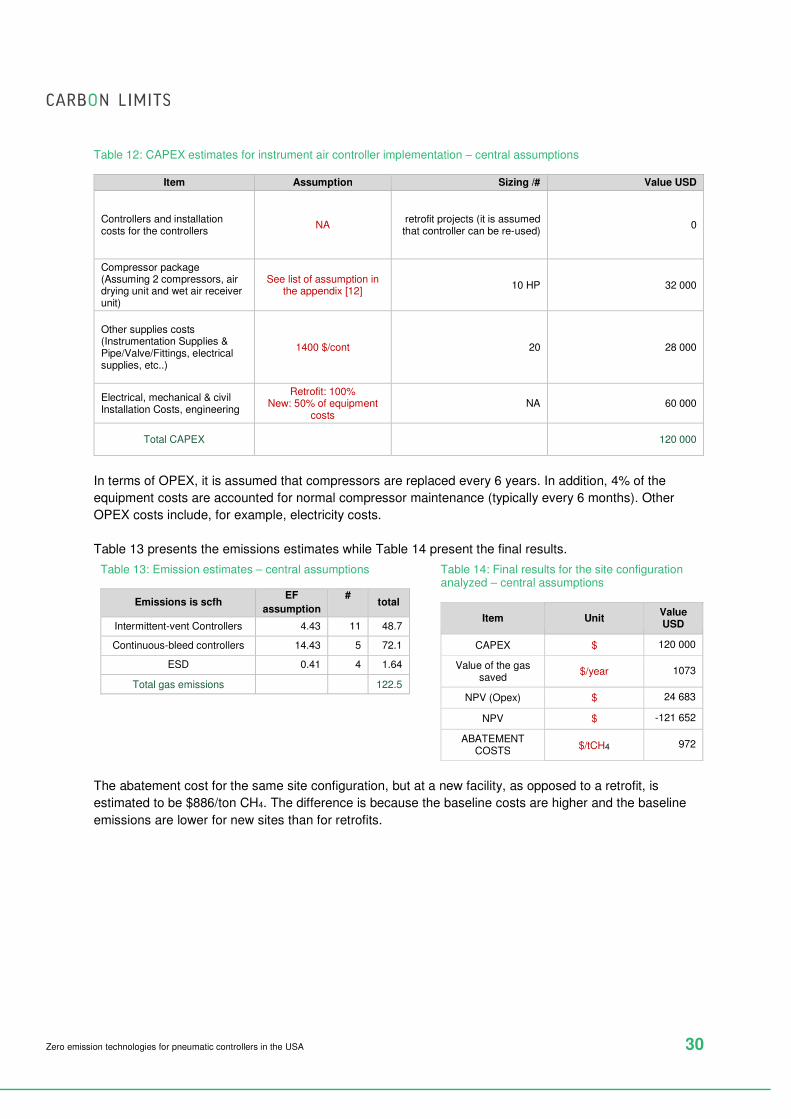
Zero emission technologies for pneumatic controllers in the USA 30
Table 12: CAPEX estimates for instrument air controller implementation – central assumptions
Item Assumption Sizing /# Value USD
Controllers and installation costs for the controllers
NA retrofit projects (it is assumed that controller can be re-used)
0
Compressor package (Assuming 2 compressors, air drying unit and wet air receiver unit)
See list of assumption in the appendix [12]
10 HP 32 000
Other supplies costs (Instrumentation Supplies & Pipe/Valve/Fittings, electrical supplies, etc..)
1400 $/cont 20 28 000
Electrical, mechanical & civil Installation Costs, engineering
Retrofit: 100% New: 50% of equipment
costs NA 60 000
Total CAPEX 120 000
In terms of OPEX, it is assumed that compressors are replaced every 6 years. In addition, 4% of the
equipment costs are accounted for normal compressor maintenance (typically every 6 months). Other
OPEX costs include, for example, electricity costs.
Table 13 presents the emissions estimates while Table 14 present the final results.
Table 13: Emission estimates – central assumptions
Emissions is scfh EF
assumption
# total
Intermittent-vent Controllers 4.43 11 48.7
Continuous-bleed controllers 14.43 5 72.1
ESD 0.41 4 1.64
Total gas emissions 122.5
Table 14: Final results for the site configuration analyzed – central assumptions
Item Unit Value USD
CAPEX $ 120 000
Value of the gas saved
$/year 1073
NPV (Opex) $ 24 683
NPV $ -121 652
ABATEMENT COSTS
$/tCH4 972
The abatement cost for the same site configuration, but at a new facility, as opposed to a retrofit, is
estimated to be $886/ton CH4. The difference is because the baseline costs are higher and the baseline
emissions are lower for new sites than for retrofits.
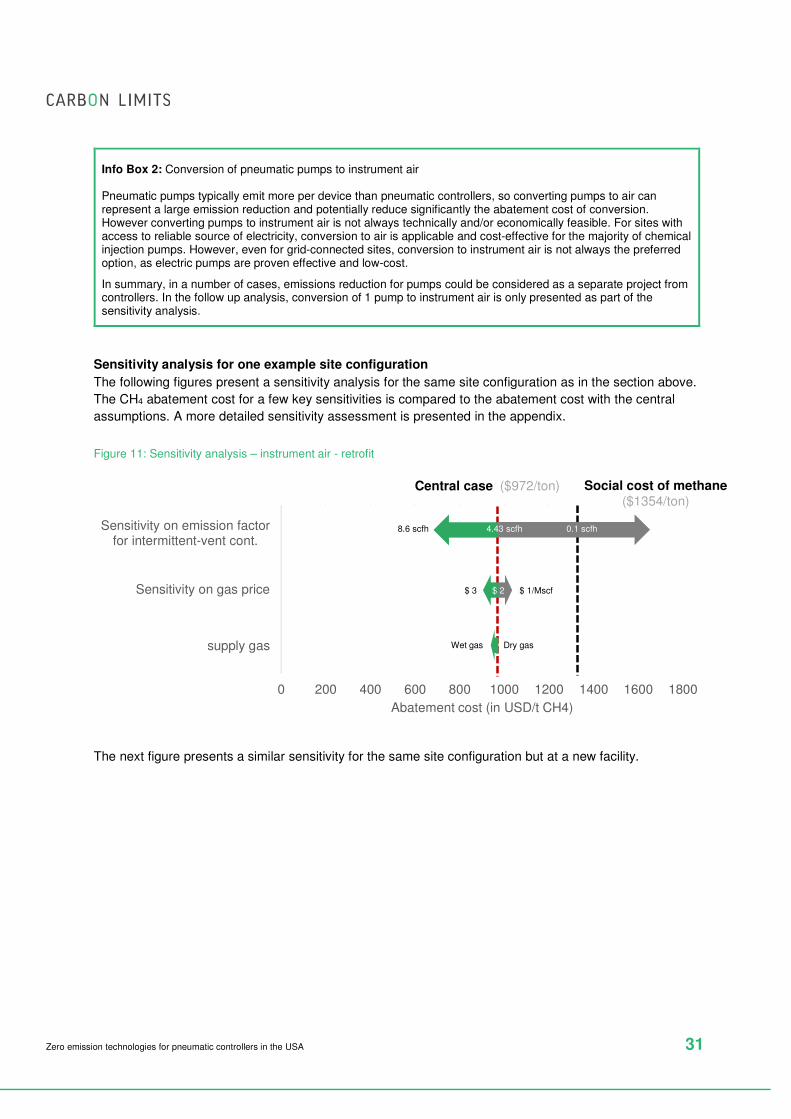
Zero emission technologies for pneumatic controllers in the USA 31
Info Box 2: Conversion of pneumatic pumps to instrument air
Pneumatic pumps typically emit more per device than pneumatic controllers, so converting pumps to air can represent a large emission reduction and potentially reduce significantly the abatement cost of conversion. However converting pumps to instrument air is not always technically and/or economically feasible. For sites with access to reliable source of electricity, conversion to air is applicable and cost-effective for the majority of chemical injection pumps. However, even for grid-connected sites, conversion to instrument air is not always the preferred option, as electric pumps are proven effective and low-cost.
In summary, in a number of cases, emissions reduction for pumps could be considered as a separate project from controllers. In the follow up analysis, conversion of 1 pump to instrument air is only presented as part of the sensitivity analysis.
Sensitivity analysis for one example site configuration
The following figures present a sensitivity analysis for the same site configuration as in the section above.
The CH4 abatement cost for a few key sensitivities is compared to the abatement cost with the central
assumptions. A more detailed sensitivity assessment is presented in the appendix.
Figure 11: Sensitivity analysis – instrument air - retrofit
The next figure presents a similar sensitivity for the same site configuration but at a new facility.
0 200 400 600 800 1000 1200 1400 1600 1800
Wet supply gas
Sensitivity on gas price
Sensitivity on emission factorfor intermittent-vent cont.
Abatement cost (in USD/t CH4)
Social cost of methane($1354/ton)
Central case ($972/ton)
8.6 scfh
$ 3 $ 1/Mscf
Dry gasWet gas
$ 2$ 2
4.43 scfh 0.1 scfh
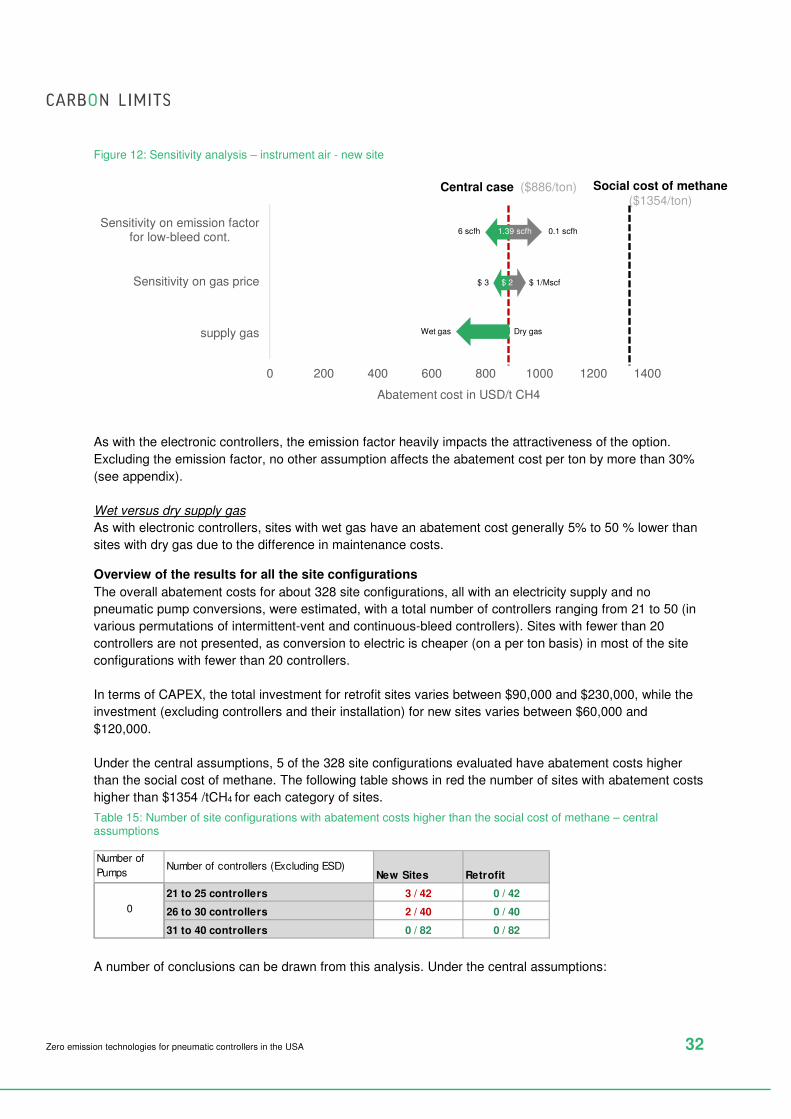
Zero emission technologies for pneumatic controllers in the USA 32
Figure 12: Sensitivity analysis – instrument air - new site
As with the electronic controllers, the emission factor heavily impacts the attractiveness of the option.
Excluding the emission factor, no other assumption affects the abatement cost per ton by more than 30%
(see appendix).
Wet versus dry supply gas
As with electronic controllers, sites with wet gas have an abatement cost generally 5% to 50 % lower than
sites with dry gas due to the difference in maintenance costs.
Overview of the results for all the site configurations
The overall abatement costs for about 328 site configurations, all with an electricity supply and no
pneumatic pump conversions, were estimated, with a total number of controllers ranging from 21 to 50 (in
various permutations of intermittent-vent and continuous-bleed controllers). Sites with fewer than 20
controllers are not presented, as conversion to electric is cheaper (on a per ton basis) in most of the site
configurations with fewer than 20 controllers.
In terms of CAPEX, the total investment for retrofit sites varies between $90,000 and $230,000, while the
investment (excluding controllers and their installation) for new sites varies between $60,000 and
$120,000.
Under the central assumptions, 5 of the 328 site configurations evaluated have abatement costs higher
than the social cost of methane. The following table shows in red the number of sites with abatement costs
higher than $1354 /tCH4 for each category of sites.
Table 15: Number of site configurations with abatement costs higher than the social cost of methane – central assumptions
A number of conclusions can be drawn from this analysis. Under the central assumptions:
0 200 400 600 800 1000 1200 1400
Wet supply gas
Sensitivity on gas price
Sensitivity on emission factorfor low-bleed cont.
Abatement cost in USD/t CH4
Social cost of methane($1354/ton)
Central case ($886/ton)
$ 3 $ 1/Mscf
4.43 scfh
$ 2
Dry gas
$ 2
6 scfh 0.1 scfh1.39 scfh
Wet gas
Number of
PumpsNumber of controllers (Excluding ESD)
New Sites Retrofit
21 to 25 controllers 3 / 42 0 / 42
26 to 30 controllers 2 / 40 0 / 40
31 to 40 controllers 0 / 82 0 / 82
0
Zero emission technologies for pneumatic controllers in the USA 33
• For almost all the site configurations evaluated with more than 21 controllers (excluding ESDs), it
is cost effective to install instrument air.
• For all the retrofit site configurations evaluated, it is cost effective to install instrument air.
• In a few of the new site configurations considered, it is not cost effective to install instrument air.
A site configuration is not cost effective if the volume of gas saved does not justify the cost of
implementation. The new site configurations with abatement costs greater than the social cost of methane
have a vast majority of low bleed continuous controllers, which we have conservatively assumed have
very low emissions (1.39 scfh emission factor, see Section 4.1).
The full list of site configurations with abatement costs higher than the social cost of methane is presented
in the appendix.
4.4 Summary of the analysis
As described in the section above, an economic analysis assuming conservative average emission factors
was performed for 2032 permutations of site configurations with 1 to 50 controllers. Both retrofit and new
installations, with or without electricity, were considered. A number of key conclusions can be drawn:
• Zero emission solutions had abatement costs below the social cost of methane (for 2020)
described in the EPA 2015 Regulatory Impact Analysis in the vast majority of site configurations
considered.
• The abatement costs exceeded the social cost of methane mostly for small sites – those with less
than three controllers (excluding ESDs). If higher emission factors, as reflected in field
measurements, are used, the abatement costs at even the very small sites fall below the social
cost of methane.
The following figure presents a summary of both the technical applicability and economic attractiveness of
the different zero emission technologies under different categories of sites. Though this analysis does not
provide a detailed evaluation of the distribution of the sites in the US for each of the categories below,
existing studies have suggested that the vast majority of the sites have less than 20 controllers.
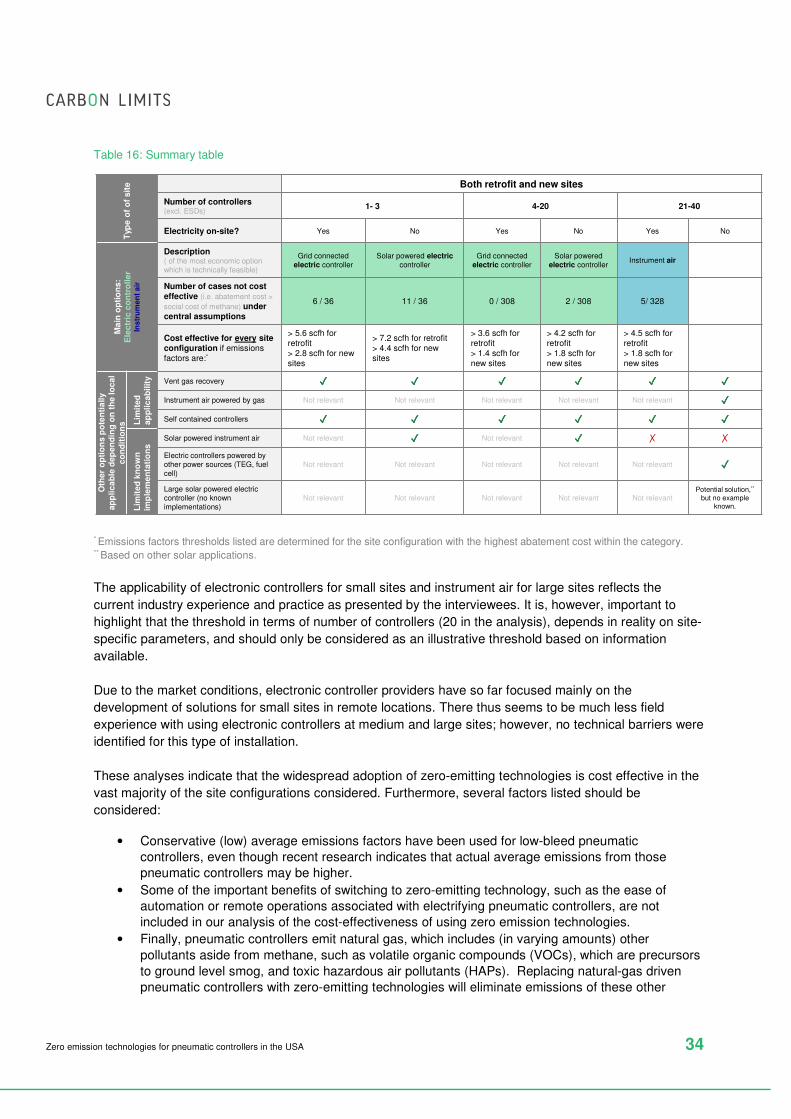
Zero emission technologies for pneumatic controllers in the USA 34
Table 16: Summary table
* Emissions factors thresholds listed are determined for the site configuration with the highest abatement cost within the category. ** Based on other solar applications.
The applicability of electronic controllers for small sites and instrument air for large sites reflects the
current industry experience and practice as presented by the interviewees. It is, however, important to
highlight that the threshold in terms of number of controllers (20 in the analysis), depends in reality on site-
specific parameters, and should only be considered as an illustrative threshold based on information
available.
Due to the market conditions, electronic controller providers have so far focused mainly on the
development of solutions for small sites in remote locations. There thus seems to be much less field
experience with using electronic controllers at medium and large sites; however, no technical barriers were
identified for this type of installation.
These analyses indicate that the widespread adoption of zero-emitting technologies is cost effective in the
vast majority of the site configurations considered. Furthermore, several factors listed should be
considered:
• Conservative (low) average emissions factors have been used for low-bleed pneumatic
controllers, even though recent research indicates that actual average emissions from those
pneumatic controllers may be higher.
• Some of the important benefits of switching to zero-emitting technology, such as the ease of
automation or remote operations associated with electrifying pneumatic controllers, are not
included in our analysis of the cost-effectiveness of using zero emission technologies.
• Finally, pneumatic controllers emit natural gas, which includes (in varying amounts) other
pollutants aside from methane, such as volatile organic compounds (VOCs), which are precursors
to ground level smog, and toxic hazardous air pollutants (HAPs). Replacing natural-gas driven
pneumatic controllers with zero-emitting technologies will eliminate emissions of these other
Typ
eo
f o
f sit
e Both retrofit and new sites
Number of controllers (excl. ESDs)
1- 3 4-20 21-40
Electricity on-site? Yes No Yes No Yes No
Ma
in o
pti
on
s:
Ele
ctr
ic c
on
tro
ller
Instr
um
en
tair
Description( of the most economic option which is technically feasible)
Grid connectedelectric controller
Solar powered electriccontroller
Grid connectedelectric controller
Solar powered electric controller
Instrument air
Number of cases not cost effective (i.e. abatement cost >
social cost of methane) undercentral assumptions
6 / 36 11 / 36 0 / 308 2 / 308 5/ 328
Cost effective for every site configuration if emissions factors are:*
> 5.6 scfh for retrofit> 2.8 scfh for new sites
> 7.2 scfh for retrofit> 4.4 scfh for new sites
> 3.6 scfh for retrofit> 1.4 scfh for new sites
> 4.2 scfh for retrofit> 1.8 scfh for new sites
> 4.5 scfh for retrofit> 1.8 scfh for new sites
Oth
er
op
tio
ns p
ote
nti
ally
ap
plica
ble
dep
en
din
g o
n t
he lo
cal
co
nd
itio
ns L
imit
ed
ap
plic
ab
ilit
y Vent gas recovery ✓✓✓✓ ✓✓✓✓ ✓✓✓✓ ✓✓✓✓ ✓✓✓✓ ✓✓✓✓
Instrument air powered by gas Not relevant Not relevant Not relevant Not relevant Not relevant ✓✓✓✓
Self contained controllers ✓✓✓✓ ✓✓✓✓ ✓✓✓✓ ✓✓✓✓ ✓✓✓✓ ✓✓✓✓
Lim
ited
kn
ow
nim
ple
men
tati
on
s
Solar powered instrument air Not relevant ✓✓✓✓ Not relevant ✓✓✓✓ ✗ ✗
Electric controllers powered by other power sources (TEG, fuelcell)
Not relevant Not relevant Not relevant Not relevant Not relevant ✓✓✓✓
Large solar powered electric controller (no knownimplementations)
Not relevant Not relevant Not relevant Not relevant Not relevantPotential solution,**
but no exampleknown.

Zero emission technologies for pneumatic controllers in the USA 35
pollutants, in addition to emissions of methane, but we have not included the benefits of VOC or
HAP abatement in our calculation of abatement costs for methane.
Zero emission technologies for pneumatic controllers in the USA 36
5. Reference list
[1] Inventory of U.S. Greenhouse Gas Emissions and Sinks: 1990-2014 EPA, 2016 https://www3.epa.gov/climatechange/ghgemissions/usinventoryreport.html
[2] Methane Emissions from Process Equipment at Natural Gas Production Sites in the United States: Pneumatic Controllers Allen et al., 2015 http://pubs.acs.org/doi/abs/10.1021/es5040156
[3] Measurements of methane emissions at natural gas production sites in the United States. Allen, David, T., et al. 2013. www.pnas.org/content/early/2013/09/10/1304880110.full.pdf+html
[4]
Determining Bleed Rates for Pneumatic Devices in British Columbia; Final Report. The Prasino Group. 2013. http://www2.gov.bc.ca/assets/gov/environment/climate-change/stakeholder-support/reporting-regulation/pneumatic-devices/prasino_pneumatic_ghg_ef_final_report.pdf
[5] Fort Worth Natural Gas Air Quality Study ERG2012 https://www3.epa.gov/ttnchie1/conference/ei20/session6/mpring.pdf
[6] API Comments on Oil & Natural Gas Sector Pneumatic Devices by EPA Office of Air Quality Planning and Standards, June 2014
[7]
Quantifying cost-effectiveness of systematic Leak Detection (LDAR) using infrared cameras, Carbon limits, 2014 (including the database used for the analysis) http://www.carbonlimits.no/project/quantifying-cost-effectiveness-of-systematic-leak-detection-ldar-using-infrared-cameras/
[8] Pneumatic Controller Emissions from a Sample of 172 Production Facilities Prepared by Oklahoma Independent Petroleum Association, 2014 http://www.oipa.com/page_images/1418911081.pdf
[9] Information provided by technologies suppliers.
[10] Information provided by operators.
[11] Methane abatement potential from oil and gas systems in Kazakhstan Carbon Limits, 2016 http ://www.carbonlimits.no/project/methane-abatement-potential-from-oil-and-gas-systems-in-kazakhstan/
[12] Online quotes for equipment purchase March – April 2016
[13] Reducing Emissions Through Retrofitting of High Bleed Devices – GE 2012 https://www.epa.gov/gasstar/documents/workshops/2012-annual-conf/giernoth.pdf
[14] Convert Gas Pneumatic Controls To Instrument Air Natural Gas Star Program 2006 https://www3.epa.gov/gasstar/documents/ll_instrument_air.pdf
[15] CarbonLimits – expert opinion
[16] Subpart W rulemaking and summary results https://www.law.cornell.edu/cfr/text/40/part-98/subpart-W/appendix-TableW-1A
[17]
Oil and Natural Gas Sector: Standards for Crude Oil and Natural Gas Facilities – Background Technical Support Document for the Proposed New Source Performance Standards EPA, 2015 https://www.regulations.gov/#!documentDetail;D=EPA-HQ-OAR-2015-0216-0101
[18] INITIAL ECONOMIC IMPACT ANALYSIS For proposed revisions to Colorado Air Quality Control Commission Regulation Number 7
[19] Regulatory Impact Analysis of the Proposed Emission Standards for New and Modified Sources in the Oil and Natural Gas Sector, EPA 2015 https://www3.epa.gov/airquality/oilandgas/pdfs/og_prop_ria_081815.pdf
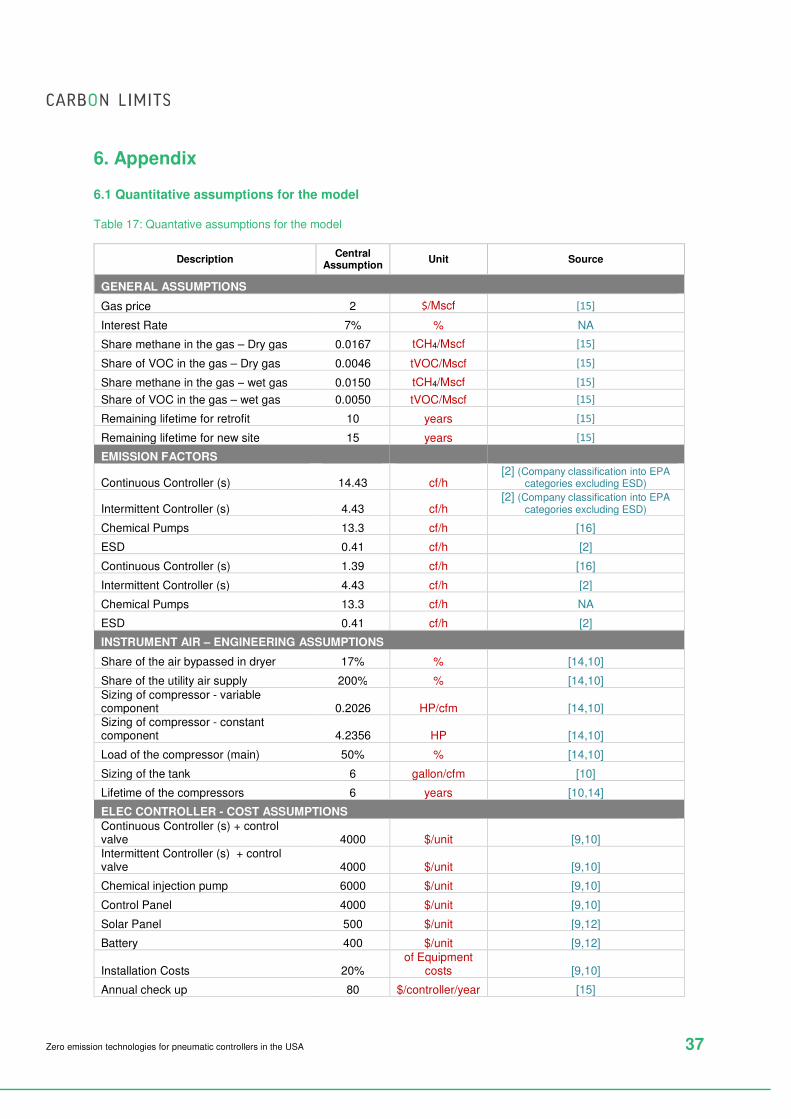
Zero emission technologies for pneumatic controllers in the USA 37
6. Appendix
6.1 Quantitative assumptions for the model
Table 17: Quantative assumptions for the model
Description Central
Assumption Unit Source
GENERAL ASSUMPTIONS
Gas price 2 $/Mscf [15]
Interest Rate 7% % NA
Share methane in the gas – Dry gas 0.0167 tCH4/Mscf [15]
Share of VOC in the gas – Dry gas 0.0046 tVOC/Mscf [15]
Share methane in the gas – wet gas 0.0150 tCH4/Mscf [15]
Share of VOC in the gas – wet gas 0.0050 tVOC/Mscf [15]
Remaining lifetime for retrofit 10 years [15]
Remaining lifetime for new site 15 years [15]
EMISSION FACTORS
Continuous Controller (s) 14.43 cf/h [2] (Company classification into EPA
categories excluding ESD)
Intermittent Controller (s) 4.43 cf/h [2] (Company classification into EPA
categories excluding ESD)
Chemical Pumps 13.3 cf/h [16]
ESD 0.41 cf/h [2]
Continuous Controller (s) 1.39 cf/h [16]
Intermittent Controller (s) 4.43 cf/h [2]
Chemical Pumps 13.3 cf/h NA
ESD 0.41 cf/h [2]
INSTRUMENT AIR – ENGINEERING ASSUMPTIONS
Share of the air bypassed in dryer 17% % [14,10]
Share of the utility air supply 200% % [14,10] Sizing of compressor - variable component 0.2026 HP/cfm [14,10] Sizing of compressor - constant component 4.2356 HP [14,10]
Load of the compressor (main) 50% % [14,10]
Sizing of the tank 6 gallon/cfm [10]
Lifetime of the compressors 6 years [10,14]
ELEC CONTROLLER - COST ASSUMPTIONS
Continuous Controller (s) + control valve 4000 $/unit [9,10] Intermittent Controller (s) + control valve 4000 $/unit [9,10]
Chemical injection pump 6000 $/unit [9,10]
Control Panel 4000 $/unit [9,10]
Solar Panel 500 $/unit [9,12]
Battery 400 $/unit [9,12]
Installation Costs 20% of Equipment
costs [9,10]
Annual check up 80 $/controller/year [15]
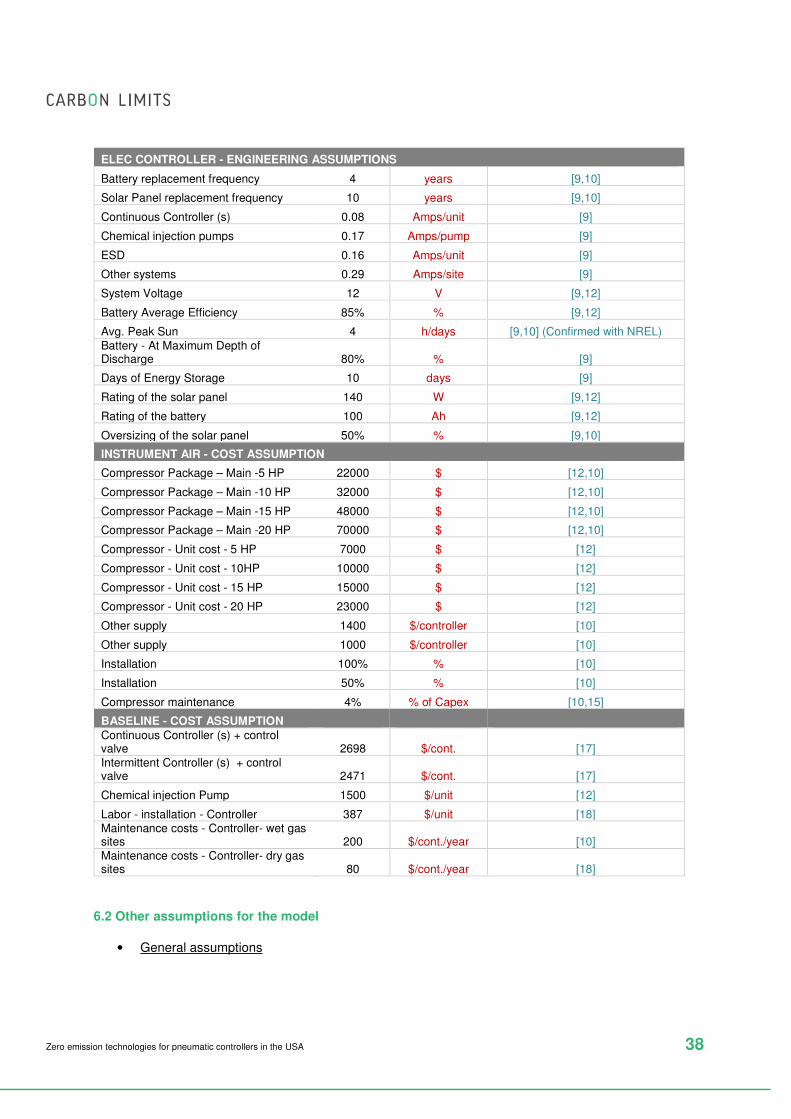
Zero emission technologies for pneumatic controllers in the USA 38
ELEC CONTROLLER - ENGINEERING ASSUMPTIONS
Battery replacement frequency 4 years [9,10]
Solar Panel replacement frequency 10 years [9,10]
Continuous Controller (s) 0.08 Amps/unit [9]
Chemical injection pumps 0.17 Amps/pump [9]
ESD 0.16 Amps/unit [9]
Other systems 0.29 Amps/site [9]
System Voltage 12 V [9,12]
Battery Average Efficiency 85% % [9,12]
Avg. Peak Sun 4 h/days [9,10] (Confirmed with NREL) Battery - At Maximum Depth of Discharge 80% % [9]
Days of Energy Storage 10 days [9]
Rating of the solar panel 140 W [9,12]
Rating of the battery 100 Ah [9,12]
Oversizing of the solar panel 50% % [9,10]
INSTRUMENT AIR - COST ASSUMPTION
Compressor Package – Main -5 HP 22000 $ [12,10]
Compressor Package – Main -10 HP 32000 $ [12,10]
Compressor Package – Main -15 HP 48000 $ [12,10]
Compressor Package – Main -20 HP 70000 $ [12,10]
Compressor - Unit cost - 5 HP 7000 $ [12]
Compressor - Unit cost - 10HP 10000 $ [12]
Compressor - Unit cost - 15 HP 15000 $ [12]
Compressor - Unit cost - 20 HP 23000 $ [12]
Other supply 1400 $/controller [10]
Other supply 1000 $/controller [10]
Installation 100% % [10]
Installation 50% % [10]
Compressor maintenance 4% % of Capex [10,15]
BASELINE - COST ASSUMPTION Continuous Controller (s) + control valve 2698 $/cont. [17] Intermittent Controller (s) + control valve 2471 $/cont. [17]
Chemical injection Pump 1500 $/unit [12]
Labor - installation - Controller 387 $/unit [18] Maintenance costs - Controller- wet gas sites 200 $/cont./year [10] Maintenance costs - Controller- dry gas sites 80 $/cont./year [18]
6.2 Other assumptions for the model
• General assumptions
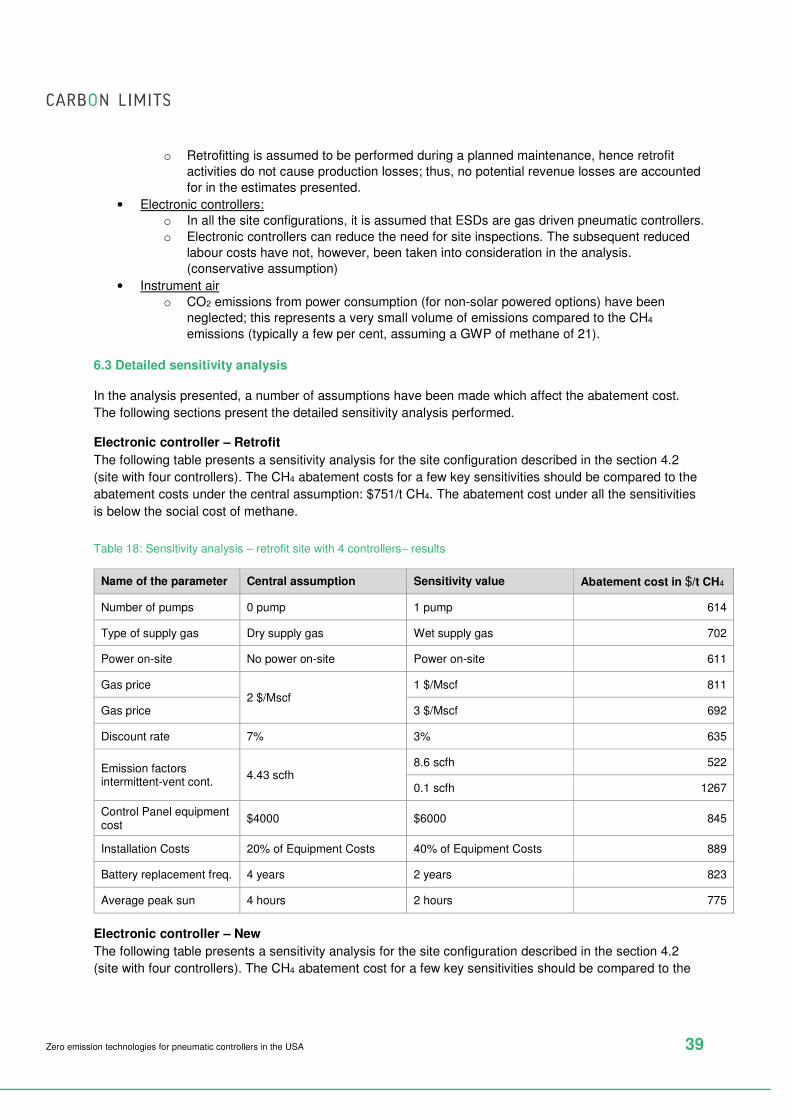
Zero emission technologies for pneumatic controllers in the USA 39
o Retrofitting is assumed to be performed during a planned maintenance, hence retrofit
activities do not cause production losses; thus, no potential revenue losses are accounted
for in the estimates presented.
• Electronic controllers:
o In all the site configurations, it is assumed that ESDs are gas driven pneumatic controllers.
o Electronic controllers can reduce the need for site inspections. The subsequent reduced
labour costs have not, however, been taken into consideration in the analysis.
(conservative assumption)
• Instrument air
o CO2 emissions from power consumption (for non-solar powered options) have been
neglected; this represents a very small volume of emissions compared to the CH4
emissions (typically a few per cent, assuming a GWP of methane of 21).
6.3 Detailed sensitivity analysis
In the analysis presented, a number of assumptions have been made which affect the abatement cost.
The following sections present the detailed sensitivity analysis performed.
Electronic controller – Retrofit
The following table presents a sensitivity analysis for the site configuration described in the section 4.2
(site with four controllers). The CH4 abatement costs for a few key sensitivities should be compared to the
abatement costs under the central assumption: $751/t CH4. The abatement cost under all the sensitivities
is below the social cost of methane.
Table 18: Sensitivity analysis – retrofit site with 4 controllers– results
Name of the parameter Central assumption Sensitivity value Abatement cost in $/t CH4
Number of pumps 0 pump 1 pump 614
Type of supply gas Dry supply gas Wet supply gas 702
Power on-site No power on-site Power on-site 611
Gas price 2 $/Mscf
1 $/Mscf 811
Gas price 3 $/Mscf 692
Discount rate 7% 3% 635
Emission factors intermittent-vent cont.
4.43 scfh 8.6 scfh 522
0.1 scfh 1267
Control Panel equipment cost
$4000 $6000 845
Installation Costs 20% of Equipment Costs 40% of Equipment Costs 889
Battery replacement freq. 4 years 2 years 823
Average peak sun 4 hours 2 hours 775
Electronic controller – New
The following table presents a sensitivity analysis for the site configuration described in the section 4.2
(site with four controllers). The CH4 abatement cost for a few key sensitivities should be compared to the
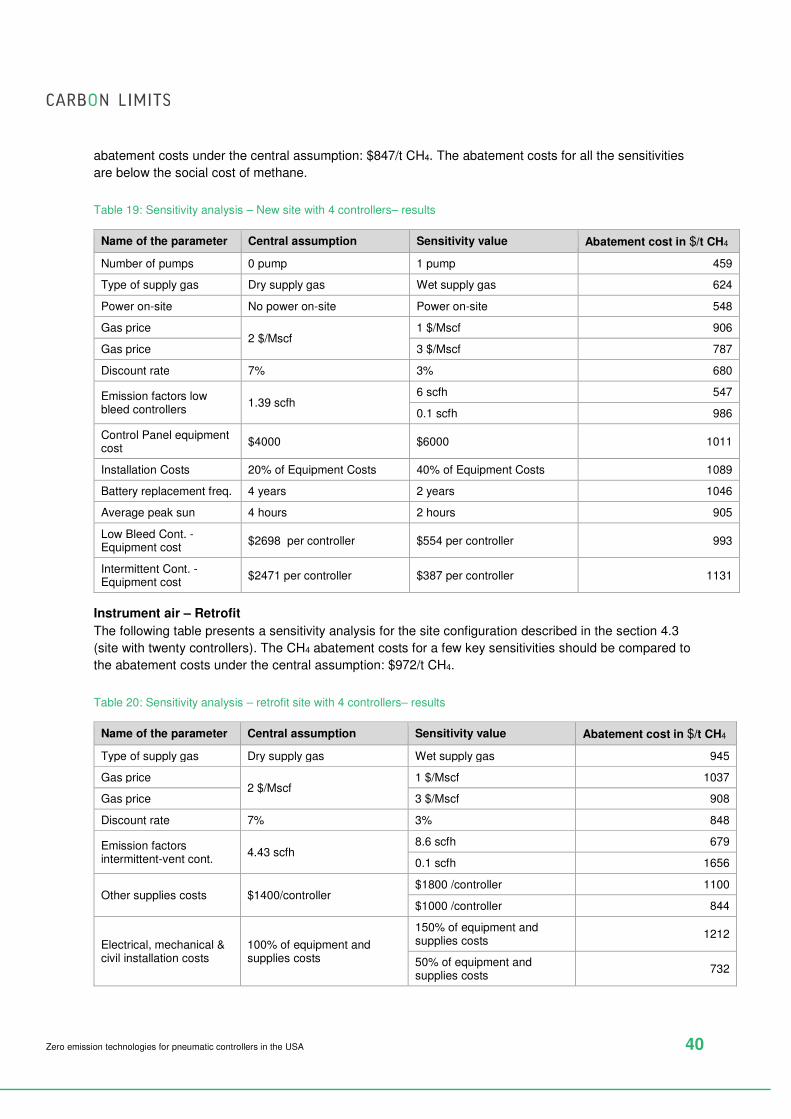
Zero emission technologies for pneumatic controllers in the USA 40
abatement costs under the central assumption: $847/t CH4. The abatement costs for all the sensitivities
are below the social cost of methane.
Table 19: Sensitivity analysis – New site with 4 controllers– results
Name of the parameter Central assumption Sensitivity value Abatement cost in $/t CH4
Number of pumps 0 pump 1 pump 459
Type of supply gas Dry supply gas Wet supply gas 624
Power on-site No power on-site Power on-site 548
Gas price 2 $/Mscf
1 $/Mscf 906
Gas price 3 $/Mscf 787
Discount rate 7% 3% 680
Emission factors low bleed controllers
1.39 scfh 6 scfh 547
0.1 scfh 986
Control Panel equipment cost
$4000 $6000 1011
Installation Costs 20% of Equipment Costs 40% of Equipment Costs 1089
Battery replacement freq. 4 years 2 years 1046
Average peak sun 4 hours 2 hours 905
Low Bleed Cont. - Equipment cost
$2698 per controller $554 per controller 993
Intermittent Cont. - Equipment cost
$2471 per controller $387 per controller 1131
Instrument air – Retrofit
The following table presents a sensitivity analysis for the site configuration described in the section 4.3
(site with twenty controllers). The CH4 abatement costs for a few key sensitivities should be compared to
the abatement costs under the central assumption: $972/t CH4.
Table 20: Sensitivity analysis – retrofit site with 4 controllers– results
Name of the parameter Central assumption Sensitivity value Abatement cost in $/t CH4
Type of supply gas Dry supply gas Wet supply gas 945
Gas price 2 $/Mscf
1 $/Mscf 1037
Gas price 3 $/Mscf 908
Discount rate 7% 3% 848
Emission factors intermittent-vent cont.
4.43 scfh 8.6 scfh 679
0.1 scfh 1656
Other supplies costs $1400/controller $1800 /controller 1100
$1000 /controller 844
Electrical, mechanical & civil installation costs
100% of equipment and supplies costs
150% of equipment and supplies costs
1212
50% of equipment and supplies costs
732
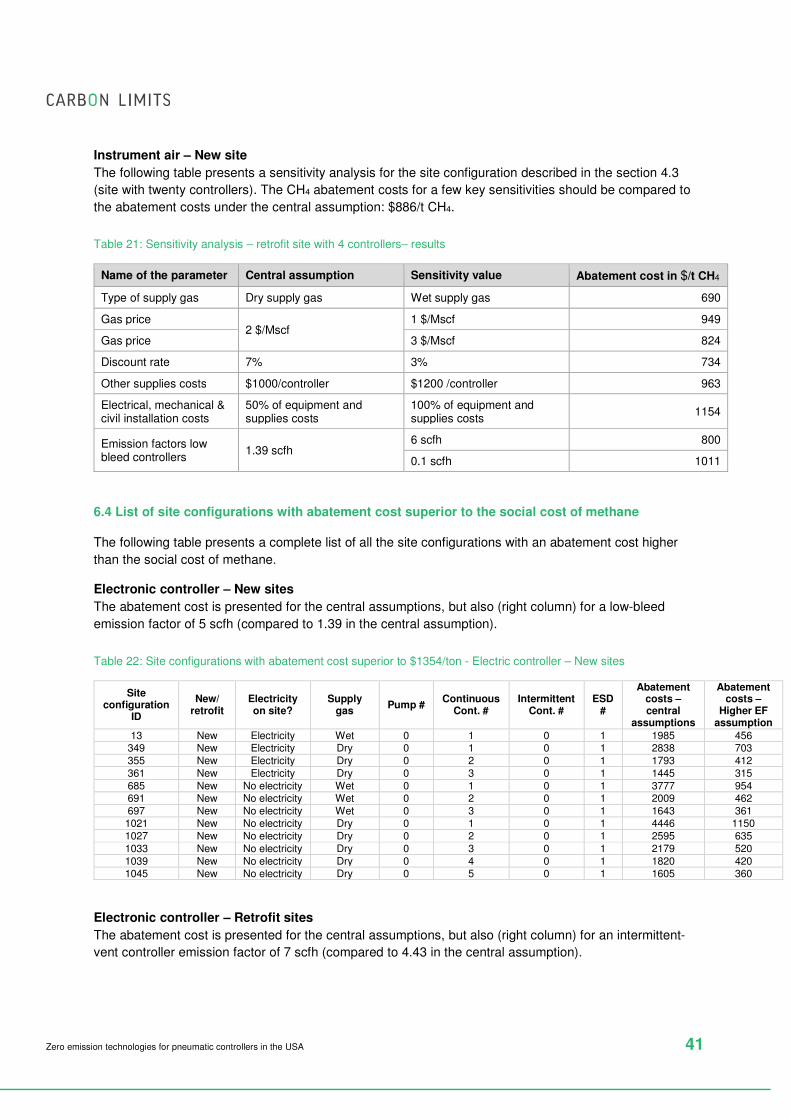
Zero emission technologies for pneumatic controllers in the USA 41
Instrument air – New site
The following table presents a sensitivity analysis for the site configuration described in the section 4.3
(site with twenty controllers). The CH4 abatement costs for a few key sensitivities should be compared to
the abatement costs under the central assumption: $886/t CH4.
Table 21: Sensitivity analysis – retrofit site with 4 controllers– results
Name of the parameter Central assumption Sensitivity value Abatement cost in $/t CH4
Type of supply gas Dry supply gas Wet supply gas 690
Gas price 2 $/Mscf
1 $/Mscf 949
Gas price 3 $/Mscf 824
Discount rate 7% 3% 734
Other supplies costs $1000/controller $1200 /controller 963
Electrical, mechanical & civil installation costs
50% of equipment and supplies costs
100% of equipment and supplies costs
1154
Emission factors low bleed controllers
1.39 scfh 6 scfh 800
0.1 scfh 1011
6.4 List of site configurations with abatement cost superior to the social cost of methane
The following table presents a complete list of all the site configurations with an abatement cost higher
than the social cost of methane.
Electronic controller – New sites
The abatement cost is presented for the central assumptions, but also (right column) for a low-bleed
emission factor of 5 scfh (compared to 1.39 in the central assumption).
Table 22: Site configurations with abatement cost superior to $1354/ton - Electric controller – New sites
Site configuration
ID
New/ retrofit
Electricity on site?
Supply gas
Pump # Continuous
Cont. # Intermittent
Cont. # ESD
#
Abatement costs – central
assumptions
Abatement costs –
Higher EF assumption
13 New Electricity Wet 0 1 0 1 1985 456 349 New Electricity Dry 0 1 0 1 2838 703 355 New Electricity Dry 0 2 0 1 1793 412 361 New Electricity Dry 0 3 0 1 1445 315 685 New No electricity Wet 0 1 0 1 3777 954 691 New No electricity Wet 0 2 0 1 2009 462 697 New No electricity Wet 0 3 0 1 1643 361 1021 New No electricity Dry 0 1 0 1 4446 1150 1027 New No electricity Dry 0 2 0 1 2595 635 1033 New No electricity Dry 0 3 0 1 2179 520 1039 New No electricity Dry 0 4 0 1 1820 420 1045 New No electricity Dry 0 5 0 1 1605 360
Electronic controller – Retrofit sites
The abatement cost is presented for the central assumptions, but also (right column) for an intermittent-
vent controller emission factor of 7 scfh (compared to 4.43 in the central assumption).
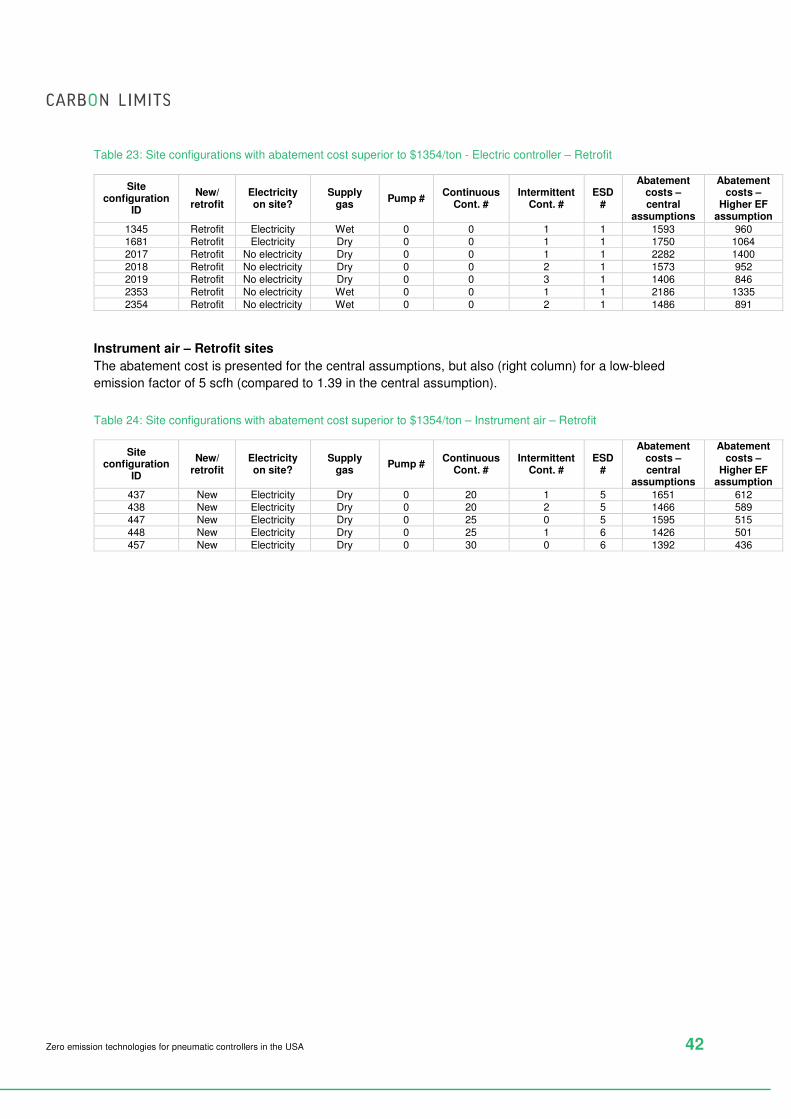
Zero emission technologies for pneumatic controllers in the USA 42
Table 23: Site configurations with abatement cost superior to $1354/ton - Electric controller – Retrofit
Site configuration
ID
New/ retrofit
Electricity on site?
Supply gas
Pump # Continuous
Cont. # Intermittent
Cont. # ESD
#
Abatement costs – central
assumptions
Abatement costs –
Higher EF assumption
1345 Retrofit Electricity Wet 0 0 1 1 1593 960 1681 Retrofit Electricity Dry 0 0 1 1 1750 1064 2017 Retrofit No electricity Dry 0 0 1 1 2282 1400 2018 Retrofit No electricity Dry 0 0 2 1 1573 952 2019 Retrofit No electricity Dry 0 0 3 1 1406 846 2353 Retrofit No electricity Wet 0 0 1 1 2186 1335 2354 Retrofit No electricity Wet 0 0 2 1 1486 891
Instrument air – Retrofit sites
The abatement cost is presented for the central assumptions, but also (right column) for a low-bleed
emission factor of 5 scfh (compared to 1.39 in the central assumption).
Table 24: Site configurations with abatement cost superior to $1354/ton – Instrument air – Retrofit
Site configuration
ID
New/ retrofit
Electricity on site?
Supply gas
Pump # Continuous
Cont. # Intermittent
Cont. # ESD
#
Abatement costs – central
assumptions
Abatement costs –
Higher EF assumption
437 New Electricity Dry 0 20 1 5 1651 612 438 New Electricity Dry 0 20 2 5 1466 589 447 New Electricity Dry 0 25 0 5 1595 515 448 New Electricity Dry 0 25 1 6 1426 501 457 New Electricity Dry 0 30 0 6 1392 436