Zero-Emission Bus Evaluation Results: King County Metro ... · Zero-Emission Bus Evaluation...
67
Zero-Emission Bus Evaluation Results: King County Metro Battery Electric Buses FTA Report No. 0118 Federal Transit Administration PREPARED BY Leslie Eudy Matthew Jeffers National Renewable Energy Laboratory FEBRUARY 201 8
Transcript of Zero-Emission Bus Evaluation Results: King County Metro ... · Zero-Emission Bus Evaluation...

Zero-Emission Bus Evaluation Results: King County Metro
Battery Electric Buses
FTA Report No. 0118Federal Transit Administration
PREPARED BY
Leslie Eudy Matthew Jeffers
National Renewable Energy Laboratory
FEBRUARY 2018

COVER PHOTO Courtesy of King County Metro (Seattle) Proterra Catalyst fast-charge battery electric bus. Photo courtesy of National Renewable Energy Laboratory.
DISCLAIMER This document is disseminated under the sponsorship of the U.S. Department of Transportation in the interest of information exchange. The United States Government assumes no liability for its contents or use thereof. The United States Government does not endorse products of manufacturers. Trade or manufacturers’ names appear herein solely because they are considered essential to the objective of this report.
FEDERAL TRANSIT ADMINISTRATION i
Zero-Emission Bus Evaluation Results: King County Metro Battery Electric Buses
FEBRUARY 2018FTA Report No. 0118
PREPARED BY
Leslie EudyMatthew JeffersNational Renewable Energy Laboratory15013 Denver West ParkwayGolden, CO 80401
SPONSORED BY
Federal Transit AdministrationOffice of Research, Demonstration and Innovation U.S. Department of Transportation1200 New Jersey Avenue, SEWashington, DC 20590
AVAILABLE ONLINE
https://www.transit.dot.gov/about/research-innovation
FEDERAL TRANSIT ADMINISTRATION iv
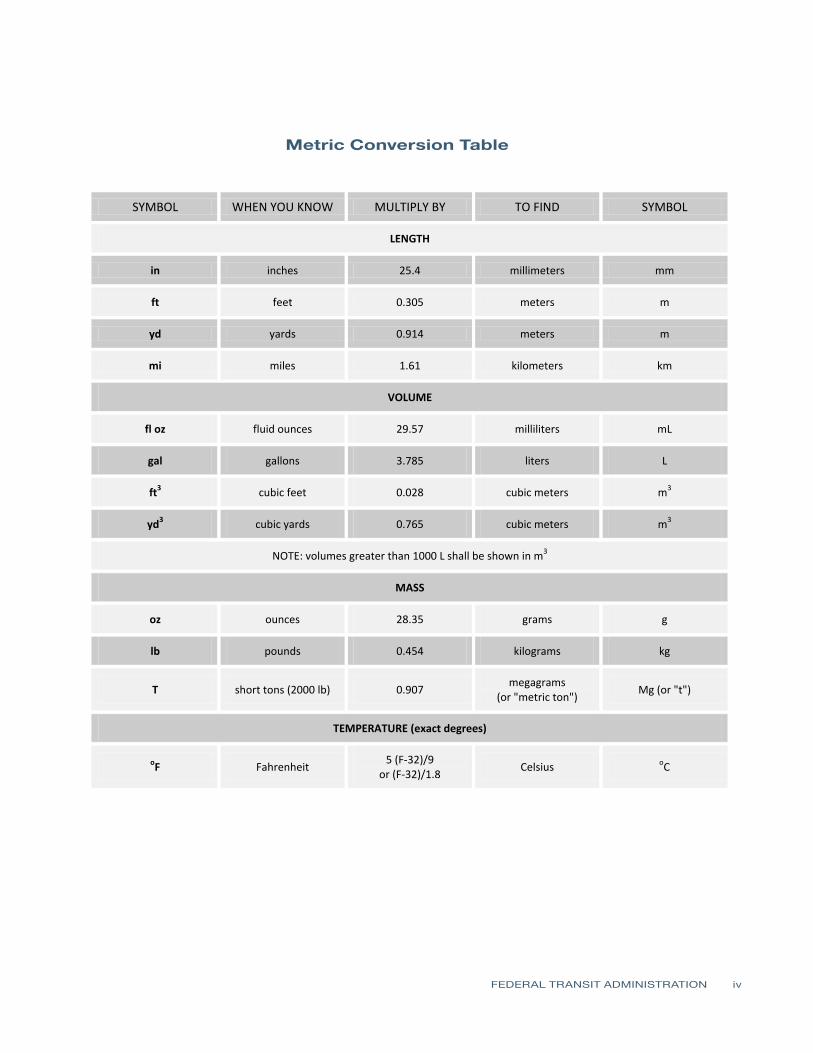
Metric Conversion Table
SYMBOL WHEN YOU KNOW MULTIPLY BY TO FIND SYMBOL
LENGTH
in inches 25.4 millimeters mm
ft feet 0.305 meters m
yd yards 0.914 meters m
mi miles 1.61 kilometers km
VOLUME
fl oz fluid ounces 29.57 milliliters mL
gal gallons 3.785 liters L
ft3 cubic feet 0.028 cubic meters m3
yd3 cubic yards 0.765 cubic meters m3
NOTE: volumes greater than 1000 L shall be shown in m3
MASS
oz ounces 28.35 grams g
lb pounds 0.454 kilograms kg
T short tons (2000 lb) 0.907 megagrams
(or "metric ton") Mg (or "t")
TEMPERATURE (exact degrees)
oF Fahrenheit 5 (F-32)/9
or (F-32)/1.8 Celsius oC
FEDERAL TRANSIT ADMINISTRATION ii
Metric Conversion TableMetric Conversion Table

FEDERAL TRANSIT ADMINISTRATION v
REPORT DOCUMENTATION PAGE Form ApprovedOMB No. 0704-0188
1. AGENCY USE ONLY 2. REPORT DATEFebruary 2018
3. REPORT TYPE AND DATES COVEREDApril 2016–March 2017
Public reporting burden for this collection of information is estimated to average 1 hour per response, including the time for reviewing instruc-tions, searching existing data sources, gathering and maintaining the data needed, and completing and reviewing the collection of information. Send comments regarding this burden estimate or any other aspect of this collection of information, including suggestions for reducing this burden, to Washington Headquarters Services, Directorate for Information Operations and Reports, 1215 Jefferson Davis Highway, Suite 1204, Arlington, VA 22202-4302, and to the Office of Management and Budget, Paperwork Reduction Project (0704-0188), Washington, DC 20503.
4. TITLE AND SUBTITLEZero-Emission Bus Evaluation Results: King County Metro Battery Electric Buses
5. FUNDING NUMBERS
6. AUTHOR(S) Leslie Eudy, Matthew Jeffers
7. PERFORMING ORGANIZATION NAME(S) AND ADDRESSE(ES)National Renewable Energy Laboratory 15013 Denver West Parkway Golden, CO 80401
8. PERFORMING ORGANIZATION REPORT NUMBER
FTA Report No. 0118
9. SPONSORING/MONITORING AGENCY NAME(S) AND ADDRESS(ES)U.S. Department of TransportationFederal Transit AdministrationOffice of Research, Demonstration and InnovationEast Building1200 New Jersey Avenue, SEWashington, DC 20590
10. SPONSORING/MONITORING AGENCY REPORTNUMBER
FTA Report No. 0118
11. SUPPLEMENTARY NOTES [https://www.transit.dot.gov/about/research-innovation]
12A. DISTRIBUTION/AVAILABILITY STATEMENT Available from: National Technical Information Service (NTIS), Springfield, VA 22161. Phone 703.605.6000, Fax 703.605.6900, email [[email protected]]
12B. DISTRIBUTION CODE
TRI
13. ABSTRACTThis report summarizes the experience and results from a battery electric bus (BEB) demonstration funded by the Federal Transit Administration (FTA) under the Transit Investments for Greenhouse Gas and Energy Reduction (TIGGER) program. In 2010, King CountyMetro transit agency in Seattle, Washington, received funding from a TIGGER award to add three zero-emission BEBs to its fleet. The BEBs in service at King County Metro are 40-foot fast-charge electric transit buses built by Proterra. FTA is collaborating with the U.S. Department of Energy (DOE) and DOE’s National Renewable Energy Laboratory (NREL) to conduct in-service evaluations of advanced technology buses developed under its programs. This report presents evaluation results for the BEBs in comparison to a selection of baseline buses. The focus of the analysis is on one year of data from April 2016 through March 2017.
14. SUBJECT TERMSFederal Transit Administration; Office of Research, Demonstration, and Innovation;Transit Investments for Greenhouse Gas and Energy Reduction; TIGGER
15. NUMBER OF PAGES67
16. PRICE CODE
17. SECURITY CLASSIFICATIONOF REPORTUnclassified
18. SECURITY CLASSIFICATIONOF THIS PAGE Unclassified
19. SECURITY CLASSIFICATIONOF ABSTRACT
Unclassified
20. LIMITATION OF ABSTRACT

FEDERAL TRANSIT ADMINISTRATION vi
1 Executive Summary
6 Section 1: Introduction
7 Section 2: Zero-Emission Bus Evaluations Planned 7 Select Projects 8 Evaluation Protocol
15 Section 3: KC Metro BEB Evaluation Results15 Fleet Profile—KC Metro16 Bus Technology Descriptions18 Charging and Maintenance Facilities19 In-Service Operations Evaluation Results45 Summary of Achievements and Challenges
48 Appendix: KC Metro Fleet Summary Statistics 53 Fleet Summary Statistics—SI Units 54 Additional Charts for KC Metro Evaluation
55 Acronyms and Abbreviations
56 Glossary
TABLE OF CONTENTS
FEDERAL TRANSIT ADMINISTRATION vii
15 Figure 3-1: KC Metro Service Area Map with Shaded Bellevue Region 17 Figure 3-2: KC Metro Proterra Catalyst Battery Electric Bus 17 Figure 3-3: KC Metro New Flyer Diesel Hybrid Bus 17 Figure 3-4: Gillig Diesel Bus Operated by KC Metro for Sound Transit 18 Figure 3-5: KC Metro New Flyer Electric Trolley Bus 19 Figure 3-6: Fast-Charge Station at KC Metro Park-and-Ride 20 Figure 3-7: Route Map for KC Metro Routes 226 and 241 21 Figure 3-8: Battery Charge and Discharge Power and State of Charge for One Example Charge Cycle 22 Figure 3-9: Cumulative Miles and Hours for Battery Bus Fleet 23 Figure 3-10: Average Monthly Miles for All Four Bus Fleets 26 Figure 3-11: Monthly Availability for All Four Bus Fleets and Reasons for Unavailability for Battery Fleet 27 Figure 3-12: Overall Availability for All Four Bus Fleets During Evaluation Period 28 Figure 3-13: Monthly Charges and Monthly Energy Consumption for Battery Fleet 29 Figure 3-14: Monthly Fuel Economy for Battery, Hybrid, and Diesel Bus Fleets 31 Figure 3-15: Monthly Fuel Cost per Mile for Battery, Hybrid, and Diesel Bus Fleets 32 Figure 3-16: Breakdown of Monthly Electric Utility Costs 34 Figure 3-17: Summary of Propulsion-Related Roadcalls for All Four Bus Fleets, Organized by Subsystem 35 Figure 3-18: Cumulative Bus MBRC and Propulsion-Related MBRC for All Four Bus Fleets 37 Figure 3-19: Monthly Scheduled and Unscheduled Maintenance Cost per Mile for All Four Bus Fleets 39 Figure 3-20: Monthly Maintenance Cost per Mile by System for Battery Bus Fleet 40 Figure 3-21: Monthly Maintenance Cost per Mile by System for Hybrid Bus Fleet 41 Figure 3-22: Monthly Maintenance Cost per Mile by System for Diesel Bus Fleet 42 Figure 3-23: Monthly Maintenance Cost per Mile by System for Trolley Bus Fleet 45 Figure 3-24: Monthly Operations (Maintenance and Fuel) Cost for Battery, Hybrid, and Diesel Bus Fleets 54 Figure A-1: Monthly Average Price for Electricity and Diesel Fuel 54 Figure A-2: Monthly Availability for Battery Buses
LIST OF FIGURES

FEDERAL TRANSIT ADMINISTRATION viii
2 Table ES-1: Summary of Evaluation Results8 Table 2-1: Selected Evaluation Projects8 Table 2-2: DOE/FTA Performance, Cost, and Durability Targets for
FCEBs16 Table 3-1: System Descriptions for the Battery Electric, Hybrid, Diesel,
and Trolley Buses23 Table 3-2: Average Monthly Mileage (Evaluation Period)25 Table 3-3: Summary of Availability by Bus for All Four Fleets27 Table 3-4: Summary of Availability and Unavailability by Category for
All Four Fleets30 Table 3-5: Mileage, Fuel Use, and Fuel Economy33 Table 3-6: Utility Electricity Rates36 Table 3-7: Total Work Order Maintenance Costs38 Table 3-8: Work Order Maintenance Cost per Mile by System43 Table 3-9: Propulsion-Related Work Order Maintenance Costs by System45 Table 3-10: Overall Operations (Maintenance and Fuel) Cost per Mile48 Table A-1: Fleet Operations and Economics48 Table A-2: Maintenance Costs49 Table A-3: Breakdown of Maintenance Costs by System53 Table A-4: Fleet Operations and Economics (SI)53 Table A-5: Maintenance Costs (SI)
LIST OF TABLES
FEDERAL TRANSIT ADMINISTRATION ix
ACKNOWLEDGMENTS
This report could not have been possible without the cooperation of King County Metro, Proterra, and others. King County Metro staff provided data on the electric and baseline buses, reviewed analyses and reports, and participated in meetings to discuss the agency’s overall experience. Proterra provided selected data from the on-board data loggers and reviewed reports. The U.S. Department of Transportation’s Federal Transit Administration provided funding for the evaluation. The authors thank the following individuals:
King County Metro
George Stites Leo Hrechanyk Jim Hunley Kim Martin Daniel Santon Cindy Sattler Bonnie Davis-Losey Larry Schwerzler Lynn Matteoni
Proterra
Mike Finnern Seneca Schepmann Derrick Allen
U.S. Department of Transportation Federal Transit Administration, Office of Research, Demonstration and Innovation
Sean Ricketson Mike Baltes Marcel Belanger
U.S. Department of Transportation Research, Development, and Technology Office
Shawn Johnson

FEDERAL TRANSIT ADMINISTRATION x
ABSTRACT
This report summarizes the experience and results from a battery electric bus (BEB) demonstration funded by the Federal Transit Administration (FTA) under the Transit Investments for Greenhouse Gas and Energy Reduction (TIGGER) program. In 2010, King County Metro transit agency in Seattle, Washington, received funding from a TIGGER award to add three zero-emission BEBs to its fleet. The BEBs in service at King County Metro are 40-foot fast-charge electric transit buses built by Proterra. FTA is collaborating with the U.S. Department of Energy (DOE) and DOE’s National Renewable Energy Laboratory (NREL) to conduct in-service evaluations of advanced technology buses developed under its programs. This report presents evaluation results for the BEBs in comparison to a selection of baseline buses. The focus of the analysis is on one year of data from April 2016 through March 2017.

EXECUTIVE SUMMARY
FEDERAL TRANSIT ADMINISTRATION 1
The U.S. Department of Transportation’s Federal Transit Administration (FTA) supports the research, development, and demonstration of low- and zero-emission technology for transit buses. FTA funds a number of research projects with a goal of facilitating commercialization of advanced technologies for transit buses that will increase efficiency and lower tailpipe emissions. FTA is collaborating with the U.S. Department of Energy (DOE) and DOE’s National Renewable Energy Laboratory (NREL) to conduct in-service evaluations of advanced technology buses developed under its programs. NREL uses a standard evaluation protocol for evaluating the advanced technologies deployed under the FTA programs.
FTA seeks to provide results from new technologies being adopted by transit agencies. The eight evaluations selected to date include battery electric buses (BEBs) and fuel cell electric buses (FCEBs) from different manufacturers operating in fleets located in both cold and hot climates. NREL recently completed a yearlong evaluation of a fleet of BEBs in service at King County Metro (KC Metro) in Seattle, Washington. KC Metro’s service area covers more than 2,000 square miles of King County, including the Seattle metro area. In February 2016, the agency began operating a fleet of three BEBs in its service area. The focus of the analysis is on one year of data from April 2016 through March 2017.
The BEBs in service at KC Metro are fast-charge, composite buses built by Proterra. KC Metro and NREL selected three conventional technologies for comparison to the BEBs: standard diesel buses from Gillig, diesel hybrid buses on New Flyer’s Xcelsior platform, and electric trolley buses on New Flyer’s Xcelsior platform. Buses in all four fleets are 40-foot, model year 2015 buses. The four bus fleets included in the evaluation are referred to in this analysis as the battery fleet, hybrid fleet, diesel fleet, and trolley fleet. In the introduction and summary sections of this report, the term “BEB” is used when referring to battery bus technology, transit bus evaluations, and NREL’s analysis protocol. Table ES-1 provides a summary of the results for the battery fleet and baseline fleets.
The battery fleet accumulated 83,128 miles during the year, which is 27,709 miles per bus. The average monthly operating mileage per bus was 2,309 miles. The battery buses accumulated more miles than the diesel and trolley buses, but fewer miles than the hybrid buses. This is a function of planned use of the buses. The battery fleet is restricted to KC Metro routes 226 and 241, and the hybrid fleet is randomly dispatched on all routes, which include commuter routes. This results in a higher average speed for the hybrid buses and a faster mileage accumulation. The trolley buses are limited to the network of catenary lines in and around downtown Seattle, which results in lower speeds and fewer operating miles. The diesel buses are operated on one specific route on weekdays only.

FEDERAL TRANSIT ADMINISTRATION 2
EXECUTIVE SUMMARY
The overall average availability for the battery fleet was 80.6%. For the baseline buses, the overall average availability was 90.5% for the hybrid fleet, 86.4% for the diesel fleet, and 84.9% for the trolley fleet. Issues relating to general bus maintenance accounted for most of the downtime for all four fleets. The battery buses experienced several issues with the electric drive system.
The battery buses had an overall average efficiency of 2.36 kWh per mile, which equates to a fuel economy of 15.9 miles per diesel gallon equivalent (mpdge). The hybrid buses had an average fuel economy of 6.3 mpdge, and the diesel buses had a fuel economy of 5.3 mpdge. Monthly energy use data were not available for the trolley buses; however, a sample of total mileage and energy use for two of the trolley buses representing a 13-month period of operation was used to calculate an estimated average fuel economy of 14.7 mpdge for the trolley fleet.
During the data period, KC Metro paid an average of $0.20/kWh for electricity for the battery buses and $1.60/gal for diesel fuel. The fuel economy advantage of the hybrid fleet over the diesel fleet results in a slightly lower per-mile fuel cost for the hybrid fleet ($0.25/mi) compared to the diesel fleet ($0.30/mi). The per-mile fuel (electricity) cost for the battery fleet was $0.57/mi. The electricity cost per mile calculation includes all electricity that KC Metro purchased from the utility. This represents the “grid-side” fuel cost per mile, not the “bus-side” fuel cost per mile. Despite having an average fuel economy that is 2.5 to 3 times higher than that of the baseline bus fleets in the evaluation, the battery fleet had higher per-mile fuel costs due to the large difference between diesel fuel and electricity prices.
Table ES-1 Summary of Evaluation
Results
Data Item Battery Hybrid Diesel Trolley
Number of buses 3 10 3 10
Total mileage in data period 83,128 435,552 69,329 180,554
Average mileage per bus 27,709 43,555 23,110 18,055
Average monthly mileage per bus 2,309 3,630 1,926 1,505
Availability (85% is target) 80.6 90.5 86.4 84.9
Fuel economy (kWh/mile) 2.36 — — 2.57
Fuel economy (miles/dgea) 15.9 6.3 5.3 14.7
Average speed, including stops (mph)b 14.8 15.2 14.6 9.0
Miles between roadcalls (MBRC) – busc 2,771 7,641 17,332 1,641
MBRC – propulsion system onlyc 6,927 29,037 34,665 2,960
Total maintenance cost ($/mile)d 0.26 0.32 0.46 0.46
Maintenance – propulsion system only ($/mile) 0.05 0.12 0.13 0.17a Diesel gallon equivalent.b Based on scheduled revenue service.c MBRC data cumulative through March 2017. d Work order maintenance cost.

FEDERAL TRANSIT ADMINISTRATION 3
EXECUTIVE SUMMARY
KC Metro incurs demand charges when charging rates exceed 50 kW during the billing period. These demand charges made up a significant portion of the utility bills each month—between 34% and 54%. The monthly demand charges are inversely proportional to the monthly mileage of the battery fleet. Thus, the relative cost of demand charges decreases as the battery fleet mileage increases and the fast charger is more fully utilized. The charger utilization will increase as more battery buses are added to the route, or as the existing battery buses operate more frequently, or both.
The transit industry measures reliability as mean distance between failures, also documented as miles between roadcalls (MBRC). NREL tracks bus reliability categorized by total bus roadcalls, propulsion-related roadcalls, and energy storage system-related roadcalls. Propulsion-related roadcalls are a subset of total bus roadcalls for each bus fleet. Energy storage system-related roadcalls are a subset of the propulsion-related roadcalls, specific to the energy storage system of the battery buses. The diesel fleet had the highest bus MBRC at 17,332. The hybrid bus fleet achieved 7,641 MBRC. The battery fleet MBRC and trolley fleet MBRC are currently below 3,500.
The battery fleet propulsion-related MBRC was 6,927. Propulsion-related MBRC for the diesel and hybrid baseline fleets were similar to each other—34,665 and 29,037, respectively. The propulsion-related MBRC for the trolley buses was 2,960, which reflects the trolley fleet’s low average mileage and early issues with the current collection system.
NREL also analyzed work order data to provide a comparison of maintenance costs between the battery fleet and the baseline fleets. After removing accident- and warranty-related items for all fleets, the average per-mile maintenance cost for the data period was $0.26/mi for the battery buses, $0.32/mi for the hybrid buses, $0.46/mi for the diesel buses, and $0.46/mi for the trolley buses. During the data period, the maintenance cost for the battery buses was 17.8% less than that of the hybrid buses; 44.1% less than that of the diesel buses; and 43.2% less than that of the trolley buses. These combined totals include scheduled and unscheduled maintenance.
NREL analyzed the maintenance data to determine costs by vehicle system. The systems with the highest percentage of maintenance costs for the battery buses and diesel buses were 1) cab, body, and accessories; 2) propulsion-related; and 3) preventive maintenance inspections. The systems with the highest percentage of maintenance costs for the hybrid buses were 1) propulsion-related; 2) cab, body, and accessories; and 3) preventive maintenance inspections. The systems with the highest percentage of maintenance costs for the trolley buses were 1) cab, body, and accessories; 2) propulsion-related; and 3) HVAC.

FEDERAL TRANSIT ADMINISTRATION 4
EXECUTIVE SUMMARY
As with all new technology development, lessons learned during this project could aid other agencies considering BEB technology. KC Metro reports that it has had a positive experience with Proterra and that the manufacturer is very responsive. Proterra has expressed appreciation with KC Metro’s feedback on the bus design and has used that input to make improvements. KC Metro reports the following successes:
• Implemented the agency’s first BEB fleet
• Accumulated more than 100,000 miles on the battery buses in the first 15 months of revenue service
• Increased operation of the battery fleet since the end of the data collection period
• Initiated an order of eight more fast charge BEBs through a Low-No award.
Issues and lessons learned include the following:
• Charger availability – Availability of the on-route fast charger is critical for operation of a fast-charge BEB fleet. Downtime of the charger results in downtime for the fleet. KC Metro experienced this issue when the charger was damaged. While the issue was minor, the resulting downtime of the charger caused a major service interruption for the battery bus fleet during the two weeks it took to repair the charger.
• Operator training – Driver training is an ongoing challenge because the BEBs operate differently from the conventional buses in the agency’s fleet. The primary training differences are learning the charger docking procedure and ensuring the BEBs are fully charged before returning to the base at the end of a shift. Once KC Metro installs a fast charger at the base, the need to fully charge the BEBs at the end of the day will no longer be necessary. Any new operators for the routes serviced by the BEBs need to be trained on the operational differences. Transit agencies deploying electric buses should consider this when planning training programs.
• Operations planning – The scheduling department needs to understand the operational differences for fast charged BEBs. The short range of these buses requires them to operate on a selection of routes that return to the charging station regularly. Schedulers need to limit service to the selected routes until the agency adds chargers to other locations. The agency also has layovers planned in its route schedules. With conventional buses, an operator can shorten the layover to make up lost time and keep buses on schedule. For electric buses, however, that planned layover includes time for charging. Shortening the layover to make up schedule slip could result in the bus not getting a full charge.
• Parts list for inventory – Parts availability is a common issue with agencies deploying advanced technology buses. KC Metro reports that Proterra has delivered parts quickly, but the agency needs to keep some parts on hand to

FEDERAL TRANSIT ADMINISTRATION 5
EXECUTIVE SUMMARY
speed up the process. The agency is working with Proterra to develop a list of parts for on-site inventory.
KC Metro is committed to an environmentally-friendly fleet and plans to purchase 120 BEBs by 2020. In 2017, the agency entered into a contract with Proterra to purchase up to 73 BEBs.

SECTION
1
FEDERAL TRANSIT ADMINISTRATION 6
Introduction
The U.S. Department of Transportation’s (DOT’s) Federal Transit Administration (FTA) supports the research, development, and demonstration of low- and zero-emission technology for transit buses. FTA funds a number of research projects with a goal of facilitating commercialization of advanced technologies for transit buses that will increase efficiency and lower tailpipe emissions. These programs include the following:
• National Fuel Cell Bus Program (NFCBP) – a $180 million, multi-year, cost-share research program for developing and demonstrating commercially viable fuel cell technology for transit buses.
• Transit Investments for Greenhouse Gas and Energy Reduction (TIGGER) – $225 million for capital investments that would reduce greenhouse gas emissions and/or lower the energy use of public transportation systems.
• Low or No Emission Vehicle Deployment Program (Low-No) – $186.9 million in funding (FY13–FY17) to transit agencies for capital purchases of zero-emission and low-emission transit buses that have been largely proven in testing and demonstration efforts but are not yet widely deployed.
FTA understands the need to share early experience of advanced technologies with the transit industry. FTA is funding evaluations of a selection of these projects to provide comprehensive, unbiased performance results from advanced technology bus development, operations, and implementation. These evaluations have proved useful for a variety of groups including transit operators considering the technology for future procurements, manufacturers needing to understand the status of the technology for transit applications, and government agencies making policy decisions or determining future research needs. The evaluations include economic, performance, and safety factors. Data are collected on the operation, maintenance, and performance of each advanced technology fleet and a comparable baseline fleet operating at the same site (if available).
The purpose of this report is to outline the evaluation plan and analysis protocol and present the results from a one-year evaluation of three battery electric buses (BEBs) at King County Metro in Seattle, Washington.

SECTION
2
FEDERAL TRANSIT ADMINISTRATION 7
Zero-Emission Bus Evaluations Planned
FTA is collaborating with the U.S. Department of Energy (DOE) and DOE’s National Renewable Energy Laboratory (NREL) to conduct in-service evaluations of advanced technology buses. For more than a decade, NREL has been evaluating advanced technology transit buses using a standard data collection and analysis protocol originally developed for DOE heavy-duty vehicle evaluations. Funding for these evaluations has come from several agencies including FTA, DOE, and the California Air Resources Board. NREL has evaluated fuel cell electric buses (FCEBs) as well as BEBs following this standard protocol. DOT’s Research, Development, and Technology Office (OST-R) also has an interest in zero-emission bus (ZEB) technology deployment and commercialization. OST-R is coordinating and collaborating with FTA on the evaluation process and results by providing funding to cover additional evaluations. This section provides the list of evaluations selected to date and outlines the protocol used for collecting and analyzing the data.
Selected ProjectsNREL uses a set of criteria to prioritize the available projects for selection that include number of buses deployed, record-keeping practices of the transit agency, commitment level of the bus original equipment manufacturer (OEM), and the availability of appropriate baseline buses for comparison. The criteria are not intended to be rigid; however, the determination of priority is based on how many criteria are met. In consultation with FTA, NREL has selected several projects that are in the highest priority category. Other projects will be chosen as more information becomes available. Table 2-1 lists the projects selected for evaluation as of the publication date of this report.

SECTION 2: ZERO-EMISSION BUS EVALUATIONS PLANNED
FEDERAL TRANSIT ADMINISTRATION 8
Evaluation ProtocolIn 2012, DOE and FTA established performance and cost targets for FCEBs.1 Interim targets were set for 2016 along with ultimate targets that FCEBs would need to meet to compete with current commercial-technology buses. DOE and FTA have not established performance targets specific to BEBs, but the performance targets established for FCEBs were based on typical conventional buses and the targets could be considered appropriate for any advanced technology. Table 2-2 shows a selection of these technical targets for FCEBs.
1 Fuel Cell Technologies Program Record #12012, September 12, 2012.
Table 2-2 DOE/FTA Performance, Cost, and Durability Targets for FCEBsa
Units 2016 Target Ultimate Target
Bus lifetime years/miles 12/500,000 12/500,000
Power plant lifetimeb hours 18,000 25,000
Bus availability % 85 90
Fuel fills per day 1 (<10 min) 1 (<10 min)
Bus costc $ 1,000,000 600,000
Roadcall frequency (bus/fuel cell system) miles between roadcalls MBRC) 3,500/15,000 4,000/20,000
Operation time hours per day/
days per week 20/7 20/7
Scheduled and unscheduled maintenance costd $/mile 0.75 0.40
Range miles 300 300
Fuel economy miles per diesel gallon equivalent 8 8
a Cost targets for subsystems (power plant and hydrogen storage) not included.b Power plant defined as fuel cell system and battery system.c Cost projected to production volume of 400 systems per year; assumed for analysis purposes only, does not represent anticipated level of sales.d Excludes mid-life overhaul of power plant.
Table 2-1 Selected Evaluation Projects
Site # Transit Agency and Location Project Description Evaluation Status
1 King County Metro, Seattle, WA 3 Proterra 40-ft Catalyst buses and 1 fast-charge station Completed
2 Long Beach Transit, Long Beach, CA 10 BYD 40-ft BEBs, overnight charging with 1 inductive charger on route Initiated April 2017
3 Central Contra Costa Transit Authority, Concord, CA
4 Gillig/BAE Systems 29-ft BEBs, overnight charging with 1 inductive charger on route Initiated April 2017
4 Orange County Transportation Authority, Santa Ana, CA
1 American Fuel Cell Bus (AFCB): BAE Systems, Ballard Power Systems, and ENC Initiated June 2016
5 Stark Area Regional Transit Authority, Camden, OH 7 AFCBs Initiated August
2017
6 Massachusetts Bay Transportation Authority, Boston, MA
1 AFCB with Nuvera PowerTap system fueling infrastructure
Initiated January 2017
7 Southeastern Pennsylvania Transportation Authority, Philadelphia, PA 25 Proterra 40-ft Catalyst E2 BEBs Planned 2018
8 Duluth Transit, Duluth, MN 6 Proterra 40-ft Catalyst E2 BEBs Planned 2018

SECTION 2: ZERO-EMISSION BUS EVALUATIONS PLANNED
FEDERAL TRANSIT ADMINISTRATION 9
NREL uses a standard evaluation protocol for evaluating the advanced technologies deployed under the FTA programs. Data parameters include the following:
• Bus system descriptions
• Operations duty-cycle description
• Bus use and availability
• Energy/fuel consumption and cost
• Maintenance cost
• Roadcalls
• Infrastructure and facility modification descriptions
• Capital costs
• Implementation experience
For each selected fleet, NREL collects all fueling/charging, cost, and maintenance data for a period of 12 to 18 months to provide a full year of operation data for the analysis. For each site, NREL collects data on conventional technology baseline buses for comparison. For most fleets, the baseline buses are diesel buses. For fleets that do not operate diesel buses, the baseline buses are usually compressed natural gas (CNG) buses. Other technologies, such as diesel hybrid buses, will be included in the evaluation if they are available. The best comparisons are made between buses of the same make, model, production year, size, and route deployment. In that case, the only difference is the propulsion system. This is not always possible. NREL works with the transit agency to determine which vehicles the agency has in operation and selects the best possible baseline match for each evaluation based on what is available. The following sections outline the analysis approach for each parameter.
Bus System DescriptionsThis category of data includes general descriptions of the buses and systems. NREL provides a form that the agency fills out for both the ZEBs and baseline vehicles. The form asks for specifications of the vehicle propulsion system and subsystems as well as accessory equipment. This information documents that the baseline vehicles are similar in equipment to the advanced technology buses. NREL collects these data at the beginning of the project; however, changes may be required if major systems are altered.
Operations Duty-Cycle DescriptionNREL collects duty-cycle descriptions from the transit agency to understand how the ZEBs are used compared to the baseline buses. Data collected include descriptions of the expected routes, operating hours during a typical work day,
SECTION 2: ZERO-EMISSION BUS EVALUATIONS PLANNED
FEDERAL TRANSIT ADMINISTRATION 10
number of days per week that the vehicle is operated, the amount of fuel and range (in miles) that are expected during a given work day and between fueling/charging, and other information on how the vehicles are used. Transit agencies typically provide these data in text format. NREL uses the data to determine an average operating speed. Occasionally, bus OEMs provide detailed Global Positioning System (GPS) data from the on-board data collection systems. In those cases, NREL will develop specific route maps showing the planned use of the ZEBs.
Bus Use and AvailabilityBus use and availability are indicators of reliability. Lower bus usage may indicate downtime for maintenance or purposeful reduction of planned work for the buses. NREL expresses bus use as average miles accumulated per month. NREL uses a general target of 3,000 miles per month for this metric; however, the monthly miles for each agency will vary depending on the planned use of the buses. If a ZEB fleet does not meet this target, it does not indicate a specific limitation for the technology. NREL collects the mileage data for the ZEBs and baseline buses and calculates average monthly miles accumulated per bus.
Availability is the number of days the buses are actually available compared to the days that the buses are planned for operation, expressed as percent availability. The analysis calculates availability for morning pull-out and doesn’t necessarily reflect all-day availability. Transit agencies typically have a target of 85% availability for their fleets to allow time to handle scheduled and unscheduled maintenance. The sources for availability data vary from fleet to fleet. NREL works with each agency to determine the best source for the data. In addition to tracking the overall availability, NREL collects the reasons for unavailability. Categories for unavailability include issues related to general bus systems, preventive maintenance, electric drive, battery system, and fuel cell system. These data help indicate whether the issues are due to the advanced technology components or are problems with conventional bus systems.
Energy/Fuel ConsumptionData needed for this category include records of each fueling or charging event. For liquid- and gas-fueled buses, NREL collects individual fueling records (amount of fuel, odometer reading, hour reading, date, and fueling time) and fuel prices (each fuel, each time the fuel price changes—price and date). For the BEBs, NREL collects daily energy use (total kWh, number of charges, miles traveled) and utility bills for each charging location (in-depot or on-route fast charger). NREL analyzes these data to calculate monthly fuel economy and fuel/energy cost per mile. For the BEBs, NREL uses the bus energy use and utility energy data to calculate the charging losses.
SECTION 2: ZERO-EMISSION BUS EVALUATIONS PLANNED
FEDERAL TRANSIT ADMINISTRATION 11
To compare the electrical energy used by the BEBs to the diesel fuel energy used by the baseline hybrid and diesel buses, the electrical energy is converted to diesel gallon equivalent (dge). The energy content of each fuel2 is used to create the conversion factor shown below:
• Lower heating value for diesel fuel = 128,488 Btu/gal
• U.S. average energy content of electricity = 3,414 Btu/kWh
• Conversion factor = 128,488 Btu/gal / 3,414 Btu/kWh = 37.64 kWh/gal
Maintenance CostMaintenance data include each repair action—such as preventive (scheduled) maintenance, unscheduled maintenance, and roadcalls—and date of repair, labor hours, number of days out of service, odometer reading, parts replaced, parts cost, and descriptions of problem reported and actual repair performed. NREL also collects data and cost for any fluid addition (oil, transmission fluid, deionized water). Engine oil changes are included as part of preventive maintenance. The maintenance data are used to estimate operating costs (along with fuel and engine oil consumption costs). Because accident-related repairs are extremely variable from bus to bus, NREL eliminates those costs from the analysis for both ZEB and baseline bus fleets.
NREL also eliminates warranty cost data from the operating cost calculation because those costs are covered in the purchase price of the buses. Labor costs may be included in this analysis depending on the mechanic who performed the work (operator or manufacturer) and whether those hours were reimbursed under the warranty agreement. For consistency, NREL uses a labor cost of $50/hour. Cost per mile is calculated as follows:
Cost per mile = [(labor hours * $50/hr) + parts cost] / mileage
NREL calculates total cost per mile as well as scheduled and unscheduled cost per mile. To understand the differences between conventional and ZEB technology, NREL presents the cost per mile by vehicle system. The work orders are coded using vehicle maintenance reporting standards (VMRS) developed by the American Trucking Association to aid the industry in tracking equipment and maintenance using a common standard. The propulsion-related systems were chosen to include only those systems of the vehicles that could be affected directly by the selection of a fuel or advanced technology. NREL bases the VMRS coding on parts that were replaced. If there was no part replaced in a given repair, then NREL selects the code by the system being worked on. System categories include the following:
2 Alternative Fuels Data Center, fuel properties database, http://www.afdc.energy.gov/fuels/fuel_properties.php.

SECTION 2: ZERO-EMISSION BUS EVALUATIONS PLANNED
FEDERAL TRANSIT ADMINISTRATION 12
• Cab, body, and accessories – includes body, glass, cab and sheet metal, seats and doors, and accessory repairs such as hubodometers and radios
• Propulsion-related systems (subsystems included):
– Engine/power plant (includes fuel cell for FCEBs)
– Electric propulsion system
– Fuel system
– Exhaust
– Non-lighting electrical system—general electrical, charging, cranking, ignition
– Air intake
– Cooling
– Transmission
– Hydraulic
• Preventive maintenance inspection (PMI) – labor for inspections during preventive maintenance
• Brakes – includes brake pads, disks, calipers, anti-lock braking system, and brake chambers
• Frame, steering, and suspension
• HVAC
• Lighting
• Air system (general)
• Axles, wheels, and drive shaft
• Tires
RoadcallsAll roadcalls are marked in the maintenance data collected. A roadcall, or revenue vehicle system failure, is defined as a failure of an in-service bus that causes the bus to be replaced on route or causes a significant delay in schedule. If the problem with the bus can be repaired during a layover and the schedule is kept, this is not considered a roadcall. The analysis described here includes only roadcalls that were caused by “chargeable” failures. Chargeable roadcalls include systems that can physically disable the bus from operating on route, such as interlocks (doors, air system), engine, or things that are deemed to be safety issues if operation of the bus continues. They do not include roadcalls for issues with components such as radios, fareboxes, or destination signs.
The transit industry measures reliability as mean distance between failures, also documented as miles between roadcalls (MBRC). MBRC is calculated by dividing the number of miles traveled by the number of roadcalls. NREL uses the roadcall

SECTION 2: ZERO-EMISSION BUS EVALUATIONS PLANNED
FEDERAL TRANSIT ADMINISTRATION 13
data to calculate cumulative MBRC over time. MBRC results in the report are categorized as follows:
• Bus MBRC – includes all chargeable roadcalls. This category includes propulsion-related issues as well as problems with bus-related systems such as brakes, suspension, steering, windows, doors, and tires.
• Propulsion-related MBRC – includes roadcalls that are attributed to the propulsion system and is a subset of the bus MBRC. Propulsion-related roadcalls can be caused by issues with the engine, transmission, batteries, fuel cell system, or electric drive.
• Energy storage system (ESS)-related MBRC – includes roadcalls attributed to the ESS only (specific to BEBs).
• Fuel cell system-related MBRC – includes roadcalls attributed to the fuel cell and balance of plant only (specific to FCEBs).
Transit agencies are required to report costs and specific performance data to FTA through the National Transit Database (NTD). After Congress required data reporting in 1974, FTA developed the NTD as a repository of financial, operating, and asset condition data for American transit agencies. These data are published on the NTD website.3 The vehicle maintenance reliability metrics used by the NTD are as follows:
• Major mechanical system failure – a failure of some mechanical element of the revenue vehicle that prevents the vehicle from completing a scheduled revenue trip or from starting the next scheduled revenue trip because actual movement is limited or because of safety concerns.
• Other mechanical system failure – a failure of some other mechanical element of the revenue vehicle that, because of local agency policy, prevents the revenue vehicle from completing a scheduled revenue trip or from starting the next scheduled revenue trip even though the vehicle is physically able to continue in revenue service. Examples include a malfunction in the farebox or the air conditioner.
Total revenue system failures would be a sum of the two categories. The NTD categories do not exactly match the roadcall definitions used in the standard NREL protocol. The primary difference is that NTD’s other mechanical system failures category includes failures of items such as fareboxes and destination signs. This results in the NTD total failures being higher than that of the NREL analysis. Removing these failures from the NTD data would result in higher overall industry average MBRC. In addition, the NTD major mechanical system failure category includes some roadcalls that are not for the propulsion system. The NTD has no category for power plant failures; therefore, there is no direct comparison for fuel cell system-related or ESS-related MBRC.
3 NTD website, https://www.transit.dot.gov/ntd.
SECTION 2: ZERO-EMISSION BUS EVALUATIONS PLANNED
FEDERAL TRANSIT ADMINISTRATION 14
Infrastructure and Facility Modification DescriptionsAt the beginning of the data collection period, NREL collects details on the fleet’s operations including a description of facilities and services, maintenance and fueling practices, and any other information needed to get a complete understanding of the fleet’s experience with the ZEBs. Descriptions of facilities include fueling, charging, maintenance, and vehicle storage facilities that may be associated with the ZEBs.
Capital Costs Data on capital costs include costs for any facility modifications that are required for operation of ZEBs. The vehicle capital costs include the costs for new vehicles and propulsion systems.
Implementation ExperienceThe experiences of a transit agency in implementing any new technology are an important part of fully understanding the current status of that technology. NREL collects data on the fleet implementation experience to document the background work needed for successful implementation of ZEBs, as well as some of the potential pitfalls and lessons learned. The types of information collected in support of this activity include:
• Documentation of the history that led to the agency’s decision to purchase ZEBs, its previous experience with alternative fuels, etc.
• Roles of important supporting organizations such as vehicle manufacturer and supplier, fuel suppliers, and federal, state, or local government agencies.
• Specific incentives for advanced technology vehicles, and regulations or disincentives for the other options that helped form the agency’s decision to purchase ZEBs.
• Driver, fleet personnel, and customer perceptions of the new technology vehicles.
• Special fleet needs such as mechanic, driver, or technician training requirements, special equipment, and safety issues.
• Description of the training implementation strategy including employee orientation, operations and maintenance personnel, and the costs of this training.
• What it took to bring these vehicles into revenue service, and what technical/non-technical hurdles were overcome.

SECTION
3
FEDERAL TRANSIT ADMINISTRATION 15
KC Metro BEB Evaluation Results
In February 2016, King County Metro (KC Metro) began operating a fleet of three battery electric buses in its service area. This section summarizes the evaluation results for the battery buses in comparison to a selection of baseline buses. The focus of the analysis is on one year of data from April 2016 through March 2017.
Fleet Profile—KC MetroKC Metro provides public transit service to King County, Washington. Its service area covers more than 2,000 square miles, including the Seattle metro area, and contains more than 2 million residents. Figure 3-1 is a map showing part of KC Metro’s service area (the shaded Bellevue region can be seen in greater detail in Figure 3-7). KC Metro’s bus fleet operates on 215 routes and serves
Figure 3-1 KC Metro Service Area Map with Shaded Bellevue Region

SECTION 3: KC METRO BEB EVALUATION RESULTS
FEDERAL TRANSIT ADMINISTRATION 16
approximately 395,000 passengers each weekday, on average. Its fleet of 1,500+ vehicles contains buses of several different propulsion types, including standard and hybrid diesel buses, battery electric buses and electric trolley buses.
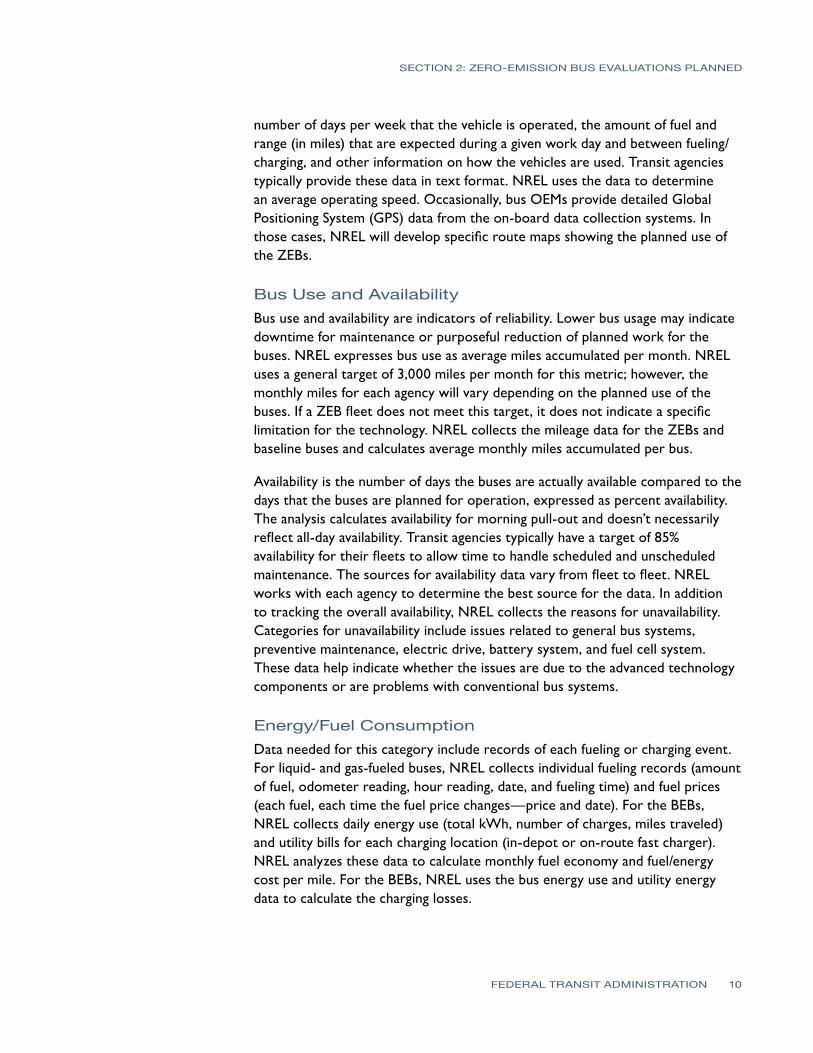
In 2010, KC Metro received funding from a TIGGER award to add three zero-emission BEBs to its fleet. The agency selected Proterra’s 40-foot Catalyst BEB for the project. Proterra was founded in 2004 with the mission to develop and manufacture advanced technology all-electric heavy-duty vehicles. The Catalyst BEB features a lightweight composite body and is capable of fast charging at stops along its route.
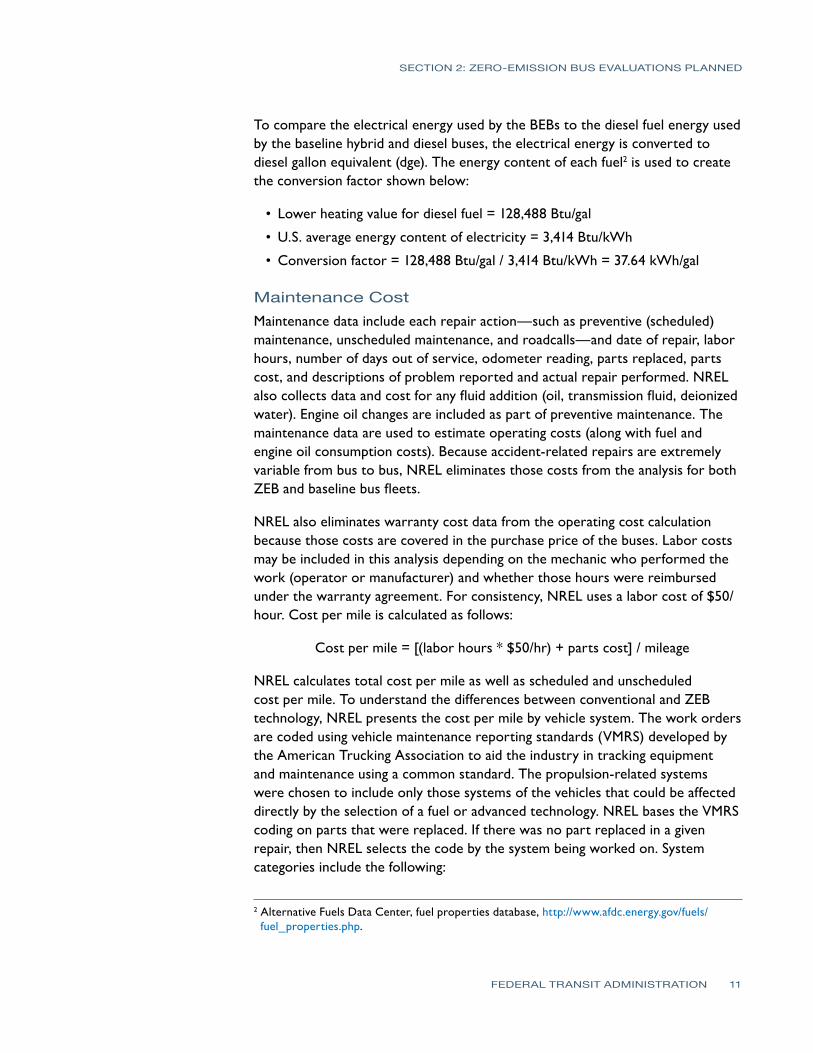
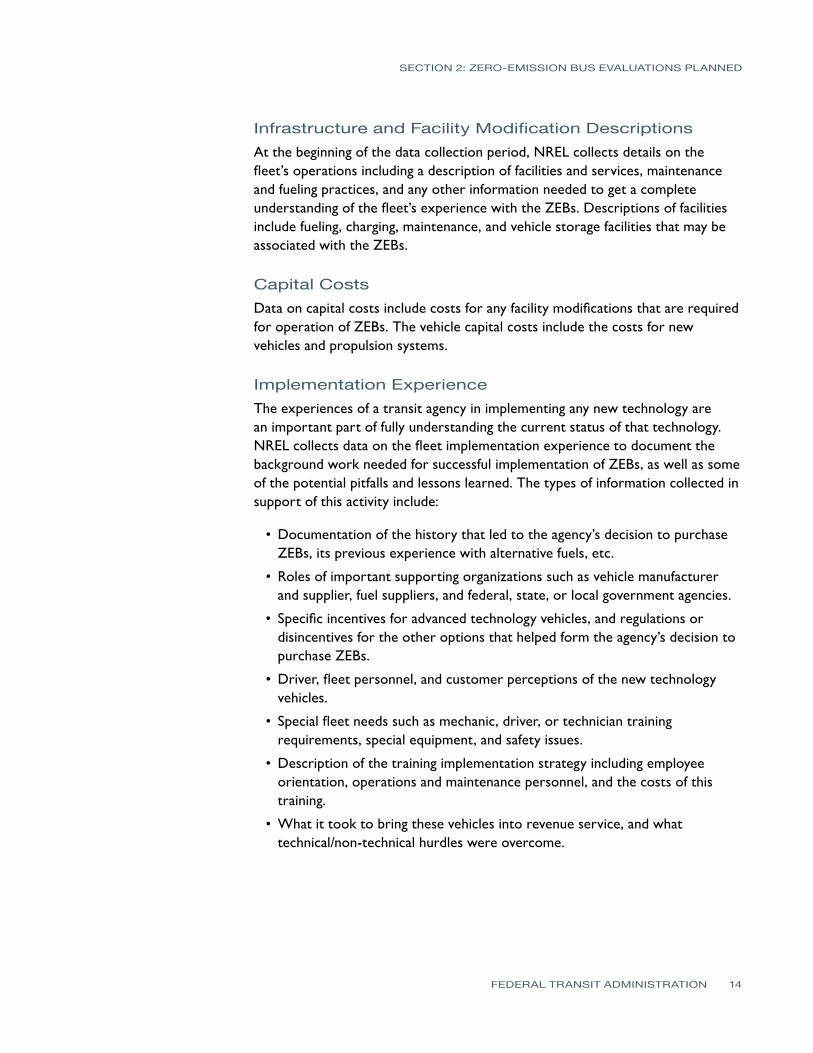
Bus Technology DescriptionsThe BEBs in service at KC Metro are fast-charge, composite buses built by Proterra. Based on the in-service buses that KC Metro had available, NREL selected three technologies for comparison to the BEBs including standard diesel buses from Gillig as well as diesel hybrid and electric trolley buses on New Flyer’s Xcelsior platform. Buses in all four fleets are 40-foot, model year 2015 buses. The four bus fleets included in the evaluation are referred to in this analysis as the battery fleet, hybrid fleet, diesel fleet and trolley fleet. Table 3-1 provides selected specifications for each bus type. Figure 3-2 is a photo of one of the battery buses. The baseline buses are pictured in Figure 3-3, Figure 3-4, and Figure 3-5.
Table 3-1 System Descriptions for the Battery Electric, Hybrid, Diesel, and Trolley Buses
Vehicle System Battery Hybrid Diesel Trolley
Number of buses in evaluation
3 10 3 10
Bus manufacturer Proterra New Flyer Gillig New Flyer
Bus year and model 2015 Catalyst 2015 Xcelsior hybrid 2015 G27D102N4 2015 Xcelsior trolley
Length (ft) 42.5 41 40 41
Motor or enginePermanent magnet, UQM,
PP220Diesel engine, Cummins
ISB-280, 6.7LDiesel engine, Cummins ISL
Traction motor, 3 phase asynchronous AC
Rated power 220 kW peak (295 hp) 280 hp @ 2,700 rpm 280 hp @ 2,200 rpm 240 kW
Energy storageLithium-titanate batteries, TerraVolt 331 volts, 105
kWh total energy
Lithium-ion/FePO4 batteries, 630 volts, 11.6
kWh total energyNone
Lithium-ion/FePO4 batteries, 436 volts, 21
kWh total energy
Accessories Electric Electric Mechanical Electric
Bus purchase cost $797,882 $584,591 $497,103 $892,960
SECTION 3: KC METRO BEB EVALUATION RESULTS
FEDERAL TRANSIT ADMINISTRATION 17
Figure 3-2 KC Metro Proterra
Catalyst Battery Electric Bus
Figure 3-3 KC Metro New Flyer
Diesel Hybrid Bus
Figure 3-4 Gillig Diesel Bus Operated by KC Metro for Sound
Transit (photo courtesy of KC Metro)

SECTION 3: KC METRO BEB EVALUATION RESULTS
FEDERAL TRANSIT ADMINISTRATION 18
Charging and Maintenance FacilitiesThe battery buses and hybrid buses operate out of KC Metro’s Bellevue Base. The diesel buses are part of Sound Transit’s fleet but are operated by KC Metro out of the agency’s East Base, which is across the street from the Bellevue Base. The trolley buses operate in downtown Seattle and are housed and maintained at KC Metro’s Atlantic Base. KC Metro staff maintains all the baseline buses including performing most warranty work. The agency invoices the individual OEMs for reimbursement of any work covered under warranty. Proterra has an on-site technician that handles all warranty work on the battery buses. Operators are expected to charge the buses at the fast-charge station prior to returning to the base at the end of each day. KC Metro uses a slow charger at the base for times when a bus needs additional charging. The installation of this slow charger was the only modification needed to allow maintenance of the battery buses inside the facility. Once KC Metro installs a fast charger at the base, the need to fully charge the BEBs at the end of the day will no longer be necessary.
KC Metro installed a fast charger at its Eastgate Park and Ride to charge the buses. Figure 3-6 shows the fast-charge station.
Figure 3-5 KC Metro New Flyer
Electric Trolley Bus

SECTION 3: KC METRO BEB EVALUATION RESULTS
FEDERAL TRANSIT ADMINISTRATION 19
In-Service Operations Evaluation ResultsThis section focuses on the results of a full year of operation from April 2016 through March 2017 (the evaluation period). KC Metro put the battery buses into service in February 2016. The diesel and trolley buses were placed into service at about the same time as the battery buses. The diesel hybrid buses were placed into service in 2015. The average odometer reading for each fleet at the start of the evaluation was 2,274 miles for the battery buses, 25,351 miles for the hybrid buses, 1,046 miles for the diesel buses, and 901 miles for the trolleys.
Route AssignmentsKC Metro primarily operates the battery buses on routes 226 and 241, which each connect the Bellevue Transit Center to the Eastgate Park-and-Ride and together form a loop around the Bellevue/East Bellevue area. Figure 3-7 shows the two routes on which the battery buses operate. These routes existed prior to the deployment of the battery buses.
Figure 3-6 Fast-Charge Station at
KC Metro Park-and-Ride

SECTION 3: KC METRO BEB EVALUATION RESULTS
FEDERAL TRANSIT ADMINISTRATION 20
Figure 3-7 Route Map for KC Metro Routes 226 and 241
The battery buses charge at the fast-charge station during every pass through the Eastgate Park and Ride. Figure 3-8 displays the power and state of charge (SOC) of the ESS for one example charge/drive cycle along this route. After a fast charge returns the ESS to a high SOC, the SOC slowly decreases as the bus drives along the route. Some of the discharge power required to accelerate the bus is returned to the ESS through regenerative braking when the bus slows down. The next stop at the Eastgate fast charger boosts the SOC from 25% to nearly 100% in approximately 10 minutes.

SECTION 3: KC METRO BEB EVALUATION RESULTS
FEDERAL TRANSIT ADMINISTRATION 21
Figure 3-8 Battery Charge and Discharge Power and State of Charge for One Example Charge Cycle
Based on scheduled revenue service, the battery buses have an average speed of 14.8 mph. The hybrid buses are randomly dispatched from the Bellevue base and cover all routes, including some commuter service. This results in a slightly faster average speed, at 15.2 mph. The diesel buses operate on a specific route for Sound Transit with an average speed of 14.6 mph. The trolley buses operate out of the Atlantic base and are limited to the network of catenary lines in and around downtown Seattle. The trolley buses have on-board energy storage that allows off-wire capability for a short range to change from wire to wire or avoid temporary blockage of the street. Because they operate in the heavily congested downtown area, the average speed for the trolley buses is much lower than that of the other fleets, at 9.0 mph. These average speeds are calculated using revenue service schedules and do not include deadhead or out of service miles.
Bus Use Figure 3-9 tracks the accumulated mileage and operating hours of the battery buses since they were placed into service. KC Metro has been operating the battery buses continuously since February 2016, accumulating almost 100,000 total fleet miles by the end of March 2017.

SECTION 3: KC METRO BEB EVALUATION RESULTS
FEDERAL TRANSIT ADMINISTRATION 22
Figure 3-9 Cumulative Miles and Hours for Battery Bus Fleet
Table 3-2 provides the evaluation period mileage for each bus and the average monthly mileage by bus type, which is also displayed in Figure 3-10. The battery buses each averaged between 1,200 and 3,100 miles per month, with an overall fleet average of 2,309 monthly miles per bus. This is lower than the baseline hybrid bus fleet average of 3,659 monthly miles per bus but higher than the diesel and trolley bus fleet averages of 1,952 and 1,486 monthly miles per bus, respectively. These differences are a result of the planned operation of these fleets. The battery fleet is restricted to lines 226 and 241 and the hybrid fleet is randomly dispatched on all routes, including commuter routes with higher speeds which allows faster mileage accumulation.
Proterra was the primary source of data for the battery fleet mileage, charges, and energy use during this evaluation. Proterra’s data collection system malfunctioned during March 2017, resulting in a partial loss of data. To fill in the gap in the Proterra data set, NREL obtained daily mileage totals from KC Metro. The information presented in this report is a hybrid of mileage data from Proterra and KC Metro to properly capture all the fleet mileage. Prior to creating the hybrid data set, NREL verified that the records matched closely by comparing the Proterra and KC Metro data sets during months for which there were no data losses.

SECTION 3: KC METRO BEB EVALUATION RESULTS
FEDERAL TRANSIT ADMINISTRATION 23
Figure 3-10 Average Monthly Miles for All Four Bus Fleets
Table 3-2 Average Monthly
Mileage (Evaluation Period)
Bus # Total Mileage Months
Average Monthly Mileage
Bus # Total Mileage Months
Average Monthly Mileage
4601 27,769 12 2,314 9124 22,231 12 1,853
4602 29,875 12 2,490 9125 24,091 12 2,008
4603 25,484 12 2,124 9126 23,007 12 1,917
Battery fleet 83,128 36 2,309 Diesel fleet 69,329 36 1,926
7239 50,912 12 4,243 4364 17,969 12 1,497
7241 46,888 12 3,907 4371 19,195 12 1,600
7245 49,780 12 4,148 4373 16,941 12 1,412
7246 45,338 12 3,778 4374 18,276 12 1,523
7247 46,376 12 3,865 4375 17,837 12 1,486
7249 47,034 12 3,920 4376 17,139 12 1,428
7250 40,185 12 3,349 4377 16,781 12 1,398
7252 36,305 12 3,025 4380 19,289 12 1,607
7253 34,532 12 2,878 4383 18,989 12 1,582
7254 38,202 12 3,184 4384 18,138 12 1,512
Hybrid fleet 435,552 120 3,630 Trolley fleet 180,554 120 1,505
SECTION 3: KC METRO BEB EVALUATION RESULTS
FEDERAL TRANSIT ADMINISTRATION 24
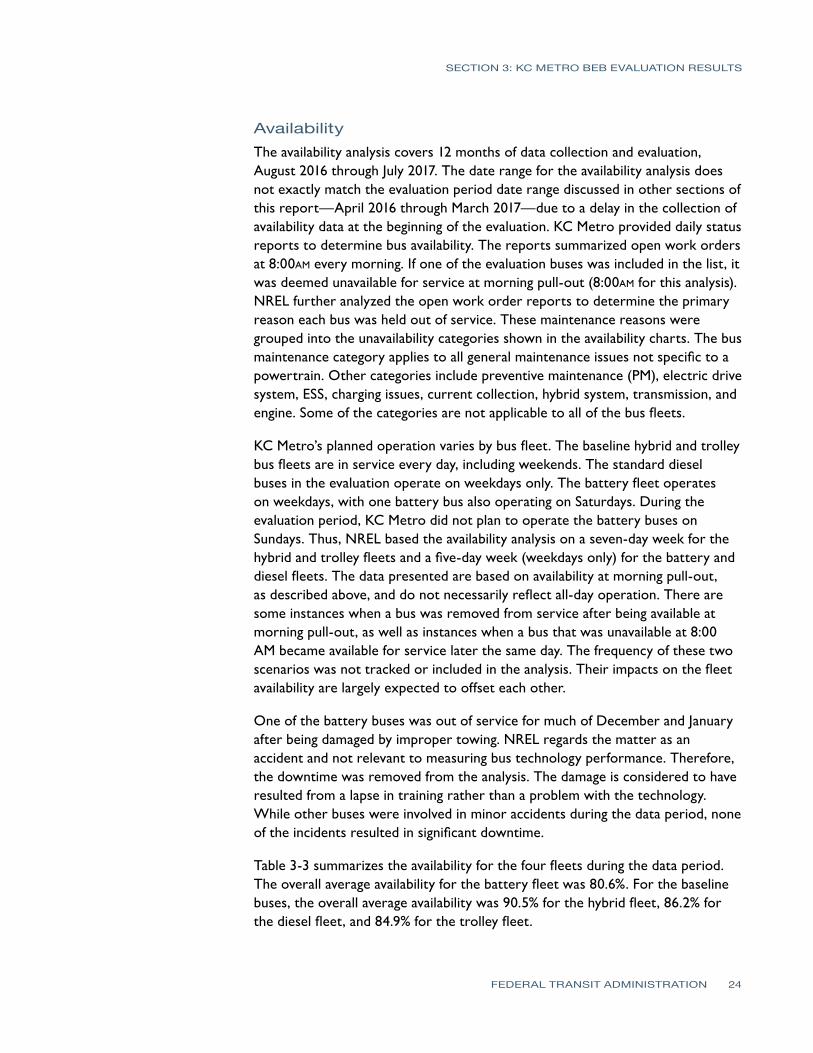
AvailabilityThe availability analysis covers 12 months of data collection and evaluation, August 2016 through July 2017. The date range for the availability analysis does not exactly match the evaluation period date range discussed in other sections of this report—April 2016 through March 2017—due to a delay in the collection of availability data at the beginning of the evaluation. KC Metro provided daily status reports to determine bus availability. The reports summarized open work orders at 8:00am every morning. If one of the evaluation buses was included in the list, it was deemed unavailable for service at morning pull-out (8:00am for this analysis). NREL further analyzed the open work order reports to determine the primary reason each bus was held out of service. These maintenance reasons were grouped into the unavailability categories shown in the availability charts. The bus maintenance category applies to all general maintenance issues not specific to a powertrain. Other categories include preventive maintenance (PM), electric drive system, ESS, charging issues, current collection, hybrid system, transmission, and engine. Some of the categories are not applicable to all of the bus fleets.
KC Metro’s planned operation varies by bus fleet. The baseline hybrid and trolley bus fleets are in service every day, including weekends. The standard diesel buses in the evaluation operate on weekdays only. The battery fleet operates on weekdays, with one battery bus also operating on Saturdays. During the evaluation period, KC Metro did not plan to operate the battery buses on Sundays. Thus, NREL based the availability analysis on a seven-day week for the hybrid and trolley fleets and a five-day week (weekdays only) for the battery and diesel fleets. The data presented are based on availability at morning pull-out, as described above, and do not necessarily reflect all-day operation. There are some instances when a bus was removed from service after being available at morning pull-out, as well as instances when a bus that was unavailable at 8:00 AM became available for service later the same day. The frequency of these two scenarios was not tracked or included in the analysis. Their impacts on the fleet availability are largely expected to offset each other.
One of the battery buses was out of service for much of December and January after being damaged by improper towing. NREL regards the matter as an accident and not relevant to measuring bus technology performance. Therefore, the downtime was removed from the analysis. The damage is considered to have resulted from a lapse in training rather than a problem with the technology. While other buses were involved in minor accidents during the data period, none of the incidents resulted in significant downtime.
Table 3-3 summarizes the availability for the four fleets during the data period. The overall average availability for the battery fleet was 80.6%. For the baseline buses, the overall average availability was 90.5% for the hybrid fleet, 86.2% for the diesel fleet, and 84.9% for the trolley fleet.

SECTION 3: KC METRO BEB EVALUATION RESULTS
FEDERAL TRANSIT ADMINISTRATION 25
Table 3-3 Summary of Availability by Bus for All Four Fleets
Bus # Planned Days
Available Days
Percent Availability Bus # Planned
DaysAvailable
DaysPercent
Availability
4601 235 193 82.1% 9124 259 223 86.1%
4602 259 202 78.0% 9125 259 222 85.7%
4603 259 212 81.9% 9126 259 226 87.3%
Battery fleet 753 607 80.6% Diesel fleet 777 671 86.4%
7239 363 331 91.2% 4364 363 324 89.3%
7241 363 293 80.7% 4371 363 338 93.1%
7245 363 329 90.6% 4373 363 326 89.8%
7246 363 335 92.3% 4374 363 284 78.2%
7247 363 325 89.5% 4375 363 324 89.3%
7249 363 326 89.8% 4376 363 290 79.9%
7250 363 347 95.6% 4377 363 311 85.7%
7252 363 341 93.9% 4380 363 333 91.7%
7253 363 324 89.3% 4383 363 326 89.8%
7254 363 335 92.3% 4384 363 225 62.0%
Hybrid fleet 3630 3286 90.5% Trolley fleet 3630 3081 84.9%
Figure 3-11 tracks the monthly average availability for the battery bus fleet and the baseline bus fleets as line series along the top of the chart. The three baseline fleets generally maintained availability above 80% during the data period. After a few months of initially high availability, the battery bus fleet experienced a significant drop in availability in December 2016. Much of this unavailability was downtime from only one of the battery buses, which developed problems with the HVAC system and roof of the bus body.
The stacked columns in Figure 3-11 show the number of days that the battery buses were unavailable, organized into five categories. For most months, the primary reason for battery bus downtime was general bus maintenance issues that are not related to the energy storage or electric drive systems. A chart showing the monthly availability trends for the individual battery buses is included in the Appendix.

SECTION 3: KC METRO BEB EVALUATION RESULTS
FEDERAL TRANSIT ADMINISTRATION 26
1. Target of 85% fleet availability is a general expectation for transit agencies
Figure 3-11 Monthly Availability for All Four Bus Fleets and Reasons for Unavailability for Battery Fleet
Figure 3-12 shows the percentage of days that each bus fleet was available for service and the reasons for unavailability for the percentage of days the buses were out of service. This chart represents the availability data period of August 2016 through July 2017. Issues relating to general bus maintenance accounted for most of the downtime for all four fleets, ranging from 6.2% to 12.1% of the total planned service time for each fleet. Electric drive system issues accounted for 4.8% of the total battery fleet time. Some of these issues are discussed in more detail in the Summary of Achievements and Challenges section. The trolley bus fleet experienced several issues with the current collection system (including the shoes, poles, etc.) that connects to the catenary wire system to transfer electric power to the bus. This downtime accounted for 3.7% of the trolley fleet’s planned service time. The hybrid and diesel buses in this evaluation experienced few problems that caused downtime other than general bus maintenance. Table 3-4 corresponds to Figure 3-12 and provides a fleet-level breakdown of the availability percentages for each category.

SECTION 3: KC METRO BEB EVALUATION RESULTS
FEDERAL TRANSIT ADMINISTRATION 27
Figure 3-12 Overall Availability
for All Four Bus Fleets during Evaluation
Period
Table 3-4 Summary of Availability and Unavailability by Category for All Four Fleets
Category Battery # Days
Battery %
Hybrid # Days
Hybrid %
Diesel # Days
Diesel %
Trolley # Days
Trolley %
Planned days 753 - 3,630 - 777 - 3,630 -
Days available 607 80.6% 3,286 90.5% 671 86.4% 3,081 84.9%
Unavailable 146 19.4% 344 9.5% 106 13.6% 549 15.1%
Bus 83 11.0% 249 6.9% 89 11.5% 224 6.2%
PM 15 2.0% 39 1.1% 4 0.5% 49 1.3%
Electric drive 45 6.0% - - - - 141 3.9%
ESS 1 0.1% - - - - 2 0.1%
Charging issues 0 0.0% - - - - - -
Current collection - - - - - - 133 3.7%
Hybrid system - - 25 0.7% - - - -
Transmission 2 0.3% 0 0.0% 4 0.5% - -
Engine - - 31 0.9% 9 1.2% - -

SECTION 3: KC METRO BEB EVALUATION RESULTS
FEDERAL TRANSIT ADMINISTRATION 28
Energy Use, Fuel Economy, and CostOperating primarily on routes 226 and 241, the battery buses stop to charge at each pass through the Eastgate Park and Ride. Because the battery buses are on a fixed route and consistent schedule, the number of battery fleet charges per month is largely dictated by the availability of the battery buses—that is, how often all three battery buses operated each month—and thus, the number of charges corresponds directly to the miles traveled by the battery fleet each month. The monthly energy consumption of the battery fleet generally corresponds to the number of monthly charges but it also varies from month to month based on factors that affect bus fuel efficiency, such as ridership, operator driving habits, traffic, and weather conditions. This monthly energy consumption (bus-side) is measured from the ESS of the battery buses; the total energy purchased from the utility (grid-side) is discussed below.
Figure 3-13 shows the monthly total energy consumption and number of charges for the battery buses. Throughout most of the evaluation period, the battery fleet charged between 400 and 500 times per month. The number of charges dropped in December, January, and February; this is consistent with the lower accumulated mileage due to the reduced service of the battery buses in these months. The battery fleet averaged 16.3 miles per charge during the data period. The monthly energy consumption for the battery fleet varied between 10,000 kWh and 19,000 kWh, with most months exceeding 15,000 kWh. The battery buses received 38.5 kWh per charge, on average. The monthly average energy per charge varied throughout the year as the fuel economy/efficiency changes, from a low of 34.3 kWh/charge to a high of 45.9 kWh/charge.
Figure 3-13 Monthly Charges and Monthly Energy Consumption for Battery Fleet
SECTION 3: KC METRO BEB EVALUATION RESULTS
FEDERAL TRANSIT ADMINISTRATION 29
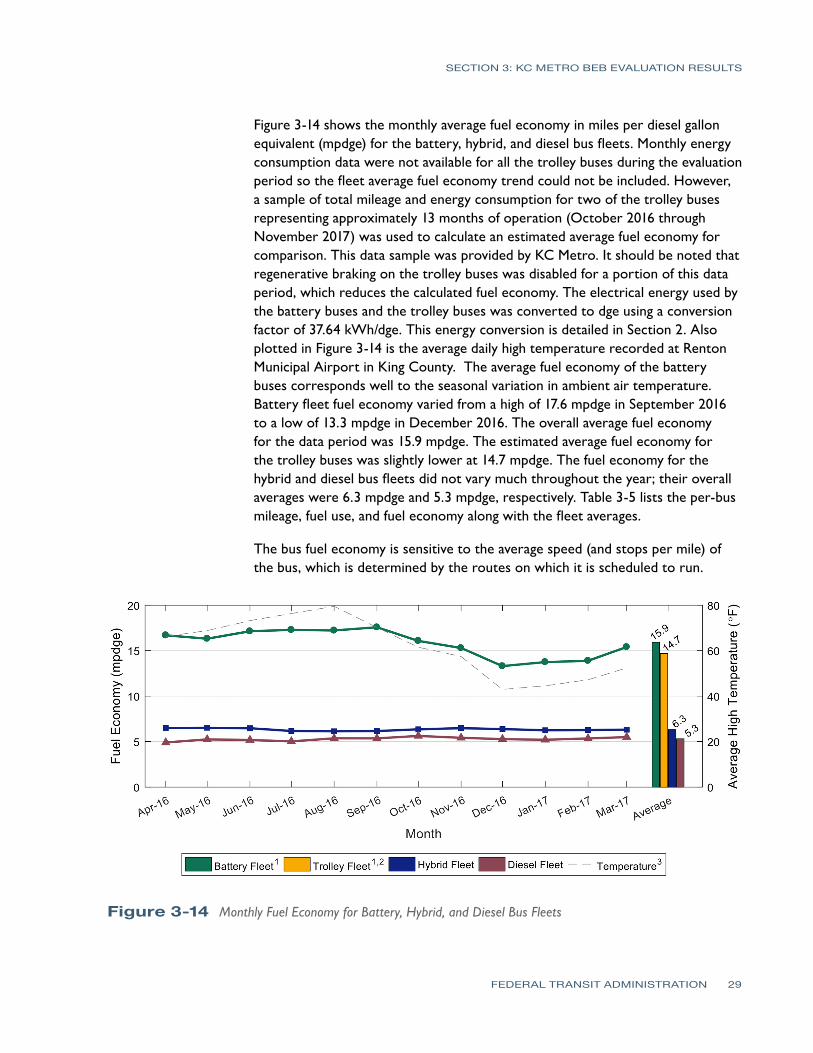
Figure 3-14 shows the monthly average fuel economy in miles per diesel gallon equivalent (mpdge) for the battery, hybrid, and diesel bus fleets. Monthly energy consumption data were not available for all the trolley buses during the evaluation period so the fleet average fuel economy trend could not be included. However, a sample of total mileage and energy consumption for two of the trolley buses representing approximately 13 months of operation (October 2016 through November 2017) was used to calculate an estimated average fuel economy for comparison. This data sample was provided by KC Metro. It should be noted that regenerative braking on the trolley buses was disabled for a portion of this data period, which reduces the calculated fuel economy. The electrical energy used by the battery buses and the trolley buses was converted to dge using a conversion factor of 37.64 kWh/dge. This energy conversion is detailed in Section 2. Also plotted in Figure 3-14 is the average daily high temperature recorded at Renton Municipal Airport in King County. The average fuel economy of the battery buses corresponds well to the seasonal variation in ambient air temperature. Battery fleet fuel economy varied from a high of 17.6 mpdge in September 2016 to a low of 13.3 mpdge in December 2016. The overall average fuel economy for the data period was 15.9 mpdge. The estimated average fuel economy for the trolley buses was slightly lower at 14.7 mpdge. The fuel economy for the hybrid and diesel bus fleets did not vary much throughout the year; their overall averages were 6.3 mpdge and 5.3 mpdge, respectively. Table 3-5 lists the per-bus mileage, fuel use, and fuel economy along with the fleet averages.
The bus fuel economy is sensitive to the average speed (and stops per mile) of the bus, which is determined by the routes on which it is scheduled to run.
Figure 3-14 Monthly Fuel Economy for Battery, Hybrid, and Diesel Bus Fleets

SECTION 3: KC METRO BEB EVALUATION RESULTS
FEDERAL TRANSIT ADMINISTRATION 30
Bus Mileage (fuel base)
Fuel Consumption
(kWh)
Fuel Consumption
(dge)
Fuel Economy (kWh/mi)
Fuel Economy (mpdge)
4601 25,163 58,851 1,564 2.34 16.09
4602 28,542 67,545 1,795 2.37 15.91
4603 23,858 56,859 1,511 2.38 15.79
Battery fleet 77,563 183,255 4,869 2.36 15.93
7239 49,768 - 7,853 - 6.34
7241 45,544 - 7,236 - 6.29
7245 49,226 - 7,649 - 6.44
7246 44,684 - 7,153 - 6.25
7247 45,742 - 7,462 - 6.13
7249 46,515 - 7,580 - 6.14
7250 39,799 - 6,335 - 6.28
7252 36,563 - 5,563 - 6.57
7253 33,958 - 5,348 - 6.35
7254 38,037 - 5,697 - 6.68
Hybrid fleet 429,836 - 67,874 - 6.33
9124 22,231 - 4,238 - 5.25
9125 23,662 - 4,463 - 5.30
9126 22,319 - 4,207 - 5.31
Diesel fleet 68,212 - 12,909 - 5.28
4371 29,253 73,951 1,965 2.53 14.89
4375 32,527 84,533 2,246 2.60 14.48
Trolley fleeta 61,780 158,484 4,211 2.57 14.67a Trolley fleet fuel economy estimated based on data from two trolley buses during 13 months of operation.
Figure 3-15 compares the average cost per mile for each fleet’s transportation fuel—electricity for the battery fleet and diesel fuel for the baseline hybrid and diesel fleets. The per-mile fuel cost is a function of the unit price of the fuel and the fuel efficiency of the buses. The per-mile fuel costs for the diesel and hybrid buses varied only slightly throughout the evaluation period because these two factors (diesel price and bus fuel economy) both remained relatively constant. The fuel economy advantage of the hybrid fleet over the diesel fleet results in a slightly lower per-mile fuel cost for the hybrid fleet ($0.25/mi) compared to the diesel fleet ($0.30/mi). The battery fleet experienced higher per-mile fuel costs ($0.57/mi) than the baseline fleets, especially during the winter months. This trend is a result of the battery fleet’s lower fuel economy during the winter and higher electricity rates during the winter. The higher electricity rates were compounded by the fact that the battery fleet traveled fewer miles in December, January, and February, which resulted in higher costs from demand charges on a per-mile basis. The electricity cost per mile calculation includes all electricity that KC Metro purchased from the utility. It does not exclude any charging
Table 3-5 Mileage, Fuel Use, and Fuel Economy

SECTION 3: KC METRO BEB EVALUATION RESULTS
FEDERAL TRANSIT ADMINISTRATION 31
losses from transferring the electricity to the battery buses. In other words, this represents the “grid-side” cost per mile, not the “bus-side” cost per mile that would be calculated from the average bus fuel economy and the unit price of fuel.
Figure 3-15 Monthly Fuel Cost per Mile for Battery, Hybrid, and Diesel Bus Fleets
Despite having an average fuel economy that is 2.5 to 3 times higher than that of the baseline bus fleets in the evaluation, the battery fleet had higher per-mile fuel costs due to the large difference between diesel fuel prices and electricity prices. The average price that KC Metro paid for diesel fuel was $1.60/dge and the average price paid for electricity was $0.20/kWh, or $7.66/dge. The equiv-alent electricity price is 4.8 times higher than the diesel price. A comparison of the monthly average fuel prices is provided in the Appendix.
KC Metro provided the diesel fuel prices used in this evaluation in the monthly fueling records. The electricity rates were derived from the monthly bills from KC Metro’s electric utility provider, Puget Sound Energy, which were also pro-vided by KC Metro. The utility bills are specifically for the Proterra fast charger installed at the Eastgate Park and Ride. This analysis of electricity costs does not include electricity from slow charges at the Bellevue base; these charges were infrequent and would account for a very small fraction of the total energy con-sumption of the battery fleet.
A breakdown of the component costs that make up each month’s electricity bill is shown in Figure 3-16, in units of $/kWh. Under Puget Sound Energy’s
SECTION 3: KC METRO BEB EVALUATION RESULTS
FEDERAL TRANSIT ADMINISTRATION 32
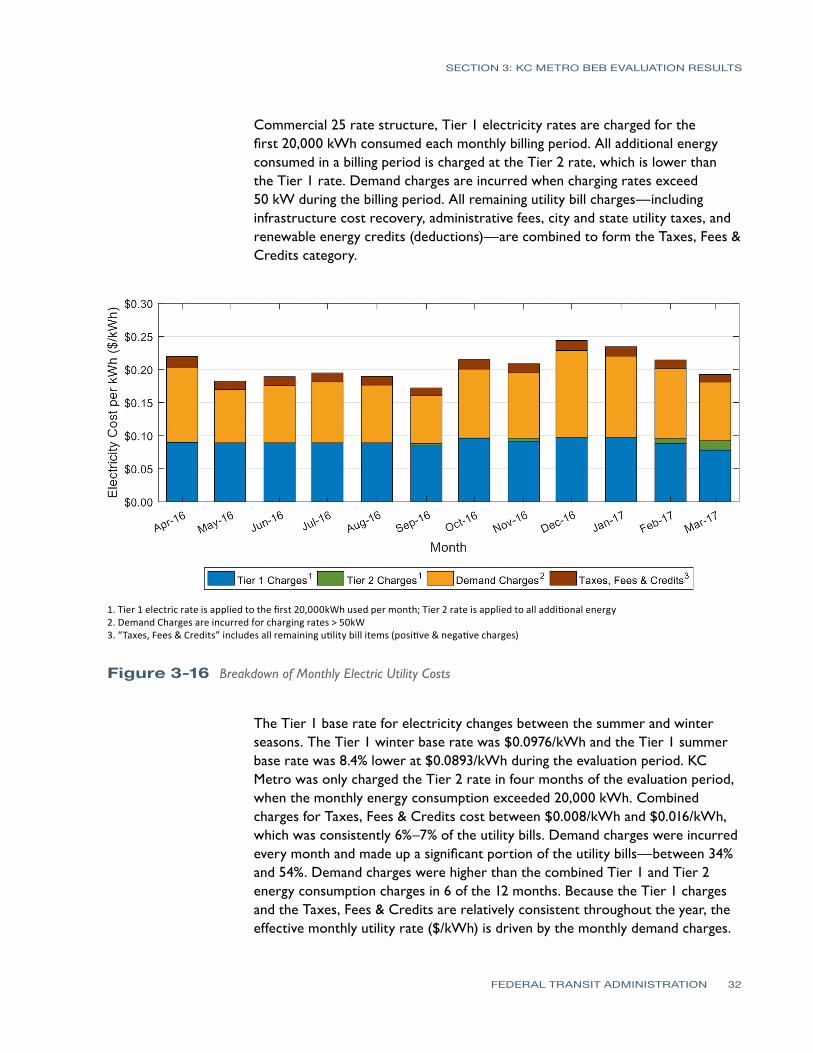
Commercial 25 rate structure, Tier 1 electricity rates are charged for the first 20,000 kWh consumed each monthly billing period. All additional energy consumed in a billing period is charged at the Tier 2 rate, which is lower than the Tier 1 rate. Demand charges are incurred when charging rates exceed 50 kW during the billing period. All remaining utility bill charges—including infrastructure cost recovery, administrative fees, city and state utility taxes, and renewable energy credits (deductions)—are combined to form the Taxes, Fees & Credits category.
1. Tier 1 electric rate is applied to the first 20,000kWh used per month; Tier 2 rate is applied to all additional energy 2. Demand Charges are incurred for charging rates > 50kW 3. “Taxes, Fees & Credits” includes all remaining utility bill items (positive & negative charges)
Figure 3-16 Breakdown of Monthly Electric Utility Costs
The Tier 1 base rate for electricity changes between the summer and winter seasons. The Tier 1 winter base rate was $0.0976/kWh and the Tier 1 summer base rate was 8.4% lower at $0.0893/kWh during the evaluation period. KC Metro was only charged the Tier 2 rate in four months of the evaluation period, when the monthly energy consumption exceeded 20,000 kWh. Combined charges for Taxes, Fees & Credits cost between $0.008/kWh and $0.016/kWh, which was consistently 6%–7% of the utility bills. Demand charges were incurred every month and made up a significant portion of the utility bills—between 34% and 54%. Demand charges were higher than the combined Tier 1 and Tier 2 energy consumption charges in 6 of the 12 months. Because the Tier 1 charges and the Taxes, Fees & Credits are relatively consistent throughout the year, the effective monthly utility rate ($/kWh) is driven by the monthly demand charges.

SECTION 3: KC METRO BEB EVALUATION RESULTS
FEDERAL TRANSIT ADMINISTRATION 33
The monthly demand charges ($/kWh) are inversely proportional to the monthly mileage of the battery fleet. Thus, the relative cost of demand charges decreases as the battery fleet mileage increases and the fast charger is more fully utilized. The charger utilization will increase as more battery buses are added to the route, or as the existing battery buses operate more frequently, or both. As a hypothetical example to illustrate this point, if the annual mileage and energy consumption of the battery fleet doubled, the utility bills would increase by 40%–50% due to the increased energy consumption (Tier 1 charges, Tier 2 charges, and Taxes, Fees and Credits are based on energy consumption). The combined costs for Tier 1 charges, Tier 2 charges, and Taxes, Fees and Credits would account for 65%–70% of the total utility bill (up from approximately 50%), and the demand charges would account for the remaining 30%–35% of the total (down from approximately 50%). While the total utility bill would increase by 40%–50%, the overall cost per mile for electricity would decrease because the mileage increased by 100%.
Table 3-6 shows the average electric utility rates ($/kWh) during the evaluation period. The overall effective rate is the total cost of the utility bills divided by the total energy consumption. The first four rows of the table show the effective rates of the four major categories that constitute the total utility bill. Demand charges were the largest, accounting for 47.9% of the utility costs. Tier 1 charges were close to demand charges, at 44.1% of the total. Taxes, Fees & Credits and Tier 2 categories only accounted for 6.6% and 1.4%, respectively. The last four rows of the table show the average effective rates that KC Metro paid during the summer and winter months, and it provides the base rates for Tier 1 charges in summer and winter for comparison.
Table 3-6 Utility Electricity Rates
Electric Rate ($/kWh)
Percent of Total
Overall effective rate for Tier 1 charges 0.0897 44.1
Overall effective rate for Tier 2 charges 0.0029 1.4
Overall effective rate for Demand charges 0.0975 47.9
Overall effective rate for Taxes, Fees, & Credits 0.0134 6.6
Overall effective rate 0.2035 100.0
Average effective rate for summer months (Apr–Sep) 0.1898 —
Average effective rate for winter months (Oct–Mar) 0.2158 —
Tier 1 base rate for summer months (Apr–Sep) 0.0893 —
Tier 1 base rate for winter months (Oct–Mar) 0.0976 —

SECTION 3: KC METRO BEB EVALUATION RESULTS
FEDERAL TRANSIT ADMINISTRATION 34
Roadcall AnalysisFigure 3-17 provides a summary of propulsion-related roadcalls for the four bus fleets in the evaluation, separated by propulsion subsystem and normalized by the number of buses in each fleet for comparison. The battery fleet experienced 4.0 propulsion-related roadcalls per bus, primarily due to the electric drive system. The hybrid and diesel bus fleets experienced some issues with the cooling system and electrical system, resulting in only 1.5 and 0.7 roadcalls per bus, respectively. The trolley fleet had an average of 6.1 propulsion system roadcalls per bus, dominated by problems with the current collection system.
Figure 3-17 Summary of Propulsion-Related Roadcalls for All Four Bus Fleets, Organized by Subsystem
Figure 3-18 provides the cumulative MBRC for the battery buses and baseline buses categorized by total bus roadcalls, propulsion-related roadcalls, and ESS-related roadcalls. Propulsion-related roadcalls are a subset of bus roadcalls for all bus fleets. ESS-related roadcalls are a subset of the propulsion-related roadcalls, specific to the ESS of the battery buses. The DOE/FTA target of 4,000 MBRC is included in the graph as a red dashed line. The ESS-related MBRC is not included in the chart because there were zero ESS-related roadcalls during the evaluation period. The diesel fleet had the highest bus MBRC at 17,332. The hybrid bus fleet achieved 7,641 MBRC. The battery fleet MBRC and trolley fleet MBRC are currently below the ultimate target.

SECTION 3: KC METRO BEB EVALUATION RESULTS
FEDERAL TRANSIT ADMINISTRATION 35
Figure 3-18 Cumulative Bus MBRC and Propulsion-Related MBRC for All Four Bus Fleets
The battery fleet propulsion-related MBRC was 6,927. Propulsion-related MBRC for the diesel and hybrid baseline fleets were similar to each other—34,665 and 29,037, respectively. The propulsion-related MBRC for the trolley buses was 2,960, which reflects the low average mileage and early issues with the current collection system. The new trolleys have shorter poles that are mounted closer to the front of the bus than they were on KC Metro’s earlier-design trolleys. KC Metro has experienced several issues with the system including wearing of the wires and the poles coming off the wires unexpectedly. Downtown road conditions in the city compound the situation. There are many areas where the road surface crowns and causes the system to flex with the bus movement, resulting in the poles coming off the wires. In addition, the wire tends to sag in the summer during hot days creating a worst-case scenario. KC Metro is working closely with the manufacturer to find a solution to the problem and expects the incidents to decrease.
Maintenance AnalysisThis section first covers total maintenance costs and then maintenance costs by bus system. As mentioned in Section 2, NREL excludes warranty repairs from the calculations. The battery buses were under warranty for the entire data period. A Proterra technician stationed at the base handles most of the repair work on the advanced technology components. KC Metro mechanics handle much of the general bus repair and assist the Proterra technician as needed. The

SECTION 3: KC METRO BEB EVALUATION RESULTS
FEDERAL TRANSIT ADMINISTRATION 36
warranty for the hybrid and diesel buses ended early in the data period. The trolley buses were under warranty for the majority of the data period. KC Metro typically handles all warranty work for its buses and submits claims to the OEM for reimbursement. As a result, the work orders submitted for analysis include costs that should be covered under warranty. NREL worked with the agency to collect the warranty claims and remove those costs from the data set.
Total Work Order Maintenance CostsTable 3-7 shows maintenance costs per mile for the four bus fleets and includes total cost, scheduled cost, and unscheduled cost. Scheduled costs include PM based on the OEMs’ recommendations. All other maintenance is included in unscheduled costs. During the data period, the maintenance cost for the battery buses was 17.8% less than that of the hybrid buses; 44.1% less than that of the diesel buses; and 43.2% less than that of the trolley buses.
Table 3-7 Total Work Order
Maintenance Costs
Bus Fleet Mileage Parts ($) Labor Hours
Scheduled Cost per Mile ($)
Unscheduled Cost per Mile
($)
Total Cost per Mile
($)
4601 27,769 693.79 108.5 0.04 0.18 0.22
4602 29,875 962.95 120.5 0.02 0.21 0.23
4603 25,484 317.94 162.8 0.06 0.27 0.33
Total Battery 83,127 1,974.69 391.8 0.04 0.22 0.26
7239 47,898 4,183.35 190.7 0.12 0.17 0.29
7241 46,888 4,404.99 225.1 0.08 0.25 0.33
7245 49,780 1,565.69 206.8 0.09 0.15 0.24
7246 45,338 3,669.04 291.1 0.09 0.31 0.40
7247 46,376 2,604.87 224.1 0.09 0.21 0.30
7249 47,034 4,117.16 253.4 0.09 0.27 0.36
7250 40,185 1,755.08 197.1 0.10 0.19 0.29
7252 36,305 1,835.44 161.1 0.08 0.19 0.27
7253 34,532 2,432.33 227.2 0.07 0.33 0.40
7254 38,202 2,943.51 180.8 0.10 0.22 0.31
Total Hybrid 432,538 29,511.45 2,157.1 0.09 0.23 0.32
9124 22,231 1,705.01 190.3 0.08 0.43 0.50
9125 24,091 3,207.66 180.6 0.08 0.43 0.51
9126 23,007 1,024.52 153.5 0.08 0.30 0.38
Total Diesel 69,329 5,937.19 524.3 0.08 0.39 0.46
4364 17,969 964.54 163.3 0.03 0.48 0.51
4371 19,195 587.38 138.0 0.02 0.37 0.39
4373 16,941 884.20 168.5 0.03 0.52 0.55
4374 18,276 785.54 128.9 0.02 0.38 0.40
4375 17,837 750.56 147.4 0.03 0.42 0.46

SECTION 3: KC METRO BEB EVALUATION RESULTS
FEDERAL TRANSIT ADMINISTRATION 37
Bus Fleet Mileage Parts ($) Labor Hours
Scheduled Cost per Mile ($)
Unscheduled Cost per Mile
($)
Total Cost per Mile
($)
4376 17,139 4,021.67 143.2 0.05 0.60 0.65
4377 16,781 847.99 144.6 0.05 0.43 0.48
4380 19,289 1,159.07 121.9 0.05 0.33 0.38
4383 18,989 1,080.04 143.1 0.03 0.40 0.43
4384 18,138 383.67 122.4 0.03 0.32 0.36
Total Trolley 180,554 11,464.65 1,421.0 0.04 0.42 0.46
The monthly scheduled and unscheduled maintenance cost per mile for the four fleets of buses are shown as stacked columns in Figure 3-19.
Table 3-7 cont’d
Total Work Order Maintenance Costs
Figure 3-19 Monthly Scheduled and Unscheduled Maintenance Cost per Mile for All Four Bus Fleets
Work Order Maintenance Costs Categorized by SystemTable 3-8 shows maintenance costs per mile by vehicle system and bus fleet (without warranty costs). The color shading denotes the systems with the highest percentage of maintenance costs: orange for the highest, green for the second highest, and purple for the third highest. The vehicle systems shown in the table are as follows:

SECTION 3: KC METRO BEB EVALUATION RESULTS
FEDERAL TRANSIT ADMINISTRATION 38
• Cab, body, and accessories – includes body, glass, cab and sheet metal, seats and doors, and accessory repairs such as hubodometers and radios
• Propulsion-related systems – repairs for exhaust, fuel, engine, electric motors, battery modules, propulsion control, non-lighting electrical (charging, cranking and ignition), air intake, cooling, and transmission
• PMI – labor for inspections during preventive maintenance
• Brakes – includes brake pads, disks, calipers, anti-lock braking system, and brake chambers
• Frame, steering, and suspension
• HVAC
• Lighting
• Air system (general)
• Axles, wheels, and drive shaft
• Tires
Table 3-8 Work Order Maintenance Cost per Mile by Systema
System
Battery Cost per
Mile ($)
Battery Percent of Total
(%)
Hybrid Cost per
Mile ($)
Hybrid Percent of Total
(%)
Diesel Cost per
Mile ($)
Diesel Percent of Total
(%)
Trolley Cost per
Mile ($)
Trolley Percent of Total
(%)
Propulsion-related 0.05 18.6 0.12 38.0 0.13 27.8 0.17 37.5
Cab, body, and accessories 0.13 49.7 0.12 36.7 0.24 50.7 0.19 40.6
PMI 0.03 10.8 0.04 12.0 0.04 8.4 0.03 5.7
Brakes 0.01 4.5 0.01 2.2 0.03 5.9 0.01 1.9
Frame, steering, and suspension 0.00 1.0 0.01 2.2 0.00 0.4 0.01 1.4
HVAC 0.01 4.4 0.01 2.9 0.02 5.0 0.05 9.9
Lighting 0.01 2.7 0.01 1.7 0.00 0.3 0.00 1.0
General air system repairs 0.01 4.1 0.01 3.2 0.00 1.1 0.01 1.7
Axles, wheels, and drive shaft 0.00 0.0 0.00 0.3 0.00 0.2 0.00 0.2
Tires 0.01 4.1 0.00 0.7 0.00 0.2 0.00 0.1
Total 0.26 100 0.32 100 0.46 100 0.46 100a The top three categories for maintenance for each fleet are color coded as follows: orange–highest, green–second highest, and purple–third highest.
The systems with the highest percentage of maintenance costs for the battery buses and diesel buses were 1) cab, body, and accessories; 2) propulsion-related; and 3) PMI. The systems with the highest percentage of maintenance costs for the hybrid buses were 1) propulsion-related; 2) cab, body, and accessories; and 3) PMI. The systems with the highest percentage of maintenance costs for the trolley buses were 1) cab, body, and accessories; 2) propulsion-related; and 3) HVAC. Figure 3-20 shows the monthly cost per mile by system for the battery

SECTION 3: KC METRO BEB EVALUATION RESULTS
FEDERAL TRANSIT ADMINISTRATION 39
fleet. The maintenance costs for the battery buses increased toward the end of the data period, primarily driven by cab, body, and accessories costs as well as some propulsion-related costs.
Figure 3-20 Monthly Maintenance Cost per Mile by System for Battery Bus Fleet
Figure 3-21 shows the monthly cost per mile by system for the hybrid fleet. The overall cost per mile for the hybrid buses was consistent during most of the data period. Cab, body, and accessories issues that resulted in higher maintenance costs included problems with water leaks, a broken windshield, and a farebox replacement. Propulsion system issues included cooling leaks, a tune-up, traction motor replacement, and a failed nitrogen oxides (NOx) sensor.

SECTION 3: KC METRO BEB EVALUATION RESULTS
FEDERAL TRANSIT ADMINISTRATION 40
Figure 3-21 Monthly Maintenance Cost per Mile by System for Hybrid Bus Fleet
Figure 3-22 shows the monthly cost per mile by system for the diesel fleet. The majority of issues with the diesel buses were in the cab, body, and accessories category. Issues include problems with a destination sign, windshield wipers, and a radio. Propulsion category issues included problems with the electrical system and low-voltage batteries.

SECTION 3: KC METRO BEB EVALUATION RESULTS
FEDERAL TRANSIT ADMINISTRATION 41
Figure 3-22 Monthly Maintenance Cost per Mile by System for Diesel Bus Fleet
Figure 3-23 shows the monthly cost per mile by system for the trolley fleet. Issues experienced in the cab, body, and accessories category included repairs for radios and fareboxes. Propulsion-related repairs included issues with the electric drive and current collection systems. Issues with the HVAC system increased costs during several months in the evaluation period.

SECTION 3: KC METRO BEB EVALUATION RESULTS
FEDERAL TRANSIT ADMINISTRATION 42
Figure 3-23 Monthly Maintenance Cost per Mile by System for Trolley Bus Fleet
Propulsion-Related Work Order Maintenance CostsPropulsion-related vehicle systems include the exhaust, fuel, engine, battery modules, electric propulsion, air intake, cooling, non-lighting electrical, transmission, and hydraulic systems. These vehicle subsystems have been separated to highlight how maintenance costs for the propulsion system are affected by the change from conventional technology (diesel) to advanced technology (batteries). Table 3-9 shows the propulsion-related system maintenance costs by category for the four fleets during the data period. Parts for scheduled maintenance, such as filters and fluids, are included in the specific system categories. For example, oil and oil filters are included in the power plant (engine) subsystem parts costs, while air filters are included in the air intake subsystem parts costs.
• Total propulsion-related – The battery fleet’s total propulsion-related maintenance cost was 60% lower than that of the hybrid buses, 63% lower than that of the diesel buses, and 72% lower than that of the trolley buses.
• Exhaust system – Costs for the hybrid and diesel buses were low. The battery buses and trolley buses do not have exhaust systems.
• Fuel system – Costs for this system for the hybrid and diesel buses were low. The battery buses and trolley buses do not have liquid fueling systems.

SECTION 3: KC METRO BEB EVALUATION RESULTS
FEDERAL TRANSIT ADMINISTRATION 43
• Power plant and electric propulsion – For the battery buses, the electric propulsion system accounted for 60% of the total propulsion system costs. Power plant (engine) repairs made up 5% of the hybrid costs and the electric propulsion costs made up 21%. Power plant repairs made up 10% of the total propulsion system costs for the diesel buses; there are no electric propulsion costs for the diesel buses. Current collection system costs made up 66.5% of the trolley costs followed by the electric propulsion system at 21%.
• Non-lighting electrical (charging, cranking, and ignition) – Costs for this system for the battery buses were slightly lower than that of the hybrid buses. The battery fleet costs were 80% lower than the costs for the diesel fleet and 22% lower than the costs for the trolley fleet.
• Air intake – Costs for this system for the battery buses, diesel buses, and trolley buses were low or zero. For the hybrid buses, air intake system repairs made up 9.8% of the propulsion system costs.
• Cooling – Costs for this system for the battery buses, diesel buses, and trolley buses were low or zero. For the hybrid buses, cooling system repairs made up 37% of the costs.
• Transmission – Costs for this system were low for all four bus fleets.
• Hydraulic – Costs for this system were low or zero for all four bus fleets.
Table 3-9Propulsion-
Related Work Order
Maintenance Costs by System
Maintenance System Costs Battery Hybrid Diesel Trolley
Mileage 83,127 432,538 69,329 180,554
Total Propulsion-Related Systems (Roll-up)
Parts cost ($) 111.98 15,528.60 3,049.69 5,862.78
Labor hours 78.3 733.0 118.3 501.7
Total cost ($) 4,024.48 52,176.10 8,962.19 30,947.78
Total cost ($) per mile 0.048 0.120 0.129 0.171
Exhaust System Repairs
Parts cost ($) 0.00 184.84 100.64 0.00
Labor hours 0.0 107.1 2.0 0.0
Total cost ($) 0.00 5,537.34 200.64 0.00
Total cost ($) per mile 0.000 0.013 0.003 0.000
Fuel System Repairs
Parts cost ($) 0.00 2,516.79 272.41 0.00
Labor hours 0.0 2.8 1.0 0.0
Total cost ($) 0.00 2,654.29 322.41 0.00
Total cost ($) per mile 0.000 0.006 0.005 0.000
Power Plant System Repairs
Parts cost ($) 0.00 1,016.14 342.22 0.00
Labor hours 0.0 30.5 10.5 0.0
Total cost ($) 0.00 2,541.14 867.22 0.00
Total cost ($) per mile 0.000 0.006 0.013 0.000

SECTION 3: KC METRO BEB EVALUATION RESULTS
FEDERAL TRANSIT ADMINISTRATION 44
Maintenance System Costs Battery Hybrid Diesel Trolley
Electric Propulsion System Repairs
Parts cost ($) 0.00 1833.51 0.00 0.00
Labor hours 48.0 179.7 0.0 128.9
Total cost ($) 2,400.00 10,818.51 0.00 6,442.50
Total cost ($) per mile 0.029 0.025 0.000 0.036
Current Collection
Parts cost ($) 0.00 0.00 0.00 5,296.17
Labor hours 0.00 0.00 0.00 306.10
Total cost ($) 0.00 0.00 0.00 20,601.17
Total cost ($) per mile 0.000 0.000 0.000 0.114
Non-Lighting Electrical System Repairs (General Electrical, Charging, Cranking, Ignition)
Parts cost ($) 111.98 536.32 2,203.47 566.61
Labor hours 25.8 114.5 71.0 66.75
Total cost ($) 1,399.48 6,258.82 5,753.47 3,904.11
Total cost ($) per mile 0.017 0.014 0.083 0.022
Air Intake System Repairs
Parts cost ($) 0.00 2,347.63 121.63 0.00
Labor hours 0.0 55.6 2.8 0.0
Total cost ($) 0.00 5,127.63 259.13 0.00
Total cost ($) per mile 0.000 0.012 0.004 0.000
Cooling System Repairs
Parts cost ($) 0.00 7,083.05 5.70 0.00
Labor hours 4.0 239.9 10.3 0.0
Total cost ($) 200.00 19,078.05 518.20 0.00
Total cost ($) per mile 0.002 0.044 0.007 0.000
Transmission System Repairs
Parts cost ($) 0.00 0.00 3.62 0.00
Labor hours 0.5 0.0 20.8 0.0
Total cost ($) 25.00 0.00 1,041.12 0.00
Total cost ($) per mile 0.000 0.000 0.015 0.000
Hydraulic
Parts cost ($) 0.00 10.32 0.00 0.00
Labor hours 0 3 0 0.00
Total cost ($) 0.00 160.32 0.00 0.00
Total cost ($) per mile 0.000 0.000 0.000 0.000
Total CostFigure 3-24 shows the monthly total operational cost per mile, including maintenance and fuel cost, for the battery, hybrid, and diesel fleets. Trolley costs are excluded because electricity use data were not available. Energy costs dominate the battery fleet’s overall operational costs and show a general increase in the latter half of the data period, during colder months. Diesel fuel costs are consistent over the data period and are higher for the standard diesel buses compared to the hybrid buses due to the lower fuel economy. Table 4-10 summarizes the overall fuel and maintenance costs per mile by bus fleet. These parameters are also listed in the Appendix.
Table 3-9 cont’dPropulsion-
Related Work Order
Maintenance Costs by System
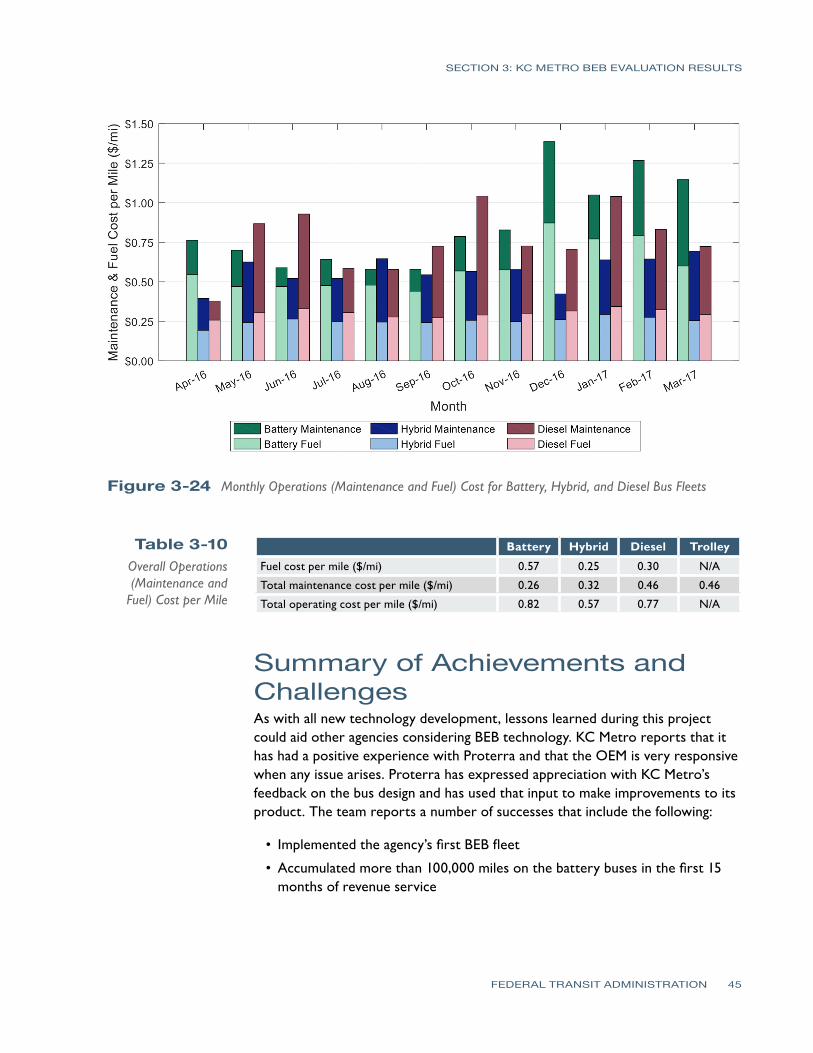
SECTION 3: KC METRO BEB EVALUATION RESULTS
FEDERAL TRANSIT ADMINISTRATION 45
Figure 3-24 Monthly Operations (Maintenance and Fuel) Cost for Battery, Hybrid, and Diesel Bus Fleets
Table 3-10 Overall Operations (Maintenance and
Fuel) Cost per Mile
Battery Hybrid Diesel Trolley
Fuel cost per mile ($/mi) 0.57 0.25 0.30 N/A
Total maintenance cost per mile ($/mi) 0.26 0.32 0.46 0.46
Total operating cost per mile ($/mi) 0.82 0.57 0.77 N/A
Summary of Achievements and ChallengesAs with all new technology development, lessons learned during this project could aid other agencies considering BEB technology. KC Metro reports that it has had a positive experience with Proterra and that the OEM is very responsive when any issue arises. Proterra has expressed appreciation with KC Metro’s feedback on the bus design and has used that input to make improvements to its product. The team reports a number of successes that include the following:
• Implemented the agency’s first BEB fleet
• Accumulated more than 100,000 miles on the battery buses in the first 15 months of revenue service

SECTION 3: KC METRO BEB EVALUATION RESULTS
FEDERAL TRANSIT ADMINISTRATION 46
• Increased operation of the battery fleet since the end of NREL’s data collection period
• Initiated an order of eight more fast charge BEBs through a Low-No award.
KC Metro is committed to an environmentally friendly fleet and plans to purchase 120 BEBs by 2020. In 2017, the agency entered into a contract with Proterra to purchase up to 73 BEBs.
Summary of ChallengesAdvanced-technology demonstrations typically experience challenges and issues that need to be resolved. KC Metro reports that management and scheduling differences for the BEBs compared to conventional technologies resulted in many of the challenges. Issues and lessons learned for KC Metro include the following.
• Charger availability – When deploying a fast-charge BEB fleet, availability of the on-route charger is critical for operation. Downtime of the charger results in downtime for the fleet. KC Metro experienced this issue when the charger was damaged. A bolt in the rooftop charging assembly on one of the buses backed out and the charger head became stuck. While the issue was minor, the resulting downtime of the charger caused a major service interruption for the battery fleet during the two weeks it took to repair the charger. Proterra has not determined the root cause for the bolt backing out. Although the PM schedule does include a regular inspection, the OEM has also issued a bulletin to add adhesive to the bolt to ensure the issue does not happen again.
• Operator training – Driver training is an ongoing challenge because the BEBs operate differently from the conventional buses in the agency’s fleet. The primary training differences are learning the docking procedure and ensuring the BEBs are fully charged before returning to the depot at the end of a shift. KC Metro plans to install a fast charger at the Bellevue Base, which will incorporate the procedure for end-of-shift charging of their battery buses into the general servicing and fueling process at the base. Fully charging the buses before returning to the base will no longer be necessary. At the onset of the project, KC Metro trained a number of drivers to operate the battery buses. The agency has service changes three times each year where operators may elect to move to a different route. Any new operators for the routes serviced by the battery buses need to be trained on the operational differences. Transit agencies deploying electric buses should consider this when planning training programs.
• Operations planning – The scheduling department needs to understand the operational differences for on-route-charged BEBs. The short range of these buses requires them to operate on a selection of routes that return to the charging station regularly. Schedulers need to limit service to the

SECTION 3: KC METRO BEB EVALUATION RESULTS
FEDERAL TRANSIT ADMINISTRATION 47
selected routes until the agency adds chargers to other locations. The agency also has layovers planned in its route schedules. With conventional buses, an operator can shorten the layover to make up lost time and keep buses on schedule. For BEBs, however, that planned layover includes time for charging. Shortening the layover to make up schedule slip could result in the bus not getting a full charge.
• Parts list for inventory – Parts availability is a common issue with agencies deploying advanced-technology buses. KC Metro reports that Proterra has delivered parts quickly, but the agency needs to keep some parts on hand to speed up the process. The agency is working with Proterra to develop a better list of parts for on-site inventory.
• Extended downtime – KC Metro experienced a few issues with specific battery buses that resulted in downtime.
• Tow damage – In December 2016, the electric drive system on one of the battery buses was damaged during towing. KC Metro considers the situation a training issue. While Proterra had trained KC Metro employees at Bellevue Base on the proper towing procedures, the staff that responded to the roadcall were from another base. The damage took about 5 weeks to repair.
• Traction motor – KC Metro’s battery buses were produced with a new version of traction motor. The agency experienced several issues with motors overheating. Proterra traced the root cause to a damaged crimp in the motor windings. The traction motor supplier modified the production process to eliminate the issue for future products. Proterra proactively replaced motors on all three of KC Metro’s battery buses to prevent the issue from reoccurring.

APPENDIX
FEDERAL TRANSIT ADMINISTRATION 48
KC Metro Fleet Summary Statistics
Table A-1 Fleet Operations and Economics
Battery Hybrid Diesel Trolley
Number of vehicles 3 10 3 10
Period used for fuel and energy analysis 4/16-3/17 4/16-3/17 4/16-3/17 4/16-3/17
Total number of months in period 12 12 12 12
Fuel and energy analysis base fleet mileage 77,563 429,836 68,212 61,780a
Period used for maintenance analysis 4/16-3/17 4/16-3/17 4/16-3/17 4/16-3/17
Total number of months in period 12 12 12 12
Maintenance analysis base fleet mileage 83,127 435,552 69,329 180,554
Average monthly mileage per vehicle 2,309 3,630 1,926 1,505
Availability 80.6 90.5 86.4 84.9
Fleet fuel usage (kWh electricity or gal diesel) 183,255 67,874 12,909 158,484a
Roadcalls 30 57 4 110
Total MBRC 2,771 7,641 17,332 1,641
Propulsion roadcalls 12 15 2 61
Propulsion MBRC 6,927 29,037 34,665 2,960
Fleet kWh/mile 2.36 2.57a
Representative fleet fuel economy (mpdge) 15.9 6.3 5.3 14.7a
Electricity cost per kWh ($) 0.20 N/A
Diesel cost per gal ($) 1.60 1.60
Fuel cost per mile ($) 0.57 0.25 0.30 N/A
Total scheduled repair cost per mile ($) 0.04 0.09 0.08 0.04
Total unscheduled repair cost per mile ($) 0.22 0.22 0.39 0.42
Total maintenance cost per mile ($) 0.26 0.32 0.46 0.46
Total operating cost per mile ($) 0.82 0.57 0.77 N/Aa Trolley fleet fuel economy is estimated based on data from two trolley buses during 13 months of operation.
Table A-2Maintenance Costs
Battery Hybrid Diesel Trolley
Fleet mileage 83,127 432,538 69,329 180,554
Total parts cost ($) 1,974.69 29,511.45 5,937.19 11,464.65
Total labor hours 394.3 2,157.1 524.3 1,421.0
Average labor cost (@ $50.00 per hour) ($) 19,712.50 107,852.50 26,215.00 71,050.00
Total maintenance cost ($) 21,687.19 137,363.95 32,152.19 82,514.65
Total maintenance cost per bus ($) 7,229.06 13,736.39 3,215.22 8,251.46
Total maintenance cost per mile ($) 0.26 0.32 0.46 0.46

APPENDIX: KC METRO FLEET SUMMARY STATISTICS
FEDERAL TRANSIT ADMINISTRATION 49
Battery Hybrid Diesel Trolley
Fleet mileage 83,127 432,538 69,329 180,554
Total Engine/Fuel-Related Systems (ATA VMRS 27, 30, 31, 32, 33, 41, 42, 43, 44, 45, 46, 65)
Parts cost ($) 111.98 15,528.60 3,028.89 5,862.78
Labor hours 78.25 732.95 118.25 501.70
Average labor cost ($) 3,912.50 36,647.50 5,912.50 25,085.00
Total cost (for system) ($) 4,024.48 52,176.10 8,941.39 30,947.78
Total cost (for system) per bus ($) 1,341.49 17,392.03 2,980.46 10,315.93
Total cost (for system) per mile ($) 0.048 0.121 0.129 0.171
Exhaust System Repairs (ATA VMRS 43)
Parts cost ($) 0.00 184.84 100.64 0.00
Labor hours 0.0 107.1 2.0 0.0
Average labor cost ($) 0.00 5,352.50 100.00 0.00
Total cost (for system) ($) 0.00 5,537.34 200.64 0.00
Total cost (for system) per bus ($) 0.00 1,845.78 66.88 0.00
Total cost (for system) per mile ($) 0.000 0.013 0.003 0.000
Fuel System Repairs (ATA VMRS 44)
Parts cost ($) 0.00 2,516.79 272.41 0.00
Labor hours 0.0 2.8 1.0 0.0
Average labor cost ($) 0.00 137.50 50.00 0.00
Total cost (for system) ($) 0.00 2,654.29 322.41 0.00
Total cost (for system) per bus ($) 0.00 884.76 107.47 0.00
Total cost (for system) per mile ($) 0.000 0.006 0.005 0.000
Power Plant (Engine or ESS) Repairs (ATA VMRS 45)
Parts cost ($) 0.00 1,016.14 321.42 0.00
Labor hours 0.0 30.5 10.5 0.0
Average labor cost ($) 0.00 1,525.00 525.00 0.00
Total cost (for system) ($) 0.00 2,541.14 846.42 0.00
Total cost (for system) per bus ($) 0.00 847.05 282.14 0.00
Total cost (for system) per mile ($) 0.000 0.006 0.012 0.000
Electric Propulsion Repairs (ATA VMRS 46)
Parts cost ($) 0.00 1,833.51 0.00 0.00
Labor hours 48.0 179.7 0.0 128.9
Average labor cost ($) 2,400.00 8,985.00 0.00 6,442.50
Total cost (for system) ($) 2,400.00 10,818.51 0.00 6,442.50
Total cost (for system) per bus ($) 800.00 3,606.17 0.00 2,147.50
Total cost (for system) per mile ($) 0.029 0.025 0.000 0.036
Electrical System Repairs (ATA VMRS 30-Electrical General, 31-Charging, 32-Cranking, 33-Ignition)
Parts cost ($) 111.98 536.32 2,203.47 566.61
Labor hours 25.8 114.5 71.0 66.8
Average labor cost ($) 1,287.50 5,722.50 3,550.00 3,337.50
Table A-3 Breakdown of Maintenance
Costs by System
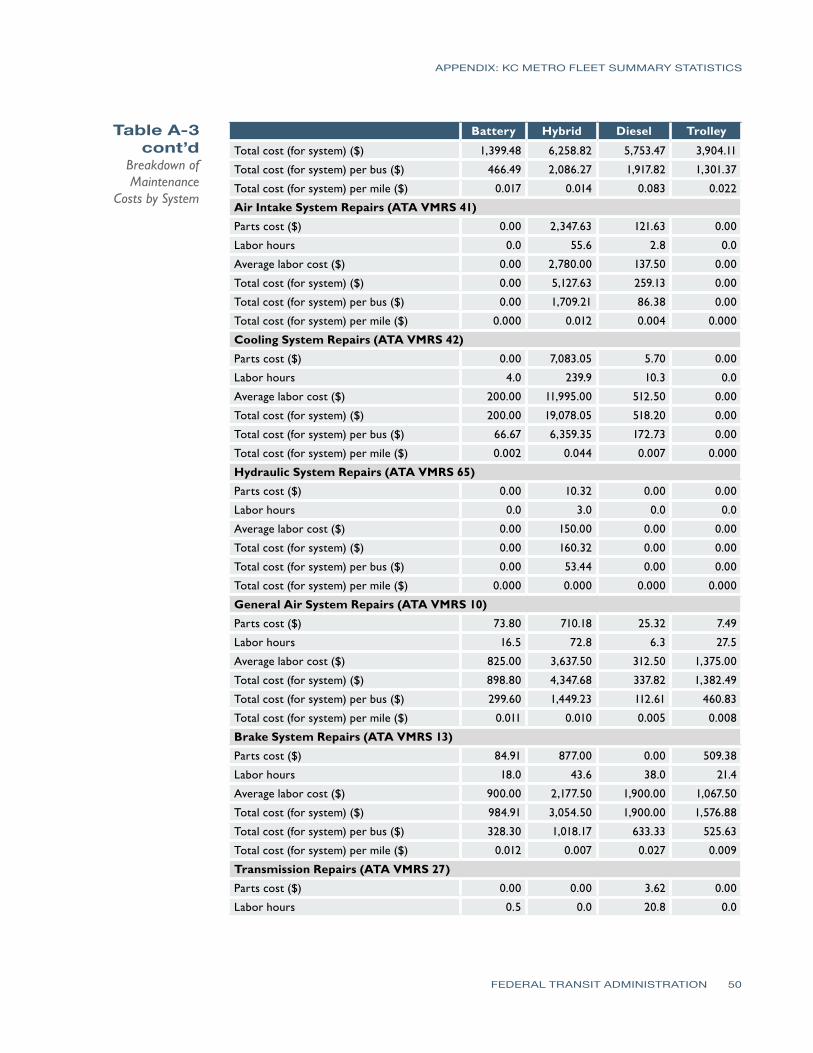
APPENDIX: KC METRO FLEET SUMMARY STATISTICS
FEDERAL TRANSIT ADMINISTRATION 50
Battery Hybrid Diesel Trolley
Total cost (for system) ($) 1,399.48 6,258.82 5,753.47 3,904.11
Total cost (for system) per bus ($) 466.49 2,086.27 1,917.82 1,301.37
Total cost (for system) per mile ($) 0.017 0.014 0.083 0.022
Air Intake System Repairs (ATA VMRS 41)
Parts cost ($) 0.00 2,347.63 121.63 0.00
Labor hours 0.0 55.6 2.8 0.0
Average labor cost ($) 0.00 2,780.00 137.50 0.00
Total cost (for system) ($) 0.00 5,127.63 259.13 0.00
Total cost (for system) per bus ($) 0.00 1,709.21 86.38 0.00
Total cost (for system) per mile ($) 0.000 0.012 0.004 0.000
Cooling System Repairs (ATA VMRS 42)
Parts cost ($) 0.00 7,083.05 5.70 0.00
Labor hours 4.0 239.9 10.3 0.0
Average labor cost ($) 200.00 11,995.00 512.50 0.00
Total cost (for system) ($) 200.00 19,078.05 518.20 0.00
Total cost (for system) per bus ($) 66.67 6,359.35 172.73 0.00
Total cost (for system) per mile ($) 0.002 0.044 0.007 0.000
Hydraulic System Repairs (ATA VMRS 65)
Parts cost ($) 0.00 10.32 0.00 0.00
Labor hours 0.0 3.0 0.0 0.0
Average labor cost ($) 0.00 150.00 0.00 0.00
Total cost (for system) ($) 0.00 160.32 0.00 0.00
Total cost (for system) per bus ($) 0.00 53.44 0.00 0.00
Total cost (for system) per mile ($) 0.000 0.000 0.000 0.000
General Air System Repairs (ATA VMRS 10)
Parts cost ($) 73.80 710.18 25.32 7.49
Labor hours 16.5 72.8 6.3 27.5
Average labor cost ($) 825.00 3,637.50 312.50 1,375.00
Total cost (for system) ($) 898.80 4,347.68 337.82 1,382.49
Total cost (for system) per bus ($) 299.60 1,449.23 112.61 460.83
Total cost (for system) per mile ($) 0.011 0.010 0.005 0.008
Brake System Repairs (ATA VMRS 13)
Parts cost ($) 84.91 877.00 0.00 509.38
Labor hours 18.0 43.6 38.0 21.4
Average labor cost ($) 900.00 2,177.50 1,900.00 1,067.50
Total cost (for system) ($) 984.91 3,054.50 1,900.00 1,576.88
Total cost (for system) per bus ($) 328.30 1,018.17 633.33 525.63
Total cost (for system) per mile ($) 0.012 0.007 0.027 0.009
Transmission Repairs (ATA VMRS 27)
Parts cost ($) 0.00 0.00 3.62 0.00
Labor hours 0.5 0.0 20.8 0.0
Table A-3 cont’d
Breakdown of Maintenance
Costs by System

APPENDIX: KC METRO FLEET SUMMARY STATISTICS
FEDERAL TRANSIT ADMINISTRATION 51
Battery Hybrid Diesel Trolley
Average labor cost ($) 25.00 0.00 1,037.50 0.00
Total cost (for system) ($) 25.00 0.00 1,041.12 0.00
Total cost (for system) per bus ($) 8.33 0.00 347.04 0.00
Total cost (for system) per mile ($) 0.000 0.000 0.015 0.000
Inspections Only – no parts replacements (101)
Parts cost ($) 0.00 0.00 0.00 0.00
Labor hours 47.0 329.8 54.3 94.3
Average labor cost ($) 2,350.00 16,487.50 2,712.50 4,712.50
Total cost (for system) ($) 2,350.00 16,487.50 2,712.50 4,712.50
Total cost (for system) per bus ($) 783.33 5,495.83 904.17 1,570.83
Total cost (for system) per mile ($) 0.028 0.038 0.039 0.026
Cab, Body, and Accessories Systems Repairs (ATA VMRS 02-Cab and Sheet Metal, 50-Accessories, 71-Body)
Parts cost ($) 1,502.76 9,375.02 2,376.61 3,080.23
Labor hours 185.5 821.7 278.8 607.8
Average labor cost ($) 9,275.00 41,085.00 13,940.00 30,390.00
Total cost (for system) ($) 10,777.76 50,460.02 16,316.61 33,470.23
Total cost (for system) per bus ($) 3,592.59 16,820.01 5,438.87 11,156.74
Total cost (for system) per mile ($) 0.130 0.117 0.235 0.185
HVAC System Repairs (ATA VMRS 01)
Parts cost ($) 55.45 1,088.76 480.33 1,779.95
Labor hours 18.0 58.8 22.8 127.8
Average labor cost ($) 900.00 2,940.00 1,137.50 6,387.50
Total cost (for system) ($) 955.45 4,028.76 1,617.83 8,167.45
Total cost (for system) per bus ($) 318.48 1,342.92 539.28 2,722.48
Total cost (for system) per mile ($) 0.011 0.009 0.023 0.045
Lighting System Repairs (ATA VMRS 34)
Parts cost ($) 119.64 1,290.64 0.00 82.28
Labor hours 9.5 21.8 2.0 14.3
Average labor cost ($) 475.00 1,090.00 100.00 712.50
Total cost (for system) ($) 594.64 2,380.64 100.00 794.78
Total cost (for system) per bus ($) 198.21 793.55 33.33 264.93
Total cost (for system) per mile ($) 0.007 0.006 0.001 0.004
Frame, Steering, and Suspension Repairs (ATA VMRS 14-Frame, 15-Steering, 16-Suspension)
Parts cost ($) 22.36 337.73 26.04 142.53
Labor hours 4.0 53.3 2.0 20.9
Average labor cost ($) 200.00 2,662.50 100.00 1,045.00
Total cost (for system) ($) 222.36 3,000.23 126.04 1,187.53
Total cost (for system) per bus ($) 74.12 1,000.08 42.01 395.84
Total cost (for system) per mile ($) 0.003 0.007 0.002 0.007
Table A-3 cont’d
Breakdown of Maintenance
Costs by System

APPENDIX: KC METRO FLEET SUMMARY STATISTICS
FEDERAL TRANSIT ADMINISTRATION 52
Battery Hybrid Diesel Trolley
Axle, Wheel, and Drive Shaft Repairs (ATA VMRS 11-Front Axle, 18-Wheels, 22-Rear Axle, 24-Drive Shaft)
Parts cost ($) 0.00 303.53 0.00 0.00
Labor hours 0.0 2.5 1.0 3.5
Average labor cost ($) 0.00 125.00 50.00 175.00
Total cost (for system) ($) 0.00 428.53 50.00 175.00
Total cost (for system) per bus ($) 0.00 142.84 16.67 58.33
Total cost (for system) per mile ($) 0.000 0.001 0.001 0.001
Tire Repairs (ATA VMRS 17)
Parts cost ($) 3.78 0.00 0.00 0.00
Labor hours 17.5 20.0 1.0 2.0
Average labor cost ($) 875.00 1,000.00 50.00 100.00
Total cost (for system) ($) 878.78 1,000.00 50.00 100.00
Total cost (for system) per bus ($) 292.93 333.33 16.67 33.33
Total cost (for system) per mile ($) 0.011 0.002 0.001 0.001
Current Collection
Parts cost ($) 0.00 0.00 0.00 5,296.17
Labor hours 0.0 0.0 0.0 306.1
Average labor cost ($) 0.00 0.00 0.00 15,305.00
Total cost (for system) ($) 0.00 0.00 0.00 20,601.17
Total cost (for system) per bus ($) 0.00 0.00 0.00 6,867.06
Total cost (for system) per mile ($) 0.000 0.000 0.000 0.114
Table A-3 cont’d
Breakdown of Maintenance
Costs by System

APPENDIX: KC METRO FLEET SUMMARY STATISTICS
FEDERAL TRANSIT ADMINISTRATION 53
Fleet Summary Statistics—SI UnitsTable A-4
Fleet Operations and Economics (SI)
Battery Hybrid Diesel Trolley
Number of vehicles 3 10 3 10
Period used for fuel and energy analysis 4/16–3/17 4/16–3/17 4/16–3/17 4/16–3/17
Total number of months in period 12 12 12 12
Fuel and energy analysis base fleet mileage 124,822 691,735 109,774 N/A
Period used for maintenance analysis 4/16-3/17 4/16-3/17 4/16-3/17 4/16-3/17
Total number of months in period 12 12 12 12
Maintenance analysis base fleet kilometers 133,776 700,934 111,571 290,566
Average monthly kilometers per vehicle 44,592 70,093 37,190 29,057
Availability 80.6 90.5 86.4 84.9
Fleet fuel usage (kWh electricity or liter diesel) 183,255 256,931 48,866 158,484
Roadcalls 30 57 4 110
Total KMBRC 4,459 12,297 27,893 2,642
Propulsion roadcalls 12 15 2 61
Propulsion KMBRC 11,148 46,729 55,786 4,763
Rep. fleet fuel consumption (L/100 km) 14.74 37.14 44.52 16.03
Energy cost per kWh ($) 0.20 N/A
Diesel cost/liter ($) 0.42 0.42
Fuel cost per kilometer ($) 0.35 0.16 0.19 N/A
Total scheduled repair cost per kilometer ($) 0.02 0.06 0.05 0.02
Total unscheduled repair cost per kilometer ($) 0.14 0.14 0.24 0.26
Total maintenance cost per kilometer ($) 0.16 0.20 0.29 0.28
Total operating cost per kilometer ($) 0.51 0.35 0.48 N/A
Table A-5 Maintenance Costs
(SI)
Battery Hybrid Diesel Trolley
Fleet mileage 133,776 696,083 111,571 290,566
Total parts cost ($) 1,974.69 29,511.45 5,937.19 11,464.65
Total labor hours 394.25 2,157.05 524.30 1,421.00
Average labor cost (@ $50.00 per hour) ($) 19,712.50 107,852.50 26,215.00 71,050.00
Total maintenance cost ($) 21,687.19 137,363.95 32,152.19 82,514.65
Total maintenance cost per bus ($) 7,229.06 13,736.39 3,215.22 8,251.46
Total maintenance cost per kilometer ($) 0.16 0.20 0.29 0.28

APPENDIX: KC METRO FLEET SUMMARY STATISTICS
FEDERAL TRANSIT ADMINISTRATION 54
Additional Charts for KC Metro Evaluation
1. Electrical energy converted to diesel gallon equivalent (dge), conversion favtor = 37.6 kWh/diesel gallon; based on the energy content of electricity (3,414 Btu/kWh) and diesel fuel LHV (128,488 Btu/gal).
Figure A-1 Monthly Average Price for Electricity and Diesel Fuel
Figure A-2 Monthly Availability for Battery Buses

FEDERAL TRANSIT ADMINISTRATION 55
ACRONYMS AC alternating currentATA VMRS American Trucking Association Vehicle Maintenance Reporting StandardsBEB battery electric busBtu British thermal unitsCNG compressed natural gasdge diesel gallon equivalentDOE U.S. Department of EnergyDOT U.S. Department of TransportationESS energy storage systemFCEB fuel cell electric busFePO4 Iron PhosphateFTA Federal Transit Administrationft feetgal gallonGPS global positioning systemhp horse powerHVAC heating, ventilation, and air conditioningin inchesKC Metro King County MetroKMBRC kilometers between roadcallkW kilowattkWh kilowatt hourlb poundLow-No Low or No Emission Vehicle Deployment ProgramMBRC miles between roadcallmi milempdge miles per diesel gallon equivalentNFCBP National Fuel Cell Bus ProgramNOx oxides of nitrogenNREL National Renewable Energy LaboratoryNTD National Transit DatabaseOEM original equipment manufacturerOST-R DOT’s Research, Development, and Technology OfficePMI/PM preventive maintenance inspectionsRC roadcallrpm revolutions per minuteSI International System of UnitsSOC state of chargeTIGGER Transit Investments for Greenhouse Gas and Energy ReductionZEB zero-emission bus

GLOSSARY
FEDERAL TRANSIT ADMINISTRATION 56
Availability – The number of days the buses are actually available compared to the days that the buses are planned for operation, expressed as percent availability.
Clean point – For each evaluation, NREL works with the project partners to determine a starting point—or clean point—for the data analysis period. The clean point is chosen to avoid some of the early and expected operations problems with a new vehicle going into service, such as early maintenance campaigns. In some cases, reaching the clean point may require 3 to 6 months of operation before the evaluation can start. This applies to new technology buses as well as conventional buses.
Deadhead – The miles and hours that a vehicle travels when out of revenue service with no expectation of carrying revenue passengers. Deadhead includes leaving or returning to the garage or yard facility and changing routes.
Miles between roadcalls (MBRC) – A measure of reliability calculated by dividing the number of miles traveled by the total number of roadcalls, also known as mean distance between failures. MBRC results in the report are categorized as follows:
• Bus MBRC – Includes all chargeable roadcalls. Includes propulsion-related issues as well as problems with bus-related systems such as brakes, suspension, steering, windows, doors, and tires.
• Propulsion-related MBRC – Includes roadcalls that are attributed to the propulsion system. Propulsion-related roadcalls can be caused by issues with the transmission, batteries, and electric drive.
• Energy storage system (ESS)-related MBRC – Includes roadcalls attributed to the energy storage system only.
Revenue service – The time when a vehicle is available to the general public with an expectation of carrying fare-paying passengers. Vehicles operated in a fare-free service are also considered revenue service.
Roadcall – A failure of an in-service bus that causes the bus to be replaced on route or causes a significant delay in schedule. The analysis includes chargeable roadcalls that affect the operation of the bus or may cause a safety hazard. Non-chargeable roadcalls can be passenger incidents that require the bus to be cleaned before going back into service, or problems with an accessory such as a farebox or radio.

U.S. Department of TransportationFederal Transit Administration
East Building1200 New Jersey Avenue, SE
Washington, DC 20590https://www.transit.dot.gov/about/research-innovation