ZERO-DIMENSIONAL MODEL FOR A 4-STROKE, DIRECT …
10
HEFAT2012 9 th International Conference on Heat Transfer, Fluid Mechanics and Thermodynamics 16 – 18 July 2012 Malta ZERO-DIMENSIONAL MODEL FOR A 4-STROKE, DIRECT INJECTION, VARIABLE COMPRESSION RATIO FOR MAXIMUM TORQUE Abou Al-Sood M.M. *, Abdel-Rahim, Y. M. and Ahmed, M. A. *Author for correspondence Department of Mechanical Engineering, Assiut University, Assiut, 71516, Egypt, E-mail: [email protected] ABSTRACT A zero-dimensional model for simulation the performance of a four-stroke direct-injection (DI) diesel engine is developed. The simulation model includes detailed sub-models for fuel burning rate, combustion products, thermodynamic properties of working fluid, heat transfer, fluid flow, and both soot and NO x formation mechanisms. To validate the model, comparisons between experimental and predicted results for different engines, operating under different conditions were conducted. Comparisons show that there is a good concurrence between measured and predicted values. An optimization analysis is conducted for seeking an optimum variation of compression ratio to achieve pre-set objective target of constant maximum brake torque. The optimization analysis is performed under the constrain that the maximum pressure and temperature inside the cylinder not exceed the maximum allowable pressure and temperature of the conventional engine (constant compression ratio, r c ).Varying compression ratio is optimized with the previous condition. Results indicated that optimum brake torque is achieved when the value of, r c , ranged between 16.4 and 19.3, where the brake specific fuel consumption, bsfc, and soot emission are reduced by about 4.6% and 12 %, respectively. Furthermore, the brake torque is increases by about 5.4%; NO x , maximum pressure (p max ) , and maximum temperature (T max ) are increased by about 90.7 %, 10.3% and 3.6 %, respectively. INTRODUCTION Requirements to provide environmental friendly vehicles (i.e. low fuel consumption with less emission) have resulted in using the most complicated and intellectual means of internal combustion engine development. Nowadays new ideas, which could not be discussed two decades ago, are being considered by automotive manufacturers. In particular, many leading automotive companies have approached practically the very complicated design ideas with different aspects of diesel/petrol engine design. These aspects have been under extensive theoretical and experimental investigations. The most important aspect of design is aimed to vary the engine compression ratio (r c ) depending on load, or speed, or both load and speed. Several trials have been done in that respect with extensive design, experimentation and measurements [1-6]. All attempts to change the compression ratio are achieved by one or more of the following concepts [1]: (1) moving the cylinder head, (2) variation of combustion chamber volume, (3) variation of piston deck height, (4) modification of connecting rod geometry (usually by means of some intermediate member), (5) moving the crankpin within the crankshaft (effectively varying the stroke), and (6) moving the crankshaft axis. Variable-stroke engine mechanism patented by Freudenstein and Maki [2] was used by Yamin and Dado [3] as it gives availability to change the stroke length and the corresponding compression ratio in the range of 6.82 to 10. Their results showed a significant improvement in the engine’s power, and reduction in the fuel consumption. In addition to an increase in Carbon monoxide (CO) and Nitric oxides (NO x ) compared with the actual engine. Finally, they concluded that the engine performance can be optimized for a full range of driving conditions, such as acceleration, speed and load. Such optimized performance was obtained by incorporating some means to suppress the increase in emissions rate to be applicable in the automotive field due to the strict anti-pollution laws. Befits and challenges of Variable Compression Ratio (VCR) spark ignition engines had been illustrated, examined and critically reviewed by Roberts [1]. Also, the implications for volume manufacture and the strategy for VCR implementation in order to produce the maximum benefit had been discussed. Ladommatos and Balian [4] studied the effects of an increased clearance volume on the performance of a direct-injection diesel engine. This study was conducted to overcome problems 1231
Transcript of ZERO-DIMENSIONAL MODEL FOR A 4-STROKE, DIRECT …

HEFAT2012
9th
International Conference on Heat Transfer, Fluid Mechanics and Thermodynamics
16 – 18 July 2012
Malta
ZERO-DIMENSIONAL MODEL FOR A 4-STROKE, DIRECT INJECTION, VARIABLE
COMPRESSION RATIO FOR MAXIMUM TORQUE
Abou Al-Sood M.M. *, Abdel-Rahim, Y. M. and Ahmed, M. A.
*Author for correspondence
Department of Mechanical Engineering,
Assiut University,
Assiut, 71516,
Egypt,
E-mail: [email protected]
ABSTRACT
A zero-dimensional model for simulation the performance of
a four-stroke direct-injection (DI) diesel engine is developed.
The simulation model includes detailed sub-models for fuel
burning rate, combustion products, thermodynamic properties of working fluid, heat transfer, fluid flow, and both soot and
NOx formation mechanisms. To validate the model,
comparisons between experimental and predicted results for
different engines, operating under different conditions were
conducted. Comparisons show that there is a good concurrence
between measured and predicted values. An optimization
analysis is conducted for seeking an optimum variation of
compression ratio to achieve pre-set objective target of constant
maximum brake torque. The optimization analysis is performed
under the constrain that the maximum pressure and temperature
inside the cylinder not exceed the maximum allowable pressure
and temperature of the conventional engine (constant compression ratio, rc).Varying compression ratio is optimized
with the previous condition. Results indicated that optimum
brake torque is achieved when the value of, rc, ranged between
16.4 and 19.3, where the brake specific fuel consumption, bsfc,
and soot emission are reduced by about 4.6% and 12 %,
respectively. Furthermore, the brake torque is increases by
about 5.4%; NOx, maximum pressure (pmax) , and maximum
temperature (Tmax) are increased by about 90.7 %, 10.3% and
3.6 %, respectively.
INTRODUCTION
Requirements to provide environmental friendly vehicles
(i.e. low fuel consumption with less emission) have resulted in
using the most complicated and intellectual means of internal
combustion engine development. Nowadays new ideas, which
could not be discussed two decades ago, are being considered
by automotive manufacturers. In particular, many leading
automotive companies have approached practically the very
complicated design ideas with different aspects of diesel/petrol
engine design. These aspects have been under extensive
theoretical and experimental investigations. The most important
aspect of design is aimed to vary the engine compression ratio
(rc) depending on load, or speed, or both load and speed. Several trials have been done in that respect with extensive
design, experimentation and measurements [1-6]. All attempts
to change the compression ratio are achieved by one or more of
the following concepts [1]: (1) moving the cylinder head, (2)
variation of combustion chamber volume, (3) variation of
piston deck height, (4) modification of connecting rod
geometry (usually by means of some intermediate member), (5)
moving the crankpin within the crankshaft (effectively varying
the stroke), and (6) moving the crankshaft axis.
Variable-stroke engine mechanism patented by Freudenstein
and Maki [2] was used by Yamin and Dado [3] as it gives
availability to change the stroke length and the corresponding compression ratio in the range of 6.82 to 10. Their results
showed a significant improvement in the engine’s power, and
reduction in the fuel consumption. In addition to an increase in
Carbon monoxide (CO) and Nitric oxides (NOx) compared with
the actual engine. Finally, they concluded that the engine
performance can be optimized for a full range of driving
conditions, such as acceleration, speed and load. Such
optimized performance was obtained by incorporating some
means to suppress the increase in emissions rate to be
applicable in the automotive field due to the strict anti-pollution
laws. Befits and challenges of Variable Compression Ratio (VCR)
spark ignition engines had been illustrated, examined and
critically reviewed by Roberts [1]. Also, the implications for
volume manufacture and the strategy for VCR implementation
in order to produce the maximum benefit had been discussed.
Ladommatos and Balian [4] studied the effects of an increased
clearance volume on the performance of a direct-injection
diesel engine. This study was conducted to overcome problems
1231
with combustion at conventional compression ratio, i.e.
constant rc, and at variable rc, but lower that the conventional rc.
Rychter et al. [5] evaluated the concept of varying rc to give
different expansion and compression ratios by means of a
theoretical simulation of a turbocharged diesel engine. They varied the ratio of connecting rod length to crank throw to study
the effect of rc on engine performance at a fixed load. The
principal benefits, at 3/4 load and compression ratio of 20, were
a reduction in fuel consumption by about 2 % and a reduction
in ignition delay that leads to an estimated 6 dB reduction in
combustion noise.
Sobotowski et al. [6] modified a prototype direct injection
diesel engine to incorporate BP Oil variable compression ratio
(VCR) engine concept. Their objective was achieved by
altering the phase relation between two pistons linked to
separate crankshafts and operating in two cylinders arranged in an opposed engine or interconnected through a transfer port.
According to their concept, a novel crankshaft phasing
mechanism was employed to achieve rc variation with a number
of significant advantages over other VCR engine designs.
These advantages includes: (a) mechanical simplicity and
compact design, (b) capability to externally control rc during
engine operation, (c) automatic variation of valve timing and,
(d) compatibility with current production technology.
Thermodynamic models (zero-dimensional), and turbulent
models (multi-dimensional) are commonly used in internal
combustion engines modeling. The first one, which are mainly
based on the energy conservation (first law of thermodynamics), have shown a good agreement with real
engine trends (e.g. [7-9]). On the other hand, models of the
second one (e.g. [10-15]), are less phenomenological than the
first one due to their need to many empirical sub-models for
their completion and its time consuming for execution.
The purpose of this study is to develop a simple, rapid, and
accurate simulation model based on thermodynamic analysis
without the need for a great deal of computational power or
knowledge of precise engine geometrical data to predict the
range of compression ratio corresponding to the optimum
engine performance ( brake specific fuel consumption (bsfc), and brake torque). The developed model is based on mass and
energy conservation laws, equation of state, heat transfer
between the working fluid and cylinder walls, fuel energy
release rate, and engine friction losses. Single zone combustion
is assumed, and thermodynamic properties are calculated from
chemical equilibrium principles for six and/or eleven species. A
stepwise solution is carried out for varying compression ratio
and the engine speed over its entire range (i.e., 1500 rpm to
2800 rpm). In calculations, the temperature and pressure cannot
exceed the maximum allowable temperature and pressure of the
conventional engine, at a constant compression ratio, which are
2100 K and 10.7 MPa, respectively.
NOMENCLATURE
Symbols
CN [--] fuel Cetane Number
cp, cv [J/kg.k) constant pressure and volume specific heats (J/kg.K)
Div [m] intake valve head diameter (m)
h [J/kg] enthalpy (J) , and specific enthalphy (J/kg)
k [--] specific heat ratio
m [kg] mass (kg)
N [rpm] crank speed (rpm)
n [kmol] number of moles (mole)
nc [--] number of cylinders per engine
niv, nr [--] number of intake valves, and rings per cylinder
p [N/m2] pressure (Pa)
Q, q [J, J/m2] heat transfer (J), and heat flux (J/m
2)
rc [--] compression ratio
R [J/kg.K] gas constant (J/kg.k)
Sp [m/s] mean piston velocity (m/s)
T [K] cylinder temperature (K)
V, Vc, Vd [m3] swept; clearance and maximum displacement volumes (m
3)
X [--] Mole fraction
Greek symbols
[degree] crank position angle (degrees)
[--] connecting rod length to crank radius ratio
ivoevo , [degree] exhaust and intake valves opening angles (degrees)
eopen [degree] opening duration angle of exhaust valve (degree)
iopen [degree] opening duration angle of intake valve (degree)
[kg.m3] density (kg/m
3)
[--] equivalence ratio
, [degree] ignition delay period (milliseconds) and ignition delay angle
(degrees)
Abbriviation
gm grams
w.r.t with respect to
Subscripts
b backward
comb combustion
e exit; equilibrium
em exhaust manifold
ex exhaust
f fuel; forward
fb fuel burning
ft total fuel
i indicated; inlet; injection start
ig ignition
im intake manifold
In intake
o ambient condition
p piston
s Stoichiometry, soot
sf, so soot formation and soot oxidation
w Wall, atoms of carbon in fuel-air molecule
x hydrogen atoms in fuel-air molecule
y oxygen atoms in fuel-air molecule
z nitrogen atoms in fuel-air molecule
Superscripts
. derivative with time (d/dt)
- molar quantity
MATHEMATICAL MODEL
Over the past few decades there have been a substantial
progress in the ability to model actual processes that occur
inside the cylinder of the diesel engine. The purpose of the
present study is to utilize thermodynamics, heat transfer, fluid
mechanics, and chemical kinetics fundamentals to predict the
operating characteristics of four-stroke, direct-injection diesel
engine with variable compression ratio. To achieve this goal,
separate sub-models representing different engine aspects are
1232
integrated in the main engine simulation model. These sub-
models are: engine geometry, combustion products,
thermodynamic properties, engine friction and heat transfer,
mass exchange, combustion rate, temperature-pressure and
emission mechanisms. These models are applied to the different processes of actual cycle of a direct-injection diesel engine and
their corresponding governing equations are solved numerically
by constructing a FORTRAN computer code. The main
assumptions considered in this numerical investigation are as
follows: (i) the content of the cylinder is a homogeneous gas
mixture of air (79% N2 and 21% O2 by volume), where fuel
vapor and combustion products and its thermodynamic
properties are calculated using ideal gas laws with temperature
dependent specific heats, (ii) pressure and temperature inside
the cylinder are uniform and vary with the crank angle, (iii) the
gas motion inside the cylinder (created by pressure gradients due to piston motion) is neglected, (iv) single zone combustion
process starts from a rapid premixed burning phase, followed
by slower mixing controlled burning phase and, (v)
temperatures of the cylinder head, cylinder walls and piston
crown are assigned constant values. The detail of the numerical
models is outlined below.
A. Engine Geometry:
The rate of change of the volume with respect to time is given
as:
22 sin
cos1sin
2
1c
c
rVV (1)
B. Combustion Products Model
For temperature 1600 K. the equilibrium composition of gases produced by the combustion of a general hydrocarbon
fuel with air (having a general fuel-air molecule in the form
CwHxOyNz) is calculated based on the assumption that only
gaseous phases are considered. The general combustion
equation of the fuel in air can be written as:
2625
2432221
NnOn
HnCOnOHnCOnNOHCzyxw
(2)
For temperature 1600 K, eleven combustion products are assumed. The chemical reaction can be written as:
OnNnNOn
HnOHnNnOn
HnCOnOHnCOnNOHCzyxw
11109
872625
2432221
(3)
Obtaining moles of eleven combustion products, eleven
equations are needed (i.e. four equations from mass balance of
C, H, O, and N in (3), and seven equations from chemical
equilibrium). These equations have been solved by procedure
mentioned in [16].
C. Thermodynamic Properties of Cylinder Content Model
During each thermal cycle, the cylinder contains in general, air,
fuel vapor, and combustion products with different proportions
depending on the engine conditions under consideration. The
specific heat under constant pressure, enthalpy, and entropy of
the cylinder content are given by:
zz
i
ii
zz
i
pip hXhCXci
11
, (4)
where
zz
i
iii nnX1
/ , and zz (number of different gases) = 6,
and 11 for T<1600 K, and T 1600 K, respectively.
D. Engine Friction Model
Empirical correlations of losses are in terms of compression
ratio, engine speed, bore, stroke, intake and exhaust manifold
pressures, and valves geometry [17] are used in this work.
These correlations were concluded to the following friction
categories as follows:
(i) Piston losses:
03.10238.037.13.9254.1606.02.6
P
S
ccrpSrrnfmep P
(5)
(ii) Blowby losses:
185.1
4.0
100089.6
103.038.386.11 )(
N
rrfmepCCb
(6)
(iii) Exhaust and inlet system throttling losses:
75.2/emimei
PPfmep (7)
(iv) Crankcase mechanical losses:
5.1
2
75.1
1000688.2
1000
43007.0
1000122.12
N
Ld
DnN
L
dNfmep
iviv
c
(8)
(v) Combustion chamber and valve pumping losses:
298.127.198.2 100096.8
ivcivdDnnVNfmep
cc
(9)
The intake and exhaust manifold gage pressures (pim , pem) in (7)
are taken as reported by [18] as:
21000062.0 ,0 Npp emim .
The overall engine frictional power losses are obtained by:
5
1
120i
icdoverallfmepnNVfmep (10)
E. Engine Heat Transfer Model
Eichelberg [19] derived a simple equation for calculating the
instantaneous heat flux out of the engine wq in (W/m2) in
terms of cylinder temperature, pressure, and piston mean
velocity. Rakopoulos and Hountalas [20] modified this
equation into the form:
1233

wpw TTpTSq 2/13/1)(99.1 (11)
Radiation heat transfer was neglected in some studies such as
(e.g. [21- 23]), but it had been considered in others (e.g. [24-
26]). In the present simulation the Eichelberg [19] model as
modified by Rakopoulos and Hountalas [20] is used with the
values of piston crown, cylinder head, and cylinder wall temperatures are taken to be 610 K, 510 K, 510 K, respectively.
F. Mass Exchange Model
Air Intake and Exhaust Exchange- The mass flow rates through
the valves are usually described by the equation for
compressible, one-dimensional isentropic flow. The real flow
effects are included by means of an experimentally determined
discharge coefficient. In the present simulation, the discharge
coefficient is taken as reported in [27] and equal
to 3/1]/)(sin[ openvo . The gas flow rate is related to the
upstream stagnation pressure, stagnation temperature, and static
pressure just downstream of the flow restriction. For the flow
into cylinder through intake valve, the upstream stagnation pressure and temperature are the intake manifold pressure and
temperature (pim, Tim), and downstream static pressure is the
cylinder pressure (p). For flow out of the cylinder through
exhaust valve, the upstream stagnation pressure and
temperature are the cylinder pressure and temperature (p, T),
and downstream static pressure is the exhaust manifold
pressure (pem) [27, 28]. The mass flow rates entering and
leaving the cylinder are defined as follows [29]:
For subsonic inflow where 1
1
2
k
k
in kp
p :
k
k
im
k
imim
imininp
p
p
p
RTk
kpAm
12
11
2 (12)
For sonic and supersonic inflow where 1
1
2
k
k
in kp
p :
1
1
1
2 k
k
im
imininkRT
kpAm (13)
For subsonic outflow where 1
1
2
k
k
em kp
p :
k
k
emk
emexex
p
p
p
p
RTk
kpAm
12
11
2 (14)
For sonic and supersonic outflow where 1
1
2
k
k
em
kp
p
1
1
1
2 k
k
exexkRT
kpAm (15)
where k is the specific heat ratio and its value are taken as the
ratio of specific heats (cp/cv) of the cylinder contents
Mass of Injected Fuel- Mass of fuel injected into cylinder mf
(relative to total injected mass mft) is written (according to [30,
31]) in terms of crank angle () as follows:
injection
o
ft
f
m
m
)(cos1
2
1 (16)
Differentiation of the above equation w.r.t. time leads to the
following equation:
injection
o
injectionft
f
m
msin
2
(17)
G. Combustion Rate Model
Watson et al. [32] developed equations for fuel energy release
appropriate for diesel engine simulations. In their development,
the combustion process starts from a rapid premixed burning
phase (represented by function f1), followed by a slower mixing
controlled burning phase (represented by function f2), with both
functions are empirically linked to the duration of ignition
delay (id~ ) and the duration of combustion (comb). According
to their model, the burned mass of fuel at any angle () related to total injected mass (mft) is:
21 )1(/)ˆ( ffmm ftfb (18)
where: kkf )ˆ1(11 ,
combig /)(ˆ , and 26.037.092.01 id
The ignition delay ( id~ ) is calculated in degrees of crank angle
by empirical correlations [28, 33]. These correlations are in
terms of intake manifold temperature Tim (in Kelvin) and
pressure pim (in bars), compression ratio rc, fuel Cetane Number
(CN)), and mean piston velocity Sp (m/s) as follows:
63.0
1 4.12
2.21
17190
11
25
618840exp622.036.0~
k
cim
k
cim
pid
rPrRT
CNS
(19)
The ignition delay period can be expressed in milliseconds
according to Nidid 006.0~ . Values of the empirical
coefficients k1, k2, k3 and k4 are reported in [28, 34] as follows:
644.0
32
4.28
1 2.14 ,5000 ,10*25.12 kkNk id,
and 25.0
34 79.0 kk . The fuel burning rate w.r.t crank angle ()
can be obtained by differentiating (18) as follows:
comb
kkkkk
ft
fb kkkkkm
d
dm
)ˆexp(ˆ)1(ˆ)ˆ1( 44121
3
)1(
43
)1()1(
21
(20)
H. Temperature - Pressure Relationships
The changes of pressure and temperature with respect to time
are defined as follows:
1234
m
m
T
T
V
V
PP
(21)
j
wjj QhmmBB
C
m
m
B
h
V
V
A
BT
11 (22)
where
P
h
P
T
T
hA
1 , P
PhB
1 , and
P
h
P
hC
1
I. Soot Mechanism
Hiroyasu and Kadota. [35] developed a simple soot model to
predict the production rate of soot mass (sm ) using a single-
step competition between the soot mass formation rate sfm and
the soot mass oxidation rate som according to:
sosfs mmm .
Morel et al. [36] and Wahiduzzaman et al. [37] suggested
models for soot formation and their oxidation in diesel engines.
In their models, the time rates of soot formation and oxidation
are given by:
af
fbsfT
mm3000
exp3.0 (23)
Nd
pT
m
mss
Os
so6
10000exp4.0
2
(24)
where mfb is the mass of fuel burned,
Taf is the adiabatic flame temperature at equivalence ratio of
1.1, ds ( the soot particle diameter) = 0.022*10-6 m , s (soot
density) = 1800 kg/m3 [38].
J. NOx Mechanism
The extended Zeldovich mechanism for NOx formation rate
[27] is formed as follows:
efefb
ee
eefOHkOkNOk
NOKNONOkNO
dt
d
3221
2212
2
21/1
/12
(25)
Where: K12 = (k1f / k1b)/ (k2f / k2b), The constants above are
taken as follow:
Tk f
38000exp106.7 13
1,
TTk f
3150exp104.6 9
2, 13
3 101.4 fk , 13
1 106.1 bk ,
and
TTk b
19500exp105.1 9
2.
SOLUTION PROCEDURE The governing equations (1-25) of the comprehensive model
subjected to the assumptions previously mentioned in
mathematical model are solved for different processes of the
engine cycle. The fourth order Rung-Kutta method is used to
simulate the comprehensive model equations at the prescribed
initial conditions. The engine cycle starts from the moment the
exhaust valve closes. Solution is carried out with end results of
each process taken as the starting conditions for the following
process, and end values for the completed thermal cycle taken
as the starting values for the subsequent cycle. The solution is
iterated and considered satisfactory when the end values of
temperature and pressure of the cycle are within 0.001 % from the starting values of temperature and pressure of the
same cycle. Inputs to the code are the engine specifications similar to HELWAAN M114, operating conditions and fuel
data listed in Table I. The numerical output results are the
instantaneous pressure, temperature, volume, heat transfer,
work, mass exchange, fuel heat release, and engine
performance variables such as brake specific fuel
consumption(bsfc), indicated mean effective pressure (imep),
brake mean effective pressure (bmep), indicated power, brake
power, and volumetric, indicated, brake and mechanical
efficiencies.
Table 1
Engine specifications and operating conditions
Engine type HELWAAN M114
Cylinder bore 112 mm
Stroke 115 mm Number of cylinders 4
Intake valve open angle 9 deg. BTDC
Intake valve close angle 43 deg. ABDC
Exhaust valve open angle 40 deg. BBDC
Exhaust valve close angle 12 deg. ATDC
Start of injection 22 deg. BTDC
Number of injector nozzles 1 with 3 holes
Diameter of injector nozzles 0.45 mm
Conventional compression ratio 16.4
Engine speed range 1500- 2800 rpm
Overall equivalence ratio 0.47 Fuel type C10.8H18.7
Lower latent heat of fuel 42MJ/kg
RESULTS AND DISCUSSIONS
Simulation Results
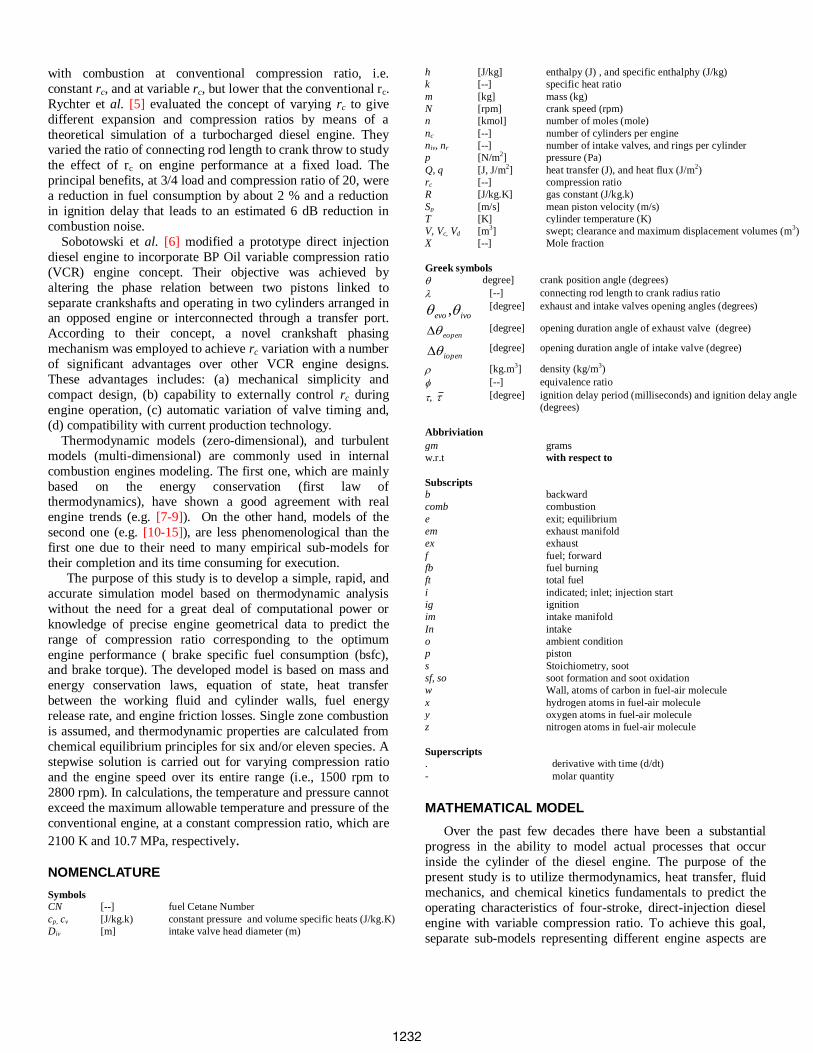
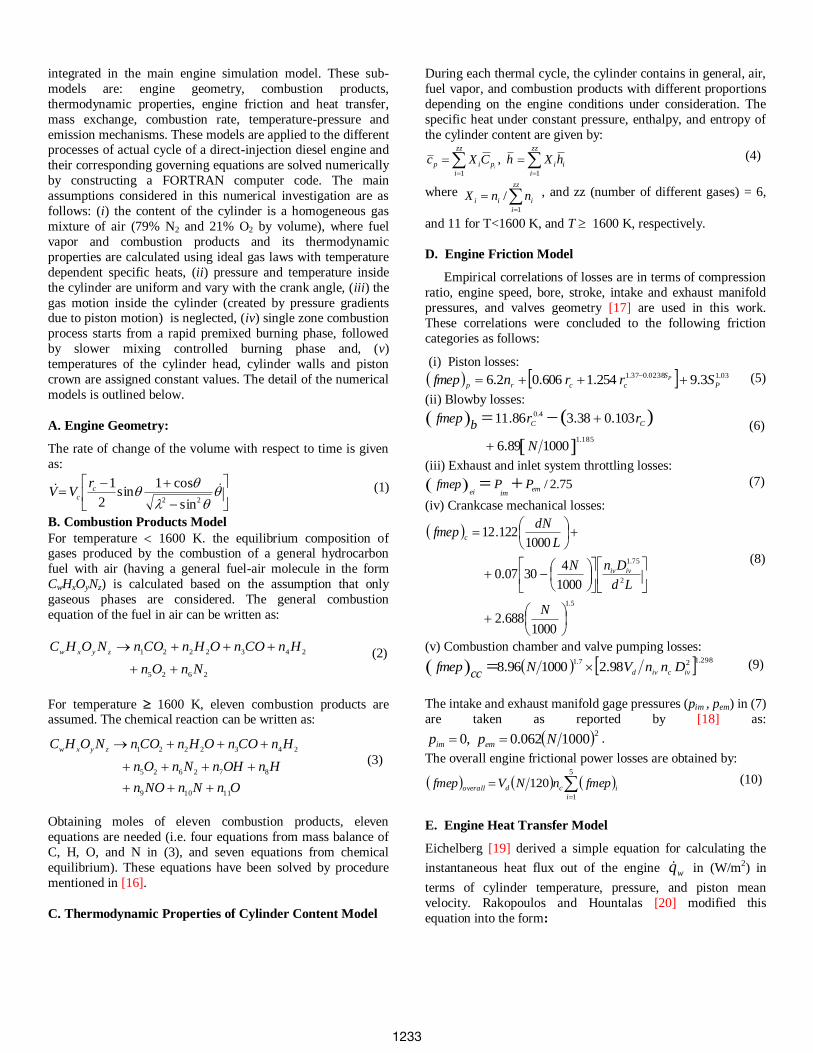
The numerical simulation results are performed for a conventional direct injection (DI) diesel engine with constant compression ratio (specifications and operating conditions are given in Table 1). Sample of these results represent the engine thermodynamic cycle, temperature and pressure variation throughout the cycle, the rates of mass entering and leaving cylinder, and the in-cylinder NOx and soot history along the cycle are displayed in Figures 1 through 4, respectively.
1235
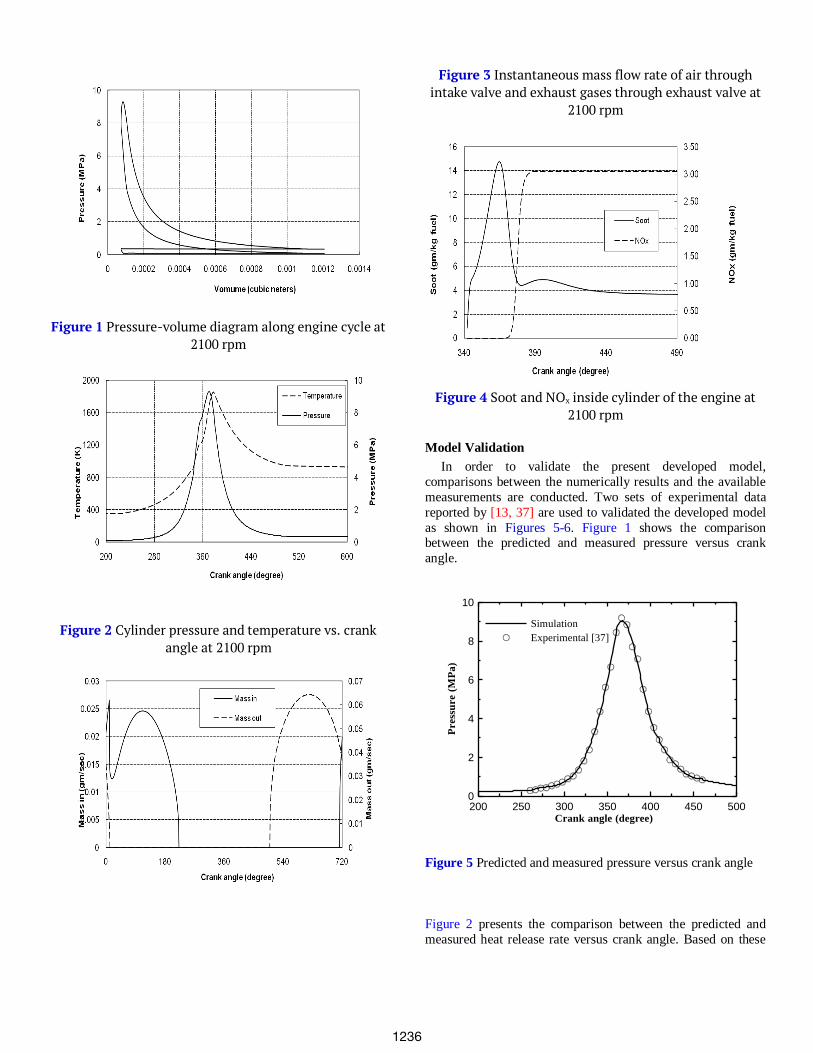
Figure 1 Pressure-volume diagram along engine cycle at
2100 rpm
Figure 2 Cylinder pressure and temperature vs. crank angle at 2100 rpm
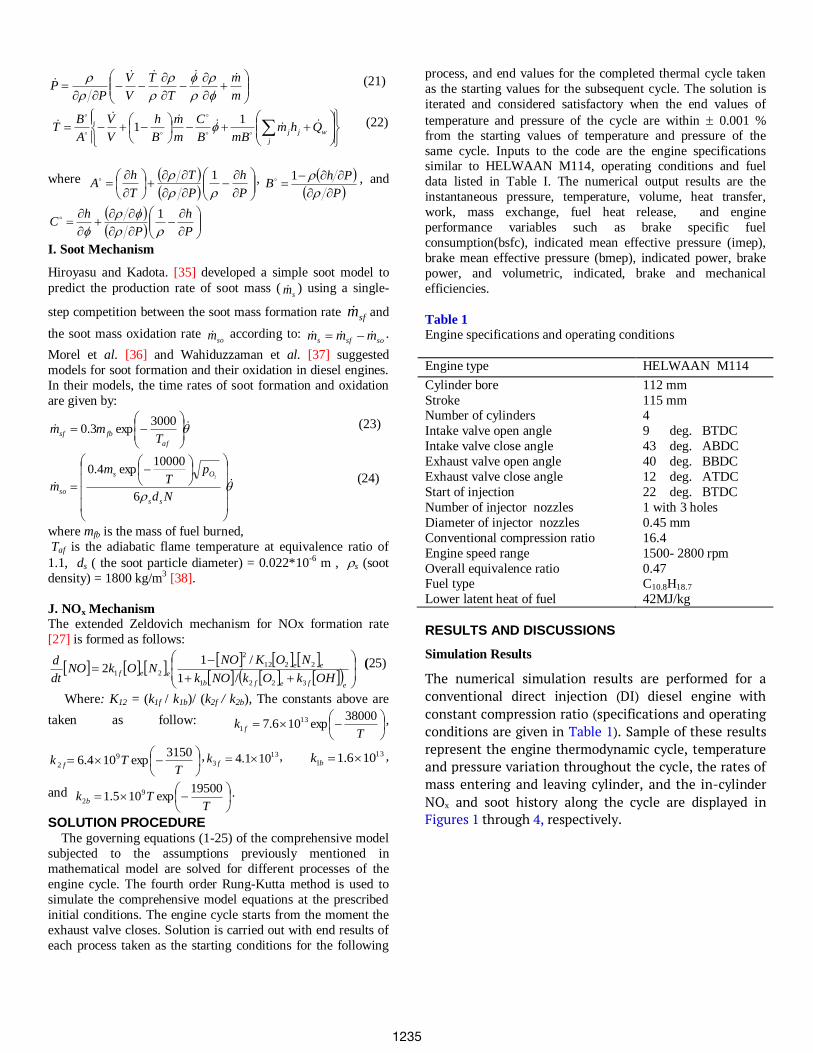
Figure 3 Instantaneous mass flow rate of air through intake valve and exhaust gases through exhaust valve at
2100 rpm
Figure 4 Soot and NOx inside cylinder of the engine at
2100 rpm
Model Validation
In order to validate the present developed model,
comparisons between the numerically results and the available
measurements are conducted. Two sets of experimental data
reported by [13, 37] are used to validated the developed model
as shown in Figures 5-6. Figure 1 shows the comparison between the predicted and measured pressure versus crank
angle.
200 250 300 350 400 450 500Crank angle (degree)
0
2
4
6
8
10
Press
ure (
MP
a)
Simulation
Experimental [37]
Figure 5 Predicted and measured pressure versus crank angle
Figure 2 presents the comparison between the predicted and
measured heat release rate versus crank angle. Based on these
1236
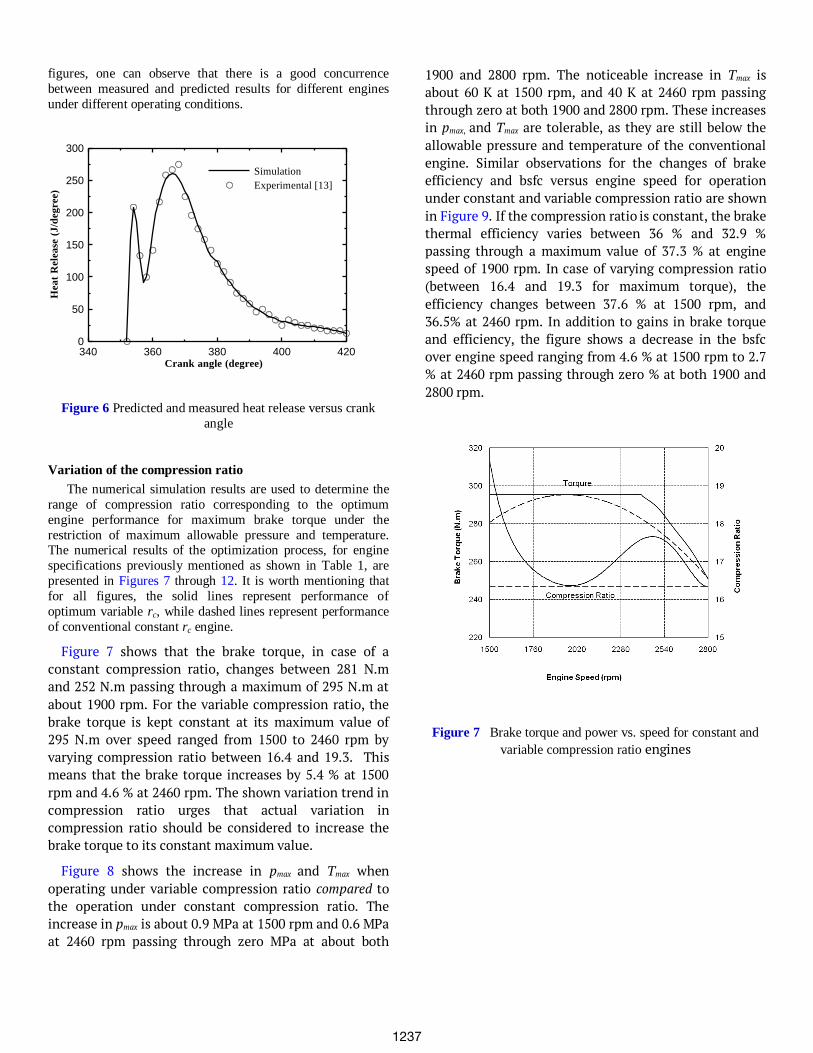
figures, one can observe that there is a good concurrence
between measured and predicted results for different engines
under different operating conditions.
340 360 380 400 420Crank angle (degree)
0
50
100
150
200
250
300
Hea
t R
ele
ase
(J
/deg
ree)
Simulation
Experimental [13]
Figure 6 Predicted and measured heat release versus crank
angle
Variation of the compression ratio
The numerical simulation results are used to determine the
range of compression ratio corresponding to the optimum
engine performance for maximum brake torque under the
restriction of maximum allowable pressure and temperature. The numerical results of the optimization process, for engine
specifications previously mentioned as shown in Table 1, are
presented in Figures 7 through 12. It is worth mentioning that
for all figures, the solid lines represent performance of
optimum variable rc, while dashed lines represent performance
of conventional constant rc engine.
Figure 7 shows that the brake torque, in case of a constant compression ratio, changes between 281 N.m and 252 N.m passing through a maximum of 295 N.m at about 1900 rpm. For the variable compression ratio, the brake torque is kept constant at its maximum value of 295 N.m over speed ranged from 1500 to 2460 rpm by varying compression ratio between 16.4 and 19.3. This means that the brake torque increases by 5.4 % at 1500 rpm and 4.6 % at 2460 rpm. The shown variation trend in compression ratio urges that actual variation in compression ratio should be considered to increase the brake torque to its constant maximum value.
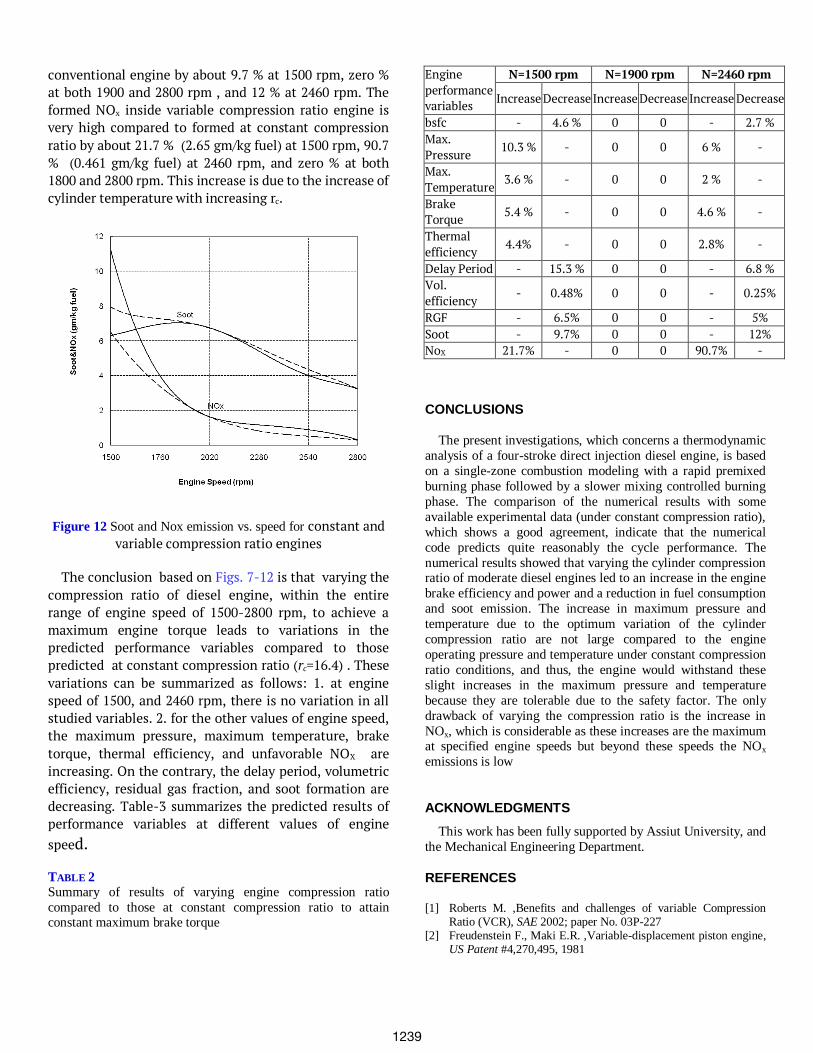
Figure 8 shows the increase in pmax and Tmax when operating under variable compression ratio compared to the operation under constant compression ratio. The increase in pmax is about 0.9 MPa at 1500 rpm and 0.6 MPa at 2460 rpm passing through zero MPa at about both
1900 and 2800 rpm. The noticeable increase in Tmax is about 60 K at 1500 rpm, and 40 K at 2460 rpm passing through zero at both 1900 and 2800 rpm. These increases in pmax, and Tmax are tolerable, as they are still below the allowable pressure and temperature of the conventional engine. Similar observations for the changes of brake efficiency and bsfc versus engine speed for operation under constant and variable compression ratio are shown in Figure 9. If the compression ratio is constant, the brake thermal efficiency varies between 36 % and 32.9 % passing through a maximum value of 37.3 % at engine speed of 1900 rpm. In case of varying compression ratio (between 16.4 and 19.3 for maximum torque), the efficiency changes between 37.6 % at 1500 rpm, and 36.5% at 2460 rpm. In addition to gains in brake torque and efficiency, the figure shows a decrease in the bsfc over engine speed ranging from 4.6 % at 1500 rpm to 2.7 % at 2460 rpm passing through zero % at both 1900 and 2800 rpm.
Figure 7 Brake torque and power vs. speed for constant and
variable compression ratio engines
1237
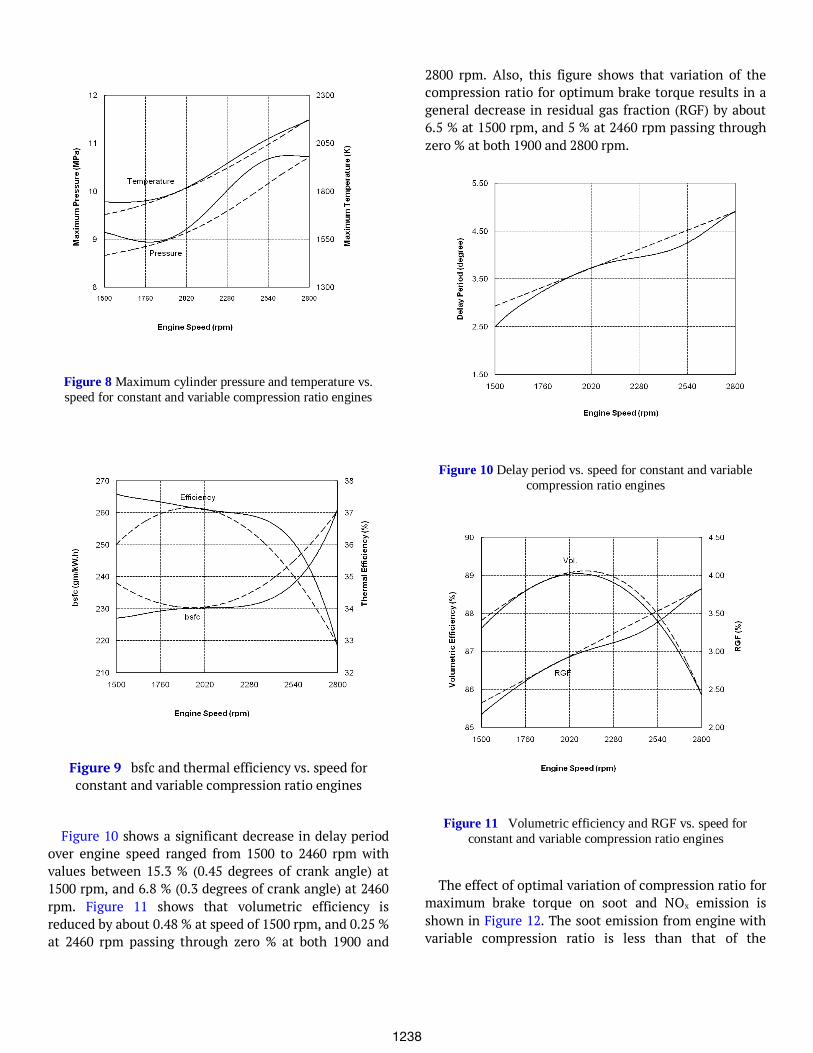
Figure 8 Maximum cylinder pressure and temperature vs.
speed for constant and variable compression ratio engines
Figure 9 bsfc and thermal efficiency vs. speed for constant and variable compression ratio engines
Figure 10 shows a significant decrease in delay period
over engine speed ranged from 1500 to 2460 rpm with values between 15.3 % (0.45 degrees of crank angle) at 1500 rpm, and 6.8 % (0.3 degrees of crank angle) at 2460 rpm. Figure 11 shows that volumetric efficiency is reduced by about 0.48 % at speed of 1500 rpm, and 0.25 % at 2460 rpm passing through zero % at both 1900 and
2800 rpm. Also, this figure shows that variation of the compression ratio for optimum brake torque results in a general decrease in residual gas fraction (RGF) by about 6.5 % at 1500 rpm, and 5 % at 2460 rpm passing through zero % at both 1900 and 2800 rpm.
Figure 10 Delay period vs. speed for constant and variable
compression ratio engines
Figure 11 Volumetric efficiency and RGF vs. speed for
constant and variable compression ratio engines
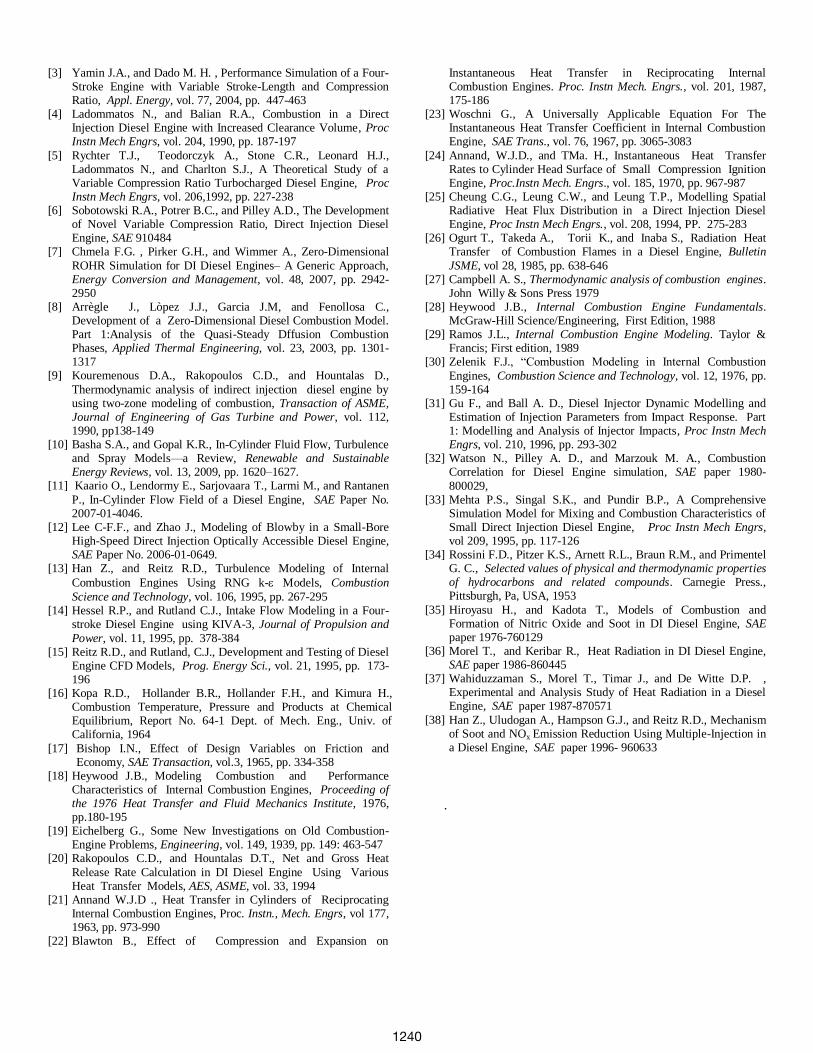
The effect of optimal variation of compression ratio for
maximum brake torque on soot and NOx emission is shown in Figure 12. The soot emission from engine with variable compression ratio is less than that of the
1238
conventional engine by about 9.7 % at 1500 rpm, zero % at both 1900 and 2800 rpm , and 12 % at 2460 rpm. The formed NOx inside variable compression ratio engine is very high compared to formed at constant compression ratio by about 21.7 % (2.65 gm/kg fuel) at 1500 rpm, 90.7 % (0.461 gm/kg fuel) at 2460 rpm, and zero % at both 1800 and 2800 rpm. This increase is due to the increase of cylinder temperature with increasing rc.
Figure 12 Soot and Nox emission vs. speed for constant and
variable compression ratio engines
The conclusion based on Figs. 7-12 is that varying the compression ratio of diesel engine, within the entire range of engine speed of 1500-2800 rpm, to achieve a maximum engine torque leads to variations in the predicted performance variables compared to those predicted at constant compression ratio (rc=16.4) . These variations can be summarized as follows: 1. at engine speed of 1500, and 2460 rpm, there is no variation in all studied variables. 2. for the other values of engine speed, the maximum pressure, maximum temperature, brake torque, thermal efficiency, and unfavorable NOX are increasing. On the contrary, the delay period, volumetric efficiency, residual gas fraction, and soot formation are decreasing. Table-3 summarizes the predicted results of performance variables at different values of engine speed.
TABLE 2
Summary of results of varying engine compression ratio
compared to those at constant compression ratio to attain constant maximum brake torque
Engine performance variables
N=1500 rpm N=1900 rpm N=2460 rpm
Increase Decrease Increase Decrease Increase Decrease
bsfc - 4.6 % 0 0 - 2.7 % Max. Pressure 10.3 % - 0 0 6 % -
Max. Temperature 3.6 % - 0 0 2 % -
Brake Torque 5.4 % - 0 0 4.6 % -
Thermal efficiency 4.4% - 0 0 2.8% -
Delay Period - 15.3 % 0 0 - 6.8 % Vol. efficiency - 0.48% 0 0 - 0.25%
RGF - 6.5% 0 0 - 5% Soot - 9.7% 0 0 - 12% NoX 21.7% - 0 0 90.7% -
CONCLUSIONS
The present investigations, which concerns a thermodynamic
analysis of a four-stroke direct injection diesel engine, is based
on a single-zone combustion modeling with a rapid premixed
burning phase followed by a slower mixing controlled burning
phase. The comparison of the numerical results with some
available experimental data (under constant compression ratio),
which shows a good agreement, indicate that the numerical
code predicts quite reasonably the cycle performance. The
numerical results showed that varying the cylinder compression ratio of moderate diesel engines led to an increase in the engine
brake efficiency and power and a reduction in fuel consumption
and soot emission. The increase in maximum pressure and
temperature due to the optimum variation of the cylinder
compression ratio are not large compared to the engine
operating pressure and temperature under constant compression
ratio conditions, and thus, the engine would withstand these
slight increases in the maximum pressure and temperature
because they are tolerable due to the safety factor. The only
drawback of varying the compression ratio is the increase in
NOx, which is considerable as these increases are the maximum at specified engine speeds but beyond these speeds the NOx
emissions is low
ACKNOWLEDGMENTS
This work has been fully supported by Assiut University, and
the Mechanical Engineering Department.
REFERENCES
[1] Roberts M. ,Benefits and challenges of variable Compression Ratio (VCR), SAE 2002; paper No. 03P-227
[2] Freudenstein F., Maki E.R. ,Variable-displacement piston engine, US Patent #4,270,495, 1981
1239
[3] Yamin J.A., and Dado M. H. , Performance Simulation of a Four-Stroke Engine with Variable Stroke-Length and Compression Ratio, Appl. Energy, vol. 77, 2004, pp. 447-463
[4] Ladommatos N., and Balian R.A., Combustion in a Direct Injection Diesel Engine with Increased Clearance Volume, Proc Instn Mech Engrs, vol. 204, 1990, pp. 187-197
[5] Rychter T.J., Teodorczyk A., Stone C.R., Leonard H.J., Ladommatos N., and Charlton S.J., A Theoretical Study of a Variable Compression Ratio Turbocharged Diesel Engine, Proc Instn Mech Engrs, vol. 206,1992, pp. 227-238
[6] Sobotowski R.A., Potrer B.C., and Pilley A.D., The Development of Novel Variable Compression Ratio, Direct Injection Diesel Engine, SAE 910484
[7] Chmela F.G. , Pirker G.H., and Wimmer A., Zero-Dimensional
ROHR Simulation for DI Diesel Engines– A Generic Approach, Energy Conversion and Management, vol. 48, 2007, pp. 2942-2950
[8] Arrègle J., Lòpez J.J., Garcia J.M, and Fenollosa C., Development of a Zero-Dimensional Diesel Combustion Model. Part 1:Analysis of the Quasi-Steady Dffusion Combustion Phases, Applied Thermal Engineering, vol. 23, 2003, pp. 1301-1317
[9] Kouremenous D.A., Rakopoulos C.D., and Hountalas D.,
Thermodynamic analysis of indirect injection diesel engine by using two-zone modeling of combustion, Transaction of ASME, Journal of Engineering of Gas Turbine and Power, vol. 112, 1990, pp138-149
[10] Basha S.A., and Gopal K.R., In-Cylinder Fluid Flow, Turbulence and Spray Models—a Review, Renewable and Sustainable Energy Reviews, vol. 13, 2009, pp. 1620–1627.
[11] Kaario O., Lendormy E., Sarjovaara T., Larmi M., and Rantanen
P., In-Cylinder Flow Field of a Diesel Engine, SAE Paper No. 2007-01-4046.
[12] Lee C-F.F., and Zhao J., Modeling of Blowby in a Small-Bore High-Speed Direct Injection Optically Accessible Diesel Engine, SAE Paper No. 2006-01-0649.
[13] Han Z., and Reitz R.D., Turbulence Modeling of Internal
Combustion Engines Using RNG k- Models, Combustion
Science and Technology, vol. 106, 1995, pp. 267-295 [14] Hessel R.P., and Rutland C.J., Intake Flow Modeling in a Four-
stroke Diesel Engine using KIVA-3, Journal of Propulsion and
Power, vol. 11, 1995, pp. 378-384 [15] Reitz R.D., and Rutland, C.J., Development and Testing of Diesel
Engine CFD Models, Prog. Energy Sci., vol. 21, 1995, pp. 173-196
[16] Kopa R.D., Hollander B.R., Hollander F.H., and Kimura H., Combustion Temperature, Pressure and Products at Chemical Equilibrium, Report No. 64-1 Dept. of Mech. Eng., Univ. of California, 1964
[17] Bishop I.N., Effect of Design Variables on Friction and Economy, SAE Transaction, vol.3, 1965, pp. 334-358
[18] Heywood J.B., Modeling Combustion and Performance Characteristics of Internal Combustion Engines, Proceeding of the 1976 Heat Transfer and Fluid Mechanics Institute, 1976, pp.180-195
[19] Eichelberg G., Some New Investigations on Old Combustion- Engine Problems, Engineering, vol. 149, 1939, pp. 149: 463-547
[20] Rakopoulos C.D., and Hountalas D.T., Net and Gross Heat
Release Rate Calculation in DI Diesel Engine Using Various Heat Transfer Models, AES, ASME, vol. 33, 1994
[21] Annand W.J.D ., Heat Transfer in Cylinders of Reciprocating Internal Combustion Engines, Proc. Instn., Mech. Engrs, vol 177, 1963, pp. 973-990
[22] Blawton B., Effect of Compression and Expansion on
Instantaneous Heat Transfer in Reciprocating Internal Combustion Engines. Proc. Instn Mech. Engrs., vol. 201, 1987, 175-186
[23] Woschni G., A Universally Applicable Equation For The Instantaneous Heat Transfer Coefficient in Internal Combustion Engine, SAE Trans., vol. 76, 1967, pp. 3065-3083
[24] Annand, W.J.D., and TMa. H., Instantaneous Heat Transfer Rates to Cylinder Head Surface of Small Compression Ignition Engine, Proc.Instn Mech. Engrs., vol. 185, 1970, pp. 967-987
[25] Cheung C.G., Leung C.W., and Leung T.P., Modelling Spatial Radiative Heat Flux Distribution in a Direct Injection Diesel Engine, Proc Instn Mech Engrs., vol. 208, 1994, PP. 275-283
[26] Ogurt T., Takeda A., Torii K., and Inaba S., Radiation Heat Transfer of Combustion Flames in a Diesel Engine, Bulletin
JSME, vol 28, 1985, pp. 638-646 [27] Campbell A. S., Thermodynamic analysis of combustion engines.
John Willy & Sons Press 1979 [28] Heywood J.B., Internal Combustion Engine Fundamentals.
McGraw-Hill Science/Engineering, First Edition, 1988 [29] Ramos J.L., Internal Combustion Engine Modeling. Taylor &
Francis; First edition, 1989 [30] Zelenik F.J., “Combustion Modeling in Internal Combustion
Engines, Combustion Science and Technology, vol. 12, 1976, pp. 159-164
[31] Gu F., and Ball A. D., Diesel Injector Dynamic Modelling and Estimation of Injection Parameters from Impact Response. Part 1: Modelling and Analysis of Injector Impacts, Proc Instn Mech Engrs, vol. 210, 1996, pp. 293-302
[32] Watson N., Pilley A. D., and Marzouk M. A., Combustion Correlation for Diesel Engine simulation, SAE paper 1980-
800029, [33] Mehta P.S., Singal S.K., and Pundir B.P., A Comprehensive
Simulation Model for Mixing and Combustion Characteristics of Small Direct Injection Diesel Engine, Proc Instn Mech Engrs, vol 209, 1995, pp. 117-126
[34] Rossini F.D., Pitzer K.S., Arnett R.L., Braun R.M., and Primentel G. C., Selected values of physical and thermodynamic properties of hydrocarbons and related compounds. Carnegie Press., Pittsburgh, Pa, USA, 1953
[35] Hiroyasu H., and Kadota T., Models of Combustion and Formation of Nitric Oxide and Soot in DI Diesel Engine, SAE paper 1976-760129
[36] Morel T., and Keribar R., Heat Radiation in DI Diesel Engine, SAE paper 1986-860445
[37] Wahiduzzaman S., Morel T., Timar J., and De Witte D.P. , Experimental and Analysis Study of Heat Radiation in a Diesel Engine, SAE paper 1987-870571
[38] Han Z., Uludogan A., Hampson G.J., and Reitz R.D., Mechanism of Soot and NOx Emission Reduction Using Multiple-Injection in a Diesel Engine, SAE paper 1996- 960633
.
1240