Zero Carbon Latin America - Parlamento …parlatino.org/pdf/eventos/zero-carbon-alatina.pdf ·...
119
i Zero Carbon Latin America A Pathway for Net Decarbonisation of the Regional Economy by mid-century Vision Paper Draft October 2 nd , 2015 Walter Vergara Joergen V Fenhann Marco C Schletz UNEP-DTU PARTNERSHIP
Transcript of Zero Carbon Latin America - Parlamento …parlatino.org/pdf/eventos/zero-carbon-alatina.pdf ·...
i
Zero Carbon Latin America
A Pathway for Net Decarbonisation of the Regional Economy by mid-century
Vision Paper
Draft October 2nd , 2015
Walter Vergara Joergen V Fenhann Marco C Schletz
UNEP-DTU PARTNERSHIP
ii
Outline
Zero Carbon Latin America
A Pathway to Net Decarbonisation of the Regional Economy by mid century
Content List
Outline .............. ii
Content List .............. ii
Figures .............. v
Tables .............. vi
Acronyms ............. vii
Acknowledgements .............. ix
Executive Summary ...............x
1 Background and rationale .............. 1
1.1 Background .................................................................................................................. 1
1.2 Rationale ...................................................................................................................... 3
1.3 Data sources ................................................................................................................ 6
2 Decarbonisation of power generation .............. 8
2.1 Current Situation ......................................................................................................... 8
2.2 Resource Endowment ................................................................................................ 12
2.3 Market size for renewables is increasing .................................................................. 15
2.4 Evolution of regulatory frameworks.......................................................................... 15
2.5 Renewable energy targets ......................................................................................... 17
2.6 Grid modernization and integration .......................................................................... 18
2.6.1 Dispatch of intermittent sources ....................................................................... 19
2.6.2 Increased system reliability ................................................................................ 19
2.7 Distributed power ...................................................................................................... 20
2.8 Hydropower as a regional storage capacity .............................................................. 21
2.9 The economics of renewable energy generation ...................................................... 22
iii
2.9.1 Levelized cost of electricity generation using renewables ................................ 23
2.9.2 Projected Evolution of LCOEs (learning curves) ................................................. 24
3 Mass electrification of the transport sector ............ 28
3.1 Current situation ........................................................................................................ 28
3.2 Characterization of the road segment of the transport sector ................................. 30
3.2.1 Motorization rates .............................................................................................. 32
3.2.2 Bus Rapid Transit Systems (BRTs) ...................................................................... 35
3.2.3 Freight Transport ................................................................................................ 36
3.2.4 Railroads ............................................................................................................. 37
3.2.5 Maritime Transport ............................................................................................ 38
3.2.6 Aviation .............................................................................................................. 39
3.2.7 Alternative fuels in transport ............................................................................. 39
3.3 The impact of transport operations on air quality .................................................... 40
3.4 Mass Electrification of Transport .............................................................................. 41
3.4.1 Storage of Power for Transport Vehicles ........................................................... 42
3.5 Levelized cost of electric transport ........................................................................... 44
3.5.1 Net effect of the mass electrification of the transport sector on power demand ............................................................................................................................ 47
3.5.2 Barriers to mass electrification of transport ...................................................... 48
4 Land: From a carbon source to a carbon sink ............ 50
4.1 Current Situation ....................................................................................................... 50
4.2 Avoided Deforestation............................................................................................... 51
4.3 Reforestation and Land Restoration ......................................................................... 55
4.3.1 Reforestation ...................................................................................................... 55
4.3.2 Land restoration ................................................................................................. 57
4.4 The net economic benefits of reforestation and restoration efforts ........................ 59
4.5 Low carbon agriculture .............................................................................................. 61
4.5.1 Some potential measures to reduce emissions from agriculture in the region 62
4.5.2 Abatement of CH4 emissions from livestock ...................................................... 64
5 Decarbonisation of Industry ............ 69
5.1 Current Situation ....................................................................................................... 69
5.1.1 Pathway analysis to assess potential emission reductions from industry ......... 71
6 A route for Zero Carbon Emissions ............ 74
6.1.1 Land use and land use change from source to sink ........................................... 78
6.1.2 Decarbonisation of industry ............................................................................... 79
6.1.3 Projected decarbonisation pace ........................................................................ 80

iv
7 Conclusions ............ 81
References ............ 83
Annexes ............ 98
Annex I .................................................................................................................................. 98
Annex II ............................................................................................................................... 103
Annex I ..................................................................................... Error! Bookmark not defined.
Annex IV ............................................................................................................................. 104
Annex V............................................................................................................................... 105
v
Figures
Figure 1.1 – Likely relationship between cumulative CO2 emissions and temperature change relative to 1861-1880. ....................................................................................................... 1 Figure 1.2 - Available carbon budget to remain within 2°C temperature anomaly. ............. 2 Figure 1.3 - Per capita emissions in different regions and large countries. .......................... 3 Figure 2.1 – Projected demand for electricity under IIASA´s BAU and GEA Mix Scenarios. .. 9 Figure 2.2 – Historical and projected GHG emissions from the power sector. ................... 10 Figure 2.3 – Historical total power generation by source from 1971 to 2014 (in PWh/year). ....................................................................................................................................... 11 Figure 2.4 – Estimated resource endowment from renewables in Latin America. ............. 12 Figure 2.5 – Recent Evolution of generation costs by renewable energy installations as per IRENA renewable energy database (in US$/kWh). ........................................................... 23 Figure 2.6 – Estimated levelized costs of generation (LCOE) through renewables in LAC. .. 24 Figure 2.7 – Estimated learning curves for renewables expressed in projected LCOEs....... 25 Figure 3.1 – Projected energy use by the transport sector................................................ 29 Figure 3.2 – Historical and projected emissions from the transport sector. ...................... 30 Figure 3.3 – CO2 emissions from the transport sector in LAC in 2010 in MtCO2e. .............. 30 Figure 3.4 – Modal share of transport (in passenger trips) in urban areas. ....................... 32 Figure 3.5 – Evolution of motorization rates in the region (vehicles per 1000 inhabitants).33 Figure 3.6 - Aggregate Vehicle-Miles Travelled in the US under Scenarios of Future Travel Growth, 1946-2040. ........................................................................................................ 34 Figure 3.7 – Modal composition of Freight Transport in Selected countries in LAC. .......... 37 Figure 3.8 – The growth of railroad transport in the region. ............................................. 38 Figure 3.9 – Type of fuels used in the transport sector. .................................................... 40 Figure 3.10 – Evolution and projected costs of lithium-ion batteries. ............................... 43 Figure 3.11 – Current (2012) levelized cost of alternative transport drive options. ........... 45 Figure 3.12 – Projected learning curves for electric vehicle options. ................................. 46 Figure 3.13 – Projected learning curves for electric vehicle options with credit for avoided cost of air pollution. ........................................................................................................ 47 Figure 3.14 – Estimated power demand by an electrified transport sector. ...................... 47 Figure 3.15 – Energy savings from full transport electrification. ....................................... 48 Figure 4.1 – Historical and projected IIASA GHG land use, land use change emissions and agricultural emissions ..................................................................................................... 51 Figure 4.2 – Historical deforestation in the Amazon region of Brazil. ................................ 53 Figure 4.3 – 2012 GHG emissions from agriculture/forestry in GtCO2e/year. .................... 62 Figure 5.1 - Historical and projected energy use by Industry ............................................ 70 Figure 5.2 – Historical and projected industry emissions (Industrial processes, manufacturing, construction, fugitive emissions and other fuel combustion). .................. 70 Figure 6.1 - Decarbonization of the Power sector. ........................................................... 76 Figure 6.2 - Decarbonization of the Transport Sector. ...................................................... 77

vi
Tables
Table 1.1 – Composition and recent evolution of LAC’s carbon footprint............................ 4 Table 2.1 – Carbon intensity of power sectors. .................................................................. 9 Table 2.2 – Recent additions of other renewables (in GW). .............................................. 11 Table 2.3 – Irradiations in selected solar hot spots. ......................................................... 13 Table 2.4 - Summary of renewable energy policies in Latin America. ............................... 16 Table 2.5 – Current status and established targets for entry of renewable sources for Electricity Generation. .................................................................................................... 18 Table 2.6 – List of grid interconnection projects as of mid 2015. ...................................... 20 Table 3.1 – Estimated size and emissions from the road fleet in Latin America. ................ 31 Table 3.2 – Motorization rates in selected cities in the region (cars per inhabitant). ......... 34 Table 3.3 – Cost effectiveness for different modes of mass transport in urban areas (example of Bogota). ...................................................................................................................... 35 Table 3.4 – Prospective transformation of transport fleet. ............................................... 42 Table 4.1 – The deforestation picture in the region in MHa. ............................................. 52 Table 4.2 – Estimates of the cost of avoiding deforestation ............................................. 54 Table 4.3 – Restoration Opportunities in LAC in Million Ha. ............................................. 55 Table 4.4 – Carbon sinks in Tropical Forests (Amazon region) in Latin America. ................ 57 Table 4.5 – Some Net Carbon Storage Rates in Land Restoration Systems in tC/ha-year. .. 59 Table 4.6 – Options that have been proposed to provide for net reductions in GHG emissions from agriculture through nutrient management. ............................................................. 63 Table 4.7 - Some schemes for abatement of methane in bovine livestock in Argentina. ... 66 Table 4.8- Potential carbon storage/abatement rates through reforestation and restoration and sustainable agriculture efforts. ................................................................................. 66 Table 4.9 - Summary of economic potential for land use change and GHG abatement measures in Latin America. ............................................................................................. 67 Table 5.1 - Results of analysis to estimate GHG reductions in industry. ............................ 71 Table 5.2 - Potential for energy savings in industry. ......................................................... 73 Table 6.1 - Projected decarbonisation route for the power sector. ................................... 75 Table 6.2 - Projected decarbonisation route for the marine, road and railroad transport sector. ............................................................................................................................ 77 Table 6.3 - Synergies between technologies supportive of a low carbon power and transport. ....................................................................................................................................... 78 Table 6.4 - Projected carbon sink route for LAC. .............................................................. 79 Table 6.5 - GHG emissions under BAU and projected decarbonisation pathway in 2050. .. 80 Table 0.1 - List of hydropower plants in LAC with a capacity >1000MW/1GW. ................ 101
vii
Acronyms
AFS Agro-forestry System AFOLU Agriculture, Forestry and Other Land Use AFSP Food security premiums AP Agricultural output BAU Business as Usual BRT Bus Rapid Transit System C Carbon cm Centimetre CO Carbon monoxide CO2 Carbon dioxide CO2e Carbon dioxide equivalent COP 21 21th Conference of the Parties, Paris 2015 CRF Controlled Release Fertilizers CSP Concentrated Solar Power EJ Exajoule ENSO El Niño-Southern Oscillation E&M Establishment and Maintenance e.g. For example ET Ecotourism income EU European Union FITs Feed-in tariffs G7 Group of 7 GACMO Greenhouse gas Abatement Cost MOdel GDP Gross Domestic Product GHG Greenhouse gas GtC Giga-tons of Carbon GtCO2e Giga-tons of Carbon dioxide equivalent GW Gigawatt ha Hectare IPCC Intergovernmental Panel on Climate Change kWh Kilowatt hour LAC Latin American and the Caribbean, México LCOEs Levelized Costs of Electricity generated LULUCF Land Use, Land-Use Change and Forestry m2 Square meter MHa Million hectare mn Million MW Megawatt MWh Megawatt hour N2O Nitrous Oxide NOx Mono-nitrogen oxides NPVs Net Present Value? p.31 NRT NWFP Non-wood forest products PMs Particulate Matter PV Photovoltaic
viii
RPS Renewable portfolio standards s Second solar PV Solar photovoltaic ppm Parts per million PWh Petawatt hour t Ton tCO2e Tons of Carbon dioxide equivalent tpc Tons per capital TW Terawatt TWh Terawatt hour UNFCCC United Nations Framework Convention on Climate Change UN United Nations US United States of America US$ United States Dollar VOCs Volatile Organic Compounds Wh Watt-hour WFP Wood Forest Products WRI World Resources Institute
ix
Acknowledgements
The authors wish to acknowledge the support and encouragement received from the UNEP-DTU team in Copenhagen, led by its Director John Christensen and Head of Programme Miriam Hinostroza during the preparation of the analysis and finalization of this report. Thanks are also due to Lester Brown, John Topping III, Matthew Roney, Harald Diaz-Bone, Kaisa Karttunen, Luis Miguel Galindo, Jose Luis Samaniego and Daniel Bouille for expending time and effort in reviewing an earlier draft. Special thanks are due to Keywan Riahi and Oliver Fricko from IIASA and Johannes Friedrich and Mengpin Ge from WRI for their help with information and access to the IIASA and CAIT databases.
x
Executive Summary
The objective of the analysis is to visualize a pathway for complete decarbonisation of the Latin American and the Caribbean (LAC) regional economy by mid-century. This is done through the review of specific sector-wide actions, within a foreseeable technology and economics context. The analysis is being done at a time of considerable momentum to address the climate challenge, at a global level; and, after a decade of remarkable socio-economic progress at a regional level. The report also comments on key barriers to be addressed.
Aiming at full decarbonisation in economic activities is increasingly relevant as the consequences of climate change have become clearer and the prospect of surpassing the dangerous threshold of 2 degrees warming now seems unavoidable. But, why should rapid reductions in the carbon emissions take place in Latin America? And why should zero carbon be targeted?
LAC is probably closer to zero emissions, in the aggregate, than any other region globally. It accounted in 2012 for about 10% of global emissions (4.6 GtCO2e) which translate into 7.7 tCO2e per capita (CAIT, 2015). Power generation in LAC is already largely driven by renewables, a key reason behind its very low carbon intensity (0.21 tCO2e /MWh) (Brander et al., 2011). Secondly, the transport sector, despite fast urbanization and motorization rates is still low-carbon intensive, with urban areas, surpassing even their counterparts in northern Europe, in the share of passenger trips provided by public transport.
Most relevant however, is the relation between carbon emissions and land degradation. Recent improvements in the carbon intensity of economic activities, a 22% reduction! Between 2000 and 2012, per unit of GDP PPP (CAIT, 2015) can be traced back mostly to decreases in the rate of deforestation and improvements in energy efficiency. In this context, avoided deforestation, vigorous reforestation and restoration efforts, as well as the adoption of sustainable practices in agriculture, hold a significant potential to change the GHG emissions picture in LAC. Finally, industrial activity has an untapped potential for modernization and improvements in energy efficiency. There are other sectors that contribute to the GHG footprint; but, those listed here account for over 90% of all emissions (CAIT, 2015).
While there are no silver bullet solutions for a wholesale reduction of emissions, a series of sector-wide activities is reviewed for their potential to contribute to a net zero carbon regional economy. These activities include: a) complete decarbonisation of the power sector through the deployment of renewable energy options; b) mass electrification of the transport sector; c) large scale land restoration, including attainment of zero deforestation and the accumulation of carbon stocks in agriculture and forestry; and d) decarbonisation of industry. Improvements in efficiency of energy use are considered part and parcel of all activities. Ultimately, these transformations will take place provided there is a supportive policy framework and depending on the economics of the changes sought.
xi
Decarbonisation of the power sector. There is the expectation that the outlook for supportive policies; the prospects of grid modernization and integration; the substantial resource endowment; but above all, the current and growing financial advantage of wind, solar and other technologies provide a sufficient basis on which a scenario of full decarbonisation of the growing power sector in the region can be visualized. Market conditions already enable most of the new demand to be met largely through renewables. These resources, in the form of an increasing array of technologies will be able to displace, on sound economic grounds, existing fossil fuel (coal and natural gas) capacity and dominate the market backed up by the large hydropower capacity in the region. Displacement of fossil fuel sources is projected to reduce the costs (by about 1-3 US$ cents per kWh by 2025) of electricity generation, through lower LCOEs; contribute to energy security; and, assist the decarbonisation of other economic sectors. Decarbonisation of power would displace 1.1 GtCO2e/year from a business as usual scenario (IIASA’s BAU) by 2050.
While this analysis finds an increasingly supportive policy environment, there are some important actions that can facilitate faster market entry of renewables in LAC, including: stronger political will to move forward the grid -integration process in the region, with due attention to sensitive environmental and social concerns; the removal of existing fossil fuel subsidies, in particular for coal and gas which constitute an important obstacle for market entry of alternatives; the adoption of rules to allow for distributed power systems, which could accelerate deployment of household and commercial solar installations.
Mass electrification of the transport sector. On the basis of the projected gains in the efficiency and density of energy storage in vehicles; the estimated drop in electricity prices resulting from wholesale entry of renewables; and, projections for substantial reductions over time in the cost of electric vehicles, this option is forecasted to gain in competitiveness and to surpass the financial competitiveness of fossil-fuel alternatives well before 2050. The report echoes recent announcements on the potential disruptive character of electric vehicle technologies within a few years, but emphasize the customization required to meet the demand characteristics of the region. If allowances are made for the avoided costs of air pollution, the economic argument for the shift to electric drives is further strengthened. The relatively large avoided cost enables the electric versions to become competitive with the fossil fuel options by 2025. The shifting to electric drives for the sector will also result by itself in significant energy savings (about 10 EJ by 2050); the potential creation of whole industrial segments; and, important impacts in urban air quality and economic integration. Decarbonisation of transport would result in the displacement of about 1.3 GtCO2e per year from the BAU scenario by 2050.
The technology and economic momentum for a shift to electric power in transport may ultimately provoke a major transformation of transport technologies at a global scale. However, in the shorter term and in the context of Latin America, this shift faces significant barriers that need to be addressed. These include: Fossil fuel subsidies (sized at about 1% of
xii
GDP in 2013), which continue to promote their use and delay the adoption of alternative power sources in transport; the lack of internalization of health and other environmental benefits associated with the displacement of diesel and other fuels, which impede the adoption of cleaner options; and, the capital value and associated jobs and enterprises linked to refining and distribution of fossil fuels, which would be displaced by the electric vehicles.
Transforming land use from a carbon source to a carbon sink. Land use holds the key for ultimate and lasting decarbonisation of the regional economy. Avoided deforestation, reforestation, land restoration and sustainable practices in agriculture and animal husbandry, as a group, are central to securing land use based carbon sinks. Avoiding deforestation (currently at 3.4 million ha per year) has the largest potential contribution to a zero carbon future. With large-scale efforts in reforestation, restoration and measures in agriculture and animal husbandry the total could add up to about 2.9 GtCO2e abated per year. After accounting for remaining emissions, the sector could contribute net sinks of the order of 1.2 GtCO2e per year by 2050.These efforts are anticipated to also result in significant financial benefits, strengthened food security and improvements in livelihoods in rural areas.
There are major barriers to securing these sinks. Deforestation continues unimpeded in many parts of the region where the basic drivers, poverty and the inability to internalize the value of forests, have not changed. Suppliers have yet to completely ensure that supply chains are deforestation-free, while the demand for these commodities continues to increase globally.
Decarbonisation of industry. The sector in LAC is heterogeneous and difficult to generalize. Therefore, emissions by sub-sectors and their potential for reduced carbon footprints need to be analysed separately. The actual reduction potential has been calculated through a pathway analysis. The analysis is an illustration of how sub-sectors could decarbonise by 2050. The cumulative reductions, if the upper bound of cost effectiveness per tCO2e is set at US$30, would be of the order of 0.11 GtCO2e at a cost of about US$3.9 billion. Industry can also play a role in the decarbonisation of the economy through the supply of new equipment and services. This is about 7.5% of the emissions projected for the sector by 2050, under IIASA BAU.
Added value of a Zero Carbon economy. These measures have the potential to drive LAC toward a zero carbon economy, largely on the basis of: sound economics (lower levelized cost of power and transport and net benefits from restoration efforts). Decarbonising would bring value added in terms of energy security (through the control of its own inexhaustible renewable resources); food security (through land restoration) improvements in terms of trade (energy, food, feed); regional cooperation (in the context of joint enterprises to secure an integrated grid and means of transport); and, access to international financial resources (vested on low carbon investments).
A zero carbon strategy would support the deployment of new means of production and better use of natural resources. It would encourage the creation of enterprises and jobs; attract
xiii
investments; benefit from economies of scale; and support improvements in quality of life. It would not just signal a leadership role for the region in the climate arena.
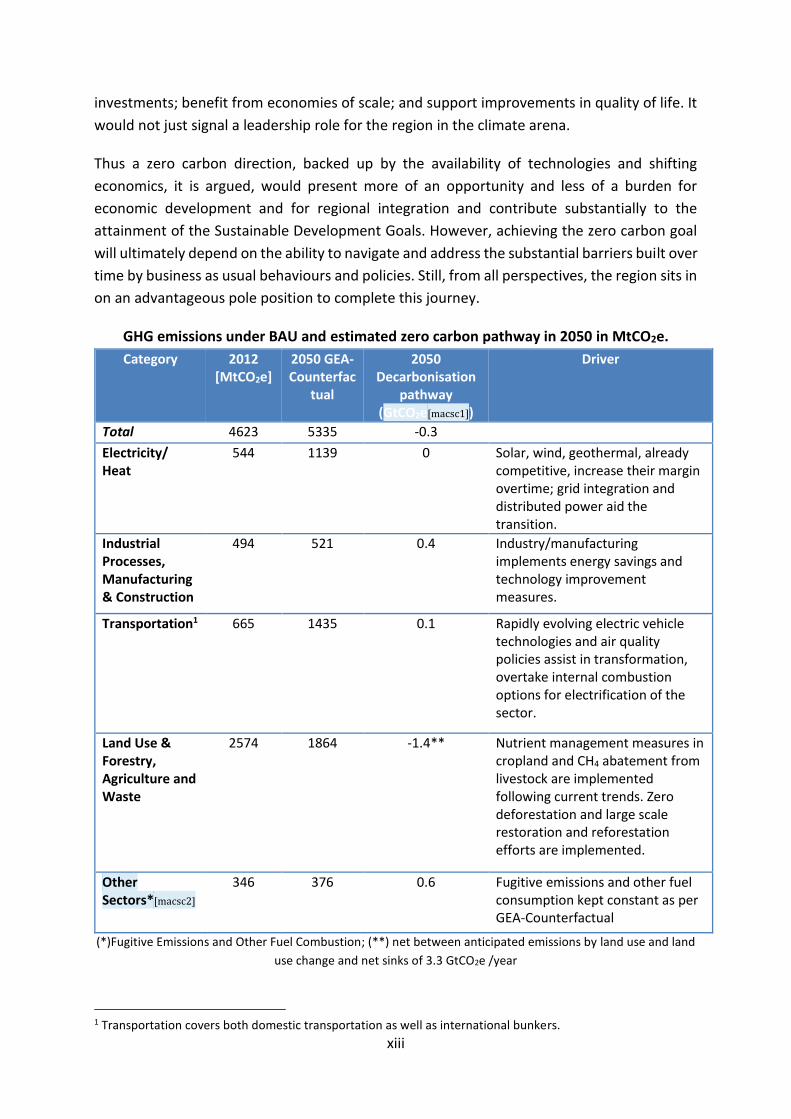
Thus a zero carbon direction, backed up by the availability of technologies and shifting economics, it is argued, would present more of an opportunity and less of a burden for economic development and for regional integration and contribute substantially to the attainment of the Sustainable Development Goals. However, achieving the zero carbon goal will ultimately depend on the ability to navigate and address the substantial barriers built over time by business as usual behaviours and policies. Still, from all perspectives, the region sits in on an advantageous pole position to complete this journey.
GHG emissions under BAU and estimated zero carbon pathway in 2050 in MtCO2e. Category 2012
[MtCO2e] 2050 GEA-Counterfac
tual
2050 Decarbonisation
pathway (GtCO2e[macsc1])
Driver
Total 4623 5335 -0.3 Electricity/ Heat
544 1139 0 Solar, wind, geothermal, already competitive, increase their margin overtime; grid integration and distributed power aid the transition.
Industrial Processes, Manufacturing & Construction
494 521 0.4 Industry/manufacturing implements energy savings and technology improvement measures.
Transportation1 665 1435 0.1 Rapidly evolving electric vehicle technologies and air quality policies assist in transformation, overtake internal combustion options for electrification of the sector.
Land Use & Forestry, Agriculture and Waste
2574 1864 -1.4** Nutrient management measures in cropland and CH4 abatement from livestock are implemented following current trends. Zero deforestation and large scale restoration and reforestation efforts are implemented.
Other Sectors*[macsc2]
346 376 0.6 Fugitive emissions and other fuel consumption kept constant as per GEA-Counterfactual
(*)Fugitive Emissions and Other Fuel Combustion; (**) net between anticipated emissions by land use and land use change and net sinks of 3.3 GtCO2e /year
1 Transportation covers both domestic transportation as well as international bunkers.

ii
Source: Emission data from 2012 from (CAIT, 2015); GEA-Counterfactual data is calculated from (IIASA, 2012; CAIT, 2015), please refer to XXX[macsc3] for more details.
|Background and rationale
1
1 Background and rationale The objective of this report is to visualize a pathway that would allow for complete decarbonisation of the Latin American and the Caribbean’s (LAC) regional economy by mid-century. This is done through the review of specific sector-wide actions, within a foreseeable technology and economics context. The analysis is being done at a time of considerable momentum to address the climate challenge, at a global level; and, after a decade of remarkable socio-economic progress at a regional level. The report also comments on key barriers to be addressed.
1.1 Background
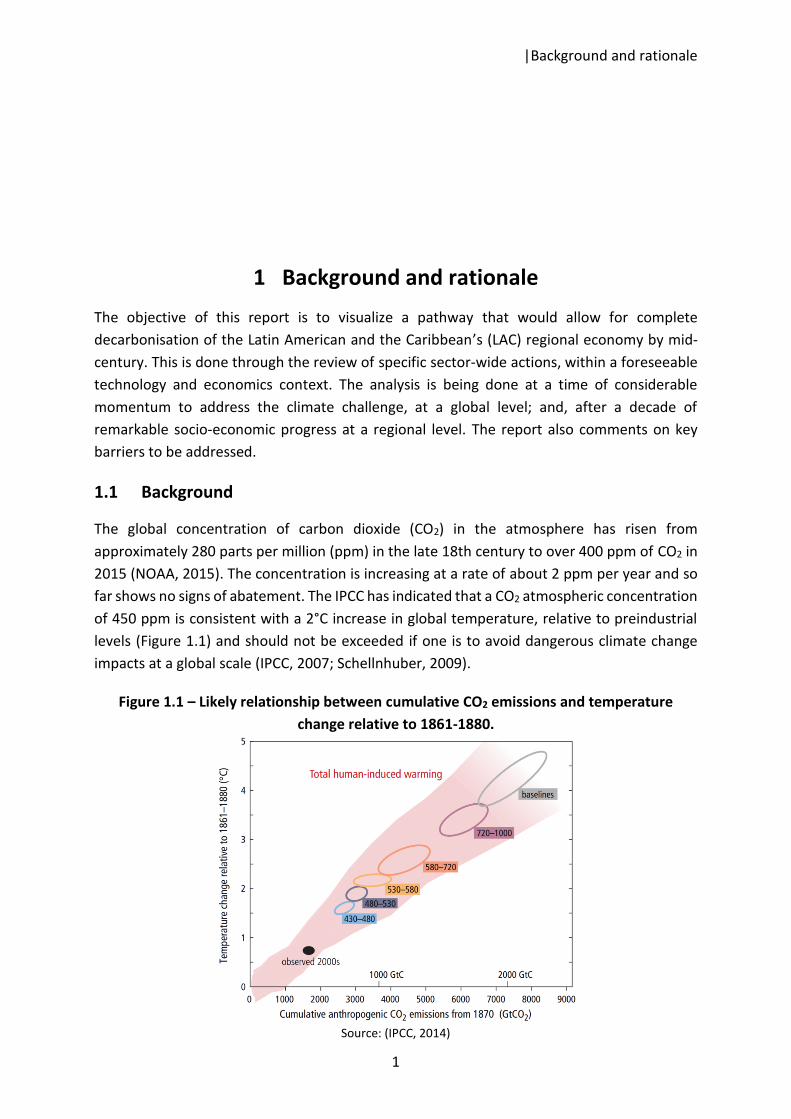
The global concentration of carbon dioxide (CO2) in the atmosphere has risen from approximately 280 parts per million (ppm) in the late 18th century to over 400 ppm of CO2 in 2015 (NOAA, 2015). The concentration is increasing at a rate of about 2 ppm per year and so far shows no signs of abatement. The IPCC has indicated that a CO2 atmospheric concentration of 450 ppm is consistent with a 2°C increase in global temperature, relative to preindustrial levels (Figure 1.1) and should not be exceeded if one is to avoid dangerous climate change impacts at a global scale (IPCC, 2007; Schellnhuber, 2009).
Figure 1.1 – Likely relationship between cumulative CO2 emissions and temperature change relative to 1861-1880.
Source: (IPCC, 2014)
2
It seems however that keeping the 2°C goal is becoming increasingly untenable. A preliminary analysis of the impacts of intentions proposed by parties to the UNFCCC convention indicates that: “current policies in the G7 and EU are projected to only stabilize emissions through to 2030 at nearly present levels, whereas a rapid decline in emissions is needed” (Ecofys, 2015).
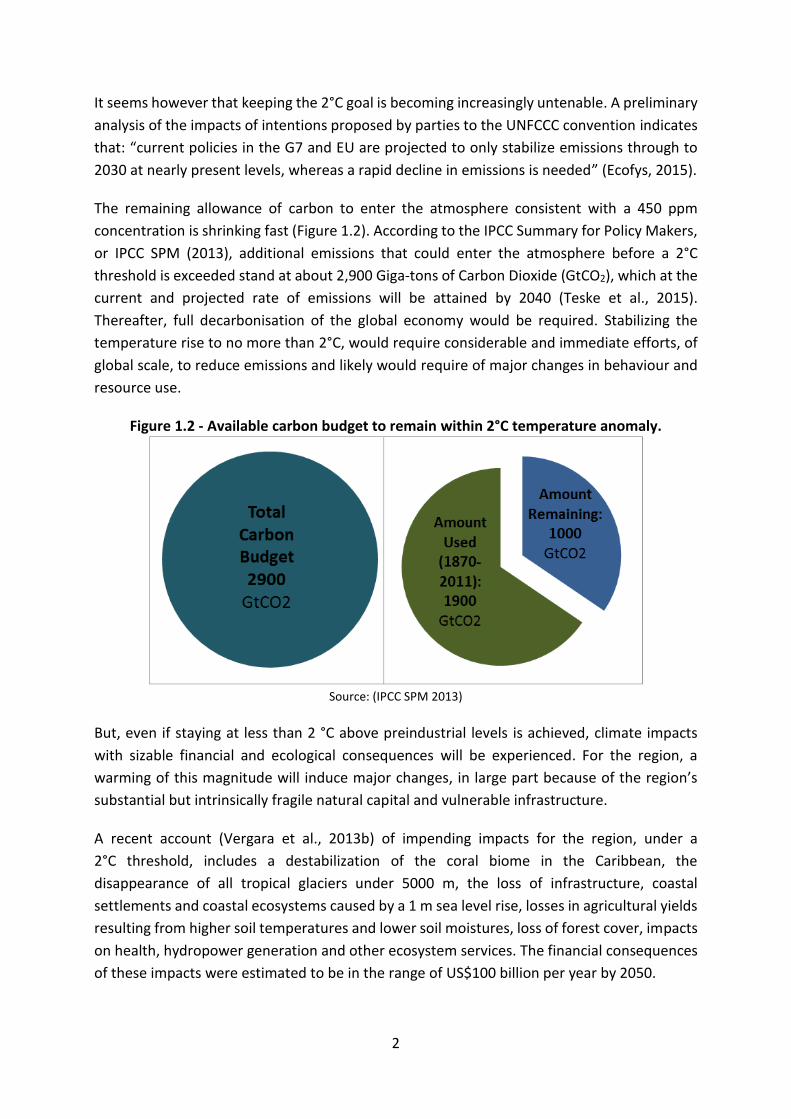
The remaining allowance of carbon to enter the atmosphere consistent with a 450 ppm concentration is shrinking fast (Figure 1.2). According to the IPCC Summary for Policy Makers, or IPCC SPM (2013), additional emissions that could enter the atmosphere before a 2°C threshold is exceeded stand at about 2,900 Giga-tons of Carbon Dioxide (GtCO2), which at the current and projected rate of emissions will be attained by 2040 (Teske et al., 2015). Thereafter, full decarbonisation of the global economy would be required. Stabilizing the temperature rise to no more than 2°C, would require considerable and immediate efforts, of global scale, to reduce emissions and likely would require of major changes in behaviour and resource use.
Figure 1.2 - Available carbon budget to remain within 2°C temperature anomaly.
Source: (IPCC SPM 2013)
But, even if staying at less than 2 °C above preindustrial levels is achieved, climate impacts with sizable financial and ecological consequences will be experienced. For the region, a warming of this magnitude will induce major changes, in large part because of the region’s substantial but intrinsically fragile natural capital and vulnerable infrastructure.
A recent account (Vergara et al., 2013b) of impending impacts for the region, under a 2°C threshold, includes a destabilization of the coral biome in the Caribbean, the disappearance of all tropical glaciers under 5000 m, the loss of infrastructure, coastal settlements and coastal ecosystems caused by a 1 m sea level rise, losses in agricultural yields resulting from higher soil temperatures and lower soil moistures, loss of forest cover, impacts on health, hydropower generation and other ecosystem services. The financial consequences of these impacts were estimated to be in the range of US$100 billion per year by 2050.

3
The analysis of a zero net decarbonisation route in LAC is also made in the context of what has been a remarkable performance of the economies of the region during the last 10 years or so. This recovery has been characterized by declining inequality in many countries in Latin America and the Caribbean (moderate poverty fell from more than 40% in 2000 to less than 30% in 20102); increased mobility within generations (at least 40% of the region’s households are estimated to have moved upward in “socioeconomic class” between 1995 and 2010); drastic reduction in population growth (from 2% per year in 1990 to about 1.1% in 2013 (World Bank, 2014a)); and a sustained increase in consumption (reflected partially in a healthy rate of GDP growth of 3% or higher during the last decade (World Bank, 2014a)).
1.2 Rationale
Given the damage - ecological, social, and economic - predicted for LAC due to climate change, and the prospects for continuing growth in socio economic indicators It is appropriate to ask, what contribution can the region make to a potential rapid, global decarbonisation and what benefits can be derived from it? Can zero carbon be targeted in LAC? Can this be done in support of the sustainable development goals of the region? This report looks at this alternative route and examines whether it can support the prospects for sustainable development.
The first consideration is that LAC is a modest GHG emitter. It accounted in 2012 for only about 10% of global emissions (4.6 GtCO2e) which translate into a per capita emission of 7.7 tCO2e (CAIT, 2015). The per capita emissions in LAC are lower than in the EU, the US, China and Japan (Figure 1.3).
Figure 1.3 - Per capita emissions in different regions and large countries.
Source: (CAIT, 2015)
2 This decline implies that 50 million Latin Americans escaped poverty over the decade (Ferreira et al., 2012)
0
5
10
15
20
25
Africa Asia China EU 28 India LAC USA World
tCO
2e P
er C
apita
Excl. Land-Use Change and Forestry Incl. Land-Use Change and Forestry
4
Power generation in LAC is already majority-driven by renewables. In 2014, over 48% of all electricity generated is based on renewable resources, mostly hydro (Enerdata, 2015). Even more relevant, the resource base of the region would be able to sustain a much higher renewables-based generation. This opens the possibility of shifting the production base toward electricity as an energy source of low-carbon content.
Second, the region is highly urbanized. And, in urban areas, most people move via public (read low carbon per passenger) transport. Therefore, the carbon signal from urban transport is much lower per capita than in industrial regions. Further, in countries with largely hydropower-driven power generation, demand for transport fuels constitutes their key fossil fuel dependence. If transport is electrified a major demand for fossil fuels would be addressed. Finally, while the motorization rate is rapidly increasing, smart, space-conscious, transport systems (like Bus Rapid Transit Systems) are being rapidly deployed and have already shown their cost effectiveness and potential.
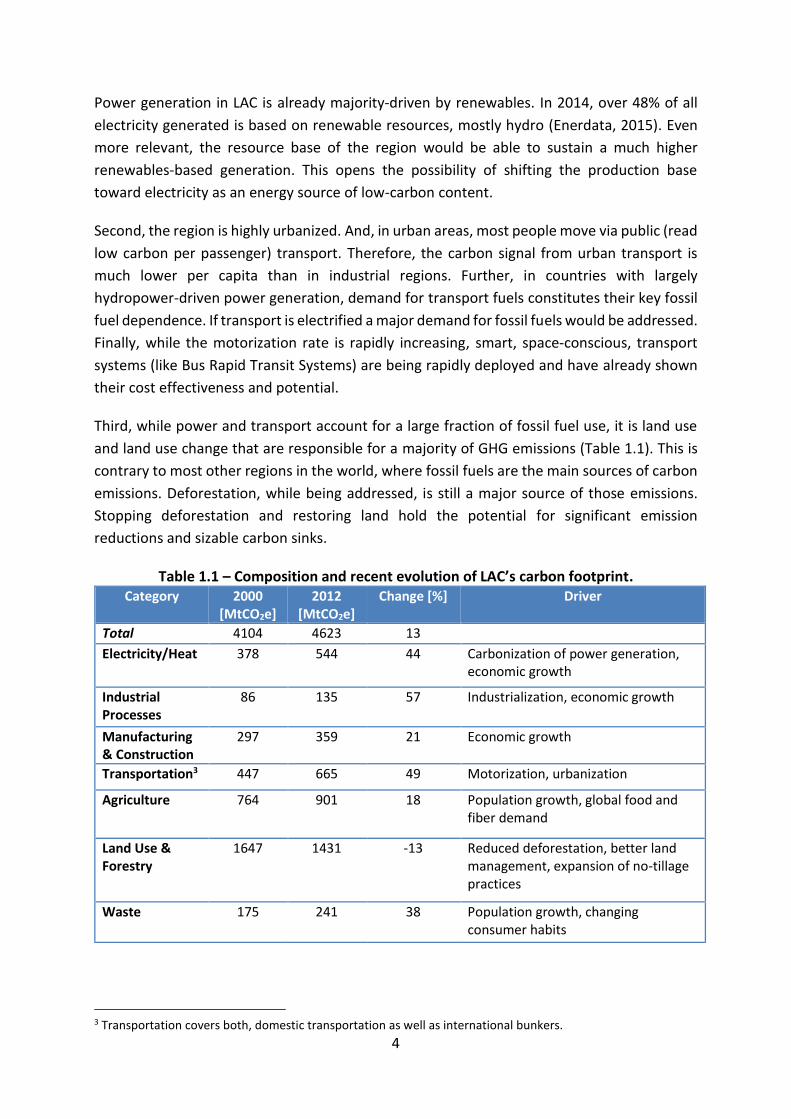
Third, while power and transport account for a large fraction of fossil fuel use, it is land use and land use change that are responsible for a majority of GHG emissions (Table 1.1). This is contrary to most other regions in the world, where fossil fuels are the main sources of carbon emissions. Deforestation, while being addressed, is still a major source of those emissions. Stopping deforestation and restoring land hold the potential for significant emission reductions and sizable carbon sinks.
Table 1.1 – Composition and recent evolution of LAC’s carbon footprint. Category 2000
[MtCO2e] 2012
[MtCO2e] Change [%] Driver
Total 4104 4623 13 Electricity/Heat 378 544 44 Carbonization of power generation,
economic growth
Industrial Processes
86 135 57 Industrialization, economic growth
Manufacturing & Construction
297 359 21 Economic growth
Transportation3 447 665 49 Motorization, urbanization
Agriculture 764 901 18 Population growth, global food and fiber demand
Land Use & Forestry
1647 1431 -13 Reduced deforestation, better land management, expansion of no-tillage practices
Waste 175 241 38 Population growth, changing consumer habits
3 Transportation covers both, domestic transportation as well as international bunkers.
5
Others4 309 346 12 Source: (CAIT, 2015) and own estimates.
Also, the required transformation has started. Courageous, sometimes blunt, political decisions have placed some nations on a path of low carbon emissions. Some are expressed as targets for renewable energy entry; goals to reduce or eliminate deforestation; ambitions for land restoration; targets for energy efficiency; and, or other expressions of political will.
The results are beginning to show. During the period 2000-2012, the carbon intensity of the region, measured in tCO2e per Million $ GDP PPP (including LULUCF) decreased by about 21.5% (CAIT, 2015). Most of the reduction can be linked to significant drops in rates of deforestation, most notably in Brazil. Improvements in energy efficiency have also contributed. This is not to say, that the decarbonisation under business as usual conditions is assured. On the contrary, many current drivers are likely to contribute to a higher carbon future as can be seen in the summary presented in Table 1.1.
More importantly, and looking into the near term, the economics of low carbon technologies are shifting, fuelled by a quick pace in technology change. This is shown in the improvements in competitiveness of renewable sources of energy; new appreciation of the advantages of a smart integrated grid and developments in distributed power; the reductions in costs of energy storage and electric vehicles; the improvements in soil restoration and assisted natural reforestation techniques, as well as innovations in agriculture and industrial processes.
Decarbonising the Latin American regional economy would bring with it value added in terms of energy security (through the control of its own inexhaustible renewable resources); food security (through land restoration) improvements in terms of trade (energy, food, feed); regional cooperation (in the context of enterprises to secure an integrated grid and means of transport); and, access to international financial resources (vested on low carbon). It would not just signal a leadership role for the region in the climate arena.
Net decarbonisation, when it takes place, will be achieved on the shoulders of economic gains for the region; and, provided it can satisfy the growing demand for cost-effective quality services and products. A zero carbon strategy should support the deployment of new means of production and better use of natural resources. It should create jobs, enterprises, attract investments, benefit from economies of scale and support improvements in quality of life. Thus a change of direction, toward zero carbon, increasingly backed up by the availability of technologies and shifting economics, it is argued, would present more of an opportunity and less of a burden for economic development and for regional integration.
Furthermore, a zero carbon path for the region would be in accord with the UN Sustainable Development Goals (UN-SDGs), not only in the context of climate change but also in the areas
4 Includes other fuel combustion and fugitive emissions. These sources (amounting to about 5% of the total) are not reviewed in this report.
6
of energy, cities, and land use, by supporting access and sustainable use of resources and products. It would be catalytic in securing improvements in quality of life by exploiting its own renewable natural resources in a manner consistent with sustainable development.
Overall, it would be much more beneficial (and less costly) to take a zero carbon approach now, making use of the increasingly favourable technical and economic conditions rather than later when the changes necessary may require more urgent action, while moving the policy framework toward the removal of barriers and securing the gains of the associated socio-economic transformational effects.
1.3 Data sources
It is in this current and emerging context that the report examines the potential for full net decarbonisation of the region through specific sector-wide activities. While the report focuses in Latin America it uses as background and context, the global and regional projections from IIASA (IIASA BAU). The following sections provide an assessment of a list of actions in key economic sectors, responsible for most of the carbon footprint of the region. An illustrative pathway is then constructed to reach zero net regional emissions by mid-century.
The analysis relies on existing, information in the specialized literature. Historical data for the analysis came from a number of sources, referenced in the report, with a particular emphasis on the database on emissions maintained by CAIT5. Energy data was obtained from ENERDATA6 and sector sources. The IIASA-GEA7 modelling results were used to establish the business as usual scenarios but using the latest snapshot from CAIT as a starting point. IIASA’s database has one of the most comprehensive and consistent data sets for Latin America. FAOSTAT8 was used for historical data and projections for the agriculture sector; UNIDO, IRENA and REN 21 data bases were also consulted.
The economic arguments for embarking on the pathway were examined using different methods depending on information available in the literature. Levelized costs, derived from GACMO9, were used to estimate the relative competitiveness for power generation and transport vis-à-vis business as usual options. Data available on financial viability were used to
5 CAIT is the Climate Data Explorer maintained by the World Resources Institute (http://cait.wri.org/) 6 ENERDATA is an independent Research & Consulting firm on the global oil, gas, coal, power, renewable and carbon markets established in 1991 (http://www.enerdata.net/). Define dataset 7 IIASA-GEA is a database that aims at documenting results and assumptions of the GEA transformation pathways (http://www.iiasa.ac.at/web-apps/ene/geadb/dsd?Action=htmlpage&page=welcome). The scenarios used included the GEA-Counterfactual (or BAU), where no intervention is considered to affect current trends and GEA-MIX (which is a mid-range combination of intervention measures in several sectors. More information on the projections and scenarios used can be consulted in Annex I. 8 FAOSTAT is the statistical database on agriculture and forestry maintained by the FAO (http://faostat3.fao.org/download/G1/GT/E). 9 GACMO was developed by Joergen Fenhann, UNEP DTU Partnership. GACMO is utilized to make an analysis of the GHG mitigation options for a country to be used in the National Communication or the INDC and is openly available at (http://www.cdmpipeline.org/).

7
document the economic argument of restoration and reforestation efforts while the net costs of measures to abate emissions was used to prioritize efforts in agriculture and industry.
|Decarbonisation of power generation
8
2 Decarbonisation of power generation This section examines the conditions under which full decarbonisation of the power sector could be realized at a regional level. If power generation is decarbonized, many economic activities that depend on power become low carbon and others that today use fossil fuels could consider a shift toward electricity as a mechanism for reducing their carbon content. A renewable energy power system would also strengthen energy security though the use of domestic, in practical terms, inexhaustible resources.
2.1 Current Situation
The 2014 electricity production in Latin America has been estimated at about 1.6 PWh which represents nearly a 60% increase since the year 2000 (Enerdata, 2015)10, and reflects a strong pattern of continuous growth. The key drivers behind the vigorous demand include an expanding population, a robust increase in GDPs across the region, and associated improvements in standards of living. These drivers are still in play and are likely to influence future market conditions.
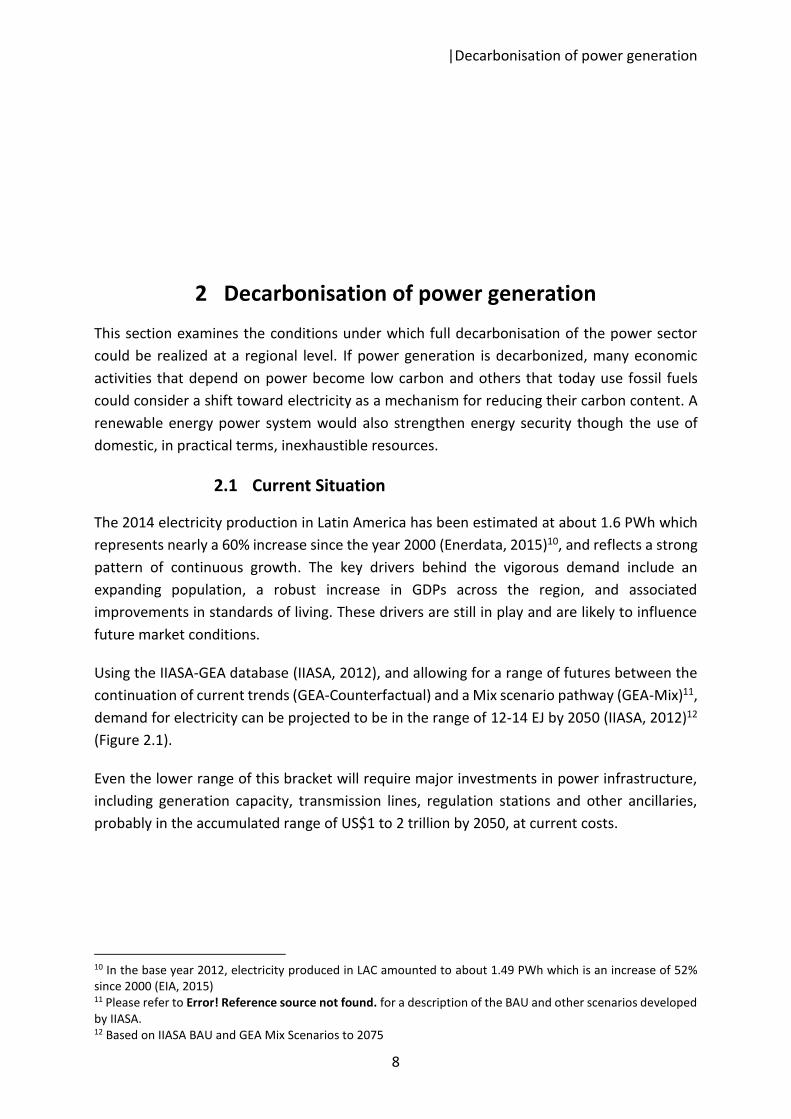
Using the IIASA-GEA database (IIASA, 2012), and allowing for a range of futures between the continuation of current trends (GEA-Counterfactual) and a Mix scenario pathway (GEA-Mix)11, demand for electricity can be projected to be in the range of 12-14 EJ by 2050 (IIASA, 2012)12 (Figure 2.1).
Even the lower range of this bracket will require major investments in power infrastructure, including generation capacity, transmission lines, regulation stations and other ancillaries, probably in the accumulated range of US$1 to 2 trillion by 2050, at current costs.
10 In the base year 2012, electricity produced in LAC amounted to about 1.49 PWh which is an increase of 52% since 2000 (EIA, 2015) 11 Please refer to Error! Reference source not found. for a description of the BAU and other scenarios developed by IIASA. 12 Based on IIASA BAU and GEA Mix Scenarios to 2075

|Decarbonisation of power generation
9
Figure 2.1 – Projected demand for electricity under IIASA´s BAU and GEA Mix Scenarios.
[macsc4] Source: (IIASA, 2012), downloaded September 2015
Demand in the region is currently (2013) being met through the operation of an installed power generation capacity estimated at 365 GW, representing 6.3% of the global capacity (Enerdata, 2015). About 47% of the total is from renewable sources, the overwhelming majority of which, 164 GW being hydropower (Annex II lists hydropower plants in the region, with at least 2 GW nominal capacity). As a consequence, the carbon signal of the regional power matrix is remarkably low, standing at about 0.21 tCO2 per MWh (Brander et al., 2011). Globally, it is by far the least carbon intensive (Table 2.1) power sector. It also has the capacity to continue to be, at least that low, on the basis of its large hydropower potential, and as discussed later in this section, its significant endowment of other than hydro renewable energy sources.
Table 2.1 – Carbon intensity of power sectors. Country Carbon intensity of power
sector (tCO2 e per MWh)
USA 0.55 China 0.97 Central/Eastern Europe 0.82 Denmark 0.37 Germany 0.67 LAC 0.21
Source: (Brander et al., 2011)
0
5
10
15
20
25
2000 2010 2020 2030 2040 2050 2060 2070
EJ/y
ear
GEA-MIX GEA-Counterfactual

|Decarbonisation of power generation
10
The strong role played by hydropower not only reduces the carbon footprint of the sector. If the grid can be integrated at a regional level, the large capacity of multi annual reservoirs could also provide for a relatively stable13 base-load capacity that could eventually be used as a power storage facility capable of dampening fluctuations between regional demand and supply.
The impact of hydro power on the carbon content of the power sector can also be appreciated in the historical emissions. While power production grew by 52% from 2000 to 2012 (Enerdata, 2015), the corresponding GHG emissions in the electricity/heat sector increased during the same period by 44% (CAIT, 2015), reflecting a significant reduction in carbon intensity. Still, the anticipated demand and projected increase rate of entry of natural gas, under BAU conditions, would contribute to substantial additional emissions in the future, estimated at about 1.1 GtCO2e by 2050 (Figure 2.2).
Figure 2.2 – Historical and projected GHG emissions from the power sector.
Source: Historic emission data from (CAIT, 2015), projections based on IIASA-GEA rates of growth of future
emissions (IIASA, 2012).
Beyond hydropower, other renewables are entering the power market in LAC. In 2014, 13.25 GW of other renewables (Table 2.2), or about half of new capacity requirements, entered into operation in the region in continuation of what seems to be a lasting trend. An important factor behind these substantial increases, 272% from 2010 to 2014, is the improved policy environment and gains in cost effectiveness of renewables, most notably wind and solar, discussed later in the chapter. Still, the capacity in operation is a small fraction (3.6%) of the total renewable energy capacity of the region (Enerdata, 2015).
13 Climate impacts, however, have the potential to destabilize hydropower generation through the anticipated intensification of rainfall patterns, which would affect the firm capacity of reservoirs. For a full discussion of these impacts, see, inter alia (Ebinger & Vergara, 2011).
-500
0
500
1000
1500
2000
2500
1990 2012 2030 2050 2070
MtC
O2e
CAIT | GEA-Counterfactual CAIT | GEA -MIX
|Decarbonisation of power generation
11
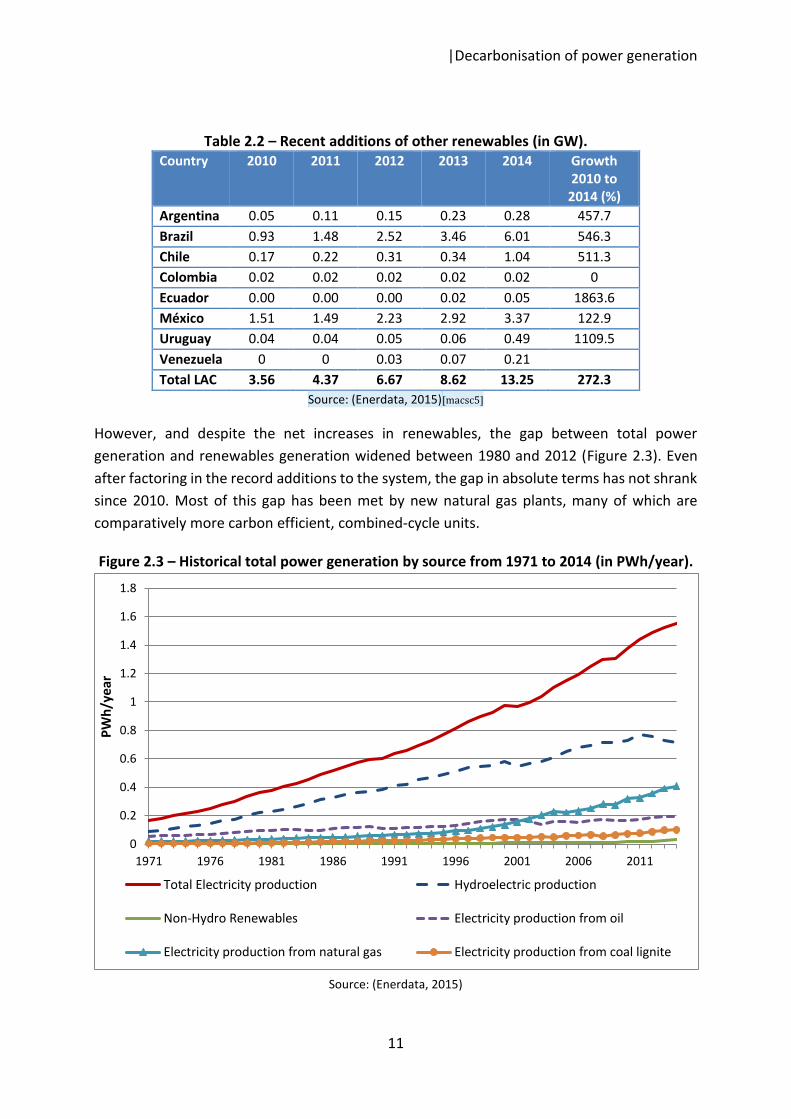
Table 2.2 – Recent additions of other renewables (in GW). Country 2010 2011 2012 2013 2014 Growth
2010 to 2014 (%)
Argentina 0.05 0.11 0.15 0.23 0.28 457.7 Brazil 0.93 1.48 2.52 3.46 6.01 546.3 Chile 0.17 0.22 0.31 0.34 1.04 511.3 Colombia 0.02 0.02 0.02 0.02 0.02 0 Ecuador 0.00 0.00 0.00 0.02 0.05 1863.6 México 1.51 1.49 2.23 2.92 3.37 122.9 Uruguay 0.04 0.04 0.05 0.06 0.49 1109.5 Venezuela 0 0 0.03 0.07 0.21 Total LAC 3.56 4.37 6.67 8.62 13.25 272.3
Source: (Enerdata, 2015)[macsc5]
However, and despite the net increases in renewables, the gap between total power generation and renewables generation widened between 1980 and 2012 (Figure 2.3). Even after factoring in the record additions to the system, the gap in absolute terms has not shrank since 2010. Most of this gap has been met by new natural gas plants, many of which are comparatively more carbon efficient, combined-cycle units.
Figure 2.3 – Historical total power generation by source from 1971 to 2014 (in PWh/year).
Source: (Enerdata, 2015)
0
0.2
0.4
0.6
0.8
1
1.2
1.4
1.6
1.8
1971 1976 1981 1986 1991 1996 2001 2006 2011
PWh/
year
Total Electricity production Hydroelectric production
Non-Hydro Renewables Electricity production from oil
Electricity production from natural gas Electricity production from coal lignite
|Decarbonisation of power generation
12
2.2 Resource Endowment
A higher rate of market entry for renewables is required in order to address future demand for power, eliminate the current gap being met by natural gas and displace future fossil fuel use. Fortunately, LAC´s renewable energy resource endowment is substantial. However, with the exception of hydropower, most of these resources have not yet been utilized in a manner consistent with their potential and relative competitiveness.
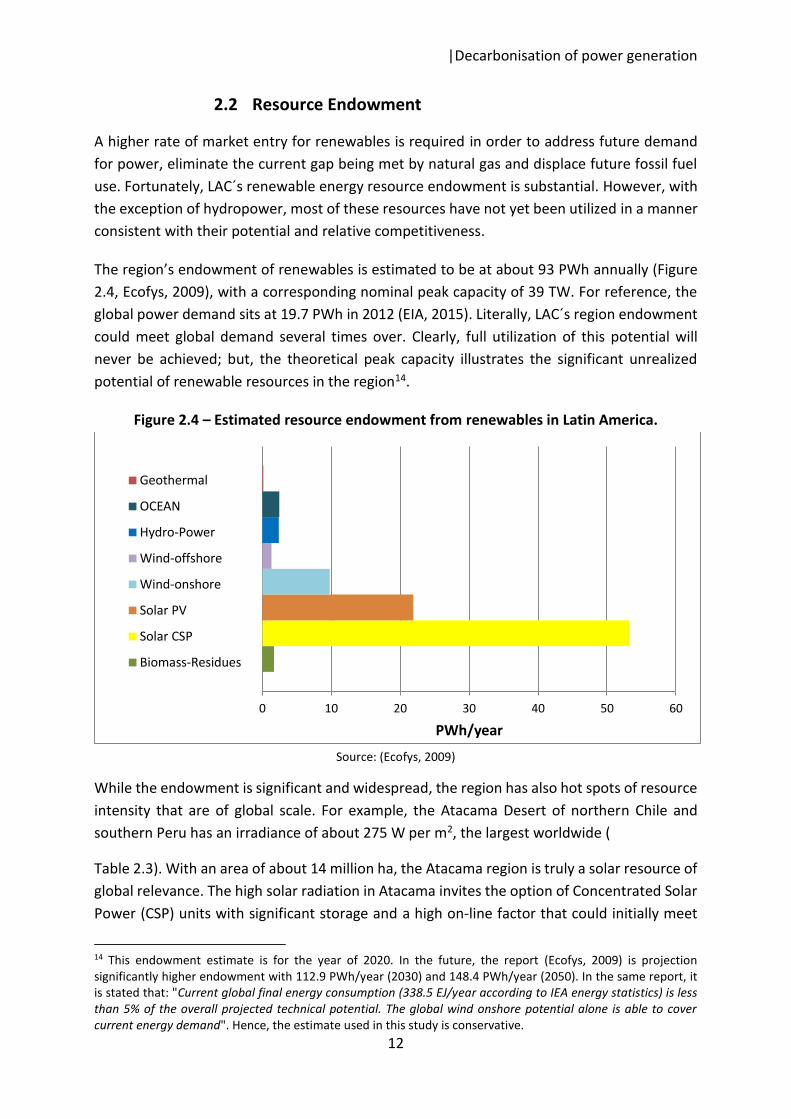
The region’s endowment of renewables is estimated to be at about 93 PWh annually (Figure 2.4, Ecofys, 2009), with a corresponding nominal peak capacity of 39 TW. For reference, the global power demand sits at 19.7 PWh in 2012 (EIA, 2015). Literally, LAC´s region endowment could meet global demand several times over. Clearly, full utilization of this potential will never be achieved; but, the theoretical peak capacity illustrates the significant unrealized potential of renewable resources in the region14.
Figure 2.4 – Estimated resource endowment from renewables in Latin America.
Source: (Ecofys, 2009)
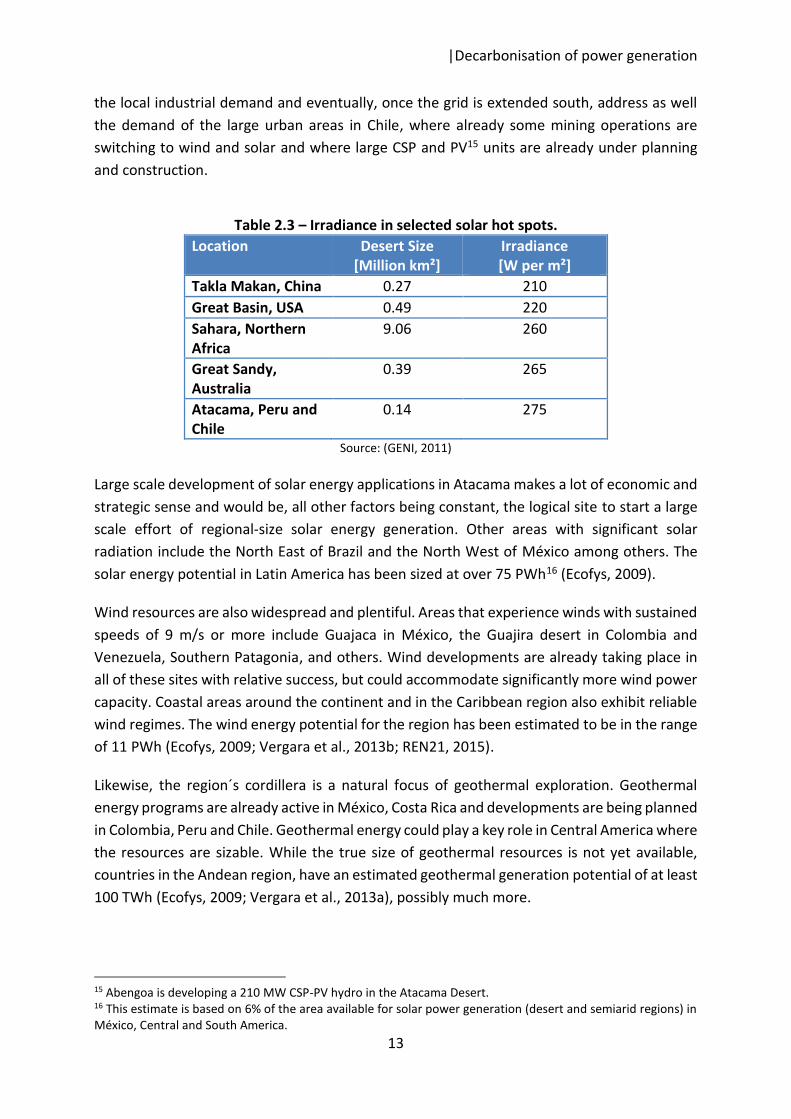
While the endowment is significant and widespread, the region has also hot spots of resource intensity that are of global scale. For example, the Atacama Desert of northern Chile and southern Peru has an irradiance of about 275 W per m2, the largest worldwide (
Table 2.3). With an area of about 14 million ha, the Atacama region is truly a solar resource of global relevance. The high solar radiation in Atacama invites the option of Concentrated Solar Power (CSP) units with significant storage and a high on-line factor that could initially meet
14 This endowment estimate is for the year of 2020. In the future, the report (Ecofys, 2009) is projection significantly higher endowment with 112.9 PWh/year (2030) and 148.4 PWh/year (2050). In the same report, it is stated that: "Current global final energy consumption (338.5 EJ/year according to IEA energy statistics) is less than 5% of the overall projected technical potential. The global wind onshore potential alone is able to cover current energy demand". Hence, the estimate used in this study is conservative.
0 10 20 30 40 50 60
PWh/year
Geothermal
OCEAN
Hydro-Power
Wind-offshore
Wind-onshore
Solar PV
Solar CSP
Biomass-Residues
|Decarbonisation of power generation
13
the local industrial demand and eventually, once the grid is extended south, address as well the demand of the large urban areas in Chile, where already some mining operations are switching to wind and solar and where large CSP and PV15 units are already under planning and construction.
Table 2.3 – Irradiance in selected solar hot spots.
Location Desert Size [Million km²]
Irradiance [W per m²]
Takla Makan, China 0.27 210 Great Basin, USA 0.49 220 Sahara, Northern Africa
9.06 260
Great Sandy, Australia
0.39 265
Atacama, Peru and Chile
0.14 275
Source: (GENI, 2011)
Large scale development of solar energy applications in Atacama makes a lot of economic and strategic sense and would be, all other factors being constant, the logical site to start a large scale effort of regional-size solar energy generation. Other areas with significant solar radiation include the North East of Brazil and the North West of México among others. The solar energy potential in Latin America has been sized at over 75 PWh16 (Ecofys, 2009).
Wind resources are also widespread and plentiful. Areas that experience winds with sustained speeds of 9 m/s or more include Guajaca in México, the Guajira desert in Colombia and Venezuela, Southern Patagonia, and others. Wind developments are already taking place in all of these sites with relative success, but could accommodate significantly more wind power capacity. Coastal areas around the continent and in the Caribbean region also exhibit reliable wind regimes. The wind energy potential for the region has been estimated to be in the range of 11 PWh (Ecofys, 2009; Vergara et al., 2013b; REN21, 2015).
Likewise, the region´s cordillera is a natural focus of geothermal exploration. Geothermal energy programs are already active in México, Costa Rica and developments are being planned in Colombia, Peru and Chile. Geothermal energy could play a key role in Central America where the resources are sizable. While the true size of geothermal resources is not yet available, countries in the Andean region, have an estimated geothermal generation potential of at least 100 TWh (Ecofys, 2009; Vergara et al., 2013a), possibly much more.
15 Abengoa is developing a 210 MW CSP-PV hydro in the Atacama Desert. 16 This estimate is based on 6% of the area available for solar power generation (desert and semiarid regions) in México, Central and South America.
|Decarbonisation of power generation
14
Marine energy is also a significant resource that is only now being examined for its potential use. Both wave and tidal power resources are significant in the South Pacific. While the technology has yet to be developed to a full commercial level, the horizon for deployment keeps shrinking as illustrated by the large financial commitments in South Korea and France among others. The potential in Chile has been sized to be of the order of 1 PWh (GOV.UK, 2012), comparable to other large endowment areas elsewhere.
Despite these favourable resource conditions, under Business as Usual scenarios, there is the expectation that the power sector will gradually carbonize. The projections, under the IIASA´s BAU scenario, anticipate the coal share in power generation to gradually disappear; but, in contrast natural gas is seen as increasing its participation. The net effect is an increase in the share of fossil fuels for power generation of about 11% by 2050 (IIASA, 2012). The reasons for this projection, it is argued, include the relative ease of supply and the perceived competitiveness of natural gas on financial terms. Combined cycle natural gas based power generation is indeed quite competitive under current conditions. Geopolitical reasons are also weighted in.
However, recent developments have shown an improved financial edge for renewables in the region and could be the basis to question those assumptions. For example, recent bids for power supply in the Brazilian market have overwhelmingly gone for wind (REN21, 2015) and market conditions in Uruguay, México, Brazil and Nicaragua, among others, are seen as favouring wind over gas. Evidence indicates that wind and solar can compete and outperform gas under levelled–play conditions17; that is, in situations where renewables are not penalized or fossil fuels are not subsidized.
Is it possible to visualize a scenario, where both economics, policy and energy security considerations are able to meet climate change concerns through the deployment at scale of renewable energy sources? Is it the case that the foundations for this alternative future are already coming into play in the region?
This chapter challenges the projected carbonization of the sector under business as usual conditions, bringing into the foreground recent developments in the region. These developments include: a) recent and significant changes in market share of renewables; b) evolution of the policy frameworks; c) political will manifested primarily in the establishment of renewable energy goals; d) the prospect of grid integration with the advantages it would bring to large scale deployment of renewables; and, e) the pace of change in technologies with the resulting improvements in financial competitiveness.
17 Depending on the calculation method used, REN21 (2015) estimates for the global cost of fossil fuel subsidies range from US$544 billion to US$1.9 trillion—several times higher than those for renewable energy.
|Decarbonisation of power generation
15
2.3 Market size for renewables is increasing
Globally, investments in renewable energy resources over the last decade have been substantial. From 2004 to 2014, global annual investments in renewables grew by 500% from US$45 billion to US$270 billion (FS-UNEP BNEF, 2015). In Latin America, while still representing a small fraction of the total, the capacity in renewables other than hydro and biomass (the traditional renewables,) has also been rapidly growing (Table 2.2). Markets for wind and solar PV are already established in the region and the role of CSP is becoming clearer with two large scale units under construction.
Argentina, Brazil, Chile, and Peru have awarded contracts for over 13 GW of capacity through competitive bids since 2007, and Uruguay has used competitive bidding to go from 40 MW in 2012 to its target of 1 GW of wind capacity by 2015. Also, in Central America, El Salvador, Guatemala, Honduras, and Panama have all issued bids for renewable energy in 2014 (REN21, 2015). Brazil, has held tenders for wind power for several years, and for solar power since 2014. Chile held its first CSP tender in 2013 with strong government support; and Uruguay launched multiple solar power tenders throughout the year (REN21, 2015). In fact, LAC continues to be a “global leader in renewable energy tenders”.
In Latin America, from 2000 to 2014, energy produced from non-hydro renewables increased by 335% to 35 TWh (Enerdata, 2015). Can this trend continue? The answer to this question depends on the continuing evolution in regulatory frameworks, policy commitments and economics. The current standing of each is briefly reviewed below.
2.4 Evolution of regulatory frameworks
A full discussion of evolving regulatory frameworks in the region is beyond the scope of this document. As a proxy, a quick summary of major developments are presented.
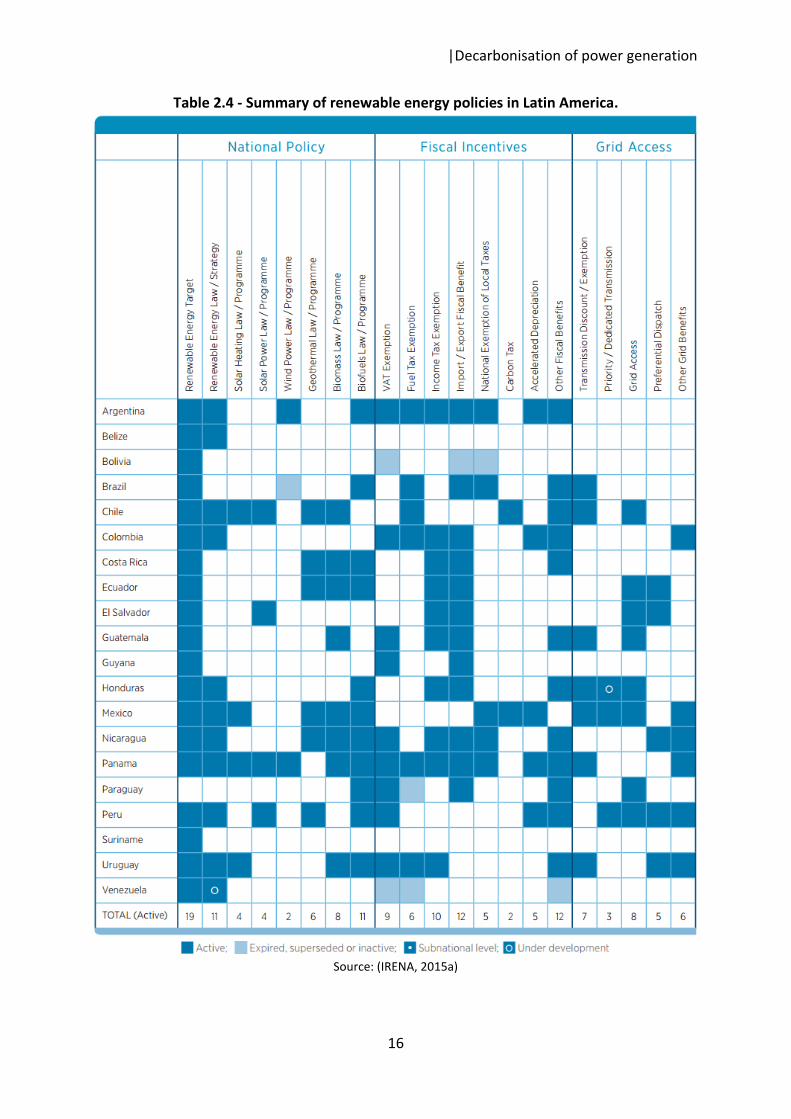
There has been remarkable progress in the evolution of the regulatory framework in support of renewable energy sources in the region. Table 2.4 below summarizes the current state of play as summarized by REN21 (2015). According to the aforementioned analysis, most of the power market in the region now has renewable energy targets, supportive policies and to an extent financing systems in support of renewable sources of energy.
In terms of supporting market entry, policies and regulations have been established in the region. For example, feed-in tariffs (FITs) and renewable portfolio standards (RPS) have driven the market to procure renewable electricity by setting the price or the amount of energy. Auctions have also been used in which a specific capacity or energy is competitively procured. FIT rates are set administratively while auctions have typically set rates through periodic competition (Vergara et al., 2013a).
|Decarbonisation of power generation
16
Table 2.4 - Summary of renewable energy policies in Latin America.
Source: (IRENA, 2015a)
|Decarbonisation of power generation
17
In some cases, onsite or offsite self-supply regulations that enable and encourage consumers to generate their own electricity from renewables have been established. In the Caribbean, countries such as Barbados, Grenada, Jamaica, and St. Lucia have introduced different versions of net metering and net billing policies that allow onsite generation to be credited against customer electricity bills at (or below) the retail electricity rate.
Other tools are being used that strengthen the enabling environment for renewable energy (e.g. streamlined permitting, property tax exemptions, import tax exemptions), provide market support (outreach, education, capacity building, and institutional strengthening), and enhance the contribution of NRTs to local development. While these policies have played an important role in promoting the market in the region, there is mounting evidence that the shifting in relative competitiveness (as discussed later in this chapter), is having a much more lasting effect.
2.5 Renewable energy targets
There is considerable movement in the set-up of targets for renewables, including in: a) some of the economies with the largest carbon footprints in the Latin America (Chile and México); b) some of the countries with the most ambitious and successful renewable energy programs (Costa Rica, Nicaragua, Uruguay); other countries with a significant share of renewables in their current power matrix (Brazil, Colombia, Peru).
México and Chile, with some of the most carbon intensive power systems in the region, have among others, established clear renewable energy goals. In México, its Climate Change Plan (Vision 10, 20, 40) (NCCS, 2013) has established a 50% renewables goal in power generation by around 2050. Chile has indicated in its energy plan an intention to be 20% renewables in power generation by 2025 (Reference). Given the current make up of their power matrix, the goals amount to very substantial changes in fossil fuel use.
Brazil while already a global leader on renewable energy for power generation, has recently established an additional and substantial goal that would increase the share of renewables from resources other than hydro to the level of 20% by 2030. Brazil’s intentions were announced on the run up to COP 21, and would translate when achieved into an equivalent 24 GW of non-traditional renewables by 2030. Brazil’s intentions, given their magnitude also have the potential to contribute to the development of supply chains in the region.
Uruguay, Nicaragua, Ecuador and Costa Rica are also notable examples of countries establishing ambitious, in some way exemplary, goals and carrying out early actions to get there. For example, Uruguay has indicated the intention to go carbon free in its power sector by 2020 and it already has a share of wind energy in its power matrix that surpasses Denmark! In 2015, Costa Rica managed to operate its power system with no fossil fuels for an extended period and has professed to transform its entire economy so that it is carbon neutral by 2020. Nicaragua, facing many development needs still managed to move rapidly to shift their power
|Decarbonisation of power generation
18
matrix toward renewables. These smaller countries are in effect providing a practical example of how to move along a low carbon pathway in power generation. (References)
Paraguay is indicative of the potential nature of power generation in the region. The country is already 100% renewable in its power sector thanks to the large hydro endowment and multinational projects (Yacireta and Itaipu). One of its largest exports is hydropower. Because of this character, Paraguay should be a good testing ground for using the power sector to influence energy consumption in other sectors of the economy.
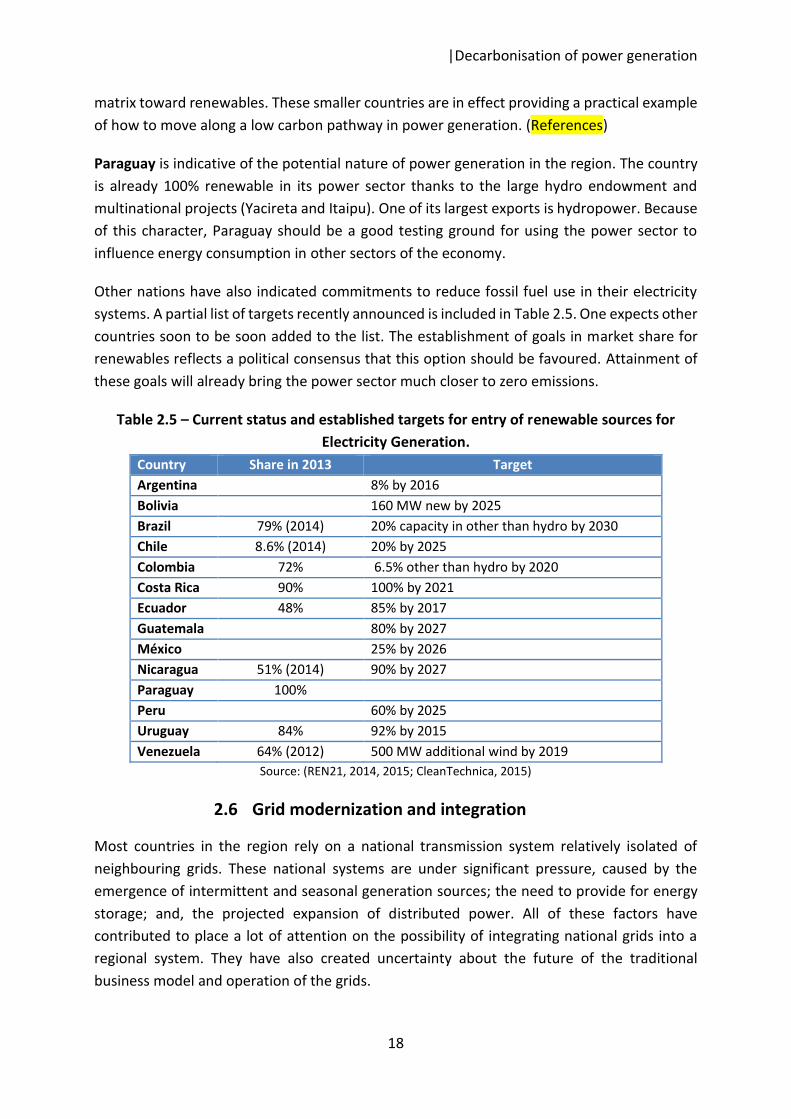
Other nations have also indicated commitments to reduce fossil fuel use in their electricity systems. A partial list of targets recently announced is included in Table 2.5. One expects other countries soon to be soon added to the list. The establishment of goals in market share for renewables reflects a political consensus that this option should be favoured. Attainment of these goals will already bring the power sector much closer to zero emissions.
Table 2.5 – Current status and established targets for entry of renewable sources for Electricity Generation.
Country Share in 2013 Target Argentina 8% by 2016 Bolivia 160 MW new by 2025 Brazil 79% (2014) 20% capacity in other than hydro by 2030 Chile 8.6% (2014) 20% by 2025 Colombia 72% 6.5% other than hydro by 2020 Costa Rica 90% 100% by 2021 Ecuador 48% 85% by 2017 Guatemala 80% by 2027 México 25% by 2026 Nicaragua 51% (2014) 90% by 2027 Paraguay 100% Peru 60% by 2025 Uruguay 84% 92% by 2015 Venezuela 64% (2012) 500 MW additional wind by 2019
Source: (REN21, 2014, 2015; CleanTechnica, 2015)
2.6 Grid modernization and integration
Most countries in the region rely on a national transmission system relatively isolated of neighbouring grids. These national systems are under significant pressure, caused by the emergence of intermittent and seasonal generation sources; the need to provide for energy storage; and, the projected expansion of distributed power. All of these factors have contributed to place a lot of attention on the possibility of integrating national grids into a regional system. They have also created uncertainty about the future of the traditional business model and operation of the grids.

|Decarbonisation of power generation
19
Regional integration would permit variable generation to be balanced across international borders. Generally, regional power pools can improve system reliability and unlock investments by creating opportunities to capture greater economies of scale; complement greater geographic and resource diversity; allow operating reserves to be shared and coordinated; and, support higher penetration of variable renewable generation, providing additional incentives to harness resource-rich areas such as the Patagonia (tidal and wave resource), the Guajira and Guajaca wind fields or the Atacama and Sonora deserts (solar radiation).
Also, from the perspective of renewable energy resources, an integrated, smart grid would offer a number of advantages: a) it would enable the dispatch of intermittent sources with more flexibility increasing its actual firm capacity; b) it could increase system reliability and also conceivable use the accumulated hydropower capacity as a large storage reservoir able to dampen variations in the deliveries from solar, marine and wind facilities; c) It could also force gains in efficiency and cost effectiveness, in the context of a regional market.
2.6.1 Dispatch of intermittent sources
An integrated grid that encompasses the South American nations, would enable the dispatch of solar energy, say from Peru and Chile’ s Atacama region to meet demand in eastern regions of the continent after sunset; and vice-versa, from Brazil’s northeast to the west before their sunrise, effectively increasing the firm capacity of these resources. Excess wind energy outputs from the Northern coast of Colombia and Venezuela would be able to meet demand beyond this region. Once developed, the substantial marine energy in the Pacific would be available beyond the borders of Chile.
These developments of course will depend not just on the availability of a physical grid, but also on the compatibility of energy policy frameworks, as well as the containment of losses during transmissions and the overall cost effectiveness of the system.
2.6.2 Increased system reliability
An integrated grid, even at a sub-regional level, will have a better capability to handle variations in generation, not only due to increased share of intermittent sources or variations caused by weather and climate, but also through better use of information and communication technologies embedded in grid systems to improve flexibility and safety. Shared information and communication technologies could help prevent power outages and enable increased transparency during operation. Also, intermittent contributions can be better absorbed in a larger system.
A useful example of the costs and benefits of an integrated supranational grid is provided by the recent experience in Denmark. Denmark is now interconnected with other Scandinavian countries and Northern Europe and indirectly to the rest of the EU. According to a recent analysis (Franck, 2015) the simple interface with neighbouring countries has allowed the
|Decarbonisation of power generation
20
Danish system to instantly communicate the need for power or its availability and for producers and consumers to act. The regional power market automatically dispatches different resources across a wide area and utilizes available flexibility. “It is never stormy, calm or overcast over the entire interconnected area”, ensuring that different resources are always available. In this system the dispatch or sources with very low operating cost have a market advantage.
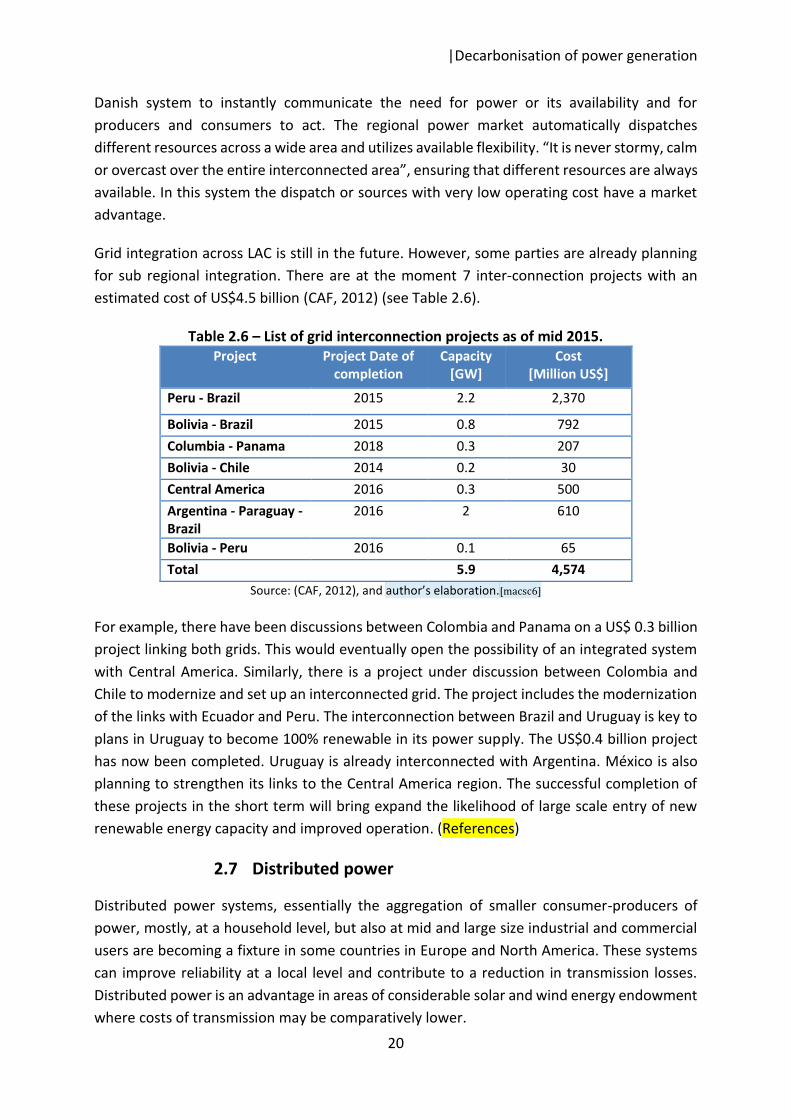
Grid integration across LAC is still in the future. However, some parties are already planning for sub regional integration. There are at the moment 7 inter-connection projects with an estimated cost of US$4.5 billion (CAF, 2012) (see Table 2.6).
Table 2.6 – List of grid interconnection projects as of mid 2015. Project Project Date of
completion Capacity
[GW] Cost
[Million US$]
Peru - Brazil 2015 2.2 2,370
Bolivia - Brazil 2015 0.8 792 Columbia - Panama 2018 0.3 207 Bolivia - Chile 2014 0.2 30 Central America 2016 0.3 500 Argentina - Paraguay - Brazil
2016 2 610
Bolivia - Peru 2016 0.1 65 Total 5.9 4,574
Source: (CAF, 2012), and author’s elaboration.[macsc6]
For example, there have been discussions between Colombia and Panama on a US$ 0.3 billion project linking both grids. This would eventually open the possibility of an integrated system with Central America. Similarly, there is a project under discussion between Colombia and Chile to modernize and set up an interconnected grid. The project includes the modernization of the links with Ecuador and Peru. The interconnection between Brazil and Uruguay is key to plans in Uruguay to become 100% renewable in its power supply. The US$0.4 billion project has now been completed. Uruguay is already interconnected with Argentina. México is also planning to strengthen its links to the Central America region. The successful completion of these projects in the short term will bring expand the likelihood of large scale entry of new renewable energy capacity and improved operation. (References)
2.7 Distributed power
Distributed power systems, essentially the aggregation of smaller consumer-producers of power, mostly, at a household level, but also at mid and large size industrial and commercial users are becoming a fixture in some countries in Europe and North America. These systems can improve reliability at a local level and contribute to a reduction in transmission losses. Distributed power is an advantage in areas of considerable solar and wind energy endowment where costs of transmission may be comparatively lower.
|Decarbonisation of power generation
21
Brazil and México have started net metering schemes to enable the development of residential, industrial and commercial distributed PV installations. This is similar to systems already operating in Germany and in some states in the US. Specifically, in both countries, there is no extra cost or special fee for installing distributed systems; the surplus power is allowed into the grid to offset any electricity drawn from it. However, net surpluses are not paid but a net balance can be kept for a period of time (one year in México and 3 years in Brazil).
Net metering does not involve any investment on the part of utilities or additional transmission infrastructure by the government. On the contrary, the emergence of distributed systems contributing to power generation should reduce the pressure for new centralized units, once it reaches a sufficient scale. For example México has now about 5 MW of distributed power and there seems to be significant potential for rapid expansion.
A combination of a centralized grid that brings economies of scale from large central installations with the local advantages of distributed systems, everything integrated by advanced communications, would result in a hybrid system. This hybridization would take advantage of advances in grid technology and has the potential to reduce overall costs of grid integration and transmission through the optimization at a local level of demand and supply balances. The success of the systems already in place in México and Brazil are likely to be replicated in the near term18.
2.8 Hydropower as a regional storage capacity
Latin America’s power sector is driven by hydro-power. There are at least 38 multi annual reservoirs in the region with a nominal capacity of 1 GW or more, totalling 164 GW in 2013 (Enerdata, 2015). The stored potential energy at any given point of time is enormous. Also, the largest reservoirs are located thought the Americas, which in effect means that they operate under different hydrologies, weather patterns and variations.
Grid integration brings about the possible use of these reservoirs as energy storage facilities, available to accumulate seasonal resources and address the potential impacts of severe weather events, such as prolonged droughts and intense rainfalls, in the regional power system. It is possible to visualize times, for example under ENSO conditions, of low precipitation in the southern Pacific countries, as opportunities for solar or wind systems to accumulate excess production using the reservoirs in the affected countries or to meet instant demands. As a result, an integrated regional power system, or at least sub regions sharing grid systems would benefit of an increase in the overall firm capacity in generation.
Reservoirs also have the potential, still largely untapped, to complement intermittent sources of energy such as wind and solar. For example, in northern South America (Colombia,
18 Dominican Republic and Peru have recently started distributed power projects (Renewable energy world, 2013)
|Decarbonisation of power generation
22
Venezuela, wind regimes are complementary with rainfall patterns. Bundling wind and hydro power in the region may increase the firm capacity of both (Vergara et al., 2010).
On the other hand, hydropower generation depends directly on the availability of water resources, and therefore on the variations in the hydrological cycle. Reliable supply would be affected by more frequent, prolonged, and/or severe drought resulting from climate change and the resulting precariousness of depending so heavily on hydro-power.
Such changes in hydrology will directly affect the output of existing and future hydro-electric facilities. A reduction in hydropower potential is also anticipated in areas where river flows are expected to decline, such as in the Rio Lempa basin and the Simú-Caribbean basin of Central America (Maurer et al., 2008; Noreña et al., 2009). An analysis made of annual stream flows in some rivers in South America under scenario A1B (Nakaegawa & Vergara, 2010; Vergara & Scholz, 2011) found reductions in the stability of stream flows and consequent impacts on firm capacities of dependent hydropower facilities. A full treatment of these impacts can be consulted in Ebinger & Vergara (2011).
2.9 The economics of renewable energy generation
Wind, Solar both PV and CSP, and Geothermal have all experienced significant technological improvements resulting in better economies of scale, higher efficiencies and better operational factors. Marine energy technologies while not yet fully developed have also been the subject of considerable investments in technology.
As a result, the economics of renewables are rapidly shifting, with costs of generation becoming much more competitive19. For example, for utility-size crystalline systems, with tracking, installed costs in the US market went from US$8 per installed peak W[macsc7] in 2007-2009 to US$3 in 2013 and is now projected to drop to US$1.5 by 2025 and possibly reach less than US$1 by 2050 (Feldman et al., 2014). Recent tenders in Latin America confirm the reduction in contract prices, for solar PV. For example, average bid price of less than US$0.1 per kWh has been used to award about 1 GW of capacity in Brazil and about 0.2 GW in Panama.
CSP systems are currently more expensive than PVs, on an installed watt basis. But, when consideration is given to its ability to store power, their cost competitiveness improves. Current installed cost, based on a limited number of examples is US$4.6 per W without storage and between US$9 to US$10.5 with 15 hours of storage (IRENA, 2012). While the experience with this technology is limited (just two plants are under construction in LAC in México and Chile), one could expect gains in capital and operations costs, similar to those of other more mature technologies in the future.
19 See for example IRENA (2014)
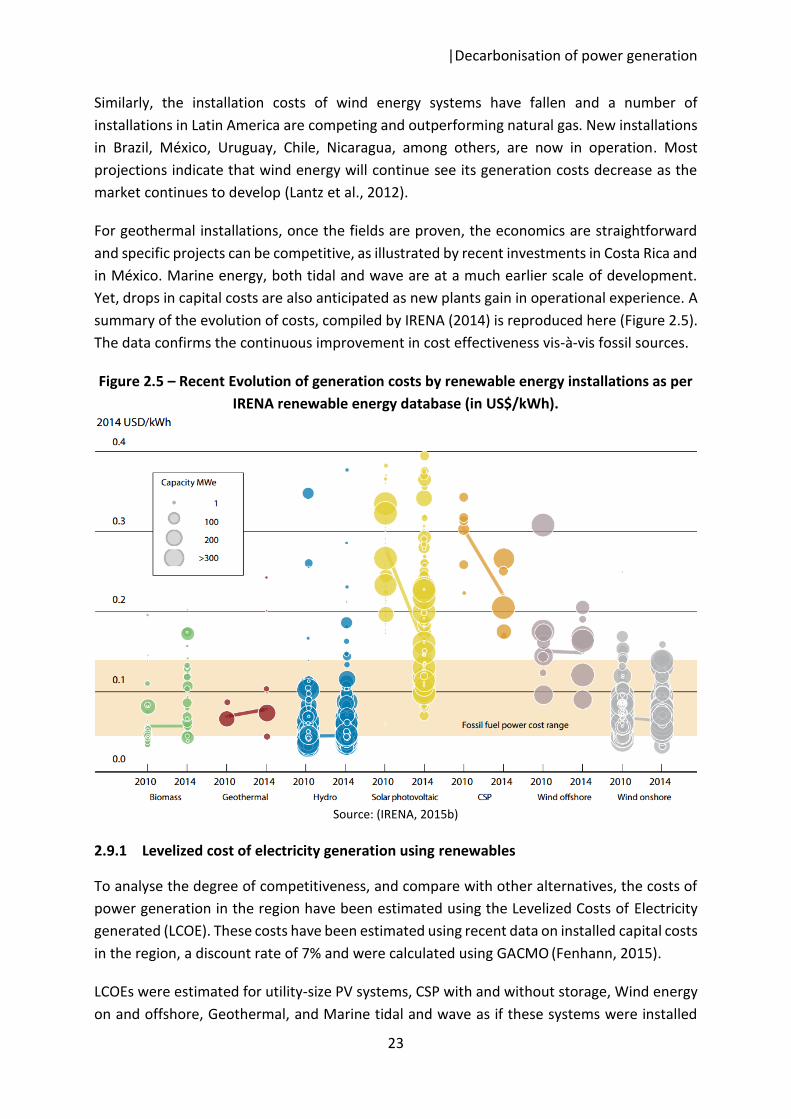
|Decarbonisation of power generation
23
Similarly, the installation costs of wind energy systems have fallen and a number of installations in Latin America are competing and outperforming natural gas. New installations in Brazil, México, Uruguay, Chile, Nicaragua, among others, are now in operation. Most projections indicate that wind energy will continue see its generation costs decrease as the market continues to develop (Lantz et al., 2012).
For geothermal installations, once the fields are proven, the economics are straightforward and specific projects can be competitive, as illustrated by recent investments in Costa Rica and in México. Marine energy, both tidal and wave are at a much earlier scale of development. Yet, drops in capital costs are also anticipated as new plants gain in operational experience. A summary of the evolution of costs, compiled by IRENA (2014) is reproduced here (Figure 2.5). The data confirms the continuous improvement in cost effectiveness vis-à-vis fossil sources.
Figure 2.5 – Recent Evolution of generation costs by renewable energy installations as per IRENA renewable energy database (in US$/kWh).
Source: (IRENA, 2015b)
2.9.1 Levelized cost of electricity generation using renewables
To analyse the degree of competitiveness, and compare with other alternatives, the costs of power generation in the region have been estimated using the Levelized Costs of Electricity generated (LCOE). These costs have been estimated using recent data on installed capital costs in the region, a discount rate of 7% and were calculated using GACMO (Fenhann, 2015).
LCOEs were estimated for utility-size PV systems, CSP with and without storage, Wind energy on and offshore, Geothermal, and Marine tidal and wave as if these systems were installed
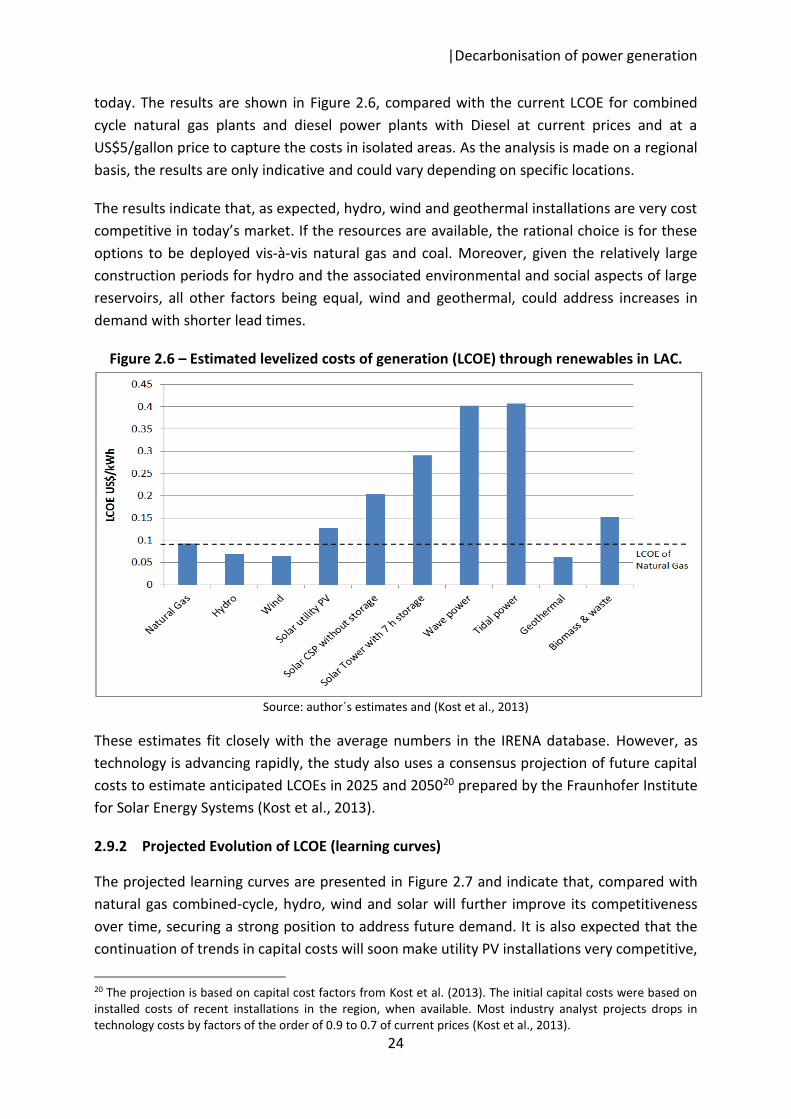
|Decarbonisation of power generation
24
today. The results are shown in Figure 2.6, compared with the current LCOE for combined cycle natural gas plants and diesel power plants with Diesel at current prices and at a US$5/gallon price to capture the costs in isolated areas. As the analysis is made on a regional basis, the results are only indicative and could vary depending on specific locations.
The results indicate that, as expected, hydro, wind and geothermal installations are very cost competitive in today’s market. If the resources are available, the rational choice is for these options to be deployed vis-à-vis natural gas and coal. Moreover, given the relatively large construction periods for hydro and the associated environmental and social aspects of large reservoirs, all other factors being equal, wind and geothermal, could address increases in demand with shorter lead times.
Figure 2.6 – Estimated levelized costs of generation (LCOE) through renewables in LAC.
Source: author´s estimates and (Kost et al., 2013)
These estimates fit closely with the average numbers in the IRENA database. However, as technology is advancing rapidly, the study also uses a consensus projection of future capital costs to estimate anticipated LCOEs in 2025 and 205020 prepared by the Fraunhofer Institute for Solar Energy Systems (Kost et al., 2013).
2.9.2 Projected Evolution of LCOE (learning curves)
The projected learning curves are presented in Figure 2.7 and indicate that, compared with natural gas combined-cycle, hydro, wind and solar will further improve its competitiveness over time, securing a strong position to address future demand. It is also expected that the continuation of trends in capital costs will soon make utility PV installations very competitive,
20 The projection is based on capital cost factors from Kost et al. (2013). The initial capital costs were based on installed costs of recent installations in the region, when available. Most industry analyst projects drops in technology costs by factors of the order of 0.9 to 0.7 of current prices (Kost et al., 2013).
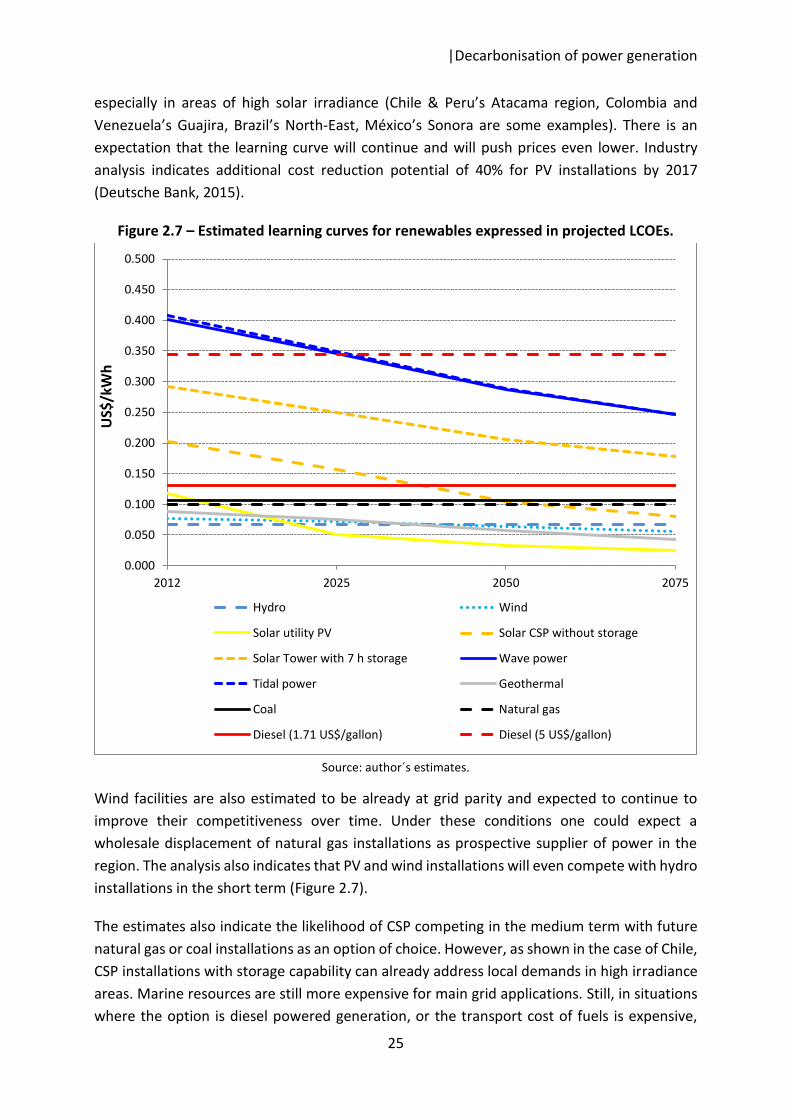
|Decarbonisation of power generation
25
especially in areas of high solar irradiance (Chile & Peru’s Atacama region, Colombia and Venezuela’s Guajira, Brazil’s North-East, México’s Sonora are some examples). There is an expectation that the learning curve will continue and will push prices even lower. Industry analysis indicates additional cost reduction potential of 40% for PV installations by 2017 (Deutsche Bank, 2015).
Figure 2.7 – Estimated learning curves for renewables expressed in projected LCOEs.
Source: author´s estimates.
Wind facilities are also estimated to be already at grid parity and expected to continue to improve their competitiveness over time. Under these conditions one could expect a wholesale displacement of natural gas installations as prospective supplier of power in the region. The analysis also indicates that PV and wind installations will even compete with hydro installations in the short term (Figure 2.7).
The estimates also indicate the likelihood of CSP competing in the medium term with future natural gas or coal installations as an option of choice. However, as shown in the case of Chile, CSP installations with storage capability can already address local demands in high irradiance areas. Marine resources are still more expensive for main grid applications. Still, in situations where the option is diesel powered generation, or the transport cost of fuels is expensive,
0.000
0.050
0.100
0.150
0.200
0.250
0.300
0.350
0.400
0.450
0.500
2012 2025 2050 2075
US$
/kW
h
Hydro Wind
Solar utility PV Solar CSP without storage
Solar Tower with 7 h storage Wave power
Tidal power Geothermal
Coal Natural gas
Diesel (1.71 US$/gallon) Diesel (5 US$/gallon)
|Decarbonisation of power generation
26
there are already conditions under which marine could be an option of choice in isolated coastal communities.
On the basis of these estimates, there is the expectation that the improved outlook for supportive policies, the prospects of grid modernization and integration, but above all, the shifting financial advantage of wind and solar right now and of other technologies in the future provide a sufficient basis on which a scenario of full decarbonisation of the power sector can be built. This scenario, presented later in the report, is predicated on the assumption that market conditions already enable new demand to be met through renewables and that renewables, in the form of an increasing array of technologies will be able to displace existing fossil fuel capacity and dominate the market for new installations.
While, this analysis finds a generally supportive policy environment, there are some important barriers whose removal can facilitate faster market entry of renewables in Latin America. These include: Political will to advance in the grid –integration process in the region. The costs and technical issues of grid integration are not judged to be a major obstacle; technologies and options are also available to reduce environmental and social concerns; instead, the decision by neighbouring countries to integrate, a political decision, is what in most cases is required. Reliability and intermittency will be much less of a concern with the wide-availability of hydropower as back-up and storage, once intra-country integration is reached.
Fossil fuel subsidies, in particular for coal and gas are an important obstacle for market entry. The estimated 1% of GDP in fossil fuel subsidies in the region (about US$500 billion per year) (Di Bella et al., 2015) have no rationale for continuing in particular as these subsidies delay the elimination of negative externalities on climate. However, removal of these subsidies will affect the coal and gas industries in the region.
The adoption of rules to allow for distributed power systems, including net metering through- out the region would promote deployment of household and commercial solar installations which may become an important element of the regional power matrix. Wide spread use of distributed systems will affect transmission utilities, reducing their margins. Adoption of a set of consistent rules throughout the region would greatly assist in the deployment of distributed systems.
Some may ask, however, why would nations in the region invest today in renewables, if there is the expectation of even higher levels of relative competitiveness down the road? Early movers and companies that find and fill market niches ahead of the competition do carry a long term advantage and are better positioned to take advantage of market developments. Moving early in this direction will send a signal to the market to develop the necessary systems, components, value-chains, institutional and engineering capabilities, preparing the economic production systems and ensuring value-added gains in other sectors. Also, shifting now to a renewable power base would lock in a long-term low price that is often lower than traditional energy sources and hedges against future fossil price hikes and volatility.
|Decarbonisation of power generation
27
Finally, from a job generation perspective, renewable energy industry is much more labour intensive than highly mechanized and capital intensive thermal power plants like coal or gas-powered units and would thus result in significantly more job creation. For example, it has been estimated that in the US, the deployment of 25% renewable energy standard by 2025 would create more than three times as many jobs as producing an equivalent amount of electricity from fossil fuels (UCS, 2009).
.
|Mass electrification of the transport sector
28
3 Mass electrification of the transport sector If power supply can be decarbonized, does it make sense to think of a simultaneous mass shift to electric drives in the transport sector in Latin America, over time? A shift to electricity in transport would reduce the overall energy use in the region while maintaining the same amount of work delivered by fossil fuels. It would also impact energy security, reducing the need for imports and/or avoiding the expense of an expansion of the refinery capacity to accommodate future demand. It might also help the bottom line of power generators. Finally, it would make a major difference in air quality in urban areas and may promote regional integration.
This section of the document examines the current situation and near term trends of the sector as well as of the technologies and economic conditions that would need to be in place to make transport sector decarbonisation happen. There are a number of other measures that could be envisaged to reduce the carbon footprint of transport; those are beyond the scope of the current analysis. The report focuses exclusively on the electrification of transport concurrent with a decarbonisation of the power matrix and what net difference it would make in the overall carbon footprint of the region. It also discusses the co-benefits linked to improvements in air quality, energy efficiency and security.
3.1 Current situation
Domestic transport and international bunkers were responsible for 27% of the energy use in the region in 2010 (IIASA, 2012)21, and given the composition of the fuels used (see Figure 3.9), for 14.5% of the GHG emissions in 2012 (CAIT, 2015), corresponding to about 0.7 GtCO2e per year (Vergara et al., 2013b). From 2000 to 2012, the transport-related GHG emissions grew nearly 49% (CAIT, 2015), the highest sectorial rate of growth (Table 1.1).
Under Business as Usual conditions, this trend is expected to continue, driven by a combination of a fast urbanization pace and very high motorization rates, amongst the highest worldwide, which are discussed later in this section. The upward trend in emissions has also
21 Data from CAIT for 2011, accessed June 2015
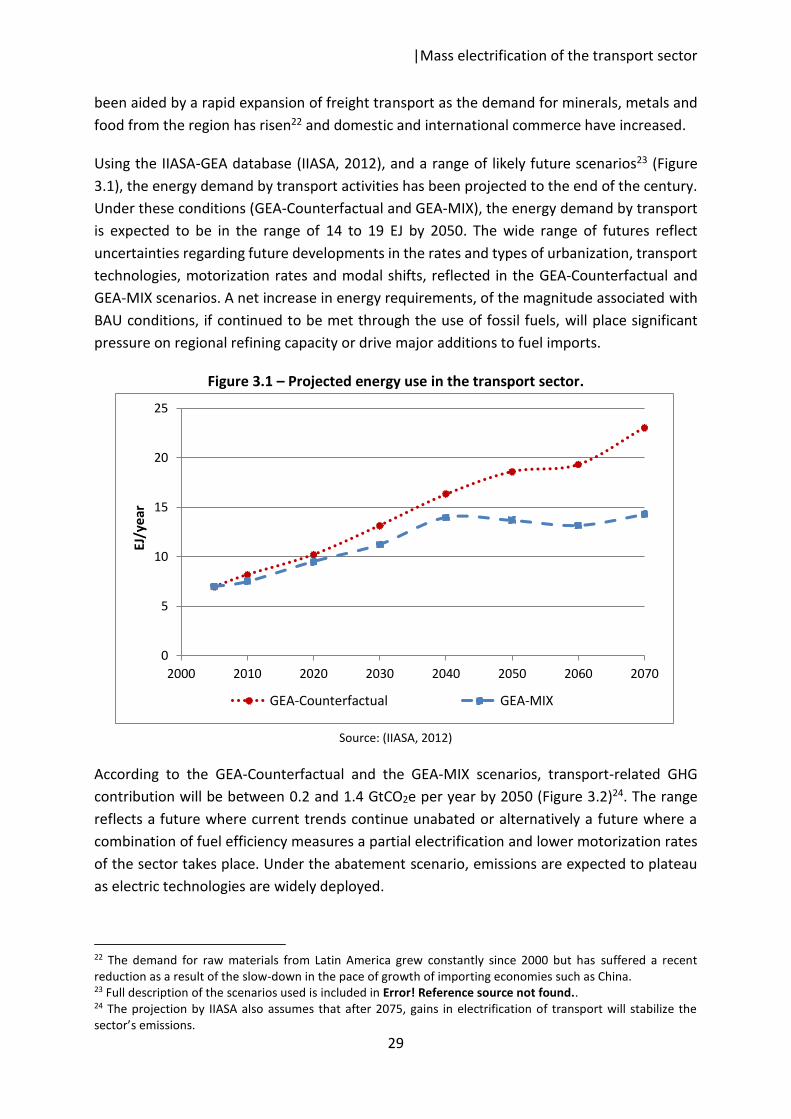
|Mass electrification of the transport sector
29
been aided by a rapid expansion of freight transport as the demand for minerals, metals and food from the region has risen22 and domestic and international commerce have increased.
Using the IIASA-GEA database (IIASA, 2012), and a range of likely future scenarios23 (Figure 3.1), the energy demand by transport activities has been projected to the end of the century. Under these conditions (GEA-Counterfactual and GEA-MIX), the energy demand by transport is expected to be in the range of 14 to 19 EJ by 2050. The wide range of futures reflect uncertainties regarding future developments in the rates and types of urbanization, transport technologies, motorization rates and modal shifts, reflected in the GEA-Counterfactual and GEA-MIX scenarios. A net increase in energy requirements, of the magnitude associated with BAU conditions, if continued to be met through the use of fossil fuels, will place significant pressure on regional refining capacity or drive major additions to fuel imports.
Figure 3.1 – Projected energy use in the transport sector.
Source: (IIASA, 2012)
According to the GEA-Counterfactual and the GEA-MIX scenarios, transport-related GHG contribution will be between 0.2 and 1.4 GtCO2e per year by 2050 (Figure 3.2)24. The range reflects a future where current trends continue unabated or alternatively a future where a combination of fuel efficiency measures a partial electrification and lower motorization rates of the sector takes place. Under the abatement scenario, emissions are expected to plateau as electric technologies are widely deployed.
22 The demand for raw materials from Latin America grew constantly since 2000 but has suffered a recent reduction as a result of the slow-down in the pace of growth of importing economies such as China. 23 Full description of the scenarios used is included in Error! Reference source not found.. 24 The projection by IIASA also assumes that after 2075, gains in electrification of transport will stabilize the sector’s emissions.
0
5
10
15
20
25
2000 2010 2020 2030 2040 2050 2060 2070
EJ/y
ear
GEA-Counterfactual GEA-MIX
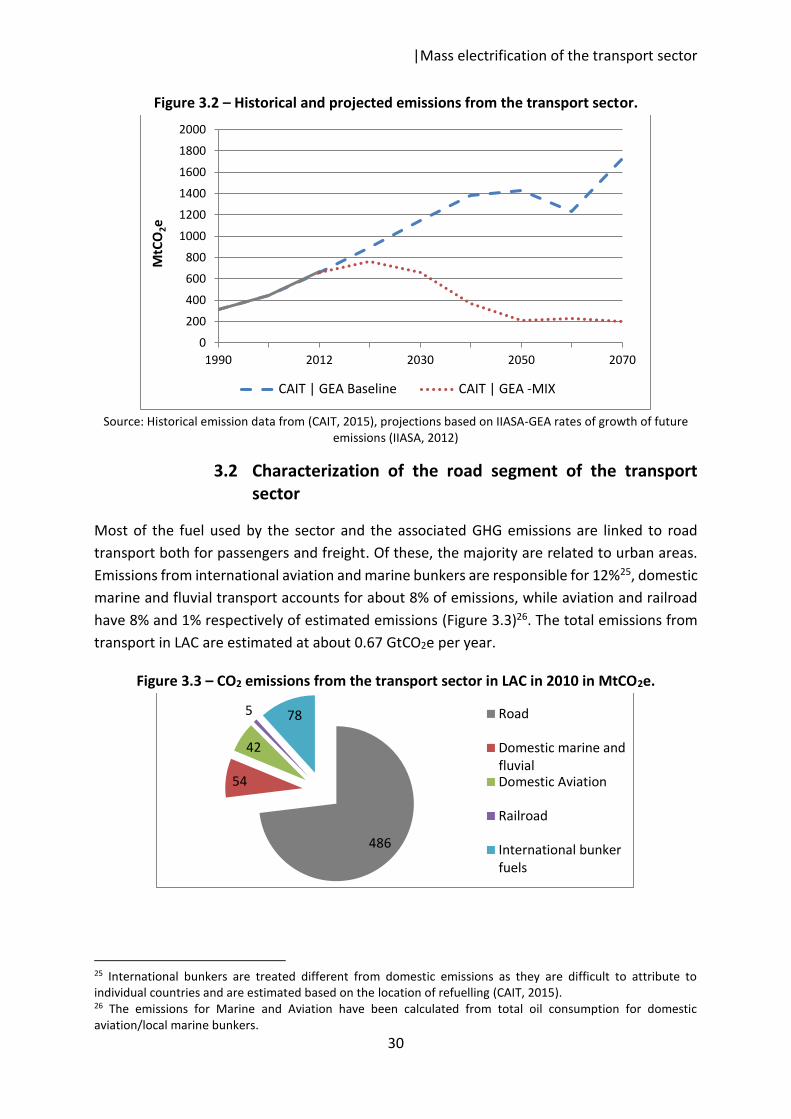
|Mass electrification of the transport sector
30
Figure 3.2 – Historical and projected emissions from the transport sector.
Source: Historical emission data from (CAIT, 2015), projections based on IIASA-GEA rates of growth of future
emissions (IIASA, 2012)
3.2 Characterization of the road segment of the transport sector
Most of the fuel used by the sector and the associated GHG emissions are linked to road transport both for passengers and freight. Of these, the majority are related to urban areas. Emissions from international aviation and marine bunkers are responsible for 12%25, domestic marine and fluvial transport accounts for about 8% of emissions, while aviation and railroad have 8% and 1% respectively of estimated emissions (Figure 3.3)26. The total emissions from transport in LAC are estimated at about 0.67 GtCO2e per year.
Figure 3.3 – CO2 emissions from the transport sector in LAC in 2010 in MtCO2e.
25 International bunkers are treated different from domestic emissions as they are difficult to attribute to individual countries and are estimated based on the location of refuelling (CAIT, 2015). 26 The emissions for Marine and Aviation have been calculated from total oil consumption for domestic aviation/local marine bunkers.
0
200
400
600
800
1000
1200
1400
1600
1800
2000
1990 2012 2030 2050 2070
MtC
O2e
CAIT | GEA Baseline CAIT | GEA -MIX
486
54
42
5 78 Road
Domestic marine andfluvialDomestic Aviation
Railroad
International bunkerfuels
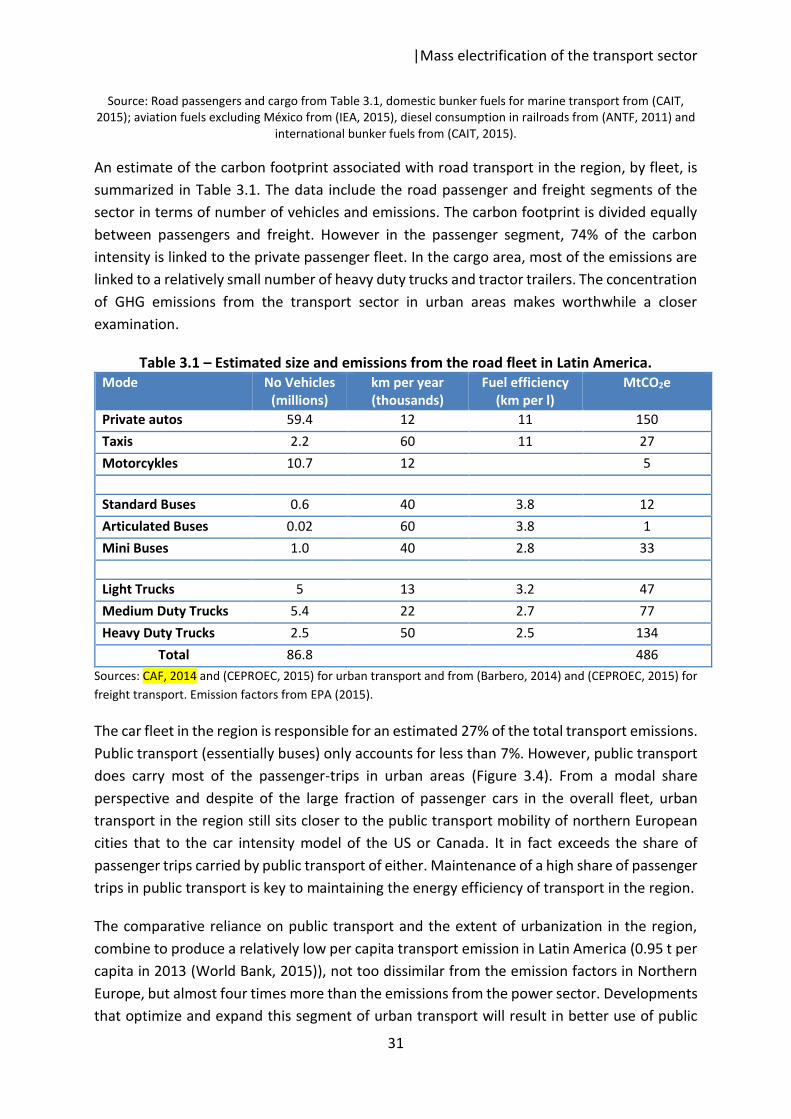
|Mass electrification of the transport sector
31
Source: Road passengers and cargo from Table 3.1, domestic bunker fuels for marine transport from (CAIT, 2015); aviation fuels excluding México from (IEA, 2015), diesel consumption in railroads from (ANTF, 2011) and
international bunker fuels from (CAIT, 2015).
An estimate of the carbon footprint associated with road transport in the region, by fleet, is summarized in Table 3.1. The data include the road passenger and freight segments of the sector in terms of number of vehicles and emissions. The carbon footprint is divided equally between passengers and freight. However in the passenger segment, 74% of the carbon intensity is linked to the private passenger fleet. In the cargo area, most of the emissions are linked to a relatively small number of heavy duty trucks and tractor trailers. The concentration of GHG emissions from the transport sector in urban areas makes worthwhile a closer examination.
Table 3.1 – Estimated size and emissions from the road fleet in Latin America. Mode No Vehicles
(millions) km per year (thousands)
Fuel efficiency (km per l)
MtCO2e
Private autos 59.4 12 11 150 Taxis 2.2 60 11 27 Motorcykles 10.7 12 5 Standard Buses 0.6 40 3.8 12 Articulated Buses 0.02 60 3.8 1 Mini Buses 1.0 40 2.8 33 Light Trucks 5 13 3.2 47 Medium Duty Trucks 5.4 22 2.7 77 Heavy Duty Trucks 2.5 50 2.5 134
Total 86.8 486 Sources: CAF, 2014 and (CEPROEC, 2015) for urban transport and from (Barbero, 2014) and (CEPROEC, 2015) for freight transport. Emission factors from EPA (2015).
The car fleet in the region is responsible for an estimated 27% of the total transport emissions. Public transport (essentially buses) only accounts for less than 7%. However, public transport does carry most of the passenger-trips in urban areas (Figure 3.4). From a modal share perspective and despite of the large fraction of passenger cars in the overall fleet, urban transport in the region still sits closer to the public transport mobility of northern European cities that to the car intensity model of the US or Canada. It in fact exceeds the share of passenger trips carried by public transport of either. Maintenance of a high share of passenger trips in public transport is key to maintaining the energy efficiency of transport in the region.
The comparative reliance on public transport and the extent of urbanization in the region, combine to produce a relatively low per capita transport emission in Latin America (0.95 t per capita in 2013 (World Bank, 2015)), not too dissimilar from the emission factors in Northern Europe, but almost four times more than the emissions from the power sector. Developments that optimize and expand this segment of urban transport will result in better use of public
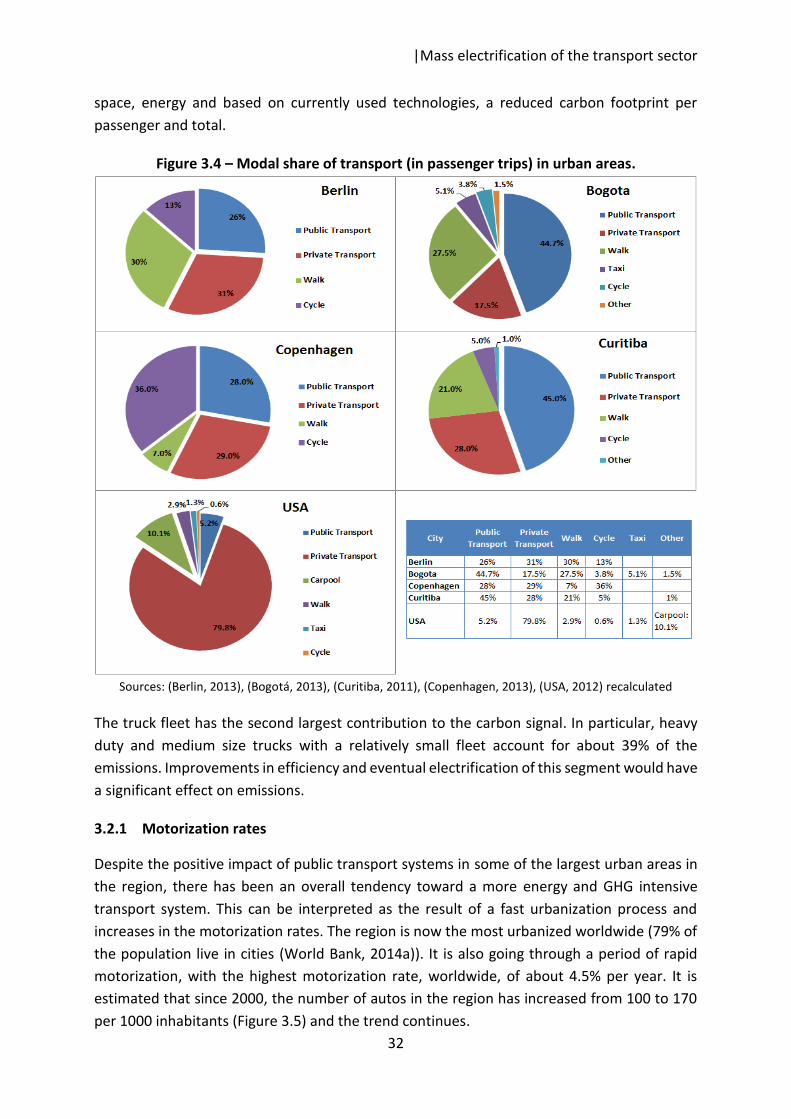
|Mass electrification of the transport sector
32
space, energy and based on currently used technologies, a reduced carbon footprint per passenger and total.
Figure 3.4 – Modal share of transport (in passenger trips) in urban areas.
Sources: (Berlin, 2013), (Bogotá, 2013), (Curitiba, 2011), (Copenhagen, 2013), (USA, 2012) recalculated
The truck fleet has the second largest contribution to the carbon signal. In particular, heavy duty and medium size trucks with a relatively small fleet account for about 39% of the emissions. Improvements in efficiency and eventual electrification of this segment would have a significant effect on emissions.
3.2.1 Motorization rates
Despite the positive impact of public transport systems in some of the largest urban areas in the region, there has been an overall tendency toward a more energy and GHG intensive transport system. This can be interpreted as the result of a fast urbanization process and increases in the motorization rates. The region is now the most urbanized worldwide (79% of the population live in cities (World Bank, 2014a)). It is also going through a period of rapid motorization, with the highest motorization rate, worldwide, of about 4.5% per year. It is estimated that since 2000, the number of autos in the region has increased from 100 to 170 per 1000 inhabitants (Figure 3.5) and the trend continues.
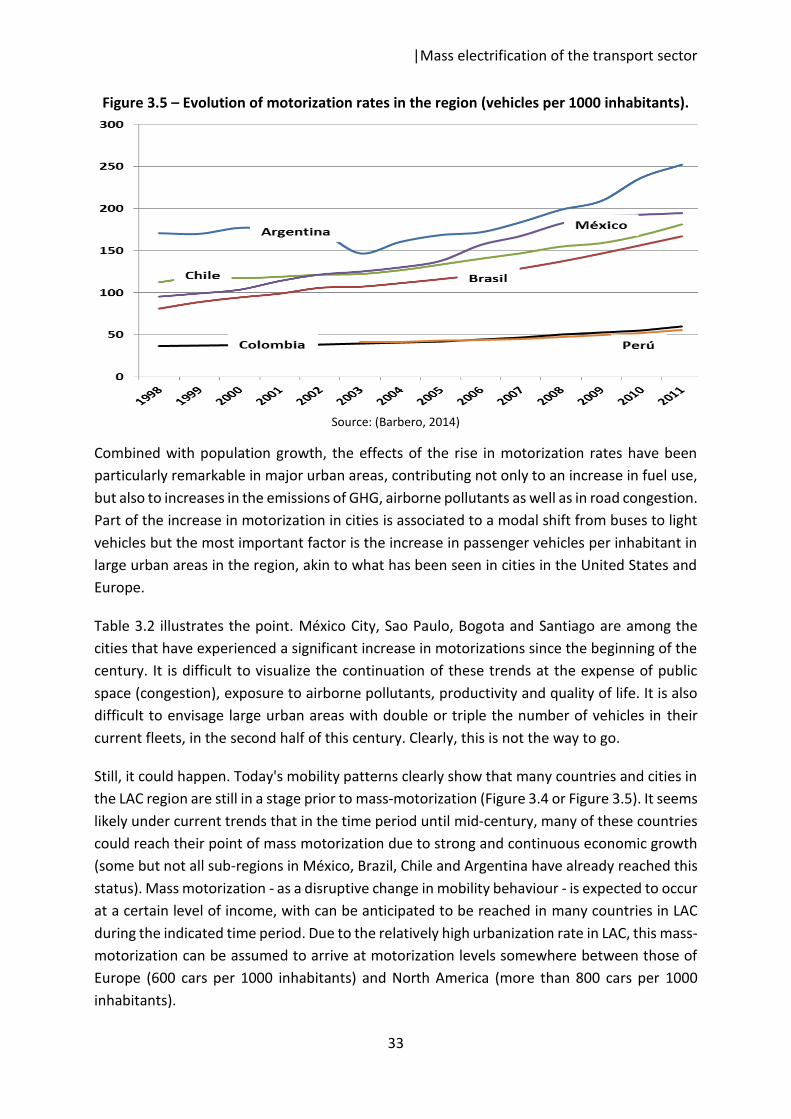
|Mass electrification of the transport sector
33
Figure 3.5 – Evolution of motorization rates in the region (vehicles per 1000 inhabitants).
Source: (Barbero, 2014)
Combined with population growth, the effects of the rise in motorization rates have been particularly remarkable in major urban areas, contributing not only to an increase in fuel use, but also to increases in the emissions of GHG, airborne pollutants as well as in road congestion. Part of the increase in motorization in cities is associated to a modal shift from buses to light vehicles but the most important factor is the increase in passenger vehicles per inhabitant in large urban areas in the region, akin to what has been seen in cities in the United States and Europe.
Table 3.2 illustrates the point. México City, Sao Paulo, Bogota and Santiago are among the cities that have experienced a significant increase in motorizations since the beginning of the century. It is difficult to visualize the continuation of these trends at the expense of public space (congestion), exposure to airborne pollutants, productivity and quality of life. It is also difficult to envisage large urban areas with double or triple the number of vehicles in their current fleets, in the second half of this century. Clearly, this is not the way to go.
Still, it could happen. Today's mobility patterns clearly show that many countries and cities in the LAC region are still in a stage prior to mass-motorization (Figure 3.4 or Figure 3.5). It seems likely under current trends that in the time period until mid-century, many of these countries could reach their point of mass motorization due to strong and continuous economic growth (some but not all sub-regions in México, Brazil, Chile and Argentina have already reached this status). Mass motorization - as a disruptive change in mobility behaviour - is expected to occur at a certain level of income, with can be anticipated to be reached in many countries in LAC during the indicated time period. Due to the relatively high urbanization rate in LAC, this mass-motorization can be assumed to arrive at motorization levels somewhere between those of Europe (600 cars per 1000 inhabitants) and North America (more than 800 cars per 1000 inhabitants).
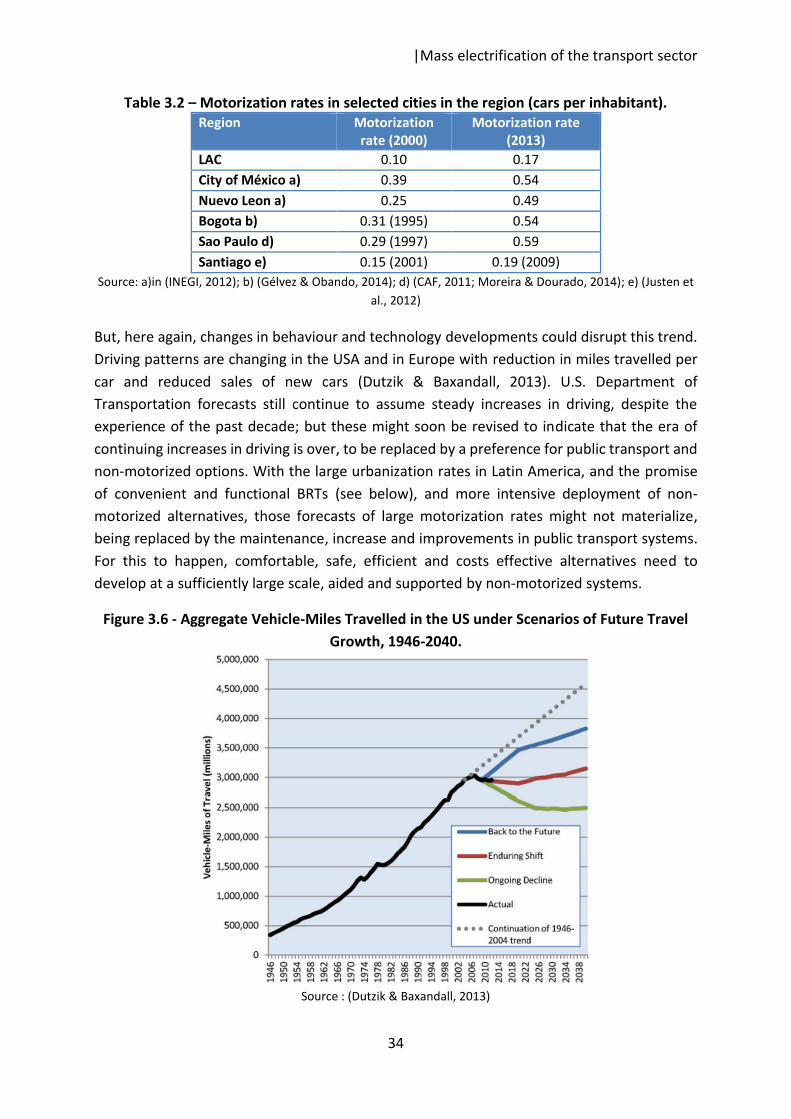
|Mass electrification of the transport sector
34
Table 3.2 – Motorization rates in selected cities in the region (cars per inhabitant). Region Motorization
rate (2000) Motorization rate
(2013) LAC 0.10 0.17 City of México a) 0.39 0.54 Nuevo Leon a) 0.25 0.49 Bogota b) 0.31 (1995) 0.54 Sao Paulo d) 0.29 (1997) 0.59 Santiago e) 0.15 (2001) 0.19 (2009)
Source: a)in (INEGI, 2012); b) (Gélvez & Obando, 2014); d) (CAF, 2011; Moreira & Dourado, 2014); e) (Justen et al., 2012)
But, here again, changes in behaviour and technology developments could disrupt this trend. Driving patterns are changing in the USA and in Europe with reduction in miles travelled per car and reduced sales of new cars (Dutzik & Baxandall, 2013). U.S. Department of Transportation forecasts still continue to assume steady increases in driving, despite the experience of the past decade; but these might soon be revised to indicate that the era of continuing increases in driving is over, to be replaced by a preference for public transport and non-motorized options. With the large urbanization rates in Latin America, and the promise of convenient and functional BRTs (see below), and more intensive deployment of non-motorized alternatives, those forecasts of large motorization rates might not materialize, being replaced by the maintenance, increase and improvements in public transport systems. For this to happen, comfortable, safe, efficient and costs effective alternatives need to develop at a sufficiently large scale, aided and supported by non-motorized systems.
Figure 3.6 - Aggregate Vehicle-Miles Travelled in the US under Scenarios of Future Travel Growth, 1946-2040.
Source : (Dutzik & Baxandall, 2013)
|Mass electrification of the transport sector
35
3.2.2 Bus Rapid Transit Systems (BRTs)
A development in the direction of energy efficiency and rationalization of transport is the emergence of Bus Rapid Transit Systems (BRTs) in the region. In essence, BRTs allow for preferential allocation of public space for buses, to provide public transportation. These systems have proven to be very cost effective, enabling mobility as intended, at levels comparable to metro and rail systems, but at a fraction of the cost and with relatively faster deployment and reduced needs of infrastructure. Table 3.3 compares the different estimates for alternative public transport systems in Bogota, where all three modes are being actively considered. Both the Metro and Light Rail options are electric.
Table 3.3 – Cost effectiveness for different modes of mass transport in urban areas (example of Bogota).
Mode US$ Million per km Passengers per hour BRTs 2 to 10 40,000 Metro Systems 10 to 40 60,000 Urban Rail 5 to 20 20,000
Source: BRTdata (2015) for BRT costs in Bogota; reported estimates for Metro and Rail from current projects for the Metro system, route 1 and for the Light Rail along Boyaca Ave.
BRTs are already a key mode of transport throughout the region and in cities like Bogota and Curitiba are central to the urban transport system. In other cities like Quito, Lima, México City and others, BRTs also capture a significant and growing share of passenger trips. There are now 62 BRTs in operation in the region, the most worldwide, moving about 20 million passenger-km per day on a system that is 1700 km long (BRTdata, 2015). BRTs are not only being implemented in several other large cities in Latin America but also in Asia, Africa and even in the United States and Canada. From a GHG emissions perspective, fossil fuel-based BRTs are remarkably efficient. Compared with other non-electric transport modes, BRTs are less carbon intensive. Still, today BRTs only comprise a small segment of passenger transport in urban areas. A major expansion of these systems would be required for BRTs to play their full potential.
Looking forward, the organizational and management changes brought about by the deployment of BRTs could be used as a platform to initiate the electrification of transport. The technology exists both for rolling stock and for charging stations. The economic competitiveness of the electrical option is continually increasing and one could expect electric BRTs to be part of the near future. With marginal adjustments in infrastructure, the electrification of transport could be initiated through the BRT segment. It would also contribute to its maintenance and growth as an alternative to massive motorization.
|Mass electrification of the transport sector
36
3.2.3 Freight Transport
Domestic freight transport in the region is overwhelmingly by road and uses light to heavy trucks, mostly powered by diesel fuel. Inter-country freight movement on the other hand, has a large marine component, most of it using bunker or marine fuel oil. The total annual movement of freight has been estimated at 4.5 billion tons per year, of which roughly two thirds are domestic (Barbero, 2014).
The freight transport by road in Latin America is not well documented. The fleet is very heterogeneous with little standardization in domestic markets and much less so in international shipping. Also, the average fleet is old (Guerrero & Abad, 2013) and this contributes to relatively low standards of fuel efficiency and emission standards. The modal composition of freight in some countries in the region is illustrated in Figure 3.7 below. Road transport accounts for 58 to 92% of the freight in ton km or tons in the countries shown.
The prospects for modernization of the truck fleet are hampered by the atomization of its ownership, which includes a large number of owner-operators with one or two units and a smaller number of medium and large scale operators. The capacity of the fleet also varies with a range that goes from light trucks to double trailers. Heavy trucks make up a disproportionate fraction of the transport carbon footprint in the region. It is estimated that heavy trucks with only 3% of the fleet, emit 28% of the road related transport emissions (Table 3.1).

|Mass electrification of the transport sector
37
Figure 3.7 – Modal composition of Freight Transport in Selected countries in LAC.
Source: (Barbero, 2014)
3.2.4 Railroads
From a relatively small base, the movement of freight by railroad has been growing faster than the GDP or the consumption of power in the region (Figure 3.8). Most of this growth has been induced by the movement of minerals, metals, cereals, coal and other fossil fuels destined to export markets. Close to 90% of all freight by railway is concentrated in just three countries, Brazil, México and Colombia.
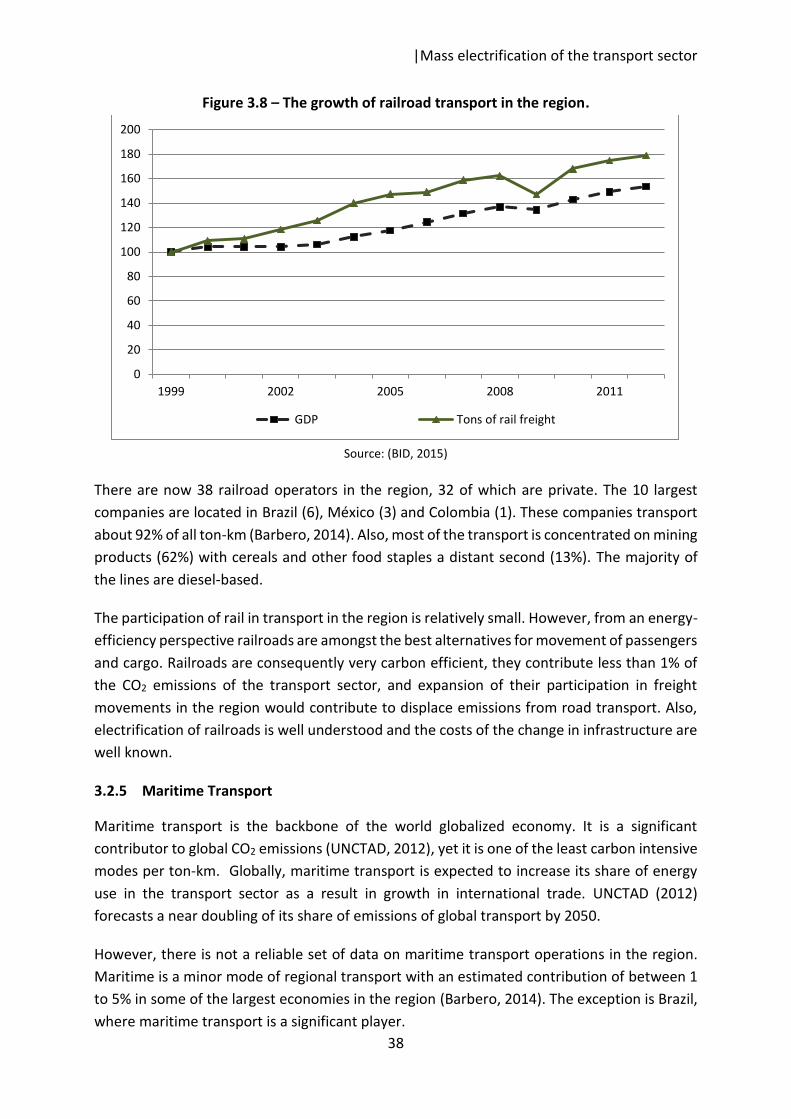
|Mass electrification of the transport sector
38
Figure 3.8 – The growth of railroad transport in the region.
Source: (BID, 2015)
There are now 38 railroad operators in the region, 32 of which are private. The 10 largest companies are located in Brazil (6), México (3) and Colombia (1). These companies transport about 92% of all ton-km (Barbero, 2014). Also, most of the transport is concentrated on mining products (62%) with cereals and other food staples a distant second (13%). The majority of the lines are diesel-based.
The participation of rail in transport in the region is relatively small. However, from an energy-efficiency perspective railroads are amongst the best alternatives for movement of passengers and cargo. Railroads are consequently very carbon efficient, they contribute less than 1% of the CO2 emissions of the transport sector, and expansion of their participation in freight movements in the region would contribute to displace emissions from road transport. Also, electrification of railroads is well understood and the costs of the change in infrastructure are well known.
3.2.5 Maritime Transport
Maritime transport is the backbone of the world globalized economy. It is a significant contributor to global CO2 emissions (UNCTAD, 2012), yet it is one of the least carbon intensive modes per ton-km. Globally, maritime transport is expected to increase its share of energy use in the transport sector as a result in growth in international trade. UNCTAD (2012) forecasts a near doubling of its share of emissions of global transport by 2050.
However, there is not a reliable set of data on maritime transport operations in the region. Maritime is a minor mode of regional transport with an estimated contribution of between 1 to 5% in some of the largest economies in the region (Barbero, 2014). The exception is Brazil, where maritime transport is a significant player.
0
20
40
60
80
100
120
140
160
180
200
1999 2002 2005 2008 2011
GDP Tons of rail freight
|Mass electrification of the transport sector
39
There is a significant potential to reduce shipping emissions. The reduction potential, as assessed by DNV (2010) is roughly 50% and half of this can be achieved without net costs. The DNV (2010) assessment concludes that CO2 emissions by 2030 can be reduced by 30% below baseline in a cost-effective way, and by almost 60% if all the identified measures are included. Speed reduction, waste heat recovery, Liquefied natural gas (LNG) and propeller measures are amongst the most effective. Hybrid (diesel-electric) engines are already being demonstrated in ferry passenger and cargo transport in Northern Europe with significant energy savings (Scandlines, 2015). A Maritime Transport Task Force has been established by the European Union to investigate further options to reduce emissions.
3.2.6 Aviation
Aviation is responsible for a growing share of transport emissions, estimated in 2012 at 42 MtCO2e in 2010 (Figure 3.3). It has the largest carbon footprint per passenger-km of all modes of transport. It is also a sector where solutions for GHG abatement are more difficult to visualize at the moment. Efforts have been made to produce aviation fuels with lower carbon content, including proposals for biofuels by, for example, the European Biofuels Technology Platform and for recycled fuels (waste gases from steel manufacture). But, in the aggregate very little has been done to control emissions. For purposes of this analysis, abatement of GHG emissions from aviation is not considered as part of the route. The anticipated emissions under BAU conditions are considered unaltered by 2050.
3.2.7 Alternative fuels in transport
Another feature of the transport sector in the region is the use of non-fossil fuels. Ethanol and to some extend esterified vegetable oils (“bio diesel”) have been in use in Brazil since the 1970s. Today several other countries have also included biofuels in their mix. Figure 3.9 illustrates the current transport fuel usage by type, region-wide. About 6% of the total is biofuels. There is however, considerable discussion in the literature about the net contribution of biofuels to reduce net GHG emissions (Reference?). Some studies (Searchinger et al., 2008) have concluded that biofuels may end up increasing emissions27. Other analysis point out to a net reduction under specific circumstances (Farrell et al., 2006; Martin et al., 2015). Natural gas use in transport has also a significant contribution, mostly in urban areas and in light vehicles, its use has lowered direct GHG emissions, but may be a net contributor if fugitive emissions (leaks) are significant. Electric power is also used in transport, mostly in metro and light rail systems in urban areas.
27 Searchinger et al. (2008) using a worldwide agricultural model to estimate emissions from land-use change, found that corn-based ethanol, instead of producing a 20% savings, nearly doubles greenhouse emissions over 30 years and increases greenhouse gases for 167 years.

|Mass electrification of the transport sector
40
Figure 3.9 – Type of fuels used in LAC transport sector in 2013.
Source: (Enerdata, 2015)
3.3 The impact of transport operations on air quality
The majority of air toxics and other airborne pollutants in urban air-sheds can be traced back to mobile sources. For example a transport system that relies on diesel, may result in substantial emission of particulates unless these are strictly controlled in the exhaust system of vehicles. Particulates are responsible for increases in morbidity and mortality in urban areas and for losses in productivity. NOx and VOCs contribute to chemical smog and have been also linked to various health impacts. Black carbon, emitted as part of particulate matter has a link to climate and may result in substantial increases in albedo in areas surrounding large cities (Vergara et al., 2013b). Other emissions from the transport sector, including NOx, CO and VOCs have been shown to also affect human health28. However, the health hazards associated with ozone and PM2.5 are the most important in terms of impacts on human health.
Reducing air pollution in the urban areas will have significant co-benefits in air quality and human health that can be monetized and thus influence economic choices. Reductions in airborne pollutants are expected to lead to significant economic benefits in terms of improved health29: These benefits include:
i. reduced cost of illness (COI), ii. reduced losses in productivity,
iii. the avoided costs of reduced acute and chronic morbidity effects, iv. the avoided costs of reduced acute and chronic mortality effects.
28 For a detailed treatment of the linkage between air pollution and transport see for example (Gorham, 2002) and (OECD, 2014) 29 In the literature on economic valuation of morbidity effects used here, only studies that specifically differentiated between the cost categories (COI, productivity loss, and WTP) were considered. The COI used in this study includes treatment costs, laboratory costs, and medicine costs. The WTP includes the nonphysical dimension of illness, hence excluding loss of earnings and COI. Special attention has been given to preventing double counting.
6 2 1
3853
Biofuels
Electricity
Natural gas
LPG
Diesel
Gasoline

|Mass electrification of the transport sector
41
A number of studies have been conducted to assess the impact of airborne pollutants from mobile sources on health but also to monetize these impacts. A study in México City concluded that compliance with WHO standards for air quality would result in avoided costs equivalent to 2% of the GDP of the city (World Bank, 2002). Many other assessments have been made on various aspects of the issue. Annex V includes a summary of findings from different sources on the cost of air pollution.
A recent analysis (OECD, 2014) has examined the costs of air pollution from road transport in OECD and other large nations. It concludes that the cost of the health impact of air pollution in OECD countries (including deaths and illness) was about US$1.7 trillion in 2010. It also indicates that available evidence suggests that road transport accounts for about 50% of this cost in the OECD, or close to US$1 trillion. The study concludes that in México the total costs of air pollution in 2010 were about US$39 billion of which about 50% of air pollution costs are linked to road transport. Further, it is estimated that from an air quality perspective most of airborne pollutants of concern are associated to diesel (91% of PM2.5 and 95% of NO2 were attributable to diesel vehicles in London (Moore & Newey, 2012)). On this basis, an estimate has been made of the economic consequences of air pollution per km travelled by diesel and gasoline vehicles. The results are shown in Figure 3.13 and the calculations are included in Annex IV.
3.4 Mass Electrification of Transport
The relatively low carbon intensity of the power system, the expectation for further lowering of its carbon signal as more renewable energy comes on stream, as well as the potential avoided costs on human health from air pollution, provide arguments for the review of an electric transport option. If it were possible, electrification of the entire sector would have a significant impact in the carbon footprint of the region. It would also bring about gains in environmental quality in urban areas and in energy efficiency and security. It may also result in improvements in the financial performance of the power sector, provided the transport-derived load is complementary with the current demand patterns for electricity. On the other hand it would result in the displacement of infrastructure assets linked to the refining, transport and distribution of liquid distillates and the associated labour and business activity. Today, electrification is a technological option for road, marine and railroad systems.
The potential mass electrification of transport in the near future is also aided by the combined effects of a number of evolving technologies that may end up accelerating the entry of electric vehicles. These are summarized in Table 3.4. However, there are technological and economic challenges that may prevent full decarbonisation of the sector. In this section, the technology and economic trends that may allow for mass electrification in transport in Latin America are reviewed and perceived barriers summarized.
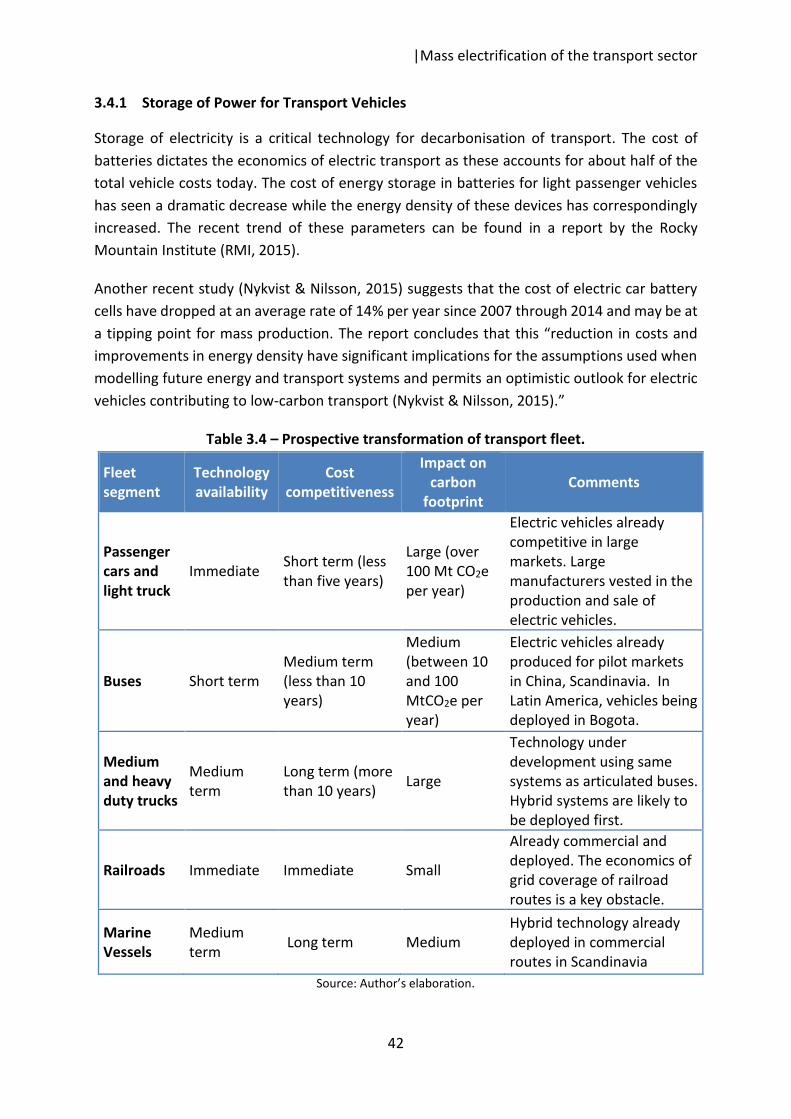
|Mass electrification of the transport sector
42
3.4.1 Storage of Power for Transport Vehicles
Storage of electricity is a critical technology for decarbonisation of transport. The cost of batteries dictates the economics of electric transport as these accounts for about half of the total vehicle costs today. The cost of energy storage in batteries for light passenger vehicles has seen a dramatic decrease while the energy density of these devices has correspondingly increased. The recent trend of these parameters can be found in a report by the Rocky Mountain Institute (RMI, 2015).
Another recent study (Nykvist & Nilsson, 2015) suggests that the cost of electric car battery cells have dropped at an average rate of 14% per year since 2007 through 2014 and may be at a tipping point for mass production. The report concludes that this “reduction in costs and improvements in energy density have significant implications for the assumptions used when modelling future energy and transport systems and permits an optimistic outlook for electric vehicles contributing to low-carbon transport (Nykvist & Nilsson, 2015).”
Table 3.4 – Prospective transformation of transport fleet.
Fleet segment
Technology availability
Cost competitiveness
Impact on carbon
footprint Comments
Passenger cars and light truck
Immediate Short term (less than five years)
Large (over 100 Mt CO2e per year)
Electric vehicles already competitive in large markets. Large manufacturers vested in the production and sale of electric vehicles.
Buses Short term Medium term (less than 10 years)
Medium (between 10 and 100 MtCO2e per year)
Electric vehicles already produced for pilot markets in China, Scandinavia. In Latin America, vehicles being deployed in Bogota.
Medium and heavy duty trucks
Medium term
Long term (more than 10 years) Large
Technology under development using same systems as articulated buses. Hybrid systems are likely to be deployed first.
Railroads Immediate Immediate Small
Already commercial and deployed. The economics of grid coverage of railroad routes is a key obstacle.
Marine Vessels
Medium term Long term Medium
Hybrid technology already deployed in commercial routes in Scandinavia
Source: Author’s elaboration.
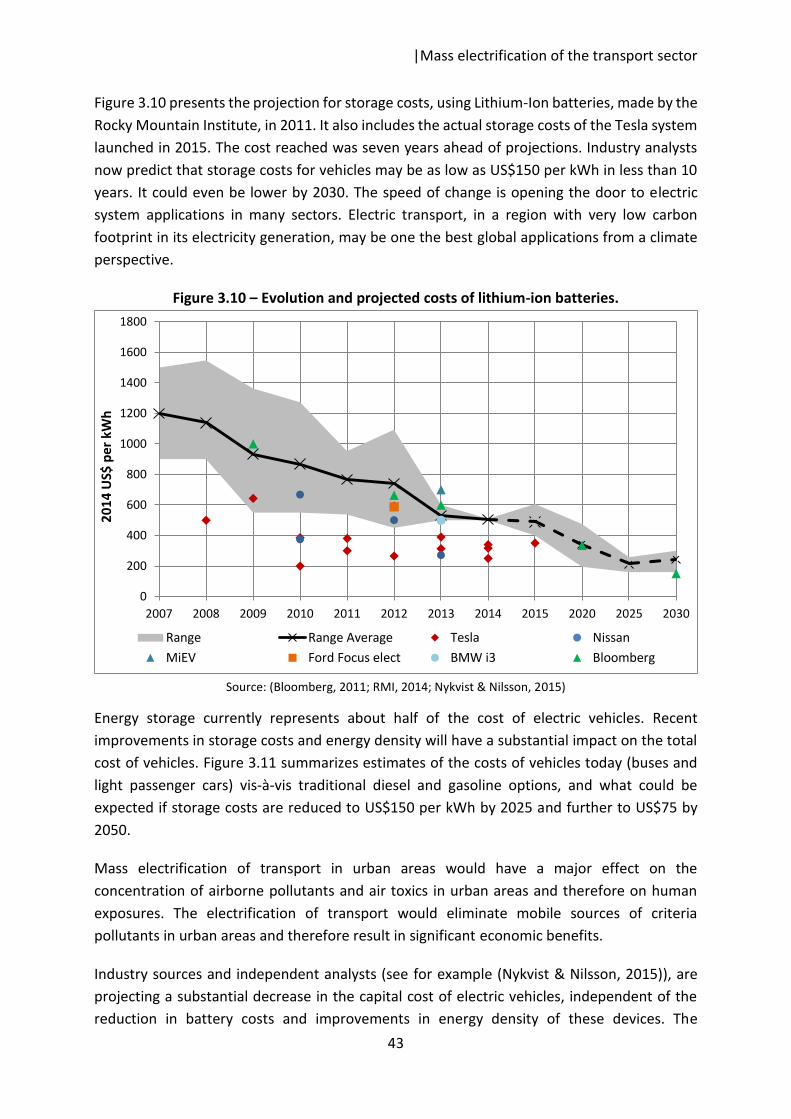
|Mass electrification of the transport sector
43
Figure 3.10 presents the projection for storage costs, using Lithium-Ion batteries, made by the Rocky Mountain Institute, in 2011. It also includes the actual storage costs of the Tesla system launched in 2015. The cost reached was seven years ahead of projections. Industry analysts now predict that storage costs for vehicles may be as low as US$150 per kWh in less than 10 years. It could even be lower by 2030. The speed of change is opening the door to electric system applications in many sectors. Electric transport, in a region with very low carbon footprint in its electricity generation, may be one the best global applications from a climate perspective.
Figure 3.10 – Evolution and projected costs of lithium-ion batteries.
Source: (Bloomberg, 2011; RMI, 2014; Nykvist & Nilsson, 2015)
Energy storage currently represents about half of the cost of electric vehicles. Recent improvements in storage costs and energy density will have a substantial impact on the total cost of vehicles. Figure 3.11 summarizes estimates of the costs of vehicles today (buses and light passenger cars) vis-à-vis traditional diesel and gasoline options, and what could be expected if storage costs are reduced to US$150 per kWh by 2025 and further to US$75 by 2050.
Mass electrification of transport in urban areas would have a major effect on the concentration of airborne pollutants and air toxics in urban areas and therefore on human exposures. The electrification of transport would eliminate mobile sources of criteria pollutants in urban areas and therefore result in significant economic benefits.
Industry sources and independent analysts (see for example (Nykvist & Nilsson, 2015)), are projecting a substantial decrease in the capital cost of electric vehicles, independent of the reduction in battery costs and improvements in energy density of these devices. The
0
200
400
600
800
1000
1200
1400
1600
1800
2007 2008 2009 2010 2011 2012 2013 2014 2015 2020 2025 2030
2014
US$
per
kW
h
Range Range Average Tesla NissanMiEV Ford Focus elect BMW i3 Bloomberg
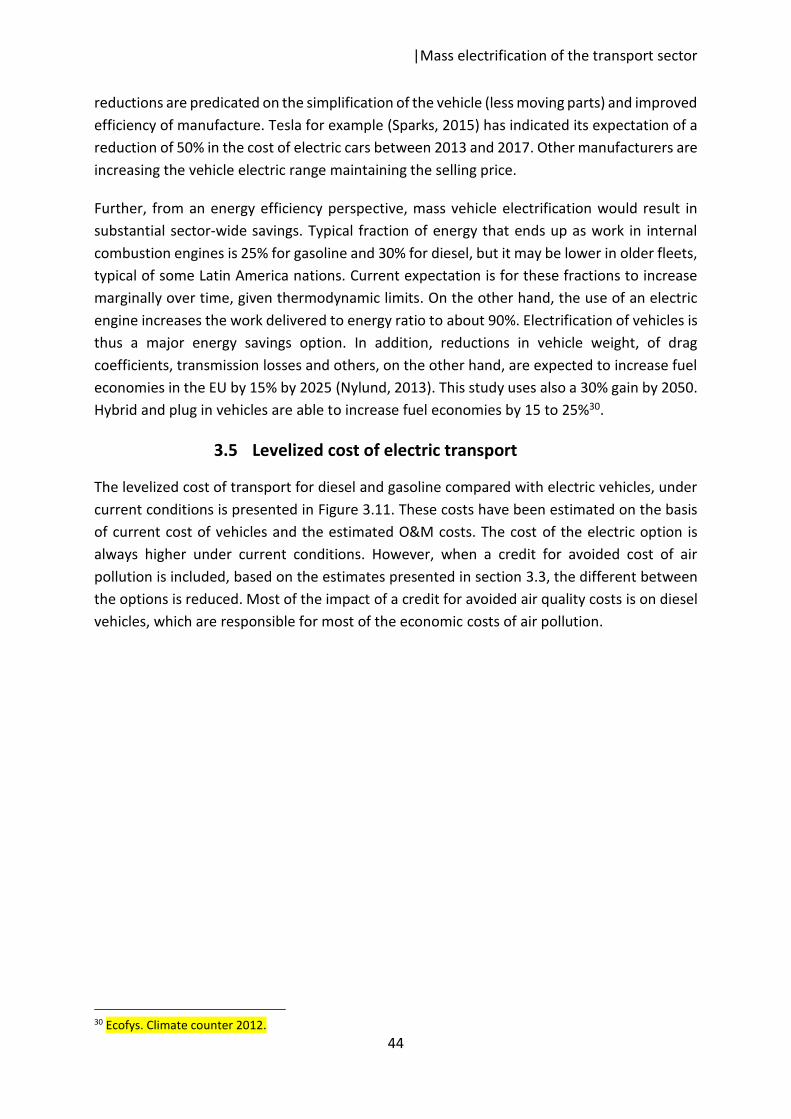
|Mass electrification of the transport sector
44
reductions are predicated on the simplification of the vehicle (less moving parts) and improved efficiency of manufacture. Tesla for example (Sparks, 2015) has indicated its expectation of a reduction of 50% in the cost of electric cars between 2013 and 2017. Other manufacturers are increasing the vehicle electric range maintaining the selling price.
Further, from an energy efficiency perspective, mass vehicle electrification would result in substantial sector-wide savings. Typical fraction of energy that ends up as work in internal combustion engines is 25% for gasoline and 30% for diesel, but it may be lower in older fleets, typical of some Latin America nations. Current expectation is for these fractions to increase marginally over time, given thermodynamic limits. On the other hand, the use of an electric engine increases the work delivered to energy ratio to about 90%. Electrification of vehicles is thus a major energy savings option. In addition, reductions in vehicle weight, of drag coefficients, transmission losses and others, on the other hand, are expected to increase fuel economies in the EU by 15% by 2025 (Nylund, 2013). This study uses also a 30% gain by 2050. Hybrid and plug in vehicles are able to increase fuel economies by 15 to 25%30.
3.5 Levelized cost of electric transport
The levelized cost of transport for diesel and gasoline compared with electric vehicles, under current conditions is presented in Figure 3.11. These costs have been estimated on the basis of current cost of vehicles and the estimated O&M costs. The cost of the electric option is always higher under current conditions. However, when a credit for avoided cost of air pollution is included, based on the estimates presented in section 3.3, the different between the options is reduced. Most of the impact of a credit for avoided air quality costs is on diesel vehicles, which are responsible for most of the economic costs of air pollution.
30 Ecofys. Climate counter 2012.

|Mass electrification of the transport sector
45
Figure 3.11 – Current (2012) levelized cost of alternative transport drive options.
Source: Author´s estimates; the shaded area reflects the estimated avoided cost of air pollution when gasoline
and diesel vehicles are replaced by electric options.
On the basis of the projected gains in the efficiency and density of energy storage in vehicles; the estimated drop in electricity prices resulting from wholesale entry of renewables; and projections for substantial reductions over time in the costs of electric vehicles, a comparison has been made of the projected levelized costs of transport of electric vs traditional vehicles. The assumptions made on future capital and operation and maintenance costs are summarized in Annex V. The estimates are summarized in Figure 3.12. Electric vehicles, in all segments of the fleet under consideration (cars, buses, trucks), will gain in competitiveness and in some cases will surpass the fossil option well before 2050. In particular electric cars should be able to compete and displace the fossil fuel option in the short term.
These developments assume that new technology (EV and charging systems) will need to emerge for all relevant sub-sectors (i.e. passenger cars and buses, trucks, ships) during this period, as by 2015, there is not a single country in the world that has more than 10-20% of its energy use in transport from electricity. Many companies provide some indications that electrification of transport might be feasible by 2030/50, yet not all technology-related questions seem to be answered at the moment. While some technology leaders have opened their patents to the public, it would still be necessary to ensure a smooth transfer of these technologies into the LAC region, for example through the UNFCCC Technology Mechanism.
0
0.5
1
1.5
2
2.5
Gasoline Electricity Diesel Electricity Diesel Electricity Diesel Electricity
Cars Bus (12m) Bus (18m) Heavy Trucks
US$
/km
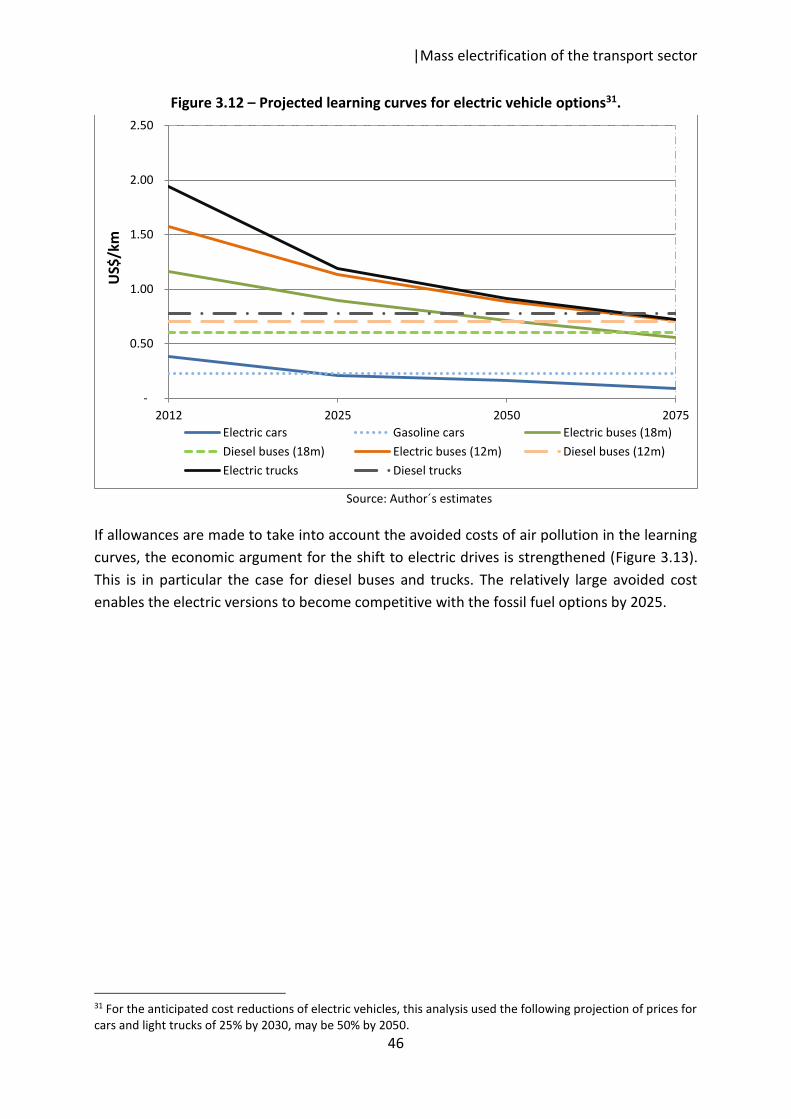
|Mass electrification of the transport sector
46
Figure 3.12 – Projected learning curves for electric vehicle options31.
Source: Author´s estimates
If allowances are made to take into account the avoided costs of air pollution in the learning curves, the economic argument for the shift to electric drives is strengthened (Figure 3.13). This is in particular the case for diesel buses and trucks. The relatively large avoided cost enables the electric versions to become competitive with the fossil fuel options by 2025.
31 For the anticipated cost reductions of electric vehicles, this analysis used the following projection of prices for cars and light trucks of 25% by 2030, may be 50% by 2050.
-
0.50
1.00
1.50
2.00
2.50
2012 2025 2050 2075
US$
/km
Electric cars Gasoline cars Electric buses (18m)Diesel buses (18m) Electric buses (12m) Diesel buses (12m)Electric trucks Diesel trucks
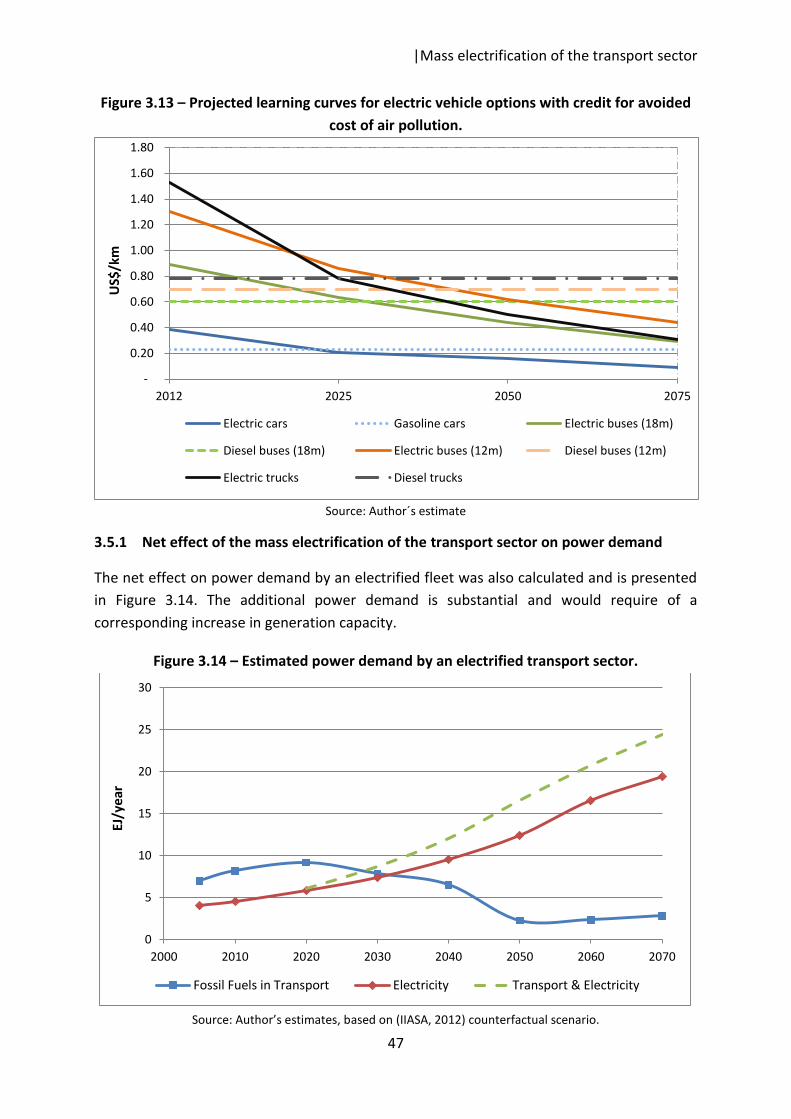
|Mass electrification of the transport sector
47
Figure 3.13 – Projected learning curves for electric vehicle options with credit for avoided cost of air pollution.
Source: Author´s estimate
3.5.1 Net effect of the mass electrification of the transport sector on power demand
The net effect on power demand by an electrified fleet was also calculated and is presented in Figure 3.14. The additional power demand is substantial and would require of a corresponding increase in generation capacity.
Figure 3.14 – Estimated power demand by an electrified transport sector.
Source: Author’s estimates, based on (IIASA, 2012) counterfactual scenario.
-
0.20
0.40
0.60
0.80
1.00
1.20
1.40
1.60
1.80
2012 2025 2050 2075
US$
/km
Electric cars Gasoline cars Electric buses (18m)
Diesel buses (18m) Electric buses (12m) Diesel buses (12m)
Electric trucks Diesel trucks
0
5
10
15
20
25
30
2000 2010 2020 2030 2040 2050 2060 2070
EJ/y
ear
Fossil Fuels in Transport Electricity Transport & Electricity
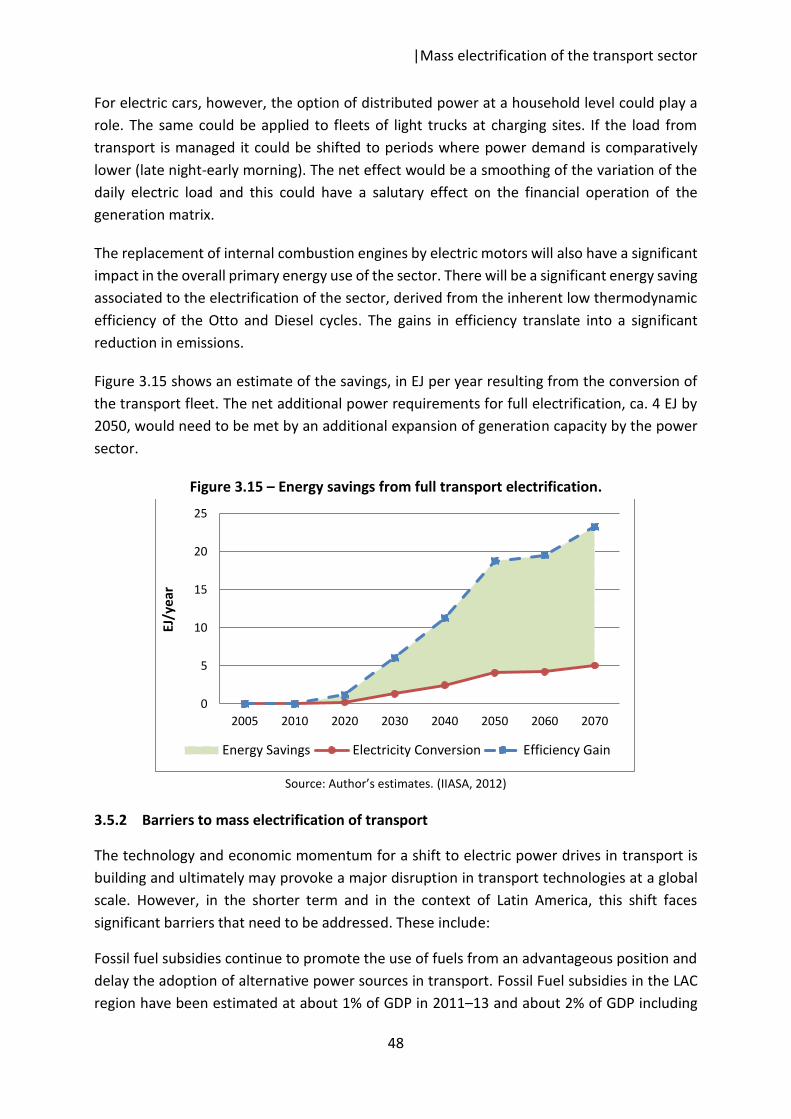
|Mass electrification of the transport sector
48
For electric cars, however, the option of distributed power at a household level could play a role. The same could be applied to fleets of light trucks at charging sites. If the load from transport is managed it could be shifted to periods where power demand is comparatively lower (late night-early morning). The net effect would be a smoothing of the variation of the daily electric load and this could have a salutary effect on the financial operation of the generation matrix.
The replacement of internal combustion engines by electric motors will also have a significant impact in the overall primary energy use of the sector. There will be a significant energy saving associated to the electrification of the sector, derived from the inherent low thermodynamic efficiency of the Otto and Diesel cycles. The gains in efficiency translate into a significant reduction in emissions.
Figure 3.15 shows an estimate of the savings, in EJ per year resulting from the conversion of the transport fleet. The net additional power requirements for full electrification, ca. 4 EJ by 2050, would need to be met by an additional expansion of generation capacity by the power sector.
Figure 3.15 – Energy savings from full transport electrification.
Source: Author’s estimates. (IIASA, 2012)
3.5.2 Barriers to mass electrification of transport
The technology and economic momentum for a shift to electric power drives in transport is building and ultimately may provoke a major disruption in transport technologies at a global scale. However, in the shorter term and in the context of Latin America, this shift faces significant barriers that need to be addressed. These include:
Fossil fuel subsidies continue to promote the use of fuels from an advantageous position and delay the adoption of alternative power sources in transport. Fossil Fuel subsidies in the LAC region have been estimated at about 1% of GDP in 2011–13 and about 2% of GDP including
0
5
10
15
20
25
2005 2010 2020 2030 2040 2050 2060 2070
EJ/y
ear
Energy Savings Electricity Conversion Efficiency Gain
|Mass electrification of the transport sector
49
negative externalities (Di Bella et al., 2015). Removing the subsidies would also have a salutary effect on fiscal revenues.
The lack of internalization of health and other environmental benefits associated with the displacement of diesel, fuel oil and gasoline, which impede the adoption of cleaner options. These benefits accrue to society and represent avoided costs that should be credited to promote the adoption of electric systems.
Actual consumption patterns suggest that consumers, as their income increase, reduce their share of expenses on food in total expenditure and increase their expenses on “private transport”. This pattern indicates that new low and middle income groups are not satisfied with the actual public transport and then as they are able they switch to private cars. Substantial improvements in the quality of private transport are thus required.
The capital value and associated jobs and enterprises linked to petroleum refining and distribution of liquid fuels would be displaced by the entry of electric vehicles. A natural resistance is to be expected. On the other hand, electrification of transport can be viewed as growth opportunity as it will need engineers, transport economists, logistics experts on down the line, for the new transport systems.
|Land: From a carbon source to a carbon sink
50
4 Land: From a carbon source to a carbon sink
The bulk of GHG emissions in Latin America are primarily generated from agriculture, forestry, and other land uses (AFOLU). Of the estimated 4.6 GtCO2e emitted in LAC in 2012, about 50% were associated with AFOLU (Table 1.1). Therefore, land use change is a key pillar of any decarbonisation pathway; any large scale effort to reduce LAC’s carbon intensity would need to be heavily tilted toward this option.
This section of the document examines the prospects for major reductions in the carbon emissions from land use and the possibility of net accumulations of carbon stocks. It does it by reviewing the potential for avoided deforestation as well as for major increases in carbon sinks through reforestation and land restoration, as well as through measures to reduce the emissions from agricultural (and animal husbandry) activities. The section also looks at the associated economic benefits and costs.
4.1 Current Situation
LAC’s aggregate output of agricultural and forest production is estimated to have surpassed 5% of the total regional GDP in 2012 (World Bank, 2015) driven largely by increases in the value of agricultural commodities but also by productivity gains and increases in area under production. It represents the key economic activity in rural and small urban communities across Latin America. It is anticipated that this will remain to be the case for the foreseeable future.
Also, globally, LAC is expected to play an increasingly important role in food security as a leading producer and exporter of agricultural commodities. Agricultural exports now account for 23% of the region’s total exports and contributed about 11% of the global trade in food feed and fibre in 2013 (Vergara et al., 2014), both indices are driven by global demand. In addition, agriculture and forestry are important for the livelihood of millions of people in the region. The agriculture and forestry share of total household income reaches over 50% among poor rural households in several countries32. These activities employed about 15% of total
32 Including –among others−Nicaragua (IFAD, 2010), Brazil (Valdes & Mistiaen, 2003) and El Salvador (World Bank, 1998).
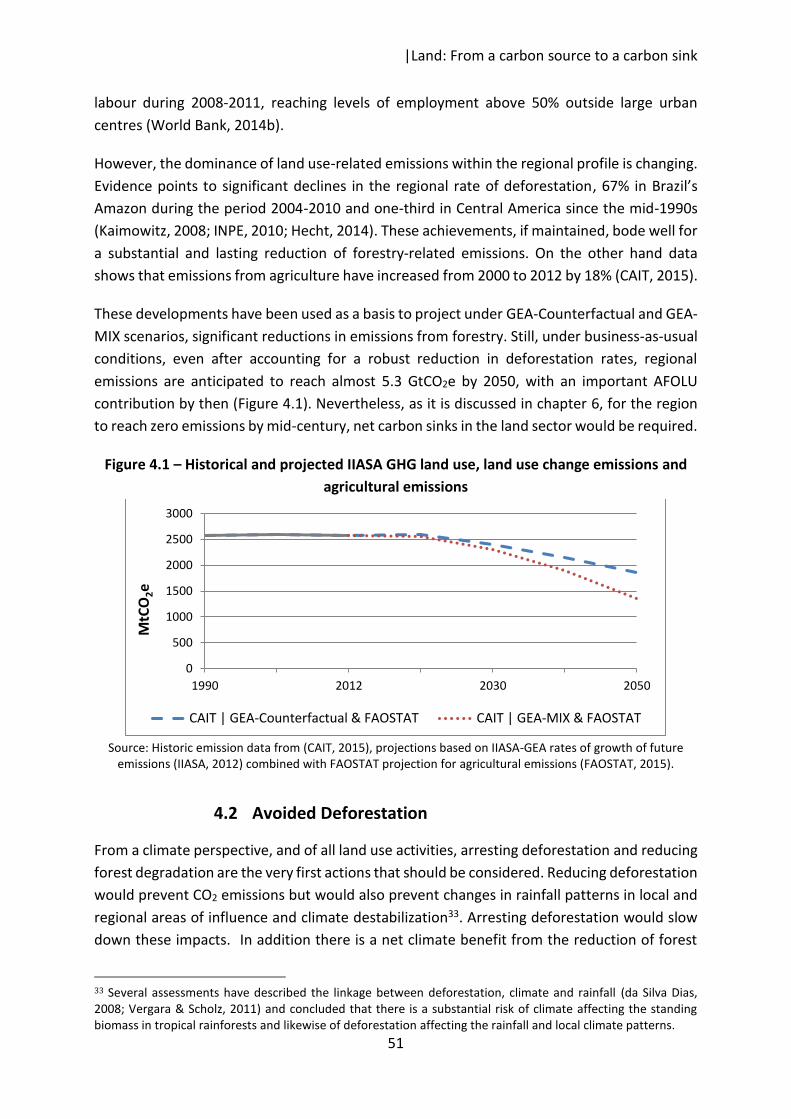
|Land: From a carbon source to a carbon sink
51
labour during 2008-2011, reaching levels of employment above 50% outside large urban centres (World Bank, 2014b).
However, the dominance of land use-related emissions within the regional profile is changing. Evidence points to significant declines in the regional rate of deforestation, 67% in Brazil’s Amazon during the period 2004-2010 and one-third in Central America since the mid-1990s (Kaimowitz, 2008; INPE, 2010; Hecht, 2014). These achievements, if maintained, bode well for a substantial and lasting reduction of forestry-related emissions. On the other hand data shows that emissions from agriculture have increased from 2000 to 2012 by 18% (CAIT, 2015).
These developments have been used as a basis to project under GEA-Counterfactual and GEA-MIX scenarios, significant reductions in emissions from forestry. Still, under business-as-usual conditions, even after accounting for a robust reduction in deforestation rates, regional emissions are anticipated to reach almost 5.3 GtCO2e by 2050, with an important AFOLU contribution by then (Figure 4.1). Nevertheless, as it is discussed in chapter 6, for the region to reach zero emissions by mid-century, net carbon sinks in the land sector would be required.
Figure 4.1 – Historical and projected IIASA GHG land use, land use change emissions and agricultural emissions
Source: Historic emission data from (CAIT, 2015), projections based on IIASA-GEA rates of growth of future
emissions (IIASA, 2012) combined with FAOSTAT projection for agricultural emissions (FAOSTAT, 2015).
4.2 Avoided Deforestation
From a climate perspective, and of all land use activities, arresting deforestation and reducing forest degradation are the very first actions that should be considered. Reducing deforestation would prevent CO2 emissions but would also prevent changes in rainfall patterns in local and regional areas of influence and climate destabilization33. Arresting deforestation would slow down these impacts. In addition there is a net climate benefit from the reduction of forest
33 Several assessments have described the linkage between deforestation, climate and rainfall (da Silva Dias, 2008; Vergara & Scholz, 2011) and concluded that there is a substantial risk of climate affecting the standing biomass in tropical rainforests and likewise of deforestation affecting the rainfall and local climate patterns.
0
500
1000
1500
2000
2500
3000
1990 2012 2030 2050
MtC
O2e
CAIT | GEA-Counterfactual & FAOSTAT CAIT | GEA-MIX & FAOSTAT
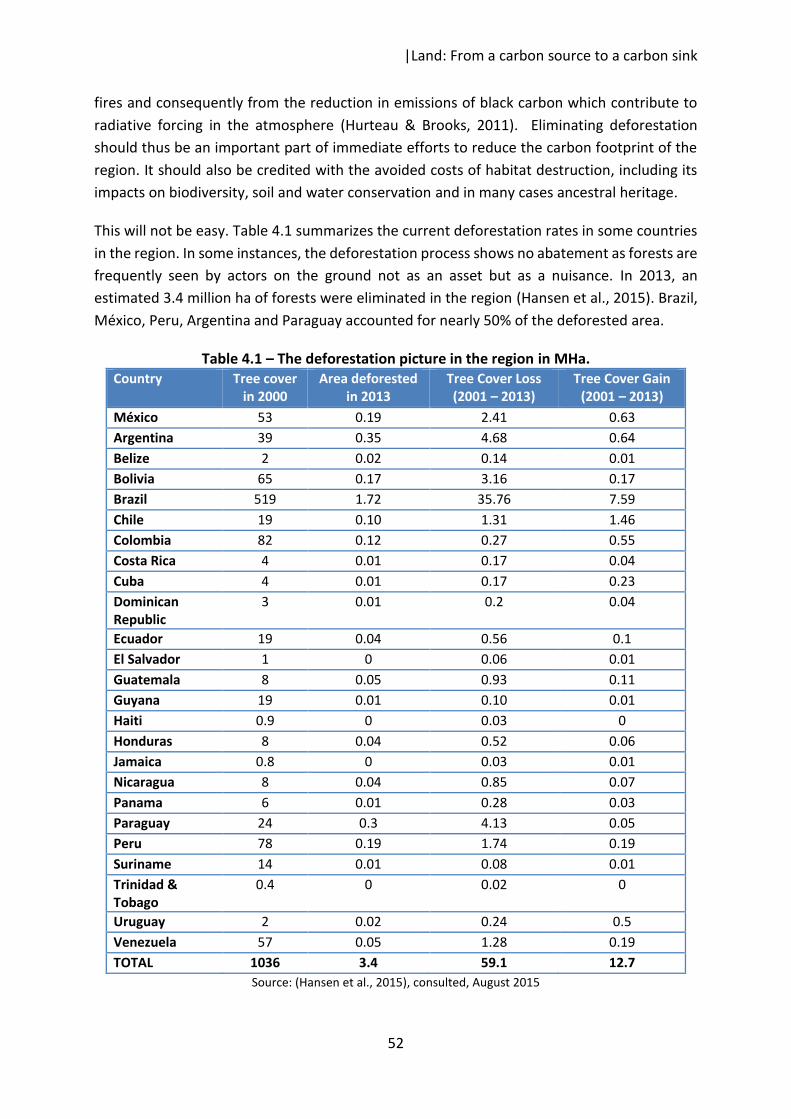
|Land: From a carbon source to a carbon sink
52
fires and consequently from the reduction in emissions of black carbon which contribute to radiative forcing in the atmosphere (Hurteau & Brooks, 2011). Eliminating deforestation should thus be an important part of immediate efforts to reduce the carbon footprint of the region. It should also be credited with the avoided costs of habitat destruction, including its impacts on biodiversity, soil and water conservation and in many cases ancestral heritage.
This will not be easy. Table 4.1 summarizes the current deforestation rates in some countries in the region. In some instances, the deforestation process shows no abatement as forests are frequently seen by actors on the ground not as an asset but as a nuisance. In 2013, an estimated 3.4 million ha of forests were eliminated in the region (Hansen et al., 2015). Brazil, México, Peru, Argentina and Paraguay accounted for nearly 50% of the deforested area.
Table 4.1 – The deforestation picture in the region in MHa. Country Tree cover
in 2000 Area deforested
in 2013 Tree Cover Loss (2001 – 2013)
Tree Cover Gain (2001 – 2013)
México 53 0.19 2.41 0.63 Argentina 39 0.35 4.68 0.64 Belize 2 0.02 0.14 0.01 Bolivia 65 0.17 3.16 0.17 Brazil 519 1.72 35.76 7.59 Chile 19 0.10 1.31 1.46 Colombia 82 0.12 0.27 0.55 Costa Rica 4 0.01 0.17 0.04 Cuba 4 0.01 0.17 0.23 Dominican Republic
3 0.01 0.2 0.04
Ecuador 19 0.04 0.56 0.1 El Salvador 1 0 0.06 0.01 Guatemala 8 0.05 0.93 0.11 Guyana 19 0.01 0.10 0.01 Haiti 0.9 0 0.03 0 Honduras 8 0.04 0.52 0.06 Jamaica 0.8 0 0.03 0.01 Nicaragua 8 0.04 0.85 0.07 Panama 6 0.01 0.28 0.03 Paraguay 24 0.3 4.13 0.05 Peru 78 0.19 1.74 0.19 Suriname 14 0.01 0.08 0.01 Trinidad & Tobago
0.4 0 0.02 0
Uruguay 2 0.02 0.24 0.5 Venezuela 57 0.05 1.28 0.19 TOTAL 1036 3.4 59.1 12.7
Source: (Hansen et al., 2015), consulted, August 2015
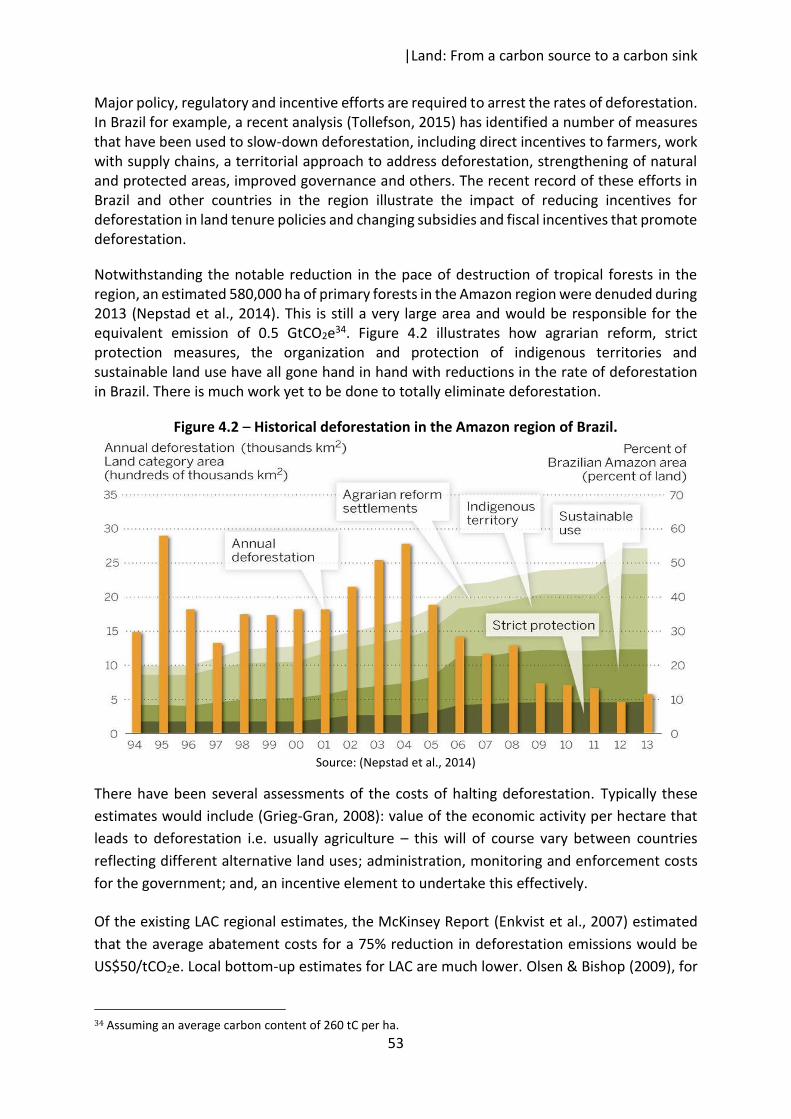
|Land: From a carbon source to a carbon sink
53
Major policy, regulatory and incentive efforts are required to arrest the rates of deforestation. In Brazil for example, a recent analysis (Tollefson, 2015) has identified a number of measures that have been used to slow-down deforestation, including direct incentives to farmers, work with supply chains, a territorial approach to address deforestation, strengthening of natural and protected areas, improved governance and others. The recent record of these efforts in Brazil and other countries in the region illustrate the impact of reducing incentives for deforestation in land tenure policies and changing subsidies and fiscal incentives that promote deforestation.
Notwithstanding the notable reduction in the pace of destruction of tropical forests in the region, an estimated 580,000 ha of primary forests in the Amazon region were denuded during 2013 (Nepstad et al., 2014). This is still a very large area and would be responsible for the equivalent emission of 0.5 GtCO2e34. Figure 4.2 illustrates how agrarian reform, strict protection measures, the organization and protection of indigenous territories and sustainable land use have all gone hand in hand with reductions in the rate of deforestation in Brazil. There is much work yet to be done to totally eliminate deforestation.
Figure 4.2 – Historical deforestation in the Amazon region of Brazil.
Source: (Nepstad et al., 2014)
There have been several assessments of the costs of halting deforestation. Typically these estimates would include (Grieg-Gran, 2008): value of the economic activity per hectare that leads to deforestation i.e. usually agriculture – this will of course vary between countries reflecting different alternative land uses; administration, monitoring and enforcement costs for the government; and, an incentive element to undertake this effectively.
Of the existing LAC regional estimates, the McKinsey Report (Enkvist et al., 2007) estimated that the average abatement costs for a 75% reduction in deforestation emissions would be US$50/tCO2e. Local bottom-up estimates for LAC are much lower. Olsen & Bishop (2009), for
34 Assuming an average carbon content of 260 tC per ha.
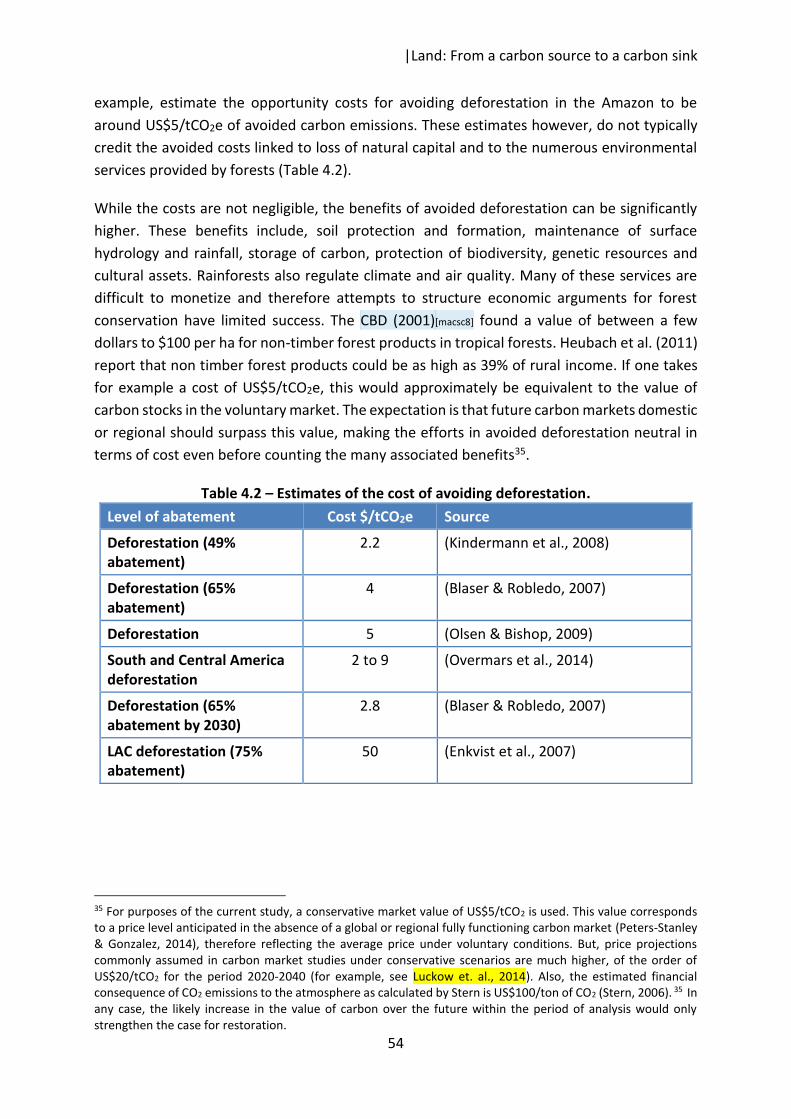
|Land: From a carbon source to a carbon sink
54
example, estimate the opportunity costs for avoiding deforestation in the Amazon to be around US$5/tCO2e of avoided carbon emissions. These estimates however, do not typically credit the avoided costs linked to loss of natural capital and to the numerous environmental services provided by forests (Table 4.2).
While the costs are not negligible, the benefits of avoided deforestation can be significantly higher. These benefits include, soil protection and formation, maintenance of surface hydrology and rainfall, storage of carbon, protection of biodiversity, genetic resources and cultural assets. Rainforests also regulate climate and air quality. Many of these services are difficult to monetize and therefore attempts to structure economic arguments for forest conservation have limited success. The CBD (2001)[macsc8] found a value of between a few dollars to $100 per ha for non-timber forest products in tropical forests. Heubach et al. (2011) report that non timber forest products could be as high as 39% of rural income. If one takes for example a cost of US$5/tCO2e, this would approximately be equivalent to the value of carbon stocks in the voluntary market. The expectation is that future carbon markets domestic or regional should surpass this value, making the efforts in avoided deforestation neutral in terms of cost even before counting the many associated benefits35.
Table 4.2 – Estimates of the cost of avoiding deforestation. Level of abatement Cost $/tCO2e Source
Deforestation (49% abatement)
2.2 (Kindermann et al., 2008)
Deforestation (65% abatement)
4 (Blaser & Robledo, 2007)
Deforestation 5 (Olsen & Bishop, 2009)
South and Central America deforestation
2 to 9 (Overmars et al., 2014)
Deforestation (65% abatement by 2030)
2.8 (Blaser & Robledo, 2007)
LAC deforestation (75% abatement)
50 (Enkvist et al., 2007)
35 For purposes of the current study, a conservative market value of US$5/tCO2 is used. This value corresponds to a price level anticipated in the absence of a global or regional fully functioning carbon market (Peters-Stanley & Gonzalez, 2014), therefore reflecting the average price under voluntary conditions. But, price projections commonly assumed in carbon market studies under conservative scenarios are much higher, of the order of US$20/tCO2 for the period 2020-2040 (for example, see Luckow et. al., 2014). Also, the estimated financial consequence of CO2 emissions to the atmosphere as calculated by Stern is US$100/ton of CO2 (Stern, 2006). 35 In any case, the likely increase in the value of carbon over the future within the period of analysis would only strengthen the case for restoration.
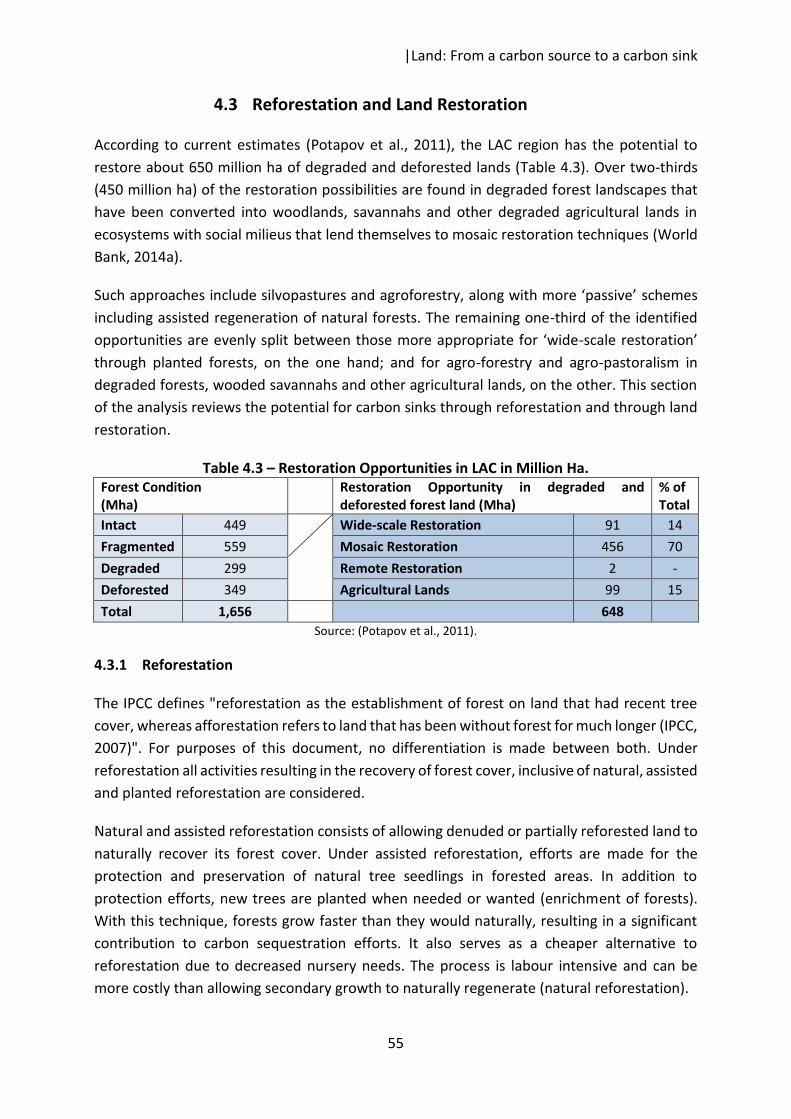
|Land: From a carbon source to a carbon sink
55
4.3 Reforestation and Land Restoration
According to current estimates (Potapov et al., 2011), the LAC region has the potential to restore about 650 million ha of degraded and deforested lands (Table 4.3). Over two-thirds (450 million ha) of the restoration possibilities are found in degraded forest landscapes that have been converted into woodlands, savannahs and other degraded agricultural lands in ecosystems with social milieus that lend themselves to mosaic restoration techniques (World Bank, 2014a).
Such approaches include silvopastures and agroforestry, along with more ‘passive’ schemes including assisted regeneration of natural forests. The remaining one-third of the identified opportunities are evenly split between those more appropriate for ‘wide-scale restoration’ through planted forests, on the one hand; and for agro-forestry and agro-pastoralism in degraded forests, wooded savannahs and other agricultural lands, on the other. This section of the analysis reviews the potential for carbon sinks through reforestation and through land restoration.
Table 4.3 – Restoration Opportunities in LAC in Million Ha. Forest Condition (Mha)
Restoration Opportunity in degraded and deforested forest land (Mha)
% of Total
Intact 449 Wide-scale Restoration 91 14 Fragmented 559 Mosaic Restoration 456 70 Degraded 299 Remote Restoration 2 - Deforested 349 Agricultural Lands 99 15 Total 1,656 648
Source: (Potapov et al., 2011).
4.3.1 Reforestation
The IPCC defines "reforestation as the establishment of forest on land that had recent tree cover, whereas afforestation refers to land that has been without forest for much longer (IPCC, 2007)". For purposes of this document, no differentiation is made between both. Under reforestation all activities resulting in the recovery of forest cover, inclusive of natural, assisted and planted reforestation are considered.
Natural and assisted reforestation consists of allowing denuded or partially reforested land to naturally recover its forest cover. Under assisted reforestation, efforts are made for the protection and preservation of natural tree seedlings in forested areas. In addition to protection efforts, new trees are planted when needed or wanted (enrichment of forests). With this technique, forests grow faster than they would naturally, resulting in a significant contribution to carbon sequestration efforts. It also serves as a cheaper alternative to reforestation due to decreased nursery needs. The process is labour intensive and can be more costly than allowing secondary growth to naturally regenerate (natural reforestation).
|Land: From a carbon source to a carbon sink
56
Planted reforestation can also be an important tool for carbon abatement. If done with local and varied species it could enhance biodiversity assets. The costs of plantation of mixed forests consisting of native species vary significantly depending on location and species used. A study in Australia estimates reforestation costs ranging from $1.8 thousand to $6.4 thousand per ha (Summers et al., 2015), other estimates range from $100 to $300 per ha in the US (Bair & Alig, 2007). The IPCC (2007) has concluded that "the mitigation costs through forestry can be quite modest (US$0.1–US$20/ metric ton carbon dioxide) in some tropical developing countries”.
There have been numerous studies of the carbon stored in the Amazon forests, Table 4.4 summarizes some of these as reported by (Nair & Garrity, 2012). Tropical forests in the amazon region can be counted to store about 260 tC per ha in undisturbed forests and between about 110-260 tC per ha, if one includes managed, logged and flooded woodlands. While Nair & Garrity (2012) report an average of 260 t C per ha, this study has selected to use a lower average and more conservative level of carbon stocks of about 160 tC, which corresponds to the value reported by Alegre and co-workers (Alegre et al., 2000) for tropical forests.
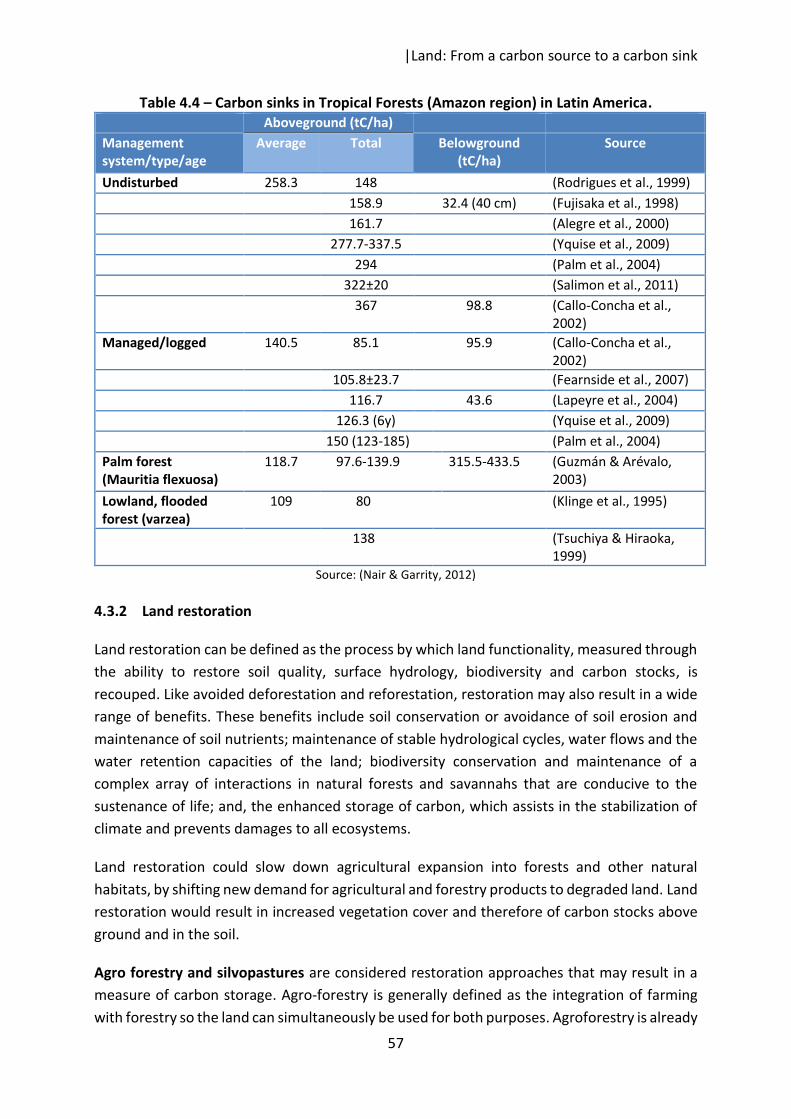
|Land: From a carbon source to a carbon sink
57
Table 4.4 – Carbon sinks in Tropical Forests (Amazon region) in Latin America. Aboveground (tC/ha) Management system/type/age
Average Total Belowground (tC/ha)
Source
Undisturbed 258.3 148 (Rodrigues et al., 1999) 158.9 32.4 (40 cm) (Fujisaka et al., 1998) 161.7 (Alegre et al., 2000) 277.7-337.5 (Yquise et al., 2009) 294 (Palm et al., 2004) 322±20 (Salimon et al., 2011) 367 98.8 (Callo-Concha et al.,
2002) Managed/logged 140.5 85.1 95.9 (Callo-Concha et al.,
2002) 105.8±23.7 (Fearnside et al., 2007) 116.7 43.6 (Lapeyre et al., 2004) 126.3 (6y) (Yquise et al., 2009) 150 (123-185) (Palm et al., 2004) Palm forest (Mauritia flexuosa)
118.7 97.6-139.9 315.5-433.5 (Guzmán & Arévalo, 2003)
Lowland, flooded forest (varzea)
109 80 (Klinge et al., 1995)
138 (Tsuchiya & Hiraoka, 1999)
Source: (Nair & Garrity, 2012)
4.3.2 Land restoration
Land restoration can be defined as the process by which land functionality, measured through the ability to restore soil quality, surface hydrology, biodiversity and carbon stocks, is recouped. Like avoided deforestation and reforestation, restoration may also result in a wide range of benefits. These benefits include soil conservation or avoidance of soil erosion and maintenance of soil nutrients; maintenance of stable hydrological cycles, water flows and the water retention capacities of the land; biodiversity conservation and maintenance of a complex array of interactions in natural forests and savannahs that are conducive to the sustenance of life; and, the enhanced storage of carbon, which assists in the stabilization of climate and prevents damages to all ecosystems.
Land restoration could slow down agricultural expansion into forests and other natural habitats, by shifting new demand for agricultural and forestry products to degraded land. Land restoration would result in increased vegetation cover and therefore of carbon stocks above ground and in the soil.
Agro forestry and silvopastures are considered restoration approaches that may result in a measure of carbon storage. Agro-forestry is generally defined as the integration of farming with forestry so the land can simultaneously be used for both purposes. Agroforestry is already

|Land: From a carbon source to a carbon sink
58
widely used in Latin America. It has been estimated that between 200 and 360 million ha are under current agroforestry systems in the region (Nair & Garrity, 2012), which is by itself an indication of their financial viability. Still, the potential for additional deployment of agroforestry schemes is large. Similarly, silvopastures combine farming and cattle ranching. This landscape combination approach has been shown to result besides net carbon storage in benefits in terms of yields and soil and water conservation (Jianbo, 2006).
From a climate perspective, the total C storage in the aboveground and belowground biomass in agro-forestry and silvopasture systems is generally much higher than in land use without trees. Sustainable agroforestry and silvopasture practices have been shown to result in net storage of carbon in vegetation in the range of 6 to 63 tC/ha, depending on the biome conditions and compared to degraded lands (Montagnini & Nair, 2004).
For example, taking better care of rangelands and pastures would result in substantial carbon storing in soils: e.g. adjusting the number of animals and adding legumes in the system (Henderson et al., 2015). Estimates in México (Soto-Pinto et al., 2010) place carbon storage in agroforestry systems at 50 tC per ha. At the average of this range, 35 tC per ha, agroforestry becomes a very important tool for carbon storage. Table 4.5 below summarizes reported rates of carbon storage in selected tropical agroforestry and silvopasture systems as well as the calculated net carbon storage to result from the implementation of the 20x2036 initiative in Latin America. Most estimates are in the range of 2 to 6 tC per ha per year.
There seems to be ample evidence of the potential of restoration and reforestation efforts to increase the carbon stocks on land. A combination of reforestation and land restoration efforts of sufficient size could neutralize all emissions from land use activities in the region. For example, a 300 million ha effort (100 million ha in reforestation and 200 million ha in restoration) would result in accumulation of sinks of about 0.9 GtCO2e per year (Table 4.8).
In summary, restoration efforts could be essential for the achievement of a low carbon development path in the region, and an important strategic support for maintaining and
36 Initiative 20x20 is a country-led effort to initiate restoration of 20 million ha by 2020 in Latin America. The initiative has three activities: 1. Political drive. A robust dialogue with Ministers of Agriculture and Environment in the region, seeking to: a) secure a sustainable policy and regulatory framework for land restoration and avoided deforestation, and b) incorporate national programs and activities to support restoration and avoided deforestation efforts in the region, of about 20 million hectares by 2020. 2. Analysis. An assessment of societal benefits (avoided costs and economic benefits) from land restoration and avoided deforestation efforts that can be used to guide sound policies and investments on the ground. 3. Financial Drive. Securing commitments of the order of US$670 million for the financing of land restoration efforts in the region from impact investment funds, and a similar amount from bilateral and multilateral funding, for sound agroforestry, agro-pastoral and agricultural practices, reforestation and avoided deforestation.
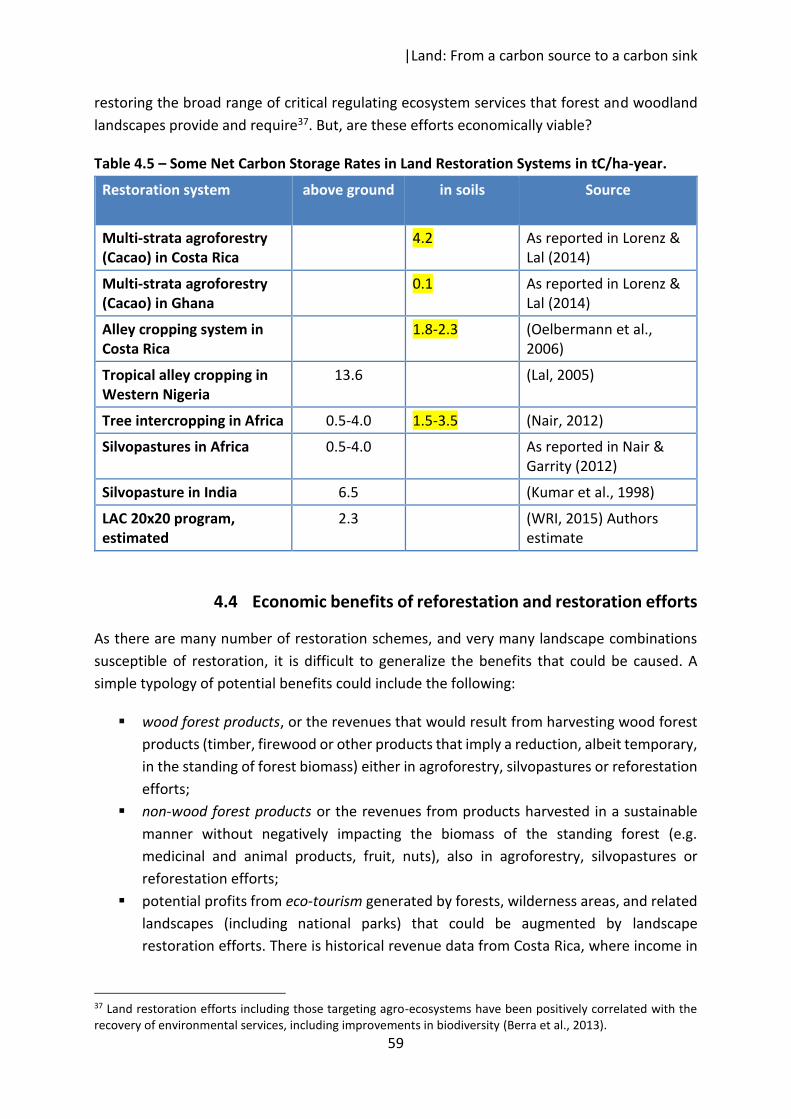
|Land: From a carbon source to a carbon sink
59
restoring the broad range of critical regulating ecosystem services that forest and woodland landscapes provide and require37. But, are these efforts economically viable?
Table 4.5 – Some Net Carbon Storage Rates in Land Restoration Systems in tC/ha-year.
Restoration system above ground
in soils
Source
Multi-strata agroforestry (Cacao) in Costa Rica
4.2 As reported in Lorenz & Lal (2014)
Multi-strata agroforestry (Cacao) in Ghana
0.1 As reported in Lorenz & Lal (2014)
Alley cropping system in Costa Rica
1.8-2.3 (Oelbermann et al., 2006)
Tropical alley cropping in Western Nigeria
13.6 (Lal, 2005)
Tree intercropping in Africa 0.5-4.0 1.5-3.5 (Nair, 2012)
Silvopastures in Africa 0.5-4.0 As reported in Nair & Garrity (2012)
Silvopasture in India 6.5 (Kumar et al., 1998)
LAC 20x20 program, estimated
2.3 (WRI, 2015) Authors estimate
4.4 Economic benefits of reforestation and restoration efforts
As there are many number of restoration schemes, and very many landscape combinations susceptible of restoration, it is difficult to generalize the benefits that could be caused. A simple typology of potential benefits could include the following:
� wood forest products, or the revenues that would result from harvesting wood forest products (timber, firewood or other products that imply a reduction, albeit temporary, in the standing of forest biomass) either in agroforestry, silvopastures or reforestation efforts;
� non-wood forest products or the revenues from products harvested in a sustainable manner without negatively impacting the biomass of the standing forest (e.g. medicinal and animal products, fruit, nuts), also in agroforestry, silvopastures or reforestation efforts;
� potential profits from eco-tourism generated by forests, wilderness areas, and related landscapes (including national parks) that could be augmented by landscape restoration efforts. There is historical revenue data from Costa Rica, where income in
37 Land restoration efforts including those targeting agro-ecosystems have been positively correlated with the recovery of environmental services, including improvements in biodiversity (Berra et al., 2013).

|Land: From a carbon source to a carbon sink
60
ecotourism has been linked to reforestation programs; these revenues are related to tourism in protected areas instead of degraded land;
� profits from agricultural production or animal agriculture that could be enhanced by landscape restoration efforts. In particular, expected increased revenues from agricultural production as a result of agroforestry and silvopasture efforts on degraded agricultural lands;
� avoided annual food security costs representing the potential decline in food security premiums as agricultural production increases and becomes more stable within any given and unchanged agricultural frontier in non-degraded landscapes. That is, improved sustainable food production should result in a reduction of food insecurity, which is partially captured by the market value of food security premiums in the region’s crop insurance market;
� monetized gains in carbon storage as a result of restoration. This economic benefit of the carbon captured and stored could be enhanced as a result of the increase in vegetation cover stemming from reforestation, assisted regeneration, agroforestry, silvopastures and avoided deforestation as reflected in carbon markets.
Substantial data, methodological and other limitations make it difficult to attempt an estimate that captures and incorporates other benefits of landscape restoration such as improvements in, or avoided losses of, biodiversity, soil and water protection, climate resilience and others.
A number of reforestation case studies in the region are available in the literature. In many cases, reforestation has been shown to be financially attractive especially with monocultures, frequently of exotic species. However, more recently, a number of analysis has shown the potential returns of reforestation with native species and through the use of multiple species. A few successful examples of reforestation, using native species, are cited below:
x 15000 ha of commercial plantations with native and exotic species in Chinchina (Colombia), and 15,000 ha of sustainable management of native forests are reported to have resulted in adequate financial returns capable of guaranteeing the long -term sustainability of the investments; (Acosta & Muñoz, 2005) http://www.fao.org/forestry/12077-0e9dadce99f02474339f5e5c17abe1fc1.pdf;
x 1000 ha are now reforested with native species in the Mixteca region of Mexico. Relying on native tree species, terraced agricultural techniques, and containment ditches for preventing hillside erosion in the Mixteca region, the Center for Integral Small Farmer Development CEDICAM has not only reforested more than 1000 hectares (with 1 million trees), but helped create more economic opportunity and even gender equality within the region. CEDICAM’ s founder, Jose Jesus Santos was awarded the Goldman Environmental Prize in 2008; http://www.cedicam-ac.org/;
x Beginning in the early 1980s, residents of Gaviotas in Colombia, led by Paolo Lugari, began planting Caribbean pine trees, and ensuring their survival in the acidic soil with

|Land: From a carbon source to a carbon sink
61
the application of mycorrhizal fungus to their roots. Villagers have successfully reforested about 8,000 ha and created economic opportunities. The increased forest cover has had an effect of weather patterns in the area: rainfall has increased by 10%; http://www.friendsofgaviotas.org/;
x In Brazil, the ITPA (Instituto Terra de Preservacao Ambiental) forest restoration project has reforested about 950 hectares of formerly barren hillside with native Atlantic forest species such as Araguaney and fast-growing Angico Artemisiana – some of which are almost 10 metres tall; http://www.itpa.org.br/;
x There are many other projects, some supported through the Bio Carbon Fund and other through the voluntary market. Details can be consulted in http://www.biocarbonfund-isfl.org;
There is likewise a growing body of evidence of the market bet on agroforestry and silvopastures on degraded land in Latin America. Investments in land restoration through these schemes are being developed at a rapid pace in the region. This reflects that the economic arguments for restoration have been internalized by the private sector. Under Initiative 20x20 for example, 8 private impact investors have earmarked US$670 million for investments in restoration. Numerous projects are already under implementation. For example, just to site a few:
x the CIPAV project in Colombia which seeks the restoration of land under extensive cattle ranching through the implementation of silvopastures, which has had substantial economic success (http://www.cipav.org.co);
x the Peru-Cocoa Alliance (http://www.carana.com/), which seeks to restore land through agroforestry schemes with small landholders in Peru also with remarkable success;
x the management of grasslands and pasture in the Chilean and Argentinian Patagonia developed through a network of in 400 million acres of temperate grasslands support a unique biological and cultural heritage, and provide many important ecosystems services including clean air and water, forage for livestock, carbon sequestration, and habitat for wildlife (http://www.fao.org/nr/sustainability/grassland/best-practices/projects);
x the development of a program to re-invigorate small and medium scale farms in the Matagalpa region of Nicaragua that have been severely affected by rust and the effects of global warming (http://www.moringapartnership.com/jt_files/). Many others could be listed.
4.5 Low Carbon Agriculture
Unsustainable practices in agriculture in the region have led to reduction of carbon in vegetation and in soils. Fires, expansion of the production frontier, degradation of agriculture
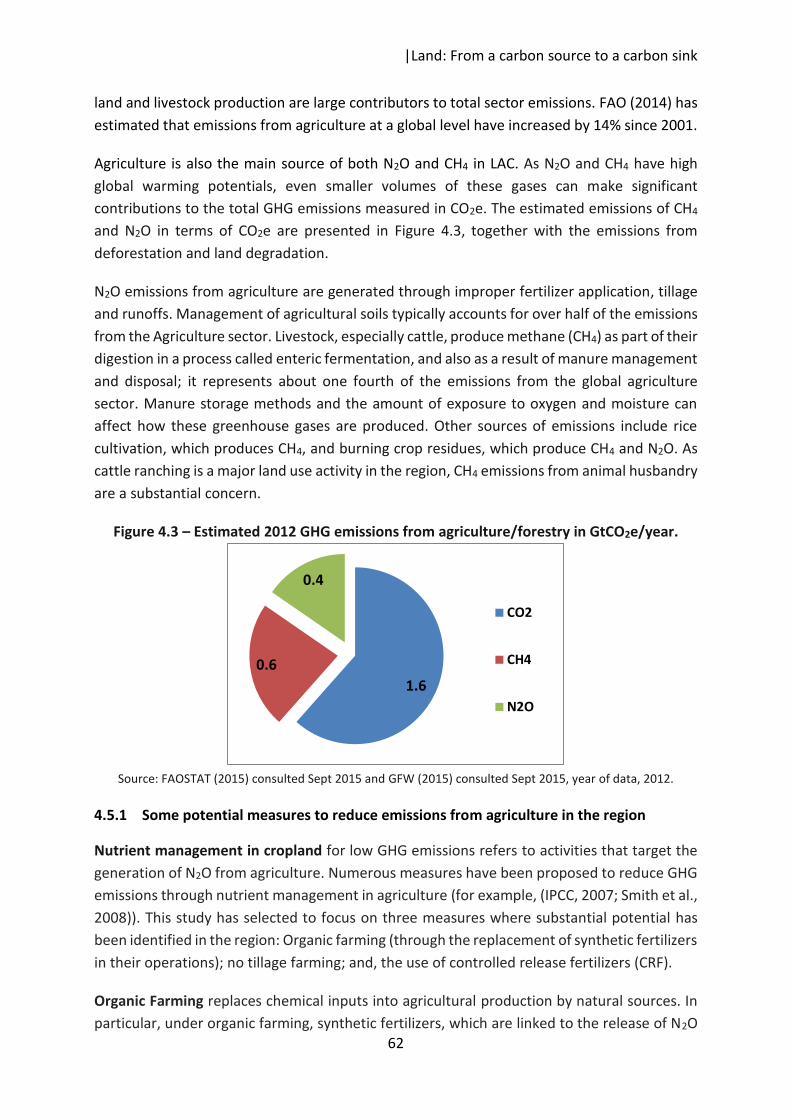
|Land: From a carbon source to a carbon sink
62
land and livestock production are large contributors to total sector emissions. FAO (2014) has estimated that emissions from agriculture at a global level have increased by 14% since 2001.
Agriculture is also the main source of both N2O and CH4 in LAC. As N2O and CH4 have high global warming potentials, even smaller volumes of these gases can make significant contributions to the total GHG emissions measured in CO2e. The estimated emissions of CH4 and N2O in terms of CO2e are presented in Figure 4.3, together with the emissions from deforestation and land degradation.
N2O emissions from agriculture are generated through improper fertilizer application, tillage and runoffs. Management of agricultural soils typically accounts for over half of the emissions from the Agriculture sector. Livestock, especially cattle, produce methane (CH4) as part of their digestion in a process called enteric fermentation, and also as a result of manure management and disposal; it represents about one fourth of the emissions from the global agriculture sector. Manure storage methods and the amount of exposure to oxygen and moisture can affect how these greenhouse gases are produced. Other sources of emissions include rice cultivation, which produces CH4, and burning crop residues, which produce CH4 and N2O. As cattle ranching is a major land use activity in the region, CH4 emissions from animal husbandry are a substantial concern.
Figure 4.3 – Estimated 2012 GHG emissions from agriculture/forestry in GtCO2e/year.
Source: FAOSTAT (2015) consulted Sept 2015 and GFW (2015) consulted Sept 2015, year of data, 2012.
4.5.1 Some potential measures to reduce emissions from agriculture in the region
Nutrient management in cropland for low GHG emissions refers to activities that target the generation of N2O from agriculture. Numerous measures have been proposed to reduce GHG emissions through nutrient management in agriculture (for example, (IPCC, 2007; Smith et al., 2008)). This study has selected to focus on three measures where substantial potential has been identified in the region: Organic farming (through the replacement of synthetic fertilizers in their operations); no tillage farming; and, the use of controlled release fertilizers (CRF).
Organic Farming replaces chemical inputs into agricultural production by natural sources. In particular, under organic farming, synthetic fertilizers, which are linked to the release of N2O
1.60.6
0.4
CO2
CH4
N2O
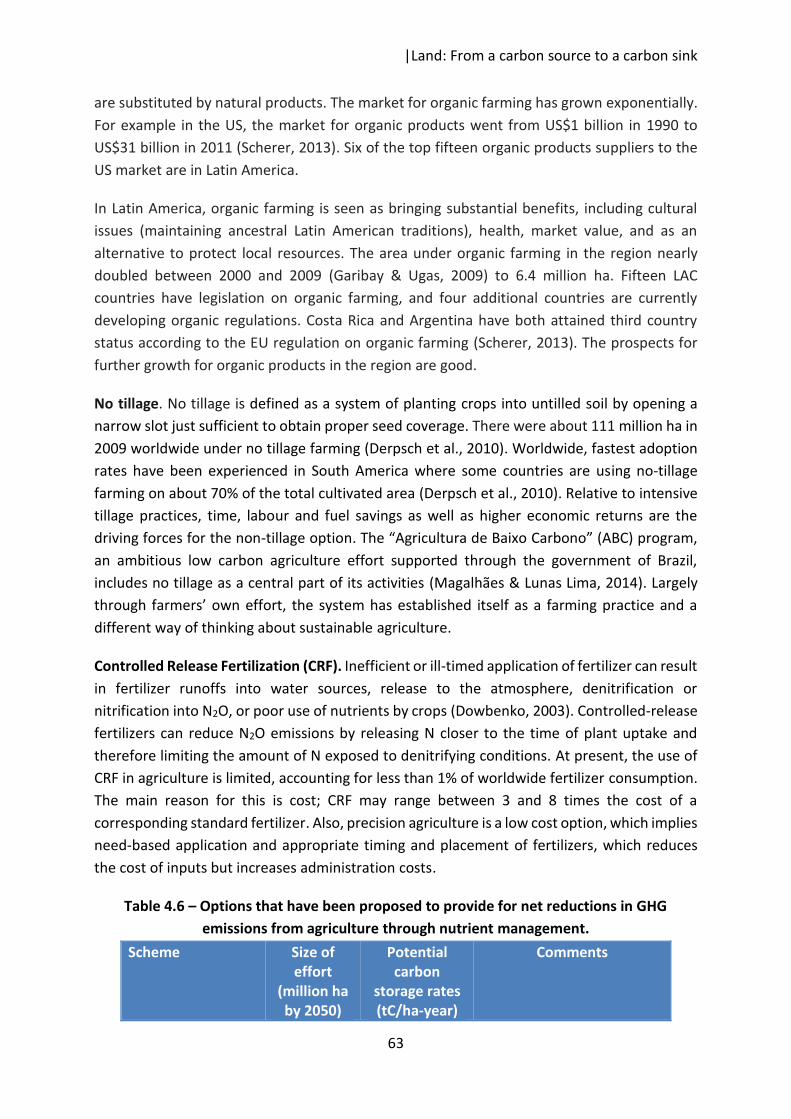
|Land: From a carbon source to a carbon sink
63
are substituted by natural products. The market for organic farming has grown exponentially. For example in the US, the market for organic products went from US$1 billion in 1990 to US$31 billion in 2011 (Scherer, 2013). Six of the top fifteen organic products suppliers to the US market are in Latin America.
In Latin America, organic farming is seen as bringing substantial benefits, including cultural issues (maintaining ancestral Latin American traditions), health, market value, and as an alternative to protect local resources. The area under organic farming in the region nearly doubled between 2000 and 2009 (Garibay & Ugas, 2009) to 6.4 million ha. Fifteen LAC countries have legislation on organic farming, and four additional countries are currently developing organic regulations. Costa Rica and Argentina have both attained third country status according to the EU regulation on organic farming (Scherer, 2013). The prospects for further growth for organic products in the region are good.
No tillage. No tillage is defined as a system of planting crops into untilled soil by opening a narrow slot just sufficient to obtain proper seed coverage. There were about 111 million ha in 2009 worldwide under no tillage farming (Derpsch et al., 2010). Worldwide, fastest adoption rates have been experienced in South America where some countries are using no-tillage farming on about 70% of the total cultivated area (Derpsch et al., 2010). Relative to intensive tillage practices, time, labour and fuel savings as well as higher economic returns are the driving forces for the non-tillage option. The “Agricultura de Baixo Carbono” (ABC) program, an ambitious low carbon agriculture effort supported through the government of Brazil, includes no tillage as a central part of its activities (Magalhães & Lunas Lima, 2014). Largely through farmers’ own effort, the system has established itself as a farming practice and a different way of thinking about sustainable agriculture.
Controlled Release Fertilization (CRF). Inefficient or ill-timed application of fertilizer can result in fertilizer runoffs into water sources, release to the atmosphere, denitrification or nitrification into N2O, or poor use of nutrients by crops (Dowbenko, 2003). Controlled-release fertilizers can reduce N2O emissions by releasing N closer to the time of plant uptake and therefore limiting the amount of N exposed to denitrifying conditions. At present, the use of CRF in agriculture is limited, accounting for less than 1% of worldwide fertilizer consumption. The main reason for this is cost; CRF may range between 3 and 8 times the cost of a corresponding standard fertilizer. Also, precision agriculture is a low cost option, which implies need-based application and appropriate timing and placement of fertilizers, which reduces the cost of inputs but increases administration costs.
Table 4.6 – Options that have been proposed to provide for net reductions in GHG emissions from agriculture through nutrient management.
Scheme Size of effort
(million ha by 2050)
Potential carbon
storage rates (tC/ha-year)
Comments
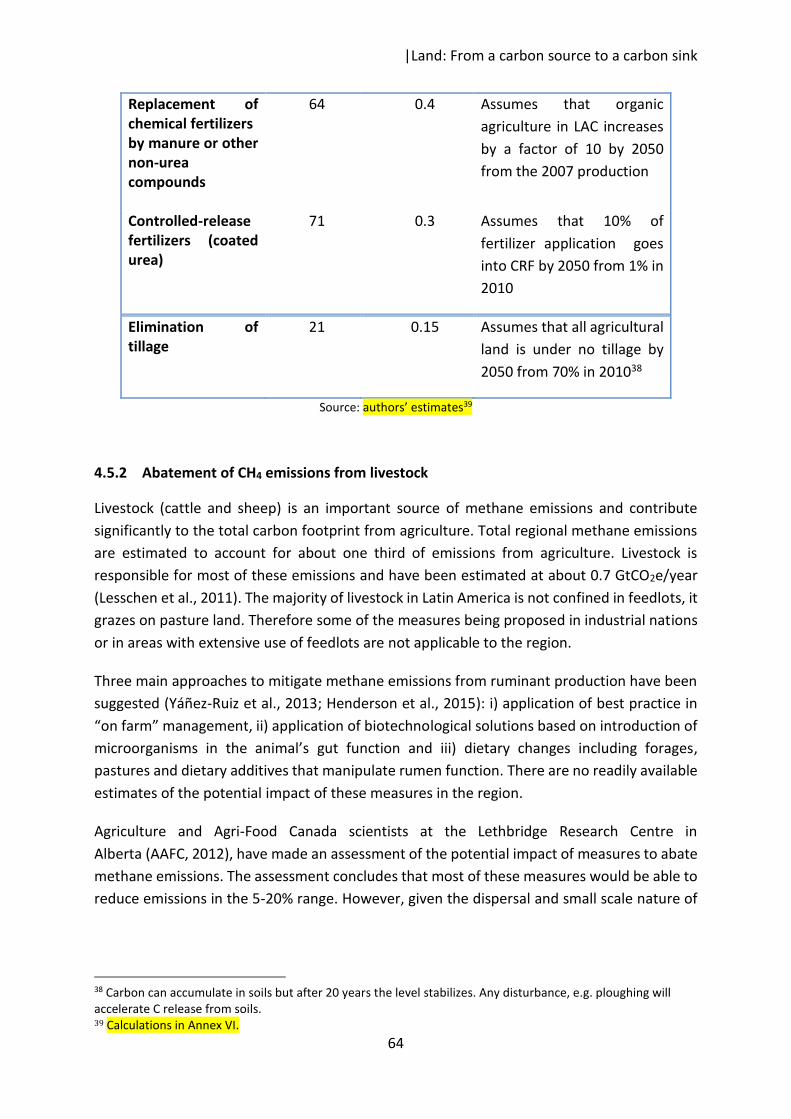
|Land: From a carbon source to a carbon sink
64
Replacement of chemical fertilizers by manure or other non-urea compounds
64 0.4 Assumes that organic agriculture in LAC increases by a factor of 10 by 2050 from the 2007 production
Controlled-release fertilizers (coated urea)
71 0.3 Assumes that 10% of fertilizer application goes into CRF by 2050 from 1% in 2010
Elimination of tillage
21 0.15
Assumes that all agricultural land is under no tillage by 2050 from 70% in 201038
Source: authors’ estimates39
4.5.2 Abatement of CH4 emissions from livestock
Livestock (cattle and sheep) is an important source of methane emissions and contribute significantly to the total carbon footprint from agriculture. Total regional methane emissions are estimated to account for about one third of emissions from agriculture. Livestock is responsible for most of these emissions and have been estimated at about 0.7 GtCO2e/year (Lesschen et al., 2011). The majority of livestock in Latin America is not confined in feedlots, it grazes on pasture land. Therefore some of the measures being proposed in industrial nations or in areas with extensive use of feedlots are not applicable to the region.
Three main approaches to mitigate methane emissions from ruminant production have been suggested (Yáñez-Ruiz et al., 2013; Henderson et al., 2015): i) application of best practice in “on farm” management, ii) application of biotechnological solutions based on introduction of microorganisms in the animal’s gut function and iii) dietary changes including forages, pastures and dietary additives that manipulate rumen function. There are no readily available estimates of the potential impact of these measures in the region.
Agriculture and Agri-Food Canada scientists at the Lethbridge Research Centre in Alberta (AAFC, 2012), have made an assessment of the potential impact of measures to abate methane emissions. The assessment concludes that most of these measures would be able to reduce emissions in the 5-20% range. However, given the dispersal and small scale nature of
38 Carbon can accumulate in soils but after 20 years the level stabilizes. Any disturbance, e.g. ploughing will accelerate C release from soils. 39 Calculations in Annex VI.

|Land: From a carbon source to a carbon sink
65
most of the livestock operations in the region, it will be difficult to translate these findings in context of conditions in the region.
Of all these measures, improved nutrition is the option that seems to be more readily available to reduce methane emissions per unit of output by increasing weight gain and milk production. Improved nutrition could also reduce methane emissions per unit of digestible energy consumed. Providing key supplements in a block of molasses / urea is a technique that could be used to reduce the production of methane directly, increasing performance. Currently, the implementation of this technique is limited by the requirements of infrastructure and manufacturing and education level of the producers (Berra et al., 2013).
Protein and mineral supplements could also be used in specific situations, to correct deficiencies in the diet. This technique has been applied mainly to grazing animals, and has successfully improved the reproductive efficiency in cattle breeding. However, its costs have limited implementation. Table 4.7 below summarizes the impacts of some measures tested in Argentina on the generation of methane by bovine livestock. For purposes of the current study, it has been assumed that methane emissions would only be reduced by 2050 though nutrient management techniques by 30% or about 0.2 GtCO2e. Application of biotechnology solutions has not been considered. Still, only major changes in diet, not limited to the region, would be required to further reduce CH4 emissions from animal husbandry.
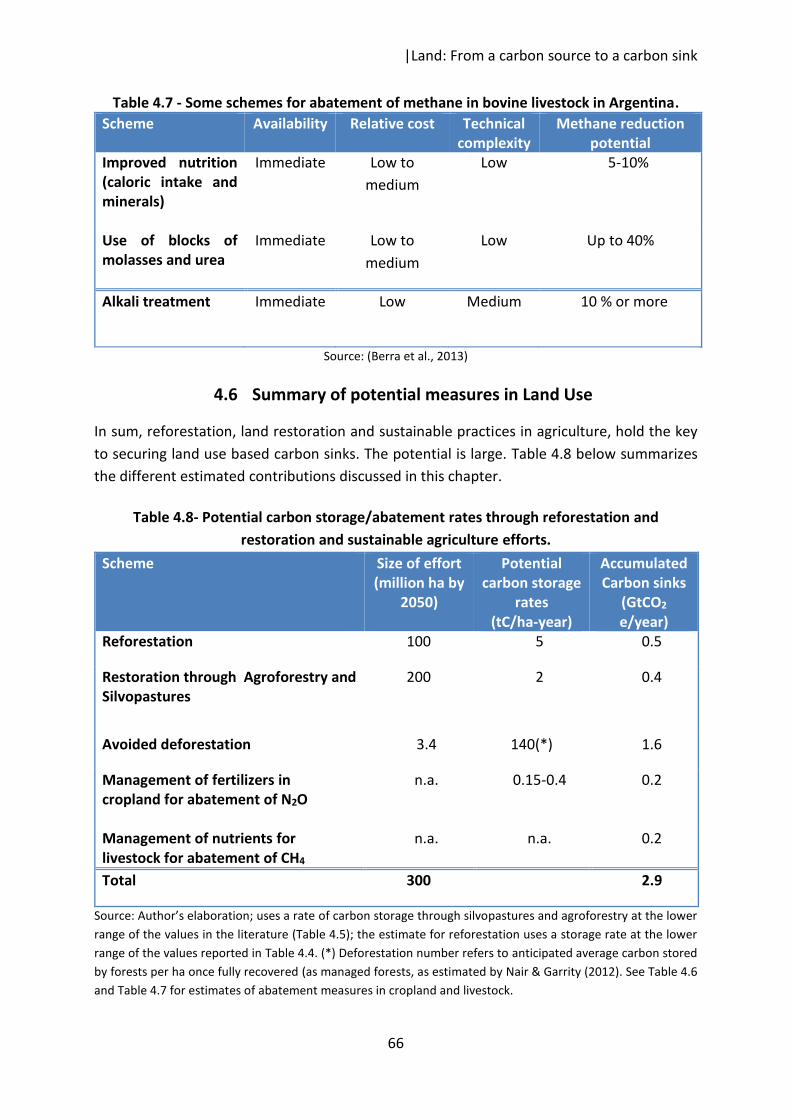
|Land: From a carbon source to a carbon sink
66
Table 4.7 - Some schemes for abatement of methane in bovine livestock in Argentina. Scheme Availability Relative cost Technical
complexity Methane reduction
potential Improved nutrition (caloric intake and minerals)
Immediate Low to medium
Low 5-10%
Use of blocks of molasses and urea
Immediate Low to medium
Low Up to 40%
Alkali treatment Immediate Low Medium 10 % or more
Source: (Berra et al., 2013)
4.6 Summary of potential measures in Land Use
In sum, reforestation, land restoration and sustainable practices in agriculture, hold the key to securing land use based carbon sinks. The potential is large. Table 4.8 below summarizes the different estimated contributions discussed in this chapter.
Table 4.8- Potential carbon storage/abatement rates through reforestation and restoration and sustainable agriculture efforts.
Scheme Size of effort (million ha by
2050)
Potential carbon storage
rates (tC/ha-year)
Accumulated Carbon sinks
(GtCO2 e/year)
Reforestation 100 5 0.5
Restoration through Agroforestry and Silvopastures
200 2 0.4
Avoided deforestation 3.4 140(*) 1.6
Management of fertilizers in cropland for abatement of N2O
n.a. 0.15-0.4 0.2
Management of nutrients for livestock for abatement of CH4
n.a. n.a. 0.2
Total 300 2.9
Source: Author’s elaboration; uses a rate of carbon storage through silvopastures and agroforestry at the lower range of the values in the literature (Table 4.5); the estimate for reforestation uses a storage rate at the lower range of the values reported in Table 4.4. (*) Deforestation number refers to anticipated average carbon stored by forests per ha once fully recovered (as managed forests, as estimated by Nair & Garrity (2012). See Table 4.6 and Table 4.7 for estimates of abatement measures in cropland and livestock.
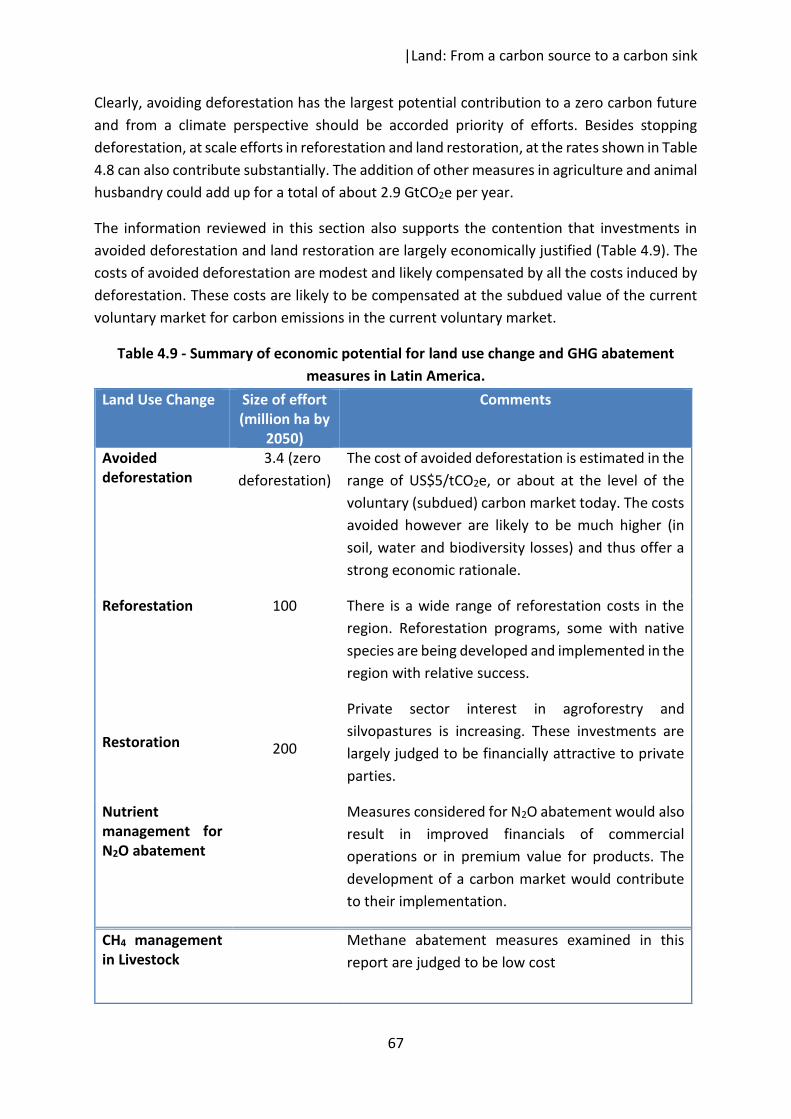
|Land: From a carbon source to a carbon sink
67
Clearly, avoiding deforestation has the largest potential contribution to a zero carbon future and from a climate perspective should be accorded priority of efforts. Besides stopping deforestation, at scale efforts in reforestation and land restoration, at the rates shown in Table 4.8 can also contribute substantially. The addition of other measures in agriculture and animal husbandry could add up for a total of about 2.9 GtCO2e per year.
The information reviewed in this section also supports the contention that investments in avoided deforestation and land restoration are largely economically justified (Table 4.9). The costs of avoided deforestation are modest and likely compensated by all the costs induced by deforestation. These costs are likely to be compensated at the subdued value of the current voluntary market for carbon emissions in the current voluntary market.
Table 4.9 - Summary of economic potential for land use change and GHG abatement measures in Latin America.
Land Use Change Size of effort (million ha by
2050)
Comments
Avoided deforestation
3.4 (zero deforestation)
The cost of avoided deforestation is estimated in the range of US$5/tCO2e, or about at the level of the voluntary (subdued) carbon market today. The costs avoided however are likely to be much higher (in soil, water and biodiversity losses) and thus offer a strong economic rationale.
Reforestation Restoration
100
200
There is a wide range of reforestation costs in the region. Reforestation programs, some with native species are being developed and implemented in the region with relative success.
Private sector interest in agroforestry and silvopastures is increasing. These investments are largely judged to be financially attractive to private parties.
Nutrient management for N2O abatement
Measures considered for N2O abatement would also result in improved financials of commercial operations or in premium value for products. The development of a carbon market would contribute to their implementation.
CH4 management in Livestock
Methane abatement measures examined in this report are judged to be low cost

|Land: From a carbon source to a carbon sink
68
Investments in land restoration through well managed reforestation, agroforestry, silvopastures and sustainable management of grasslands are increasingly being taken by the private sector in the region. This is proof of their financial attractiveness. The abatement of N2O and CH4 will require upfront costs but is now technologically feasible and likely to revert in positive rates of return even in the absence of a carbon market.
The potential for land restoration, including reforestation is even larger than the rates assumed for purposes of this analysis. This potential could be exploited concurrently or after mid-century. There is also a momentum to reduce emissions from agriculture through activities that would also bring reductions in costs or access to premium markets.
The potential for reductions in land use and land use change activities opens the possibility that the region as a whole could be a net carbon sink. In this manner, Latin America could provide a global service much needed and of much value.
|Decarbonisation of Industry
69
5 Decarbonisation of Industry
The industrial sector in Latin America is very heterogeneous. In the aggregate industrial processes together with manufacturing and construction account for about 11% of the total GHG emissions (Table 1.1). This chapter examines, based on already published material, the potential for cost effective reductions of emissions from key subsectors of the industry.
5.1 Current Situation
Energy use and GHG emissions from the industry in LAC are growing at the second fastest rate of all sectors of the regional economy (about 22% during the period 2001-2012, see Table 1.1). A relatively low energy efficiency index of industrial activity has also contributed to the magnitude of the emissions. The rapid growth has been aided by the demand for minerals and metals, and the rapid expansion of the cement, fertilizers and chemicals sub-sectors. More recently however, the industrial output has either contracted or slowed down its rate of growth in many nations in the region (Deloitte, 2015).
LAC’s industrial processes have significant variations in the energy use per unit of output depending on the vintage (age), process technology employed, quality of input new materials, and scale. As a consequence it is difficult to make generalizations of the sector. It can be said however that an important component of the growth in energy use was the demand in the international market for Latin American exports of iron ore, copper, aluminium and coal. A recent analysis has concluded that overall, energy efficiency in industry does not exceed 30% (Banerjee et al., 2012). The historical GHG emissions from industry are shown in Figure 5.2. However, it is now anticipated that during the next few years growth in demand for these raw materials will slow down.
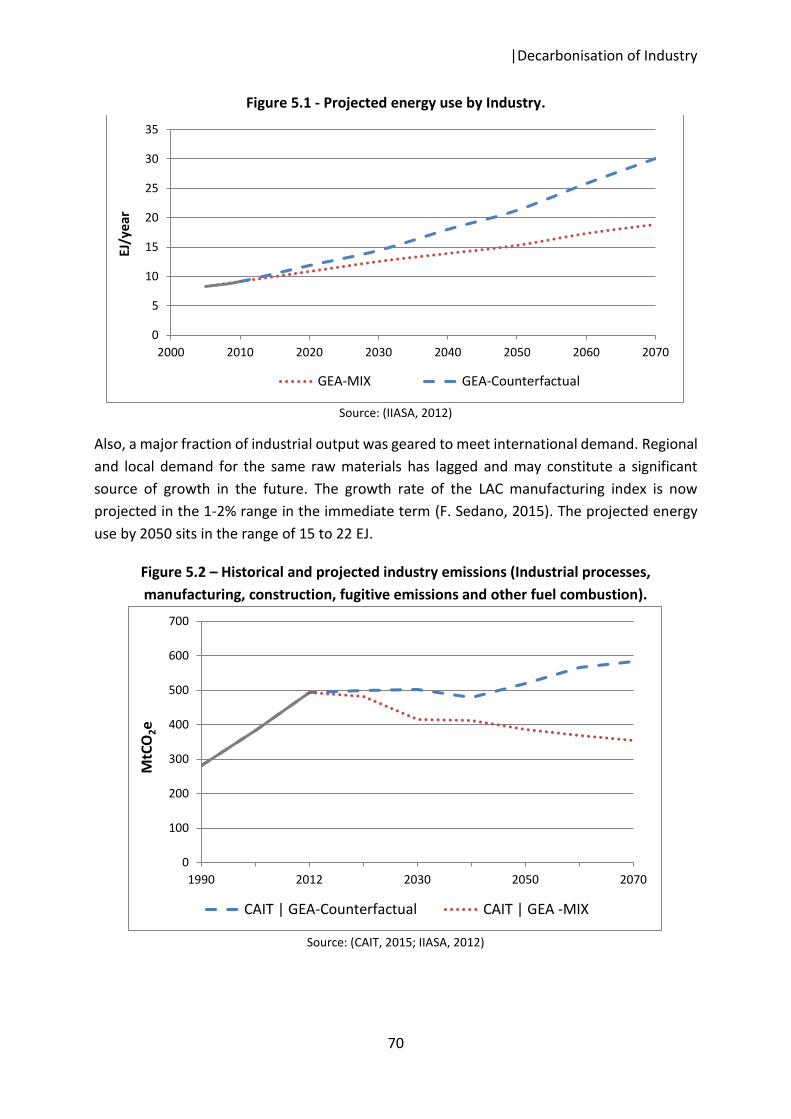
|Decarbonisation of Industry
70
Figure 5.1 - Projected energy use by Industry.
Source: (IIASA, 2012)
Also, a major fraction of industrial output was geared to meet international demand. Regional and local demand for the same raw materials has lagged and may constitute a significant source of growth in the future. The growth rate of the LAC manufacturing index is now projected in the 1-2% range in the immediate term (F. Sedano, 2015). The projected energy use by 2050 sits in the range of 15 to 22 EJ.
Figure 5.2 – Historical and projected industry emissions (Industrial processes, manufacturing, construction, fugitive emissions and other fuel combustion).
Source: (CAIT, 2015; IIASA, 2012)
0
5
10
15
20
25
30
35
2000 2010 2020 2030 2040 2050 2060 2070
EJ/y
ear
GEA-MIX GEA-Counterfactual
0
100
200
300
400
500
600
700
1990 2012 2030 2050 2070
MtC
O2e
CAIT | GEA-Counterfactual CAIT | GEA -MIX
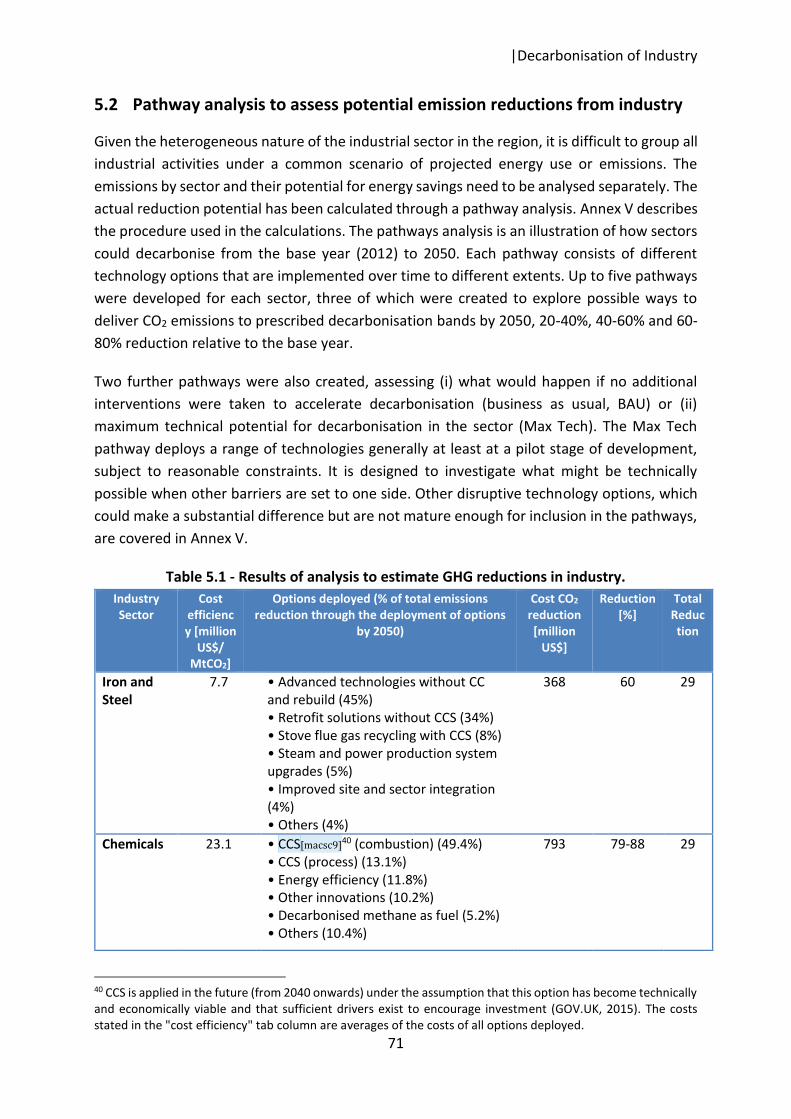
|Decarbonisation of Industry
71
5.2 Pathway analysis to assess potential emission reductions from industry
Given the heterogeneous nature of the industrial sector in the region, it is difficult to group all industrial activities under a common scenario of projected energy use or emissions. The emissions by sector and their potential for energy savings need to be analysed separately. The actual reduction potential has been calculated through a pathway analysis. Annex V describes the procedure used in the calculations. The pathways analysis is an illustration of how sectors could decarbonise from the base year (2012) to 2050. Each pathway consists of different technology options that are implemented over time to different extents. Up to five pathways were developed for each sector, three of which were created to explore possible ways to deliver CO2 emissions to prescribed decarbonisation bands by 2050, 20-40%, 40-60% and 60-80% reduction relative to the base year.
Two further pathways were also created, assessing (i) what would happen if no additional interventions were taken to accelerate decarbonisation (business as usual, BAU) or (ii) maximum technical potential for decarbonisation in the sector (Max Tech). The Max Tech pathway deploys a range of technologies generally at least at a pilot stage of development, subject to reasonable constraints. It is designed to investigate what might be technically possible when other barriers are set to one side. Other disruptive technology options, which could make a substantial difference but are not mature enough for inclusion in the pathways, are covered in Annex V.
Table 5.1 - Results of analysis to estimate GHG reductions in industry. Industry Sector
Cost efficiency [million
US$/ MtCO2]
Options deployed (% of total emissions reduction through the deployment of options
by 2050)
Cost CO2 reduction [million
US$]
Reduction [%]
Total Reduction
Iron and Steel
7.7 • Advanced technologies without CC and rebuild (45%) • Retrofit solutions without CCS (34%) • Stove flue gas recycling with CCS (8%) • Steam and power production system upgrades (5%) • Improved site and sector integration (4%) • Others (4%)
368 60 29
Chemicals 23.1 • CCS[macsc9]40 (combustion) (49.4%) • CCS (process) (13.1%) • Energy efficiency (11.8%) • Other innovations (10.2%) • Decarbonised methane as fuel (5.2%) • Others (10.4%)
793 79-88 29
40 CCS is applied in the future (from 2040 onwards) under the assumption that this option has become technically and economically viable and that sufficient drivers exist to encourage investment (GOV.UK, 2015). The costs stated in the "cost efficiency" tab column are averages of the costs of all options deployed.
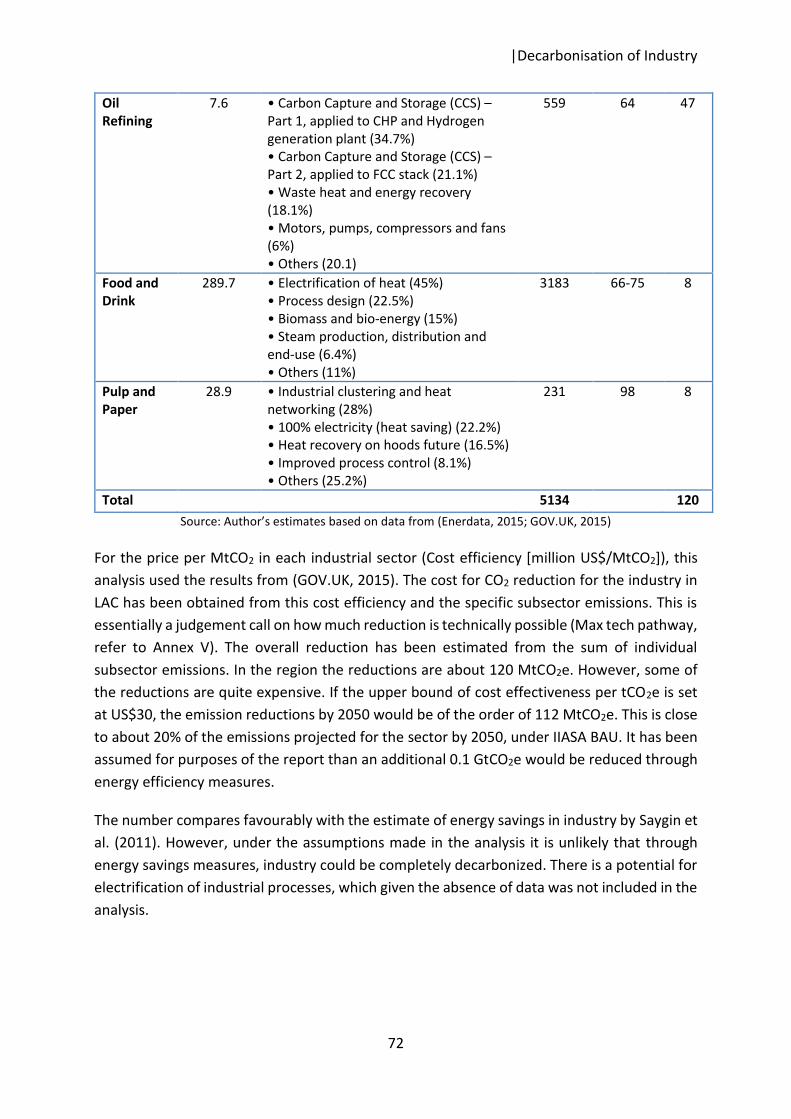
|Decarbonisation of Industry
72
Oil Refining
7.6 • Carbon Capture and Storage (CCS) – Part 1, applied to CHP and Hydrogen generation plant (34.7%) • Carbon Capture and Storage (CCS) – Part 2, applied to FCC stack (21.1%) • Waste heat and energy recovery (18.1%) • Motors, pumps, compressors and fans (6%) • Others (20.1)
559 64 47
Food and Drink
289.7 • Electrification of heat (45%) • Process design (22.5%) • Biomass and bio-energy (15%) • Steam production, distribution and end-use (6.4%) • Others (11%)
3183 66-75 8
Pulp and Paper
28.9 • Industrial clustering and heat networking (28%) • 100% electricity (heat saving) (22.2%) • Heat recovery on hoods future (16.5%) • Improved process control (8.1%) • Others (25.2%)
231 98 8
Total 5134 120 Source: Author’s estimates based on data from (Enerdata, 2015; GOV.UK, 2015)
For the price per MtCO2 in each industrial sector (Cost efficiency [million US$/MtCO2]), this analysis used the results from (GOV.UK, 2015). The cost for CO2 reduction for the industry in LAC has been obtained from this cost efficiency and the specific subsector emissions. This is essentially a judgement call on how much reduction is technically possible (Max tech pathway, refer to Annex V). The overall reduction has been estimated from the sum of individual subsector emissions. In the region the reductions are about 120 MtCO2e. However, some of the reductions are quite expensive. If the upper bound of cost effectiveness per tCO2e is set at US$30, the emission reductions by 2050 would be of the order of 112 MtCO2e. This is close to about 20% of the emissions projected for the sector by 2050, under IIASA BAU. It has been assumed for purposes of the report than an additional 0.1 GtCO2e would be reduced through energy efficiency measures.
The number compares favourably with the estimate of energy savings in industry by Saygin et al. (2011). However, under the assumptions made in the analysis it is unlikely that through energy savings measures, industry could be completely decarbonized. There is a potential for electrification of industrial processes, which given the absence of data was not included in the analysis.
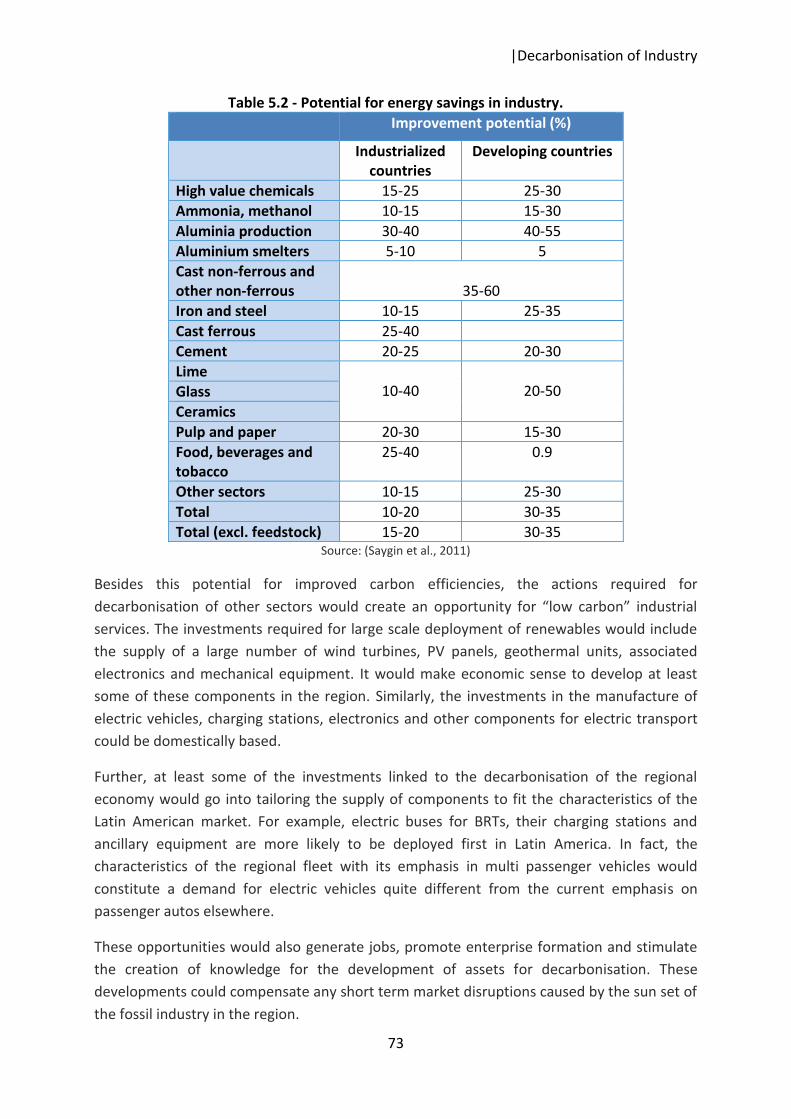
|Decarbonisation of Industry
73
Table 5.2 - Potential for energy savings in industry.
Improvement potential (%)
Industrialized countries
Developing countries
High value chemicals 15-25 25-30 Ammonia, methanol 10-15 15-30 Aluminia production 30-40 40-55 Aluminium smelters 5-10 5 Cast non-ferrous and other non-ferrous
35-60
Iron and steel 10-15 25-35 Cast ferrous 25-40 Cement 20-25 20-30 Lime
10-40
20-50 Glass Ceramics Pulp and paper 20-30 15-30 Food, beverages and tobacco
25-40 0.9
Other sectors 10-15 25-30 Total 10-20 30-35 Total (excl. feedstock) 15-20 30-35
Source: (Saygin et al., 2011)
Besides this potential for improved carbon efficiencies, the actions required for decarbonisation of other sectors would create an opportunity for “low carbon” industrial services. The investments required for large scale deployment of renewables would include the supply of a large number of wind turbines, PV panels, geothermal units, associated electronics and mechanical equipment. It would make economic sense to develop at least some of these components in the region. Similarly, the investments in the manufacture of electric vehicles, charging stations, electronics and other components for electric transport could be domestically based.
Further, at least some of the investments linked to the decarbonisation of the regional economy would go into tailoring the supply of components to fit the characteristics of the Latin American market. For example, electric buses for BRTs, their charging stations and ancillary equipment are more likely to be deployed first in Latin America. In fact, the characteristics of the regional fleet with its emphasis in multi passenger vehicles would constitute a demand for electric vehicles quite different from the current emphasis on passenger autos elsewhere.
These opportunities would also generate jobs, promote enterprise formation and stimulate the creation of knowledge for the development of assets for decarbonisation. These developments could compensate any short term market disruptions caused by the sun set of the fossil industry in the region.
|A route for Zero Carbon Emissions
74
6 A route for Zero Carbon Emissions
The route to a zero net emissions economy by mid-century, examined in this report includes the following actions: Full decarbonisation of the power sector; Mass electrification of the transport sector; Grid integration of the regional economies; Expansion of the power system to absorb the new demand by transport; Zero net deforestation; Restoration of about 300 million Ha of degraded land through a combination of natural and assisted reforestation, agroforestry and silvopastures; Reduction of emissions from agriculture through nutrient management measures; and Abatement measures in industry.
6.1 The pathway for decarbonisation of the power sector
The pathway used in the estimates is summarized in Table 6.1. The estimate uses as a starting point the IIASA-GEA BAU as described in IIASA database for a projection of emissions of the sector until 2050. It also uses its projections of power demand as described in chapter 2.
To estimate the route to full decarbonisation, the following assumptions have been made:
1. Starting around 2020 all new demand is met by renewables; that is, by a combination of the expansion of hydro capacity complemented by new wind, solar and geothermal facilities, which already have LCOEs below natural gas and coal (Figure 2.7). This assumption is justified in this report, by the competitiveness for wind, solar and geothermal and the projected grid parity for these technologies as discussed in chapter 2.
2. By 2030, all currently operated fossil fuel plants, other than gas are decommissioned; and by 2050, all existing natural gas units are also mothballed. The demand is met by corresponding additions in renewables (mostly wind, geothermal and solar complemented with the expansion of hydro) with increased participation of CSP and distributed power. One should expect by then the large scale utilization of hot spots for renewable technology development. For example, the deployment of GW-sized solar PV and CSP in the Atacama, and other high irradiance areas, as well as similar use of localized endowments for wind.
3. Grid integration is achieved by 2030 and it results in an increase in the online factor for intermittent renewables. By 2050, the market structure allows for the hydro power assets to effectively function as a regional storage capacity bringing up the online factor of the renewables to 50%. Distributed power continues to contribute to generation capacity.
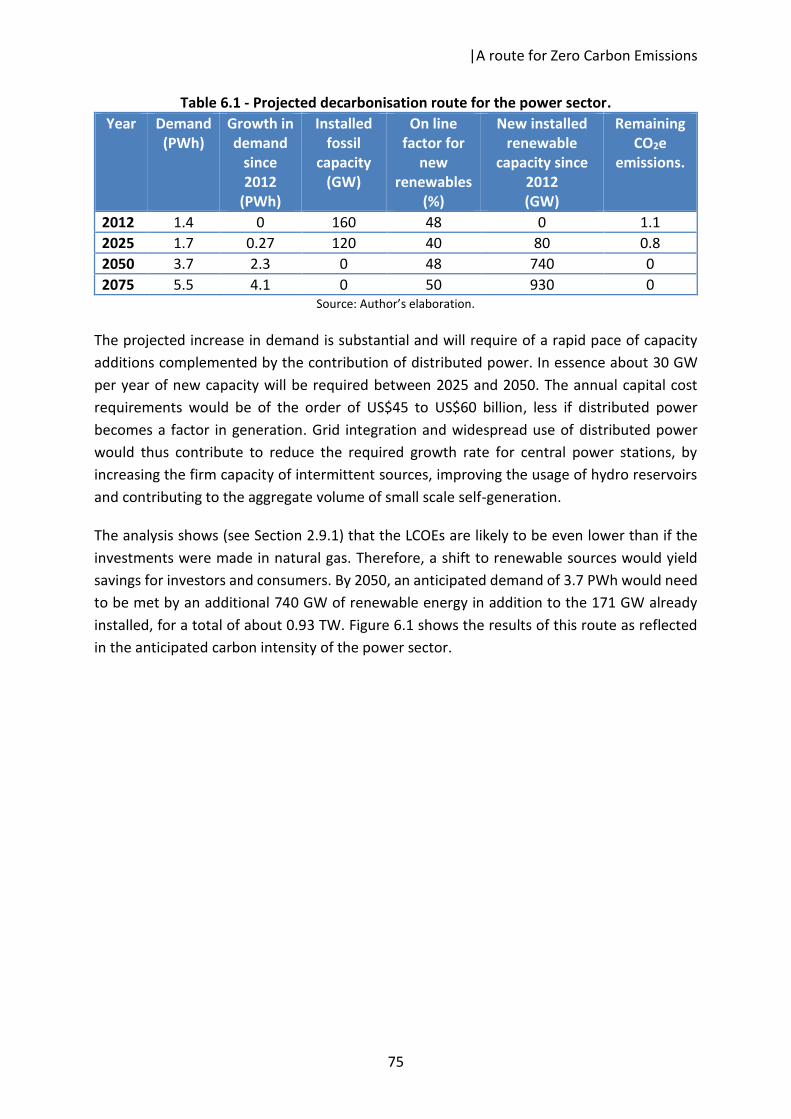
|A route for Zero Carbon Emissions
75
Table 6.1 - Projected decarbonisation route for the power sector. Year Demand
(PWh) Growth in demand
since 2012
(PWh)
Installed fossil
capacity (GW)
On line factor for
new renewables
(%)
New installed renewable
capacity since 2012 (GW)
Remaining CO2e
emissions.
2012 1.4 0 160 48 0 1.1 2025 1.7 0.27 120 40 80 0.8 2050 3.7 2.3 0 48 740 0 2075 5.5 4.1 0 50 930 0
Source: Author’s elaboration.
The projected increase in demand is substantial and will require of a rapid pace of capacity additions complemented by the contribution of distributed power. In essence about 30 GW per year of new capacity will be required between 2025 and 2050. The annual capital cost requirements would be of the order of US$45 to US$60 billion, less if distributed power becomes a factor in generation. Grid integration and widespread use of distributed power would thus contribute to reduce the required growth rate for central power stations, by increasing the firm capacity of intermittent sources, improving the usage of hydro reservoirs and contributing to the aggregate volume of small scale self-generation.
The analysis shows (see Section 2.9.1) that the LCOEs are likely to be even lower than if the investments were made in natural gas. Therefore, a shift to renewable sources would yield savings for investors and consumers. By 2050, an anticipated demand of 3.7 PWh would need to be met by an additional 740 GW of renewable energy in addition to the 171 GW already installed, for a total of about 0.93 TW. Figure 6.1 shows the results of this route as reflected in the anticipated carbon intensity of the power sector.
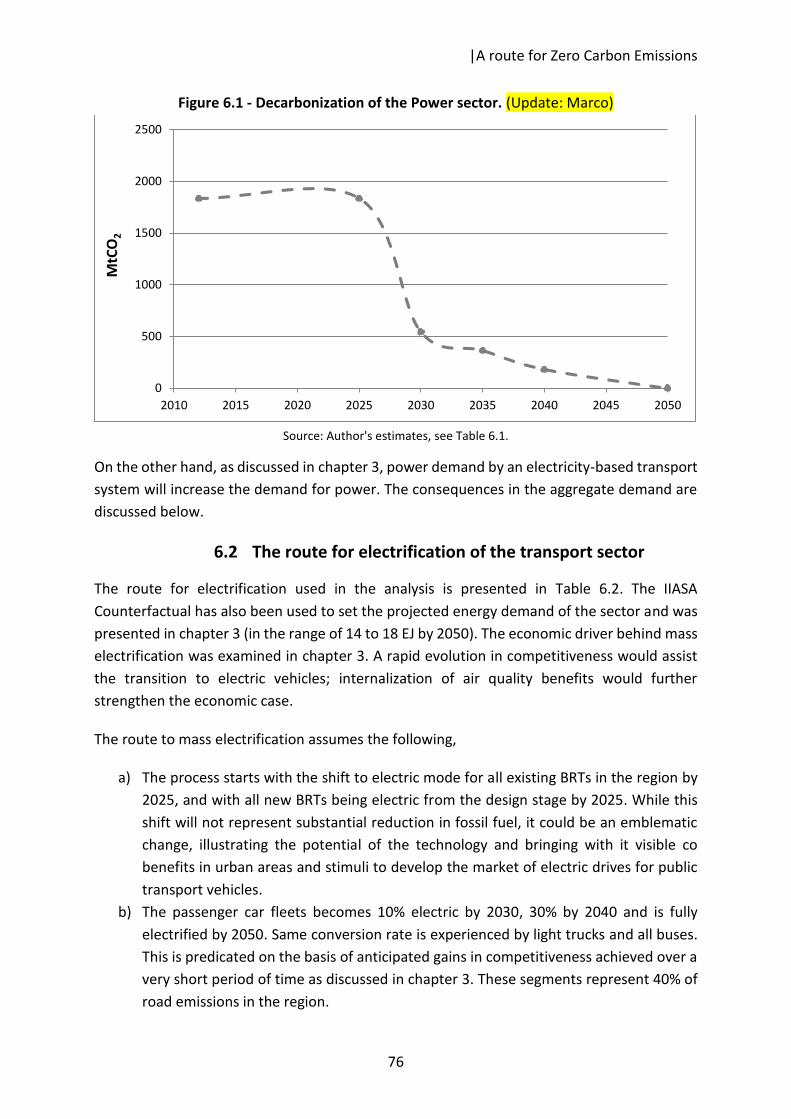
|A route for Zero Carbon Emissions
76
Figure 6.1 - Decarbonization of the Power sector. (Update: Marco)
Source: Author's estimates, see Table 6.1.
On the other hand, as discussed in chapter 3, power demand by an electricity-based transport system will increase the demand for power. The consequences in the aggregate demand are discussed below.
6.2 The route for electrification of the transport sector
The route for electrification used in the analysis is presented in Table 6.2. The IIASA Counterfactual has also been used to set the projected energy demand of the sector and was presented in chapter 3 (in the range of 14 to 18 EJ by 2050). The economic driver behind mass electrification was examined in chapter 3. A rapid evolution in competitiveness would assist the transition to electric vehicles; internalization of air quality benefits would further strengthen the economic case.
The route to mass electrification assumes the following,
a) The process starts with the shift to electric mode for all existing BRTs in the region by 2025, and with all new BRTs being electric from the design stage by 2025. While this shift will not represent substantial reduction in fossil fuel, it could be an emblematic change, illustrating the potential of the technology and bringing with it visible co benefits in urban areas and stimuli to develop the market of electric drives for public transport vehicles.
b) The passenger car fleets becomes 10% electric by 2030, 30% by 2040 and is fully electrified by 2050. Same conversion rate is experienced by light trucks and all buses. This is predicated on the basis of anticipated gains in competitiveness achieved over a very short period of time as discussed in chapter 3. These segments represent 40% of road emissions in the region.
0
500
1000
1500
2000
2500
2010 2015 2020 2025 2030 2035 2040 2045 2050
MtC
O2
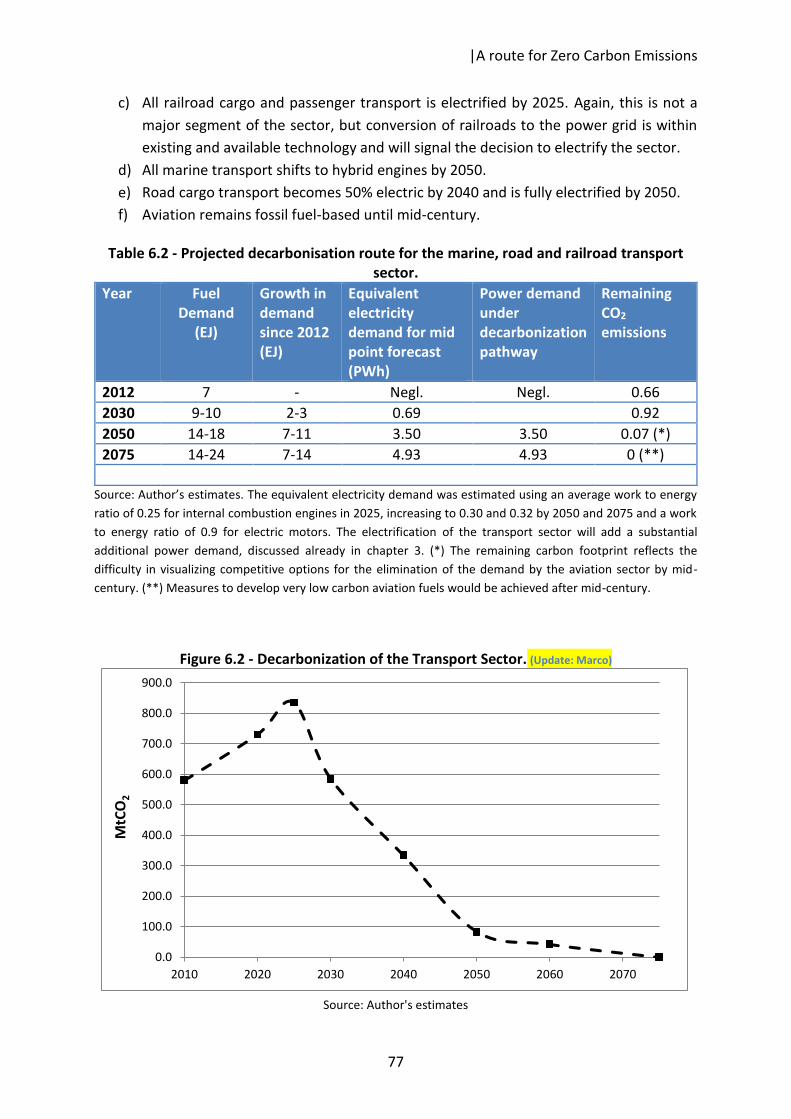
|A route for Zero Carbon Emissions
77
c) All railroad cargo and passenger transport is electrified by 2025. Again, this is not a major segment of the sector, but conversion of railroads to the power grid is within existing and available technology and will signal the decision to electrify the sector.
d) All marine transport shifts to hybrid engines by 2050. e) Road cargo transport becomes 50% electric by 2040 and is fully electrified by 2050. f) Aviation remains fossil fuel-based until mid-century.
Table 6.2 - Projected decarbonisation route for the marine, road and railroad transport sector.
Year Fuel Demand
(EJ)
Growth in demand since 2012 (EJ)
Equivalent electricity demand for mid point forecast (PWh)
Power demand under decarbonization pathway
Remaining CO2 emissions
2012 7 - Negl. Negl. 0.66 2030 9-10 2-3 0.69 0.92 2050 14-18 7-11 3.50 3.50 0.07 (*) 2075 14-24 7-14 4.93 4.93 0 (**)
Source: Author’s estimates. The equivalent electricity demand was estimated using an average work to energy ratio of 0.25 for internal combustion engines in 2025, increasing to 0.30 and 0.32 by 2050 and 2075 and a work to energy ratio of 0.9 for electric motors. The electrification of the transport sector will add a substantial additional power demand, discussed already in chapter 3. (*) The remaining carbon footprint reflects the difficulty in visualizing competitive options for the elimination of the demand by the aviation sector by mid-century. (**) Measures to develop very low carbon aviation fuels would be achieved after mid-century.
Figure 6.2 - Decarbonization of the Transport Sector. (Update: Marco)
Source: Author's estimates
0.0
100.0
200.0
300.0
400.0
500.0
600.0
700.0
800.0
900.0
2010 2020 2030 2040 2050 2060 2070
MtC
O2
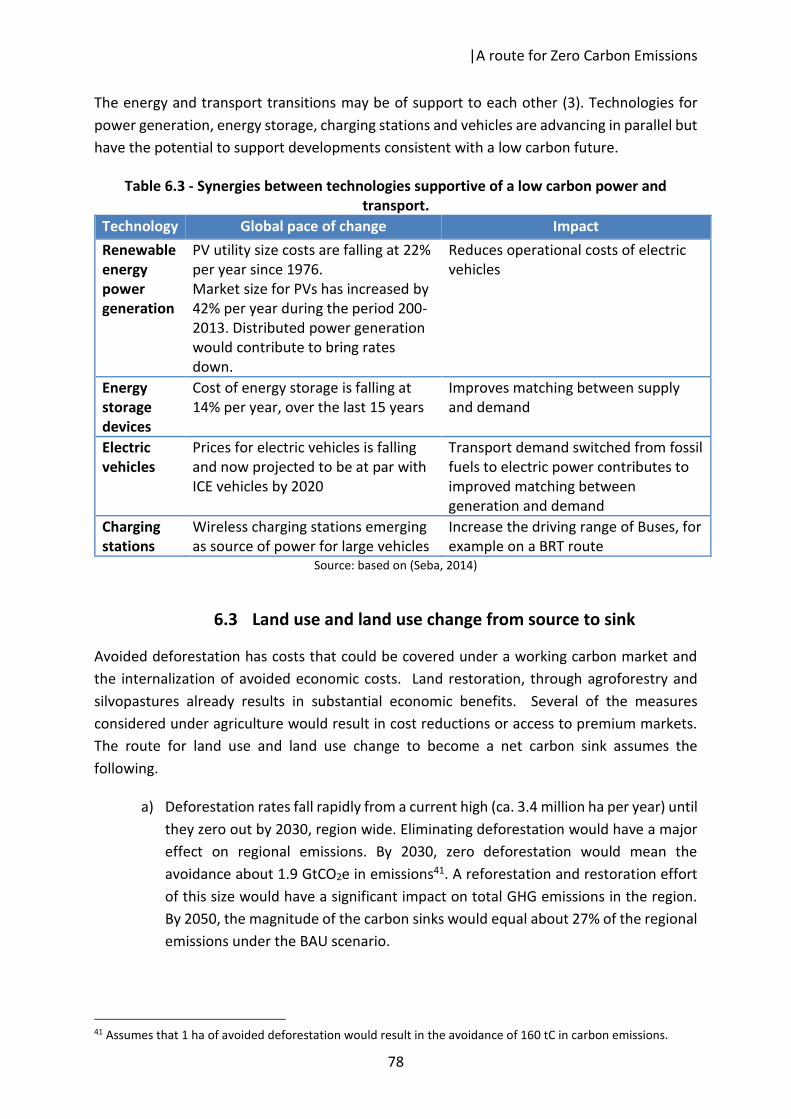
|A route for Zero Carbon Emissions
78
The energy and transport transitions may be of support to each other (3). Technologies for power generation, energy storage, charging stations and vehicles are advancing in parallel but have the potential to support developments consistent with a low carbon future.
Table 6.3 - Synergies between technologies supportive of a low carbon power and transport.
Technology Global pace of change Impact Renewable energy power generation
PV utility size costs are falling at 22% per year since 1976. Market size for PVs has increased by 42% per year during the period 200-2013. Distributed power generation would contribute to bring rates down.
Reduces operational costs of electric vehicles
Energy storage devices
Cost of energy storage is falling at 14% per year, over the last 15 years
Improves matching between supply and demand
Electric vehicles
Prices for electric vehicles is falling and now projected to be at par with ICE vehicles by 2020
Transport demand switched from fossil fuels to electric power contributes to improved matching between generation and demand
Charging stations
Wireless charging stations emerging as source of power for large vehicles
Increase the driving range of Buses, for example on a BRT route
Source: based on (Seba, 2014)
6.3 Land use and land use change from source to sink
Avoided deforestation has costs that could be covered under a working carbon market and the internalization of avoided economic costs. Land restoration, through agroforestry and silvopastures already results in substantial economic benefits. Several of the measures considered under agriculture would result in cost reductions or access to premium markets. The route for land use and land use change to become a net carbon sink assumes the following.
a) Deforestation rates fall rapidly from a current high (ca. 3.4 million ha per year) until they zero out by 2030, region wide. Eliminating deforestation would have a major effect on regional emissions. By 2030, zero deforestation would mean the avoidance about 1.9 GtCO2e in emissions41. A reforestation and restoration effort of this size would have a significant impact on total GHG emissions in the region. By 2050, the magnitude of the carbon sinks would equal about 27% of the regional emissions under the BAU scenario.
41 Assumes that 1 ha of avoided deforestation would result in the avoidance of 160 tC in carbon emissions.
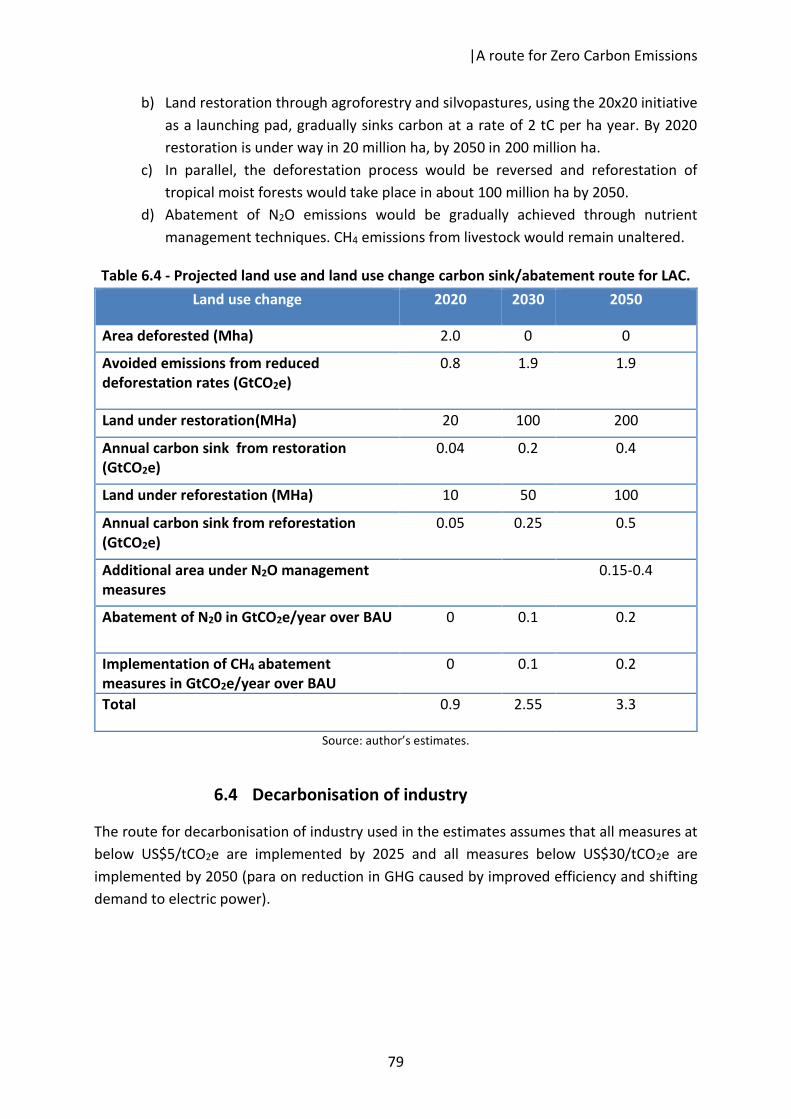
|A route for Zero Carbon Emissions
79
b) Land restoration through agroforestry and silvopastures, using the 20x20 initiative as a launching pad, gradually sinks carbon at a rate of 2 tC per ha year. By 2020 restoration is under way in 20 million ha, by 2050 in 200 million ha.
c) In parallel, the deforestation process would be reversed and reforestation of tropical moist forests would take place in about 100 million ha by 2050.
d) Abatement of N2O emissions would be gradually achieved through nutrient management techniques. CH4 emissions from livestock would remain unaltered.
Table 6.4 - Projected land use and land use change carbon sink/abatement route for LAC. Land use change 2020 2030 2050
Area deforested (Mha) 2.0 0 0
Avoided emissions from reduced deforestation rates (GtCO2e)
0.8 1.9 1.9
Land under restoration(MHa) 20 100 200
Annual carbon sink from restoration (GtCO2e)
0.04 0.2 0.4
Land under reforestation (MHa) 10 50 100
Annual carbon sink from reforestation (GtCO2e)
0.05 0.25 0.5
Additional area under N2O management measures
0.15-0.4
Abatement of N20 in GtCO2e/year over BAU 0 0.1 0.2
Implementation of CH4 abatement measures in GtCO2e/year over BAU
0 0.1 0.2
Total 0.9 2.55 3.3
Source: author’s estimates.
6.4 Decarbonisation of industry
The route for decarbonisation of industry used in the estimates assumes that all measures at below US$5/tCO2e are implemented by 2025 and all measures below US$30/tCO2e are implemented by 2050 (para on reduction in GHG caused by improved efficiency and shifting demand to electric power).
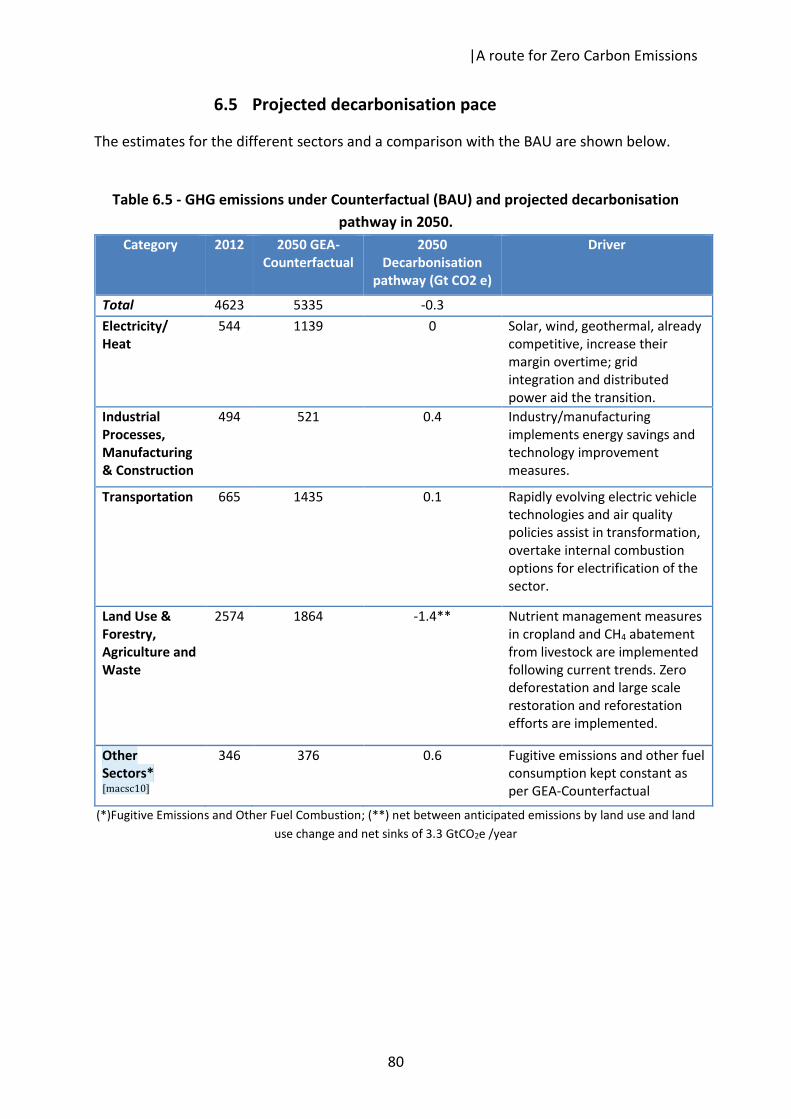
|A route for Zero Carbon Emissions
80
6.5 Projected decarbonisation pace
The estimates for the different sectors and a comparison with the BAU are shown below.
Table 6.5 - GHG emissions under Counterfactual (BAU) and projected decarbonisation
pathway in 2050. Category 2012 2050 GEA-
Counterfactual 2050
Decarbonisation pathway (Gt CO2 e)
Driver
Total 4623 5335 -0.3 Electricity/ Heat
544 1139 0 Solar, wind, geothermal, already competitive, increase their margin overtime; grid integration and distributed power aid the transition.
Industrial Processes, Manufacturing & Construction
494 521 0.4 Industry/manufacturing implements energy savings and technology improvement measures.
Transportation 665 1435 0.1 Rapidly evolving electric vehicle technologies and air quality policies assist in transformation, overtake internal combustion options for electrification of the sector.
Land Use & Forestry, Agriculture and Waste
2574 1864 -1.4** Nutrient management measures in cropland and CH4 abatement from livestock are implemented following current trends. Zero deforestation and large scale restoration and reforestation efforts are implemented.
Other Sectors*[macsc10]
346 376 0.6 Fugitive emissions and other fuel consumption kept constant as per GEA-Counterfactual
(*)Fugitive Emissions and Other Fuel Combustion; (**) net between anticipated emissions by land use and land use change and net sinks of 3.3 GtCO2e /year
|Conclusions
81
7 Conclusions
The report concludes that the current economic and technological context, as well as the emergent policy environment, are already conducive to major reductions in the carbon footprint of the region. The report also concludes that foreseeable technological developments and anticipated improvements in cost competitiveness will further support abatement measures in power, transport, land use and industry. The decarbonisation of the power sector is economically feasible, will make use of plentiful indigenous resources, would result in reductions in the cost of generation, and would contribute to energy security and avoided pollution costs. Electrification of the transport sector, would benefit from the fast pace of developments in electric vehicles, energy storage and information systems and help drive a mass shift to electric transportation with savings in costs of transport, avoid costs of air pollution and of refining and distribution of fossil fuels.
While policy frameworks and policy making are found to be more supportive of this evolution, than in the past, additional steps such as the elimination of subsidies for fossil fuels, the political will to achieve grid integration, and clear rules for distributed power are required to facilitate a fast transition of the power sector. For transport, substantial barriers remain including the pervasive use of fossil fuel subsidies, the lack of internalization of the avoided costs of air pollution caused by the use of electric vehicle and sunset provisions to ease the reduction, and the consequences of the eventual elimination of refining, transport and distribution of fossil fuels, including natural gas.
Significant recent gains in reducing deforestation rates illustrate the potential to change the dynamics of land use change. Achieving zero net deforestation will have an immediate effect on carbon emissions. Major impacts are also anticipated from efforts to reforest and restore land. There are however substantial barriers to secure these sinks. Deforestation continues unimpeded in many parts of the region where the basis factors driving deforestation, poverty and the inability to internalize the value of forests have not changed. The incorporation of well-known nutrient management options and methane abatement measures in animal husbandry will also support reduction of emissions from agriculture. A pathway analysis for emission reductions from industry concludes that deployment of best available technology would cause a reduction of emissions in the sector.

|Conclusions
82
The measures reviewed in this report have the potential to drive LAC toward a zero carbon economy, largely on the basis of sound economic principles and with substantial co-benefits, albeit not all, easy to monetize. Achieving this goal however will depend on the ability to navigate and address the substantial barriers built over time by business as usual behaviours and policies. Still, from all perspectives, the region sits in on an advantageous pole position to complete this journey.
|References
83
References Replace citations below with original citations AFTER reference list is complete: IPCC, 2014: Climate Change 2014: Synthesis Report. Contribution of Working Groups I, II and
III to the Fifth Assessment Report of the Intergovernmental Panel on Climate Change [Core Writing Team, R.K. Pachauri and L.A. Meyer (eds.)]. IPCC, Geneva, Switzerland, 151 pp.
IPCC, 2007. “Climate Change (2007): The Physical Science Basis.” In Contribution of Working
Group I to the Fourth Assessment Report of the Intergovernmental Panel on Climate Change. Cambridge: Cambridge University Press.
Riahi, K., F. Dentener, D. Gielen, A. Grubler, J. Jewell, Z. Klimont, V. Krey, D. Mccollum, S.
Pachauri, S. Rao, B. van Ruijven, D.P. van Vuuren, and C. Wilson, 2011: Energy pathways for sustainable development. Global Energy Assessment: Toward a Sustainable Future, Cambridge University Press.
IIASA - Riahi, K., F. Dentener, D. Gielen, A. Grubler, J. Jewell, Z. Klimont, V. Krey, D. McCollum,
S. Pachauri, S. Rao, B. van Ruijven, D. P. van Vuuren and C. Wilson, 2012: Chapter 17 - Energy Pathways for Sustainable Development. In Global Energy Assessment - Toward a Sustainable Future, Cambridge University Press, Cambridge, UK and New York, NY, USA and the International Institute for Applied Systems Analysis, Laxenburg, Austria, pp.1203-1306. ISBN - 9781 10700 5198 hardback / ISBN - 9780 52118 2935 paperback
Hansen, M. C., P. V. Potapov, R. Moore, M. Hancher, S. A. Turubanova, A. Tyukavina, D. Thau,
S. V. Stehman, S. J. Goetz, T. R. Loveland, A. Kommareddy, A. Egorov, L. Chini, C. O. Justice, and J. R. G. Townshend. 2013. “Hansen/UMD/Google/USGS/NASA Tree Cover Loss and Gain Area.” University of Maryland, Google, USGS, and NASA. Accessed through Global Forest Watch. http://earthenginepartners.appspot.com/science-2013-global-forest.
WRI - Not published yet. “Manuscript submitted for publication” Add: IPCC, 2013. Summary for Policymakers. In: Climate Change 2013: The Physical Science Basis.
Contribution of Working Group I to the Fifth Assessment Report of the Intergovernmental Panel on Climate Change. In V. B. and P. M. M. (eds. . Stocker, T.F., D. Qin, G.-K. Plattner, M. Tignor, S.K. Allen, J. Boschung, A. Nauels, Y. Xia, ed. Cambridge University Press, Cambridge, United Kingdom and New York, NY, USA. Available at: http://www.climatechange2013.org/images/report/WG1AR5_SPM_FINAL.pdf.
--------------
AAFC (2012). Reducing methane emissions from livestock. [Online]. Alberta. Available from: http://www.agr.gc.ca/eng/science-and-innovation/science-publications-and-resources/technical-factsheets/reducing-methane-emissions-from-livestock/?id=1305058576718.
|References
84
Acosta, I. & Muñoz, H. (2005). PROCUENCA Proyecto Forestal para la Cuenca del Río Chinchiná Departmento de Caldas. [Online]. Bogotá, Colombia. Available from: http://www.fao.org/forestry/12077-0e9dadce99f02474339f5e5c17abe1fc1.pdf.
Alegre, J., Arévalo, L. & Ricse, A. (2000). Reservas de carbono y emisión de gases con diferentes sistemas de uso de la tierra en dos sitios de la Amazonía Peruana. Tibaitatá, Colombia.
ANTF (2011). Rail Freight Transportation in Brazil: Post-concessions advances and investments. [Online]. Sao Paulo, Brazil. Available from: http://www.antf.org.br/pdfs/palestra-vilaca-2011antf1205---sao-paulo---rail-and-metro---latin-america-2011---ingles.pdf.
Bair, L.S. & Alig, R.J. (2007). Regional Cost Information for Private Timberland: Convertion and Managment. DIANE Publishing.
Banerjee, R., Cong, Y., Gielen, D., Jannuzzi, G., Maréchal, F., McKane, A.T., Rosen, M.A., Es, D. van & Worrell, E. (2012). Chapter 8 - Energy End Use: Industry. In: Global Energy Assessment - Toward a Sustainable Future. [Online]. Cambridge, UK and New York, NY, USA: Cambridge University Press. Available from: http://www.iiasa.ac.at/web/home/research/Flagship-Projects/Global-Energy-Assessment/GEA_Chapter8_industry_hires.pdf.
Barbero, J.A. (2014). Transporte y energía: los desafíos del desarrollo sostenible. [Online]. Available from: http://www.uncu.edu.ar/centroasuntosglobales/upload/barbero-jose-transporte-y-energia-uncuyo-ceag-seminario-11-4-14.pdf.
Di Bella, G., Norton, L., Ntamatungiro, J., Ogawa, S., Samake, I. & Santoro, M. (2015). Energy Subsidies in Latin America and the Caribbean: Stocktaking and Policy Challenges. [Online]. Available from: https://www.imf.org/external/pubs/ft/wp/2015/wp1530.pdf.
Berlin (2013). Berlin traffic data. [Online]. Available from: http://www.stadtentwicklung.berlin.de/verkehr/politik_planung/zahlen_fakten/download/Mobility_en_Chap-1-2.pdf.
Berra, G., Finster, L., Castuma, E. & Maldonado, V. (2013). Reducción de emisiones de metano provenientes del ganado bovino. [Online]. Available from: http://www.estrucplan.com.ar/Producciones/entrega.asp?IDEntrega=3073.
BID (2015). Observatorio Regional de Transporte de Carga y Logistica del BID. [Online]. Available from: http://www.iadb.org/es/proyectos/project-information-page,1303.html?id=RG-T1897.
Blaser, J. & Robledo, C. (2007). Initial Analysis of the Mitigation Potential in the Forestry Sector. [Online]. Bern. Available from: https://unfccc.int/files/cooperation_and_support/financial_mechanism/application/pdf/blaser.pdf.
|References
85
Bloomberg (2011). Solar, Energy Smart Technologies - Research Note. [Online]. Available from: http://sun-connect-news.org/fileadmin/DATEIEN/Dateien/New/PV_and_Batteries_as_Alternative_to_Off-Grid_Diesel_Markets_-_Bloomberg_New_Energy_Dec_2011.pdf.
Bogotá (2013). Cámara de Comerico de Bogotá. [Online]. Available from: http://www.ccb.org.co/Investigaciones-Bogota-y-Region/Desarrollo-Urbano-y-Movilidad/Movilidad/Transporte-publico-y-privado.
Brander, M., Sood, A., Wylie, C., Haughton, A. & Lovell, J. (2011). Electricity-specific emission factors for grid electricity. [Online]. Available from: http://ecometrica.com/assets//Electricity-specific-emission-factors-for-grid-electricity.pdf.
BRTdata (2015). BRTdata. [Online]. 2015. Available from: BRTdata.org. [Accessed: 15 June 2015].
CAF (2011). Desarrollo Urbano y Movilidad en America Latina. [Online]. Available from: http://omu.caf.com/media/30839/desarrollourbano_y_movilidad_americalatina.pdf.
CAF (2012). Nuevas Oportunidades de Interconexión Eléctrica en América Latina. [Online]. Colombia. Available from: http://publicaciones.caf.com/media/18406/oportunidades-interconexion-electrica-america-latina.pdf.
CAIT (2015). Climate Analysis Indicators Tool: WRI’s Climate Data Explorer. [Online]. Washington, DC. Available from: http://cait.wri.org/. [Accessed: 1 July 2015].
Callo-Concha, D., Krishnamurthy, L. & Alegre, J. (2002). Secuestro de carbono por sistemas agroforestales amazónicos. [Online]. México. Available from: http://www.redalyc.org/pdf/629/62980202.pdf.
CBD (2001). The Value of Forest Ecosystems. [Online]. Available from: https://www.cbd.int/doc/publications/cbd-ts-04.pdf.
CEPROEC (2015). Estimación del consumo de combustibles en el transporte terrestre en Ecuador. [Online]. Quito, Ecuador. Available from: http://ceproec.iaen.edu.ec/download/wps(2)/2015_05.pdf.
CleanTechnica (2015). US & Brazil Pledge Jointly To Raise Renewable Energy To 20% By 2030. [Online]. Available from: http://cleantechnica.com/2015/07/01/us-brazil-pledge-jointly-raise-renewable-energy-20-2030/.
Copenhagen (2013). Copenhagen: Preferred Transit Mode. [Online]. Available from: http://ddotdish.com/page/4/.
Curitiba (2011). Curitiba, Brazil - A model of transit oriented planning. [Online]. Available from: http://www.ecomobility.org/fileadmin/template/project_templates/ecomobility/files/Publications/Case_stories_EcoMobility_Curitiba_PDF_print.pdf.
|References
86
Deloitte (2015). Latin America Economic Outlook. [Online]. Available from: http://www2.deloitte.com/content/dam/Deloitte/global/Documents/About-Deloitte/gx-gbc-latin-america-economic-outlook-july-2015.pdf.
Derpsch, R., Friedrich, T., Kassam, A. & Hongwen, L. (2010). Current status of adoption of no-till farming in the world and some of its main benefits. [Online]. Available from: http://www.fao.org/ag/ca/CA-publications/China_IJABE.pdf.
Deutsche Bank (2015). Deutsche Bank report: Solar grid parity in a low oil price era. [Online]. Frankfurt am Main. Available from: https://www.db.com/cr/en/concrete-deutsche-bank-report-solar-grid-parity-in-a-low-oil-price-era.htm.
DNV (2010). Pathways to low carbon shipping. Abatement potential towards 2030. [Online]. Høvik, Norway. Available from: http://cleantech.cnss.no/wp-content/uploads/2011/05/2010-DNV-Pathways-to-low-carbon-shipping-Abatement-potential-towards-2030.pdf.
Dowbenko, R.E. (2003). New Fertility Product - ESN: Controlled-Release Nitrogen for Enhanced Nitrogen Efficiency and Improved Environmental Safety. [Online]. Available from: http://www.umanitoba.ca/faculties/afs/MAC_proceedings/proceedings/2006/dowbenko_new_fertility_product.pdf.
Dutzik, T. & Baxandall, P. (2013). A New Direction - Our Changing Relationship with Driving and the Implications for America’s Future. [Online]. Available from: http://uspirg.org/reports/usp/new-direction.
Ebinger, J. & Vergara, W. (2011). Climate impacts on energy systems: key issues for energy sector adaptation. [Online]. Washington, DC. Available from: http://documents.worldbank.org/curated/en/2011/01/13888226/climate-impacts-energy-systems-key-issues-energy-sector-adaptation.
Ecofys (2015). G7+EU INDCs: some improvement, but a large emissions gap remains - Climate Action Tracker policy brief. [Online]. Available from: http://www.ecofys.com/en/publications/g7eu-indcs-some-improvement-but-a-large-emissions-gap-remains/.
Ecofys (2009). Role and Potential of Renewable Energy and Energy Efficiency for Global Energy Supply. [Online]. Dessau-Roßlau, Germany. Available from: http://www.ecofys.com/files/files/report_role_potential_renewable_energy_efficiency_global_energy_supply.pdf.
EIA (2015). International Energy Statistics. [Online]. Washington, D.C. Available from: http://www.eia.gov/cfapps/ipdbproject/IEDIndex3.cfm?tid=2&pid=2&aid=12.
Enerdata (2015). Energy Research Services. [Online]. Available from: http://www.enerdata.net/.
|References
87
Enkvist, P.-A., Nauclér, T. & Rosander, J. (2007). A cost curve for greenhouse gas reduction. [Online]. Available from: http://www.mckinsey.com/insights/sustainability/a_cost_curve_for_greenhouse_gas_reduction.
EPA (2015). Emissions Factors & AP 42, Compilation of Air Pollutant Emission Factors. [Online]. Available from: http://www3.epa.gov/ttnchie1/ap42/.
F. Sedano (2015). Latin America Manufacturing Outlook July 2015. [Online]. Available from: https://www.mapi.net/RESEARCH/PUBLICATIONS/LATIN-AMERICA-MANUFACTURING-OUTLOOK-JULY-2015.
FAO (2014). Agriculture’s greenhouse gas emissions on the rise. [Online]. Rome, Italy. Available from: http://www.fao.org/news/story/en/item/216137/icode/.
FAOSTAT (2015). Food and Agricultrue Organization of the United Nations. Database. [Online]. 2015. Available from: http://faostat3.fao.org/download/G1/GT/E. [Accessed: 17 September 2015].
Farrell, A.E., Plevin, R.J., Turner, B.T., Jones, A., O’Hare, M. & Kammen, D.M. (2006). Ethanol Can Contribute to Energy and Environmental Goals. Science. [Online]. 311 (5760). p.pp. 506–508. Available from: http://www.sciencemag.org/cgi/doi/10.1126/science.1121416.
Fearnside, P.M., Barbosa, R.I. & de Alencastro Graça, P.M.L. (2007). Burning of secondary forest in Amazonia: Biomass, burning efficiency and charcoal formation during land preparation for agriculture in Apiaú, Roraima, Brazil. Forest Ecology and Management. [Online]. 242 (2-3). p.pp. 678–687. Available from: http://linkinghub.elsevier.com/retrieve/pii/S0378112707001260.
Feldman, D., Barbose, G., Margolis, R., James, T., Weaver, S., Darghouth, N., Fu, R., Davidson, C., Booth, S. & Ryan, W. (2014). Photovoltaic System Pricing Trends Historical, Recent, and Near-Term Projections 2014 Edition. [Online]. Available from: http://www.nrel.gov/docs/fy14osti/62558.pdf.
Fenhann, J. (2015). Greenhouse gas Abatement Cost MOdel GACMO. Copenhagen, Denmark.
Ferreira, F.H.G., Messina, J., Rigolini, J., López-Calva, L.-F., Lugo, M.A. & Vakis, R. (2012). Economic Mobility and the Rise of the Latin American Middle Class. [Online]. Washington D.C.: The World Bank. Available from: http://elibrary.worldbank.org/doi/book/10.1596/978-0-8213-9634-6.
Franck, N.T. (2015). Flexibility from an Institutional Viewpoint, DK experiences. [Online]. Available from: Energinet.dk.
FS-UNEP BNEF (2015). Global Trends in Renewable Energy Investment 2015. [Online]. Available from: http://fs-unep-centre.org/publications/global-trends-renewable-energy-investment-2015.
|References
88
Fujisaka, S., Castilla, C., Escobar, G., Rodrigues, V., Veneklaas, E.., Thomas, R. & Fisher, M. (1998). The effects of forest conversion on annual crops and pastures: Agriculture, Ecosystems & Environment. [Online]. 69 (1). p.pp. 17–26. Available from: http://linkinghub.elsevier.com/retrieve/pii/S0167880998000917.
Garibay, S. V. & Ugas, R. (2009). Organic Farming in Latin America and the Caribbean. In: The World of Organic Agriculture - Statistics and Emerging Trends 2009. [Online]. Frick, Bonn and Geneva: FiBL, IFOAM and ITC, pp. 176–185. Available from: http://orgprints.org/17931/.
Gélvez, J.A.G. & Obando, C. (2014). La motorización, el número de viajes y la distribución modal en Bogotá: pasado y posible futuro.
GENI (2011). Renewable Energy Potential of Chile. [Online]. Available from: http://www.geni.org/globalenergy/research/renewable-energy-potential-of-chile/Chile 2020 Report II PBM final.pdf.
GFW (2015). Global Forest Watch. [Online]. Available from: http://www.globalforestwatch.org/.
Gorham, R. (2002). Air pollution from ground transportation: An assessment of causes, strategies and tactics, and proposed actions for the international community. Tournesol Conseils.
GOV.UK (2015). Industrial Decarbonisation and Energy Efficiency Roadmaps to 2050. [Online]. Available from: https://www.gov.uk/government/publications/industrial-decarbonisation-and-energy-efficiency-roadmaps-to-2050.
GOV.UK (2012). Marine Energy Development - Taking Steps for Developing the Chilean Resource. [Online]. Available from: https://www.gov.uk/government/uploads/system/uploads/attachment_data/file/207868/Marine_Energy_Report_-_ENGLISH.pdf.
Grieg-Gran, M. (2008). The Cost of Avoiding Deforestation. [Online]. London. Available from: http://pubs.iied.org/pdfs/G02489.pdf.
Guerrero, P. & Abad, J. (2013). Assessment of Port Performance and Port Connectivity Study in Belize, Central America and the Dominican Republic. [Online]. Available from: http://idbdocs.iadb.org/wsdocs/getdocument.aspx?docnum=37578169.
Guzmán, W. & Arévalo, L. (2003). Servicios ambientales de almacenamiento de carbono como activo para el desarrollo en la Amazonía Peruana: Avances y retos. Pucallpa, Universidad Nacional de Ucayali.
Hansen, M., Potapov, C.P. V., Moore, R., Hancher, M., Turubanova, S.A., Tyukavina, A., Thau, D., Stehman, S. V., Goetz, S.J., Loveland, T.R., Kommareddy, A., Egorov, A., Chini, L., Justice, C.O. & Townshend, J.R.G. (2015). NASA Tree Cover Loss and Gain Area. [Online]. Available from: http://www.globalforestwatch.org/countries.
|References
89
Hecht, S.B. (2014). The Natures of Progress: Land Use Dynamics and Forest Trends in Latin America and the Caribbean. [Online]. Available from: http://www.iadb.org/wmsfiles/products/publications/documents/36735843.pdf.
Henderson, B., Falcucci, a., Mottet, a., Early, L., Werner, B., Steinfeld, H. & Gerber, P. (2015). Marginal costs of abating greenhouse gases in the global ruminant livestock sector. Mitigation and Adaptation Strategies for Global Change. [Online]. Available from: http://link.springer.com/10.1007/s11027-015-9673-9.
Heubach, K., Wittig, R., Nuppenau, E.-A. & Hahn, K. (2011). The economic importance of non-timber forest products (NTFPs) for livelihood maintenance of rural west African communities: A case study from northern Benin. Ecological Economics. [Online]. 70 (11). p.pp. 1991–2001. Available from: http://linkinghub.elsevier.com/retrieve/pii/S0921800911002047.
Hurteau, M.D. & Brooks, M.L. (2011). Short- and Long-term Effects of Fire on Carbon in US Dry Temperate Forest Systems. BioScience. [Online]. 61 (2). p.pp. 139–146. Available from: http://www.jstor.org/doi/abs/10.1525/bio.2011.61.2.9.
IEA (2015). Consumption of oil products - Non-OECD Americas. [Online]. Washington, DC. Available from: http://www.iea.org/stats/WebGraphs/LATINAMERI1.pdf.
IFAD (2010). Rural Poverty Report 2011. New Realities, New Challenges: New Opportunities for Tomorrow’s Generation. Rome, Italy.
IIASA (2012). GEA Scenario database. [Online]. Available from: http://www.iiasa.ac.at/web-apps/ene/geadb/dsd?Action=htmlpage&page=about#.
INEGI (2012). Encuesta Anual de Transportes 2011. [Online]. Available from: http://www.inegi.org.mx/prod_serv/contenidos/espanol/bvinegi/productos/integracion/encues-trans/2011/EAT1_2011.pdf.
INPE (2010). Desmatemento Cai.
IPCC (2007). Climate Change (2007).
IPCC (2014). Climate Change 2014: Synthesis Report. Contribution of Working Groups I, II and III to the Fifth Assessment Report of the Intergovernmental Panel on Climate Change. In: R. K. Pachauri & L. A. Meyer (eds.). Geneva, Switzerland: Cambridge University Press, Cambridge, United Kingdom and New York, NY, USA, p. 151.
IRENA (2015a). Renewable Energy in Latin America 2015: An Overview of Policies. [Online]. Abu Dhabi. Available from: http://www.irena.org/DocumentDownloads/Publications/IRENA_RE_Latin_America_Policies_2015.pdf.
IRENA (2012). Renewable Energy Technologies: Cost Analysis Series -Concentrating Solar Power. [Online]. Available from:
|References
90
http://www.irena.org/documentdownloads/publications/re_technologies_cost_analysis-csp.pdf.
IRENA (2015b). Renewable Power Generation Costs in 2014. [Online]. Available from: http://www.irena.org/DocumentDownloads/Publications/IRENA_RE_Power_Costs_2014_report.pdf.
Jianbo, L. (2006). Energy balance and economic benefits of two agroforestry systems in northern and southern China. Agriculture, Ecosystems & Environment. [Online]. 116 (3-4). p.pp. 255–262. Available from: http://linkinghub.elsevier.com/retrieve/pii/S0167880906000971.
Justen, A., Martínez, F., Lenz, B. & Cortés, C. (2012). Santiago 2030: Perspectives on the Urban Transport System. In: Risk Habitat Megacity. [Online]. Berlin, Heidelberg: Springer Berlin Heidelberg, pp. 207–227. Available from: http://www.springerlink.com/content/g86567515285wk80/.
Kaimowitz, D. (2008). The prospects for Reduced Emissions from Deforestation and Degradation (REDD) in Mesoamerica. International Forestry Review. [Online]. 10 (3). p.pp. 485–495. Available from: http://openurl.ingenta.com/content/xref?genre=article&issn=1465-5489&volume=10&issue=3&spage=485.
Kindermann, G., Obersteiner, M., Sohngen, B., Sathaye, J., Andrasko, K., Rametsteiner, E., Schlamadinger, B., Wunder, S. & Beach, R. (2008). Global cost estimates of reducing carbon emissions through avoided deforestation. Proceedings of the National Academy of Sciences. [Online]. 105 (30). p.pp. 10302–10307. Available from: http://www.pnas.org/cgi/doi/10.1073/pnas.0710616105.
Klinge, H., Adis, J. & Worbes, M. (1995). The vegetation of a seasonal varzea forest in the lower Solimões river, Brazilian Amazonia.
Kost, C., Mayer, J.N., Thomsen, J., Hartmann, N., Senkpiel, C., Philipps, S., Nold, S., Lude, S., Saad, N. & Schlegl, T. (2013). Levelized Cost of Electricity Renewable Energy Technologies. [Online]. Freiburg, Germany. Available from: http://www.ise.fraunhofer.de/en/publications/veroeffentlichungen-pdf-dateien-en/studien-und-konzeptpapiere/study-levelized-cost-of-electricity-renewable-energies.pdf.
Kumar, B.M., George, S.J., Jamaludheen, V. & Suresh, T.K. (1998). Comparison of biomass production, tree allometry and nutrient use efficiency of multipurpose trees grown in woodlot and silvopastoral experiments in Kerala, India. Forest Ecology and Management. 112 (1). p.pp. 145–163.
Lal, R. (2005). Forest soils and carbon sequestration. Forest ecology and management. 220 (1). p.pp. 242–258.
Lantz, E., Hand, M. & Wiser, R. (2012). The Past and Future Cost of Wind Energy. [Online]. Denver, Colorado. Available from: http://www.nrel.gov/docs/fy12osti/54526.pdf.
|References
91
Lapeyre, T., Alegre, J. & Arévalo, L. (2004). Determinación de las reservas de carbono de la biomasa aérea, en diferentes sistemas de uso de la tierra en San Martín, Perú Determination of carbon reserves of the aerial biomass in different land use systems in San Martin, Peru. [Online]. Available from: http://www.scielo.org.pe/scielo.php?script=sci_arttext&pid=S1726-22162004000100006.
Lesschen, J.P., van den Berg, M., Westhoek, H.J., Witzke, H.P. & Oenema, O. (2011). Greenhouse gas emission profiles of European livestock sectors. Animal Feed Science and Technology. [Online]. 166-167. p.pp. 16–28. Available from: http://linkinghub.elsevier.com/retrieve/pii/S0377840111001775.
Lorenz, K. & Lal, R. (2014). Soil organic carbon sequestration in agroforestry systems. A review. Agronomy for Sustainable Development. [Online]. 34 (2). p.pp. 443–454. Available from: http://link.springer.com/10.1007/s13593-014-0212-y.
Magalhães, M.M. de & Lunas Lima, D.A.L. (2014). Low-Carbon Agriculture in Brazil: The Environmental and Trade Impact of Current Farm Policies. [Online]. Geneva, Switzerland. Available from: http://www.ictsd.org/sites/default/files/research/Low-Carbon Agriculture in Brazil.pdf.
Martin, E.W., Chester, M. V. & Vergara, S.E. (2015). Attributional and Consequential Life-cycle Assessment in Biofuels: a Review of Recent Literature in the Context of System Boundaries. Current Sustainable/Renewable Energy Reports. [Online]. 2 (3). p.pp. 82–89. Available from: http://link.springer.com/10.1007/s40518-015-0034-9.
Maurer, E.P., Adam, J.C. & Wood, A.W. (2008). Climate model based consensus on the hydrologic impacts of climate change to the Rio Lempa basin of Central America. Hydrology and Earth System Sciences Discussions. [Online]. 5 (6). p.pp. 3099–3128. Available from: http://www.hydrol-earth-syst-sci-discuss.net/5/3099/2008/.
Messner, S. & Struebegger, M. (1995). User’s guide for MESSAGE III. Laxenburg, Austria.
Montagnini, F. & Nair, P.K.R. (2004). Carbon sequestration: An underexploited environmental benefit of agroforestry systems. Agroforestry Systems. [Online]. 61-62 (1-3). p.pp. 281–295. Available from: http://link.springer.com/10.1023/B:AGFO.0000029005.92691.79.
Moore, S. & Newey, G. (2012). Something in the Air. The forgotten crisis of Britain’s poor air quality. [Online]. London. Available from: http://www.policyexchange.org.uk/images/publications/something in the air.pdf.
Moreira, M.R.P. & Dourado, A.B. de F. (2014). A taxa de motorização nas cidades brasileiras e a questão da mobilidade urbana. [Online]. Available from: http://www.antp.org.br/_5dotSystem/download/dcmDocument/2013/10/07/F5EE6A8C-151A-403D-8C98-56488342AEE1.pdf.
|References
92
Nair, P.K.R. (2012). Carbon sequestration studies in agroforestry systems: a reality-check. Agroforestry Systems. [Online]. 86 (2). p.pp. 243–253. Available from: http://link.springer.com/10.1007/s10457-011-9434-z.
Nair, P.K.R. & Garrity, D. (2012). Agroforestry - The Future of Global Land Use. Advances in Agroforestry. P. K. R. Nair & D. Garrity (eds.). [Online]. Dordrecht: Springer Netherlands. Available from: http://link.springer.com/10.1007/978-94-007-4676-3.
Nakaegawa, T. & Vergara, W. (2010). First Projection of Climatological Mean River Discharges in the Magdalena River Basin, Colombia, in a Changing Climate during the 21st Century. Hydrological Research Letters. [Online]. 4. p.pp. 50–54. Available from: http://joi.jlc.jst.go.jp/JST.JSTAGE/hrl/4.50?from=CrossRef.
NCCS (2013). Mexico (2013): National Climate Change Strategy - The 10-20-40 Vision. [Online]. Available from: http://mitigationpartnership.net/mexico-2013-national-climate-change-strategy-10-20-40-vision.
Nepstad, D., McGrath, D., Stickler, C., Alencar, A., Azevedo, A., Swette, B., Bezerra, T., DiGiano, M., Shimada, J., Seroa da Motta, R., Armijo, E., Castello, L., Brando, P., Hansen, M.C., McGrath-Horn, M., Carvalho, O. & Hess, L. (2014). Slowing Amazon deforestation through public policy and interventions in beef and soy supply chains. Science. [Online]. 344 (6188). p.pp. 1118–1123. Available from: http://www.sciencemag.org/cgi/doi/10.1126/science.1248525.
NOAA (2015). Earth System Research Laboratory - Trends in Atmospheric Carbon Dioxide. [Online]. 2015. Available from: http://www.esrl.noaa.gov/gmd/ccgg/trends/weekly.html. [Accessed: 1 July 2015].
Noreña, J.E.O., García, C.G., Conde, A.C. & Magaña, V. (2009). Vulnerability of water resources in the face of potential climate change: generation of hydroelectric power in Colombia. Atmósfera. [Online]. 22 (3). Available from: http://www.scielo.org.mx/scielo.php?pid=S0187-62362009000300001&script=sci_arttext.
Nykvist, B. & Nilsson, M. (2015). Rapidly falling costs of battery packs for electric vehicles. Nature Climate Change. [Online]. 5 (4). p.pp. 329–332. Available from: http://www.nature.com/doifinder/10.1038/nclimate2564.
Nylund, N.-O. (2013). Transport Technology Gaps. [Online]. Available from: https://www.iea.org/media/workshops/2013/egrdmobility/Nylund_transport_technology_gaps.pdf.
OECD (2014). The Cost of Air Pollution. [Online]. OECD Publishing. Available from: http://www.oecd-ilibrary.org/environment/the-cost-of-air-pollution_9789264210448-en.
Oelbermann, M., Voroney, R.P., Thevathasan, N. V., Gordon, A.M., Kass, D.C.L. & Schlönvoigt, A.M. (2006). Soil carbon dynamics and residue stabilization in a Costa Rican
|References
93
and southern Canadian alley cropping system. Agroforestry Systems. [Online]. 68 (1). p.pp. 27–36. Available from: http://link.springer.com/10.1007/s10457-005-5963-7.
Olsen, N. & Bishop, J. (2009). The Financial Costs of REDD: Evidence from Brazil and Indonesia. [Online]. Gland. Available from: https://portals.iucn.org/library/efiles/documents/2009-047.pdf.
Overmars, K.P., Stehfest, E., Tabeau, A., van Meijl, H., Beltrán, A.M. & Kram, T. (2014). Estimating the opportunity costs of reducing carbon dioxide emissions via avoided deforestation, using integrated assessment modelling. Land Use Policy. [Online]. 41. p.pp. 45–60. Available from: http://linkinghub.elsevier.com/retrieve/pii/S0264837714000799.
Palm, C., Tomich, T., Van Noordwijk, M., Vosti, S., Gockowski, J., Alegre, J. & Verchot, L. (2004). Mitigating GHG Emissions in the Humid Tropics: Case Studies from the Alternatives to Slash-and-Burn Program (ASB). Environment, Development and Sustainability. [Online]. 6 (1/2). p.pp. 145–162. Available from: http://link.springer.com/10.1023/B:ENVI.0000003634.50442.ca.
Peters-Stanley, M. & Gonzalez, G. (2014). Sharing the stage state of the voluntary carbon markets 2014. A Report by Forest Trends’ Ecosystem Marketplace: Executive Summary, Washington DC.
Potapov, P., Laestadius, L. & Minnemeyer, S. (2011). Global Map of forest Landscape Restoration Opportunities. [Online]. Washington, DC. Available from: www.wri.org/forest-restoration-atlas.
REN21 (2014). RENEWABLES 2014 - GLOBAL STATUS REPORT. [Online]. Paris: REN21 Secretariat. Available from: http://www.ren21.net/Portals/0/documents/Resources/GSR/2014/GSR2014_full report_low res.pdf.
REN21 (2015). RENEWABLES 2015 - GLOBAL STATUS REPORT. [Online]. Paris: REN21 Secretariat. Available from: http://www.ren21.net/wp-content/uploads/2015/06/REN12-GSR2015_Onlinebook_low1.pdf.
Renewable energy world (2013). The Future of Solar in Latin America. [Online]. Available from: http://www.renewableenergyworld.com/articles/2013/05/the-future-of-solar-in-latin-america.html.
Riahi, K., Dentener, F., Gielen, D., Grubler, A., Jewell, J., Klimont, Z., Krey, V., McCollum, D., Pachauri, S., Rao, S., Ruijven, B. van, Vuuren, D.P. van & Wilson, C. (2011). 2011: Energy Pathways for Sustainable Development. In: and A. P. L. Gomez-Echeverri, T. B. Johansson, N. Nakicenovic (ed.). In Global Energy Assessment: Toward a Sustainable Future. [Online]. Laxenburg: International Institute for Applied Systems Analysis (IIASA); Cambridge and New York: Cambridge University Press. Available from: http://opensky.library.ucar.edu/collections/OSGC-000-000-010-509.
|References
94
Riahi, K., Dentener, F., Gielen, D., Grubler, A., Jewell, J., Klimont, Z., Krey, V., McCollum, D., Pachauri, S., Rao, S., van Ruijven, B., van Vuuren, D.P. & Wilson, C. (2012). Chapter 17 - Energy Pathways for Sustainable Development. In: Global Energy Assessment - Toward a Sustainable Future. [Online]. Cambridge University Press, Cambridge, UK and New York, NY, USA and the International Institute for Applied Systems Analysis, Laxenburg, Austria, pp. 1203–1306. Available from: www.globalenergyassessment.org.
Riahi, K., Grübler, A. & Nakicenovic, N. (2007). Scenarios of long-term socio-economic and environmental development under climate stabilization. Technological Forecasting and Social Change. 74 (7). p.pp. 887–935.
RMI (2015). Tesla Hitting the Battery Accelerator. [Online]. Available from: http://blog.rmi.org/blog_2015_06_11_tesla_hitting_the_battery_accelerator.
RMI (2014). The Economics of Grid Defection. [Online]. Available from: http://www.rmi.org/electricity_grid_defection.
Rodrigues, V.G.S., Castilla, C., Costa, R.S.C. & Palm, C. (1999). Estoque de carbono em sistema de uso da terra em Rondônia. [Online]. Available from: http://ainfo.cnptia.embrapa.br/digital/bitstream/item/77901/1/FOL-6097-0001.pdf.
Rubio Varas, M. del M. & Tafunell, X. (2014). Latin American hydropower: A century of uneven evolution. Renewable and Sustainable Energy Reviews. [Online]. 38 (C). p.pp. 323–334. Available from: http://econpapers.repec.org/RePEc:eee:rensus:v:38:y:2014:i:c:p:323-334. [Accessed: 2 October 2015].
Salimon, C.I., Putz, F.E., Menezes-Filho, L., Anderson, A., Silveira, M., Brown, I.F. & Oliveira, L.C. (2011). Estimating state-wide biomass carbon stocks for a REDD plan in Acre, Brazil. Forest Ecology and Management. [Online]. 262 (3). p.pp. 555–560. Available from: http://linkinghub.elsevier.com/retrieve/pii/S0378112711002404.
Saygin, D., Worrell, E., Patel, M.K. & Gielen, D.J. (2011). Benchmarking the energy use of energy-intensive industries in industrialized and in developing countries. Energy. [Online]. 36 (11). p.pp. 6661–6673. Available from: http://linkinghub.elsevier.com/retrieve/pii/S036054421100555X.
Scandlines (2015). Scandlines Hybrid Ferries. [Online]. Copenhagen, Denmark. Available from: https://stateofgreen.com/en/profiles/scandlines/solutions/scandlines-hybrid-ferries.
Schellnhuber, H.J. (2009). Tipping elements in the Earth System. Proceedings of the National Academy of Sciences of the United States of America. [Online]. 106 (49). p.pp. 20561–3. Available from: http://www.pnas.org/cgi/content/long/106/49/20561.
Scherer, A.-C. (2013). Organic food market in the United States. Market access opportunities for Latin American and Caribbean producers. [Online]. Santiago, Chile. Available from: http://repositorio.cepal.org/bitstream/handle/11362/5066/LCL3696_en.pdf?sequence=1.
|References
95
Searchinger, T., Heimlich, R., Houghton, R.A., Dong, F., Elobeid, A., Fabiosa, J., Tokgoz, S., Hayes, D. & Yu, T.-H. (2008). Use of U.S. Croplands for Biofuels Increases Greenhouse Gases Through Emissions from Land-Use Change. Science. [Online]. 319 (5867). p.pp. 1238–1240. Available from: http://www.sciencemag.org/cgi/doi/10.1126/science.1151861.
Seba, T. (2014). Clean Disruption of Energy and Transportation: How Silicon Valley Will Make Oil, Nuclear, Natural Gas, Coal, Electric Utilities and Conventional Cars Obsolete by 2030. [Online]. Tony Seba. Available from: http://tonyseba.com/portfolio-item/clean-disruption-of-energy-transportation/.
Da Silva Dias, M.A.F. (2008). Forest and Rainfall Interactions in the Amazon Basin. [Online]. Available from: https://www.ige.unicamp.br/terrae/V3/PDF-N3/T_A5_2.pdf.
Smith, P., Martino, D., Cai, Z., Gwary, D., Janzen, H., Kumar, P., McCarl, B., Ogle, S., O’Mara, F., Rice, C., Scholes, B., Sirotenko, O., Howden, M., McAllister, T., Pan, G., Romanenkov, V., Schneider, U., Towprayoon, S., Wattenbach, M. & Smith, J. (2008). Greenhouse gas mitigation in agriculture. Philosophical Transactions of the Royal Society B: Biological Sciences. [Online]. 363 (1492). p.pp. 789–813. Available from: http://rstb.royalsocietypublishing.org/content/363/1492/789.
Soto-Pinto, L., Anzueto, M., Mendoza, J., Ferrer, G.J. & de Jong, B. (2010). Carbon sequestration through agroforestry in indigenous communities of Chiapas, Mexico. Agroforestry Systems. 78 (1). p.pp. 39–51.
Sparks, D. (2015). Tesla Motors Inc.’s Model 3 Ambitions May Be More Realistic Than You Think. [Online]. Available from: http://www.fool.com/investing/general/2015/06/28/tesla-motors-incs-model-3-ambitions-more-realistic.aspx.
Stern, N. (2006). Stern Review on the Economics of Climate Change. [Online]. Cambridge University Press. Available from: http://www.amazon.co.uk/The-Economics-Climate-Change-Review/dp/0521700809. [Accessed: 7 March 2014].
Summers, D.M., Bryan, B.A., Nolan, M. & Hobbs, T.J. (2015). The costs of reforestation: A spatial model of the costs of establishing environmental and carbon plantings. Land Use Policy. [Online]. 44. p.pp. 110–121. Available from: http://linkinghub.elsevier.com/retrieve/pii/S0264837714002737.
Teske, S., Sawyer, S. & Schäfer, O. (2015). Energy [R]evolution - A Sustainable World Energy Outlook 2015. [Online]. Available from: http://www.greenpeace.org/international/en/publications/Campaign-reports/Climate-Reports/Energy-Revolution-2015/.
Tollefson, J. (2015). Stopping deforestation: Battle for the Amazon. Nature. [Online]. 520 (7545). p.pp. 20–23. Available from: http://www.nature.com/doifinder/10.1038/520020a.
|References
96
Tsuchiya, A. & Hiraoka, M. (1999). Forest biomass and wood consumption in the lower course of the Amazon: a case study of the Urubuera Island.
UCS (2009). Clean Energy, Green Jobs. [Online]. Cambridge MA. Available from: http://www.ucsusa.org/clean_energy/smart-energy-solutions/increase-renewables/clean-energy-green-jobs.html#.VgjwKMuqpBc.
UNCTAD (2012). Maritime Transport and the Climate Change Challenge. [Online]. Available from: http://unctad.org/en/pages/newsdetails.aspx?OriginalVersionID=132.
USA (2012). United States Transportation by the Numbers. [Online]. Available from: http://www.rita.dot.gov/bts/sites/rita.dot.gov.bts/files/united_states.pdf.
Valdes, A. & Mistiaen, J.A. (2003). Rural Poverty Alleviation in Brazil: Toward an Integrated Strategy. World Bank Country Study. ERIC.
Vergara, W., Alatorre, C. & Alves, L. (2013a). Rethinking Our Energy Future - A White Paper on Renewable Energy for the 3GFLAC Regional Forum. [Online]. Available from: https://www.imf.org/external/np/seminars/eng/2013/caribbean/pdf/rethinking.pdf.
Vergara, W., Deeb, A., Cramton, P., Toba, N., Leino, I. & Benoit, P. (2010). Wind energy in Colombia: a framework for market entry. World Bank Publications.
Vergara, W., Rios, A.R., Galindo, L.M., Gutman, P., Isbell, P., Suding, P.H. & Samaniego, J. (2013b). The Climate and Development Challenge for Latin America and the Caribbean. Options for climate-resilient, low-carbon development. [Online]. Available from: http://idbdocs.iadb.org/wsdocs/getdocument.aspx?docnum=37720722.
Vergara, W., Rios, A.R., Trapido, P., Malarin, H. & Malarín, H. (2014). Agriculture and future climate in Latin America and the Caribbean: Systemic impacts and potential responses. [Online]. Available from: http://idbdocs.iadb.org/wsdocs/getdocument.aspx?docnum=38585010.
Vergara, W. & Scholz, S.M. (2011). Assessment of the risk of Amazon dieback. [Online]. Washington D.C. Available from: http://documents.worldbank.org/curated/en/2010/01/13155273/assessment-risk-amazon-dieback.
World Bank (1998). El Salvador: Rural Development Study. Washington D.C.
World Bank (2002). Improving Air Quality in Metropolitan Mexico City: An Economic Valuation. [Online]. Available from: http://hdl.handle.net/10986/15696.
World Bank (2014a). The Little Green Data Book. [Online]. Washington, D.C. Available from: http://data.worldbank.org/sites/default/files/wb-ldb_green_2014-crpd.pdf.
World Bank (2014b). World Development Indicators 2014. [Online]. Washington D.C. Available from: http://data.worldbank.org/sites/default/files/wdi-2014-book.pdf.
|References
97
World Bank (2015). World Development Indicators 2015. [Online]. Washington, DC. Available from: http://data.worldbank.org/. [Accessed: 15 June 2015].
Yáñez-Ruiz, D.R., Losa, R., Núñez, C., Tessier, N., Media, B., Shearer, A., Campanere, S. de, Morgavi, D., Fievez, F. & Newbold, C.J. (2013). Smethane, a technological platform to develop nutritional additives to reduce methane emissions from ruminants: putting together efforts from industry and academia. In: XV Jornadas sobre Producción Animal, Zaragoza 14 y 15 de mayo de 2013. [Online]. 2013, Asociación Interprofesional para el Desarrollo Agrario, pp. 288–290. Available from: http://www.cabdirect.org.globalproxy.cvt.dk/abstracts/20133263958.html;jsessionid=8DEC2EF0BDF000C400CFAE3DCD4ABD18#. [Accessed: 7 September 2015].
Yquise, A., Pocomucha, V. & Rios, J. (2009). Carbono Almacenado en Diferentes Sistemas de Uso de la Tierra del Distrito de José Crespo y Castillo. Huánuco, Perú.
|Annexes
98
Annexes
Annex I
IIASA’s BAU (GEA-Counterfactual) and GEA-Mix Scenarios
This report relies heavily on the scenarios projected by IIASA under its Global Energy Assessment (GEA) model. Two different scenario families are used (GEA-Mix & GEA-Counterfactual or BAU) to project sector emission development in order to identify mitigation priorities and verify the zero carbon LAC route by 2050.
The IIASA (2012) scenario database42 is providing three principal Global Energy Assessment (GEA) transformation pathway groups (GEA-Efficiency, GEA-Supply, and GEA-Mix). These groups distinguish within three branching points and thus differ significantly from each other, depending on the choices made about technologies, infrastructures, behaviours, and lifestyles, as well as on future priorities with respect to the portfolio of supply- and demand-side policies (Riahi et al., 2012). The first branching point leads to three pathway groups where the GEA-Efficiency pathway assumes the most significant reduction and the GEA-Supply pathway registers only minor improvements over the historical rate into the future. Meanwhile, the GEA-Mix pathway exhibits an intermediate level of energy efficiency and decline in energy intensities. The second and third branching points of these three scenarios into still more pathways are based on43:
x The type of transportation system (that is, a conventional, traditional “liquids-“ transport infrastructure versus an advanced transport infrastructure based upon electrification and, in some cases, some use of hydrogen), assumed to dominate the economy in the future
x The energy sources—or technologies—assumed to be included (or excluded) from the energy and technology mix along any particular pathway.
Furthermore, all of the GEA pathways share certain other common defining features as well, the most significant of which is significant mitigation of GHG emissions into the future. In each of the 41 GEA pathways that IIASA has assessed, IIASA finds that this reduction of emissions is significant enough to make a regionally appropriate contribution to a credible global defense of the 450 parts per million (ppm) atmospheric concentration limit and the 2˚C guardrail by 2050 (Riahi et al., 2011).
This study is using the GEA-Mix Conventional Transportation pathway as the most intermediate of the three above mentioned pathway groups, which emphasizes on a more diverse energy supply mix, to enhance the system’s resilience against innovation failures or technology shocks. This however doesn't imply that the GEA-Mix pathways is an intermediate between the other two pathways in terms of other scenario characteristics (e.g., the required
42 See http://www.iiasa.ac.at/web-apps/ene/geadb/dsd?Action=htmlpage&page=about 43 For a complete and in-depth description of the GEA pathways see (Riahi et al., 2012).
|Annexes
99
policy portfolio, costs, fuel choices, or deployment of individual technologies) (Riahi et al., 2012). Conventional transportation refers to the continuation of a predominantly liquid-based transportation system while fundamental changes in infrastructures (in the case of high penetration of electric vehicles) are discussed in detail in chapter 3.
If the GEA pathways are presented as only energy intervention scenarios, they would bring LAC to anywhere between 3.4 tpc and 4.3 tpc by 2050, and would therefore need to be supplemented with significantly more intensive AFOLU policy measures in order to follow the aggressive mix-I+ (plus) (combined) intervention pathway to the LAC goal of 2 tpc annually by 2050. In other words, the energy interventions bring LAC’s per capita emissions from 9.3 under the BAU trajectory down to below 4 tpc; another 2 tpc must be reduced through AFOLU interventions in order to achieve the 2 tpc goal by 2050.
The second scenario included in this study is the GEA-Counterfactual (MESSAGE) (or business-as-usual scenario) which is a hypothetical no-policy baseline describing the evolution of the energy system in absence of any transformational policies for the demand- or supply-side of the energy system (Riahi et al., 2012). MESSAGE (Model for Energy Supply Strategy Alternatives and their General Environmental Impact) is a systems engineering optimization model used for medium- to long-term energy system planning, energy policy analysis, and scenario development (Messner & Struebegger, 1995; Riahi et al., 2007). The scenario represents all energy system interdependencies from resource extraction, imports and exports, conversion, transport, and distribution to the provision of energy end-use services such as light, space heating and cooling, industrial production processes, and transportation. MESSAGE covers all GHG-emitting sectors, including agriculture, forestry, energy, and industrial sources, and the major GHGs and other radiatively active gases: CO2, methane (NH4), nitrous oxide (N2O), nitrogen oxides (NO2), volatile organic compounds (VOCs), carbon monoxide (CO), sulfur dioxide, black carbon and organic carbon, tetrafluoromethane, hexafluoroethane, various hydrofluorocarbons (HFC125, HFC134a, HFC143a, HFC227ea, HFC245ca), and sulfur hexafluoride. The MESSAGE counterfactual assumes a transit of many sectors to hydrocarbons but is unable to successfully address energy access and security issues (Riahi et al., 2012). The GEA pathways are generated based on the counterfactuals combined with a set of harmonized assumptions.
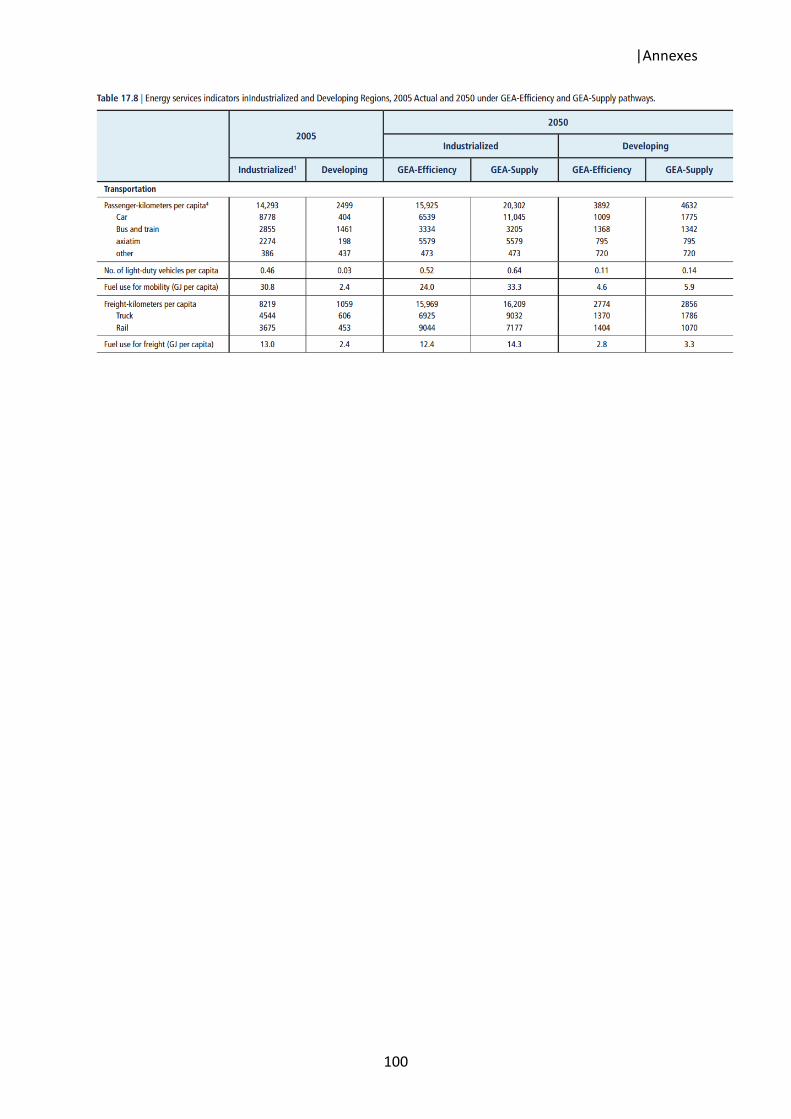
|Annexes
100

|Annexes
101
Annex II
Latin America has a substantial endowment of hydrological resources. It already accounts for over 20% of the world’s hydropower and has the largest share of hydroelectricity for generation in the world (over 55%). Excluding China, Latin American hydropower exhibits the fastest growth in the world over the last 30 years (Rubio Varas & Tafunell, 2014).
The prospect for further development of this potential is however somewhat tempered by environmental and social concerns. Still, the installed capacity, in particular its large multi-annual reservoirs constitute a significant asset for energy storage. This asset can play a major role for modulation of supply in conjunction with the development of intermittent capacity generation. A list of large hydropower units in the region is included in the table below.
Table 0.1 - List of hydropower plants in LAC with a capacity >1000MW/1GW. Name Country Capacity [MW] Haipu BRA/PAR 14000 Goori VEN 10200 Ilha Solteira BRA 3444 Xingo BRA/PAR 3162 Yacineta R6/PAR 3100 Paulo Algando BRA/PAR 2400 Canvachi VEN 2160 Itumbiara BRA 2080 Aqua Vermelke BRA 1400 Alberto Heros COL 1150 Blicorá ARG 1000 Bento Monõz BRA 1700 Chico MEX 2430 Chivv COL 1000 Elchccán ARG 1200 Embarcacao BRA 1200 Sooza Dios BRA 1550 Furnaz BRA 1240 Itá BRA 1450 Itumbiaza BRA 2100 Jiaru BRA 3750 Luiz Barrato BRA 1100 Luiz Ganjaga BRA 1140 Macagua II VEN 1600 Malpaso MEX 1080 Marimbando BRA 1480 Ney Boga BRA 1280 Piecha del Bgula ARG 1400 Porto Primara BRA 1540 Jose Richen BRA 1240
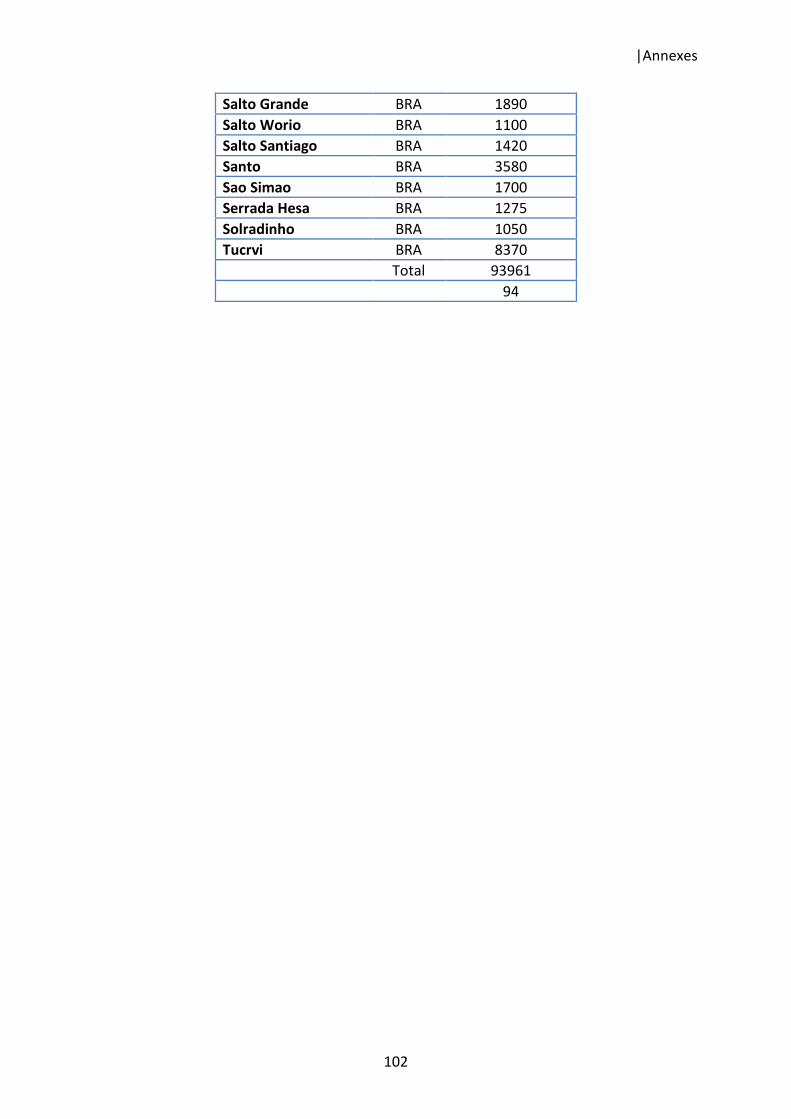
|Annexes
102
Salto Grande BRA 1890 Salto Worio BRA 1100 Salto Santiago BRA 1420 Santo BRA 3580 Sao Simao BRA 1700 Serrada Hesa BRA 1275 Solradinho BRA 1050 Tucrvi BRA 8370 Total 93961 94

|Annexes
103
Annex III
Description of the GACMO Model:
The model was developed by Joergen Fenhann, UNEP DTU Partnership, e-mail [email protected], mobile: +45 4020 2789,
GACMO is utilised to make an analysis of the GHG mitigation options for a country to be used in the National Communication or the INDC General description of how the model works:
The outcome of the use of the GACMO Model is a table providing an overview of the cost and impact of different mitigation initiatives, outputted in the format of a table and an Abatement Cost Curve. The input required for the model to run is a GHG balance for the country in question.
Use of the model:
All cells in the worksheets where inputs are needed are yellow. Most of these cells contain default values, these can be modified where appropriate.
Below a range of steps required for the use of the model will be explained. Text marked with blue indicates that the user has to either input data or perform other actions in order for the model to run.

|Annexes
104
Annex IV
Assumptions for LCOE
Airpollution benefits calculations

|Annexes
105
Annex V
Airpollution
Annex VI
Table 4.6 - Options that have been proposed to provide for net reductions in GHG emissions from agriculture through nutrient management. Calculations