
Zendesk benchmark research
31
Thanks for the analyses! Two years of Zendesk Benchmark research
-
Upload
jason-maynard -
Category
Data & Analytics
-
view
220 -
download
0
Transcript of Zendesk benchmark research

Thanks for the analyses!Two years of Zendesk Benchmark research

A SIMPLE SURVEY

CUSTOMERS
29 thousand
AGENTS
80 thousand
USERS
337 million
COUNTRIES
140
PARTICIPATION
INDUSTRIES
18
INTERACTIONS
18 billion

THE ZENDESK BENCHMARK

TRADITIONAL SURVEYS
SOURCE: Dimensional Research

THE FIRST STUDY… HOW DOES FIRST REPLY TIME ACTUALLY IMPACT SATISFACTION?
DESIRED OUTCOME
Increase return visits during Days 2-3 of a trial and use insights from this experiment to build a better getting started experience
THE DATA
We found a strong relationship between customer satisfaction and first reply time and thought…
What else should we measure?

ARE THERE PATTERNS IN UNEXPECTED PLACES?
THE DATA
Linguistic analysis shows that word choice and frequency play a surprising role in customer satisfaction.
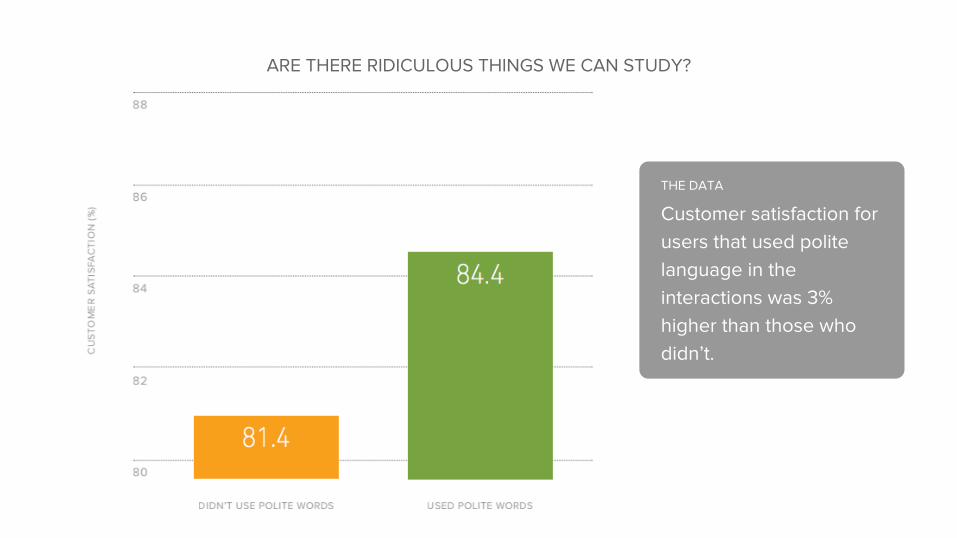
ARE THERE RIDICULOUS THINGS WE CAN STUDY?
THE DATA
Customer satisfaction for users that used polite language in the interactions was 3% higher than those who didn’t.

WHAT INDUSTRIES GO MOBILE FOR SUPPORT?

WHEN IS THE BEST TIME OF DAY TO SEND A SURVEY?

ARE THERE SEASONAL TRENDS IN CERTAIN INDUSTRIES?

“Every call is also about learning why they’re reaching out and gathering feedback on how we can improve our products and the overall customer experience.”
Mike Osby, Senior Director of Operations, NatureBox
NatureBox categorizes every customer interaction down to granular details like customer dietary preferences and type of shipping issue in a custom ticket field, which allows them to measure where they want to improve.
WHO ARE THE CUSTOMERS LEADING THE WAY?
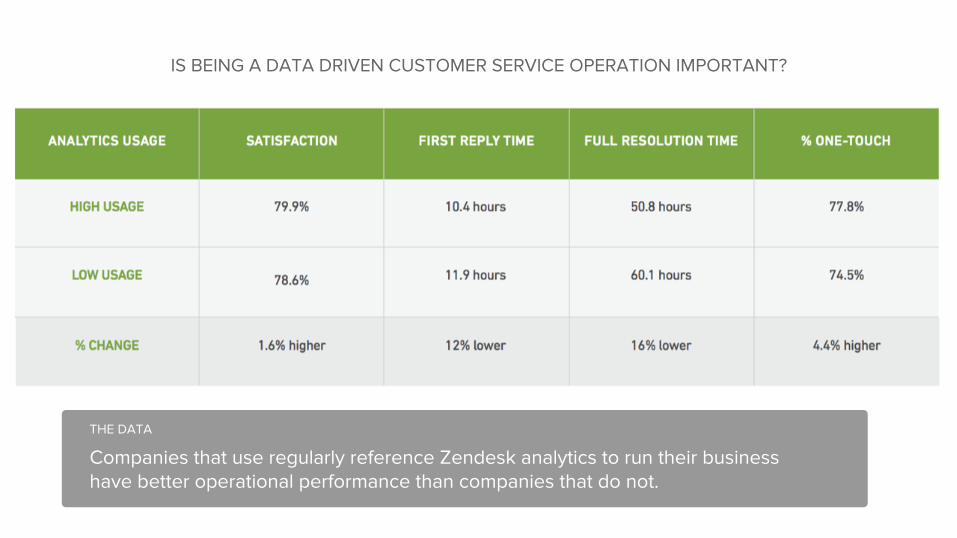
IS BEING A DATA DRIVEN CUSTOMER SERVICE OPERATION IMPORTANT?
THE DATA
Companies that use regularly reference Zendesk analytics to run their business have better operational performance than companies that do not.

THE MOST DATA DRIVEN INDUSTRIES
THE DATA
Only 17% of customers that have had a bad support interaction are promoters, compared to 64% for those that have had a good interaction.
THE DATA
Entertainment and gaming had the highest number of customers that viewed 20+ analytics reports per month.

“We need complete visibility into each ticket’s lifecycle, because every interaction is an opportunity to improve the customer’s experience”
Doc Shufelt, Vice President of Operations, Republic Wireless
WHO IS DATA DRIVEN?

WHY IS SCALING CUSTOMER SERVICE OPERATIONS IS HARD?

IS EMPLOYEE RETENTION IMPORTANT FOR CUSTOMER SERVICE?

WHAT INDUSTRIES HAVE THE HARDEST TIME WITH RETENTION?

MEASURING THE OVERALL CUSTOMER EXPERIENCE

CUSTOMERS WANT TO GIVE YOU FEEDBACK… LET THEMTHE DATA
We found this really strong relationship between customer satisfaction and first reply time and thought…
What else should we measure?
THE DATA
53% of NPS responses include open feedback that provide more insight than predefined multiple-choice surveys.

DOES CUSTOMER SERVICE HAVE AN IMPACT ON BRAND VIRALITY?
THE DATA
Only 17% of customers that have had a bad support interaction are promoters, compared to 64% for those that have had a good interaction.

babbel.zendesk is here
NOT ALL ZENDESKS ARE CREATED EQUAL
THE DATA
Babbel self-selected into the education industry, but they operate much more like a massive freemium chat product Eg. WhatsApp

MEASURING SUPPORT SCALE

MEASURING SUPPORT WORKFORCE RESOURCES

MEASURING BUSINESS PROCESS MATURITY

SEGMENTING CUSTOMERS BASED ON 7 OPERATIONAL METRICS

TWELVE OPERATIONAL TYPES

BUILDING A BETTER BENCHMARK

WE’RE SHOWING YOU WHERE TO START

INSIGHTS THAT HELP YOU IMPROVE