Zambia Rpt01
15
A S S E S S M E N T O F P O L L U T I O N A N D V U L N E R A B I L I T Y O F W A T E R S U P P L Y A Q U I F E R S O F A F R I C A C I T I E S A C A S E F O R JOHN LAING, MASS MEDIA AND MISISI AREAS I N LUSAKA, ZAMBIA GRZ
-
Upload
chiso-phiri -
Category
Documents
-
view
270 -
download
0
description
Zambia Education.
Transcript of Zambia Rpt01

ASSESSMENT OF POLLUTION AND VULNERABILITY
OF WATER SUPPLY AQUIFERS OF AFRICA CITIES
A CASE FOR
JJOOHHNN LLAAIINNGG,, MMAASSSS MMEEDDIIAA AANNDD MMIISSIISSIIAARREEAASS
IN
LLUUSSAAKKAA,, ZZAAMMBBIIAA
GRZ
Woodlands
City Centre
BauleniJohn Laing
Chunga
Mandevu
Show grounds
Kamanga
Chawama
N
Emmasdale
Grea
t Nor
th R
oad
5 km
Great East Road
Mtendere
Built-up area
CITY BOUNDARY
Kanyama
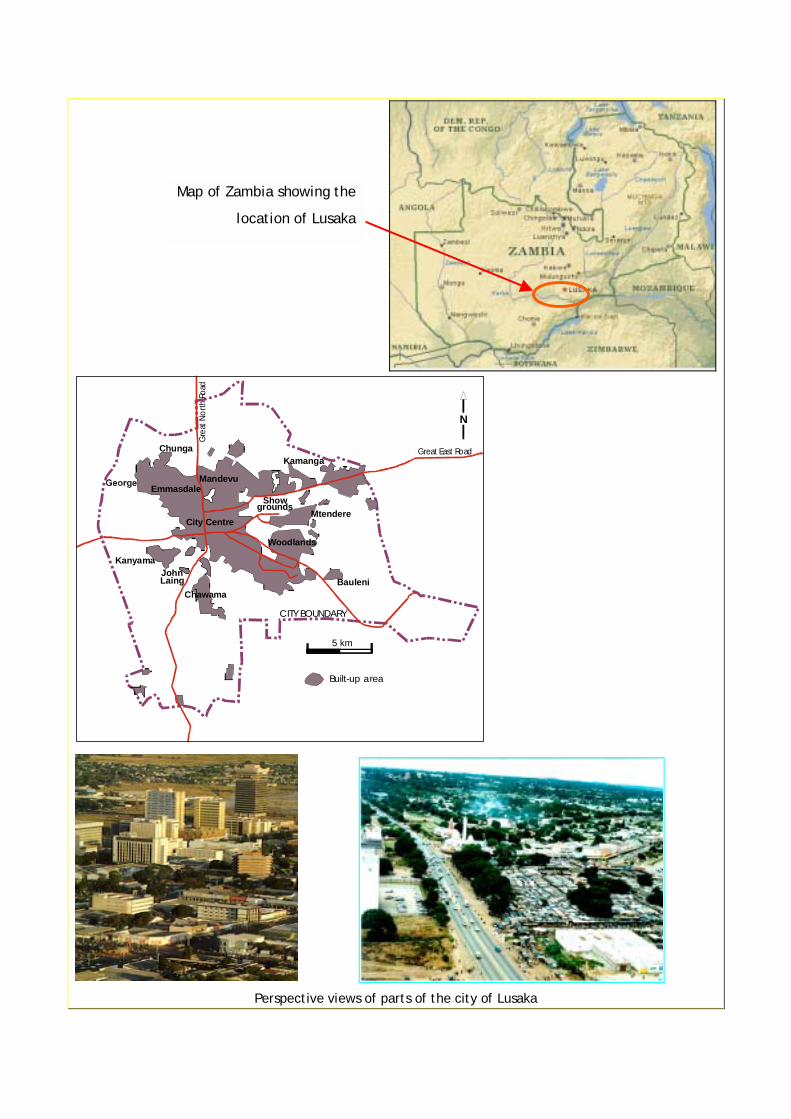
Perspective views of parts of the city of Lusaka
Map of Zambia showing the
location of Lusaka
Map of the City of Lusaka

Interim Report Page i Lusaka Project
ACKNOWLEDGEMENTS
This project was made possible by the generous support of United Nations Educational Scientific and
Cultural Organisation (UNESCO), United Nations Environment Programme (UNEP) and United Nations
Human Settlements Programme (UN-HABITAT) with support of the Government of the Republic of Zambia
(GRZ) through the Ministry of Energy and Water Development (MEWD).

A s s e s s m e n t o f p o l l u t i o n S t a t u s a n d V u l n e r a b i l i t y o f W a t e r S u p p l y A q u i f e r s o f A f r i c a n c i t i e s
Interim Report Page iii Lusaka Project
ABBREVIATIONS AND ACRONYMS
AET Actual Evapotranspiration
CBoH Central Board of Health
ECZ Environmental Council of Zambia
ETpot Potential Evapotranspiration
GRZ Government of the Republic of Zambia
GWR Groundwater Recharge
ITCZ Inter-Tropical Convergence Zone
LCC Lusaka City Council
LWSC Lusaka Water and Sewerage Company
SRO Surface Runoff
UN-HABITAT United Nations Human Settlement Programme (formerly UNCHS (Habitat))
UNEP United Nations Environment Programme
UNESCO United Nations Educational, Scientific and Cultural Organisation
UNZA University of Zambia
WHO World Health Organisation
ZAB Zaire Air Boundary
At a water point in Misisi Compound
A s s e s s m e n t o f p o l l u t i o n S t a t u s a n d V u l n e r a b i l i t y o f W a t e r S u p p l y A q u i f e r s o f A f r i c a n c i t i e s
Interim Report Page 1 Lusaka Project
1 INTRODUCTION
From its earliest days of settlement in the early 1900s, the suitability of Lusaka’s location has been a
source of great controversy, the major one having been hitherto the nature of the bedrock and the
hydrogeologic regime underlying the city. Even during the city’s founding, it usually experienced periodic
rises of the water table close to the ground surface, causing occasional flooding.
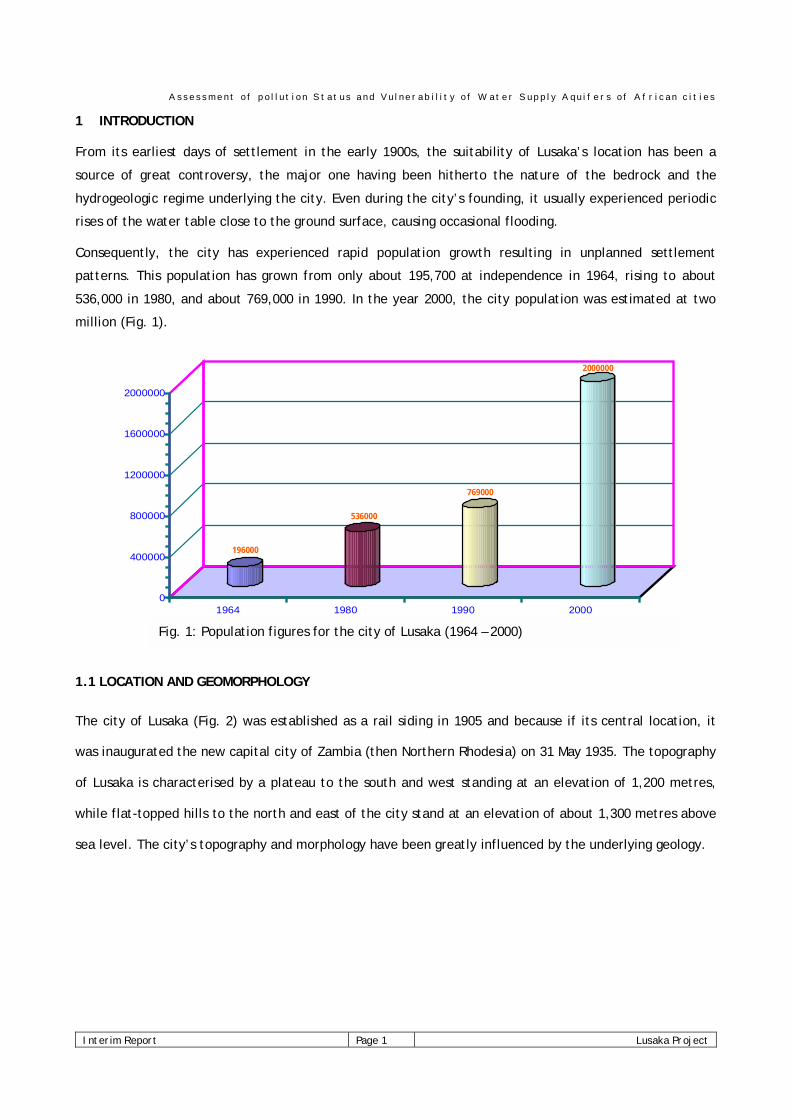
Consequently, the city has experienced rapid population growth resulting in unplanned settlement
patterns. This population has grown from only about 195,700 at independence in 1964, rising to about
536,000 in 1980, and about 769,000 in 1990. In the year 2000, the city population was estimated at two
million (Fig. 1).
1.1 LOCATION AND GEOMORPHOLOGY
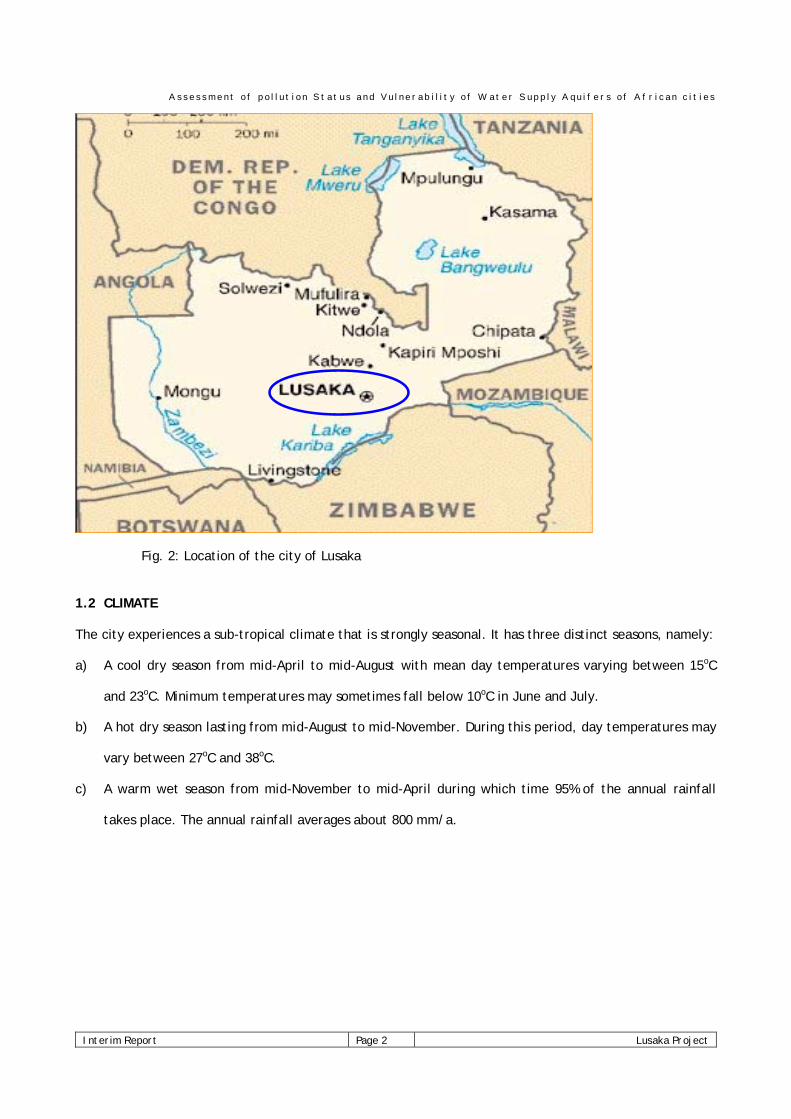
The city of Lusaka (Fig. 2) was established as a rail siding in 1905 and because if its central location, it
was inaugurated the new capital city of Zambia (then Northern Rhodesia) on 31 May 1935. The topography
of Lusaka is characterised by a plateau to the south and west standing at an elevation of 1,200 metres,
while flat-topped hills to the north and east of the city stand at an elevation of about 1,300 metres above
sea level. The city’s topography and morphology have been greatly influenced by the underlying geology.
Fig. 1: Population figures for the city of Lusaka (1964 – 2000)
196000
536000
769000
2000000
0
400000
800000
1200000
1600000
2000000
1964 1980 1990 2000
A s s e s s m e n t o f p o l l u t i o n S t a t u s a n d V u l n e r a b i l i t y o f W a t e r S u p p l y A q u i f e r s o f A f r i c a n c i t i e s
Interim Report Page 2 Lusaka Project
Fig. 2: Location of the city of Lusaka
1.2 CLIMATE
The city experiences a sub-tropical climate that is strongly seasonal. It has three distinct seasons, namely:
a) A cool dry season from mid-April to mid-August with mean day temperatures varying between 15oC
and 23oC. Minimum temperatures may sometimes fall below 10oC in June and July.
b) A hot dry season lasting from mid-August to mid-November. During this period, day temperatures may
vary between 27oC and 38oC.
c) A warm wet season from mid-November to mid-April during which time 95% of the annual rainfall
takes place. The annual rainfall averages about 800 mm/a.
A s s e s s m e n t o f p o l l u t i o n S t a t u s a n d V u l n e r a b i l i t y o f W a t e r S u p p l y A q u i f e r s o f A f r i c a n c i t i e s
Interim Report Page 3 Lusaka Project
2 GEOLOGY
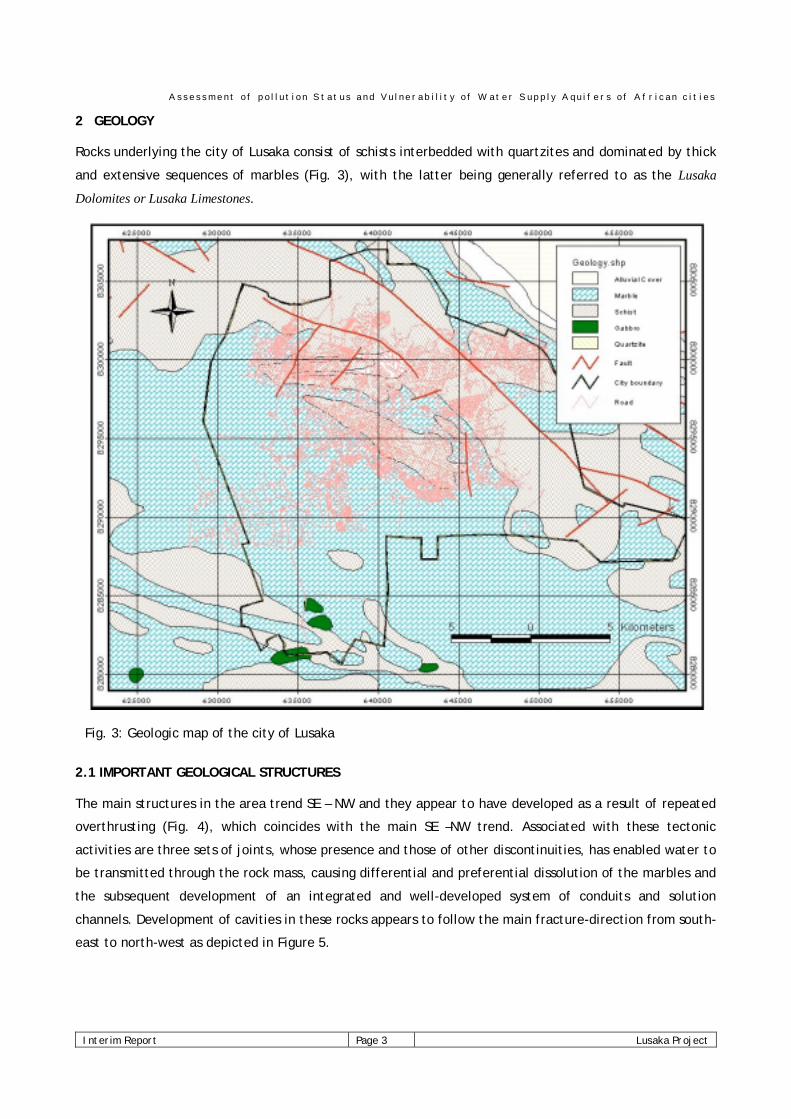
Rocks underlying the city of Lusaka consist of schists interbedded with quartzites and dominated by thick
and extensive sequences of marbles (Fig. 3), with the latter being generally referred to as the Lusaka
Dolomites or Lusaka Limestones.
Fig. 3: Geologic map of the city of Lusaka
2.1 IMPORTANT GEOLOGICAL STRUCTURES
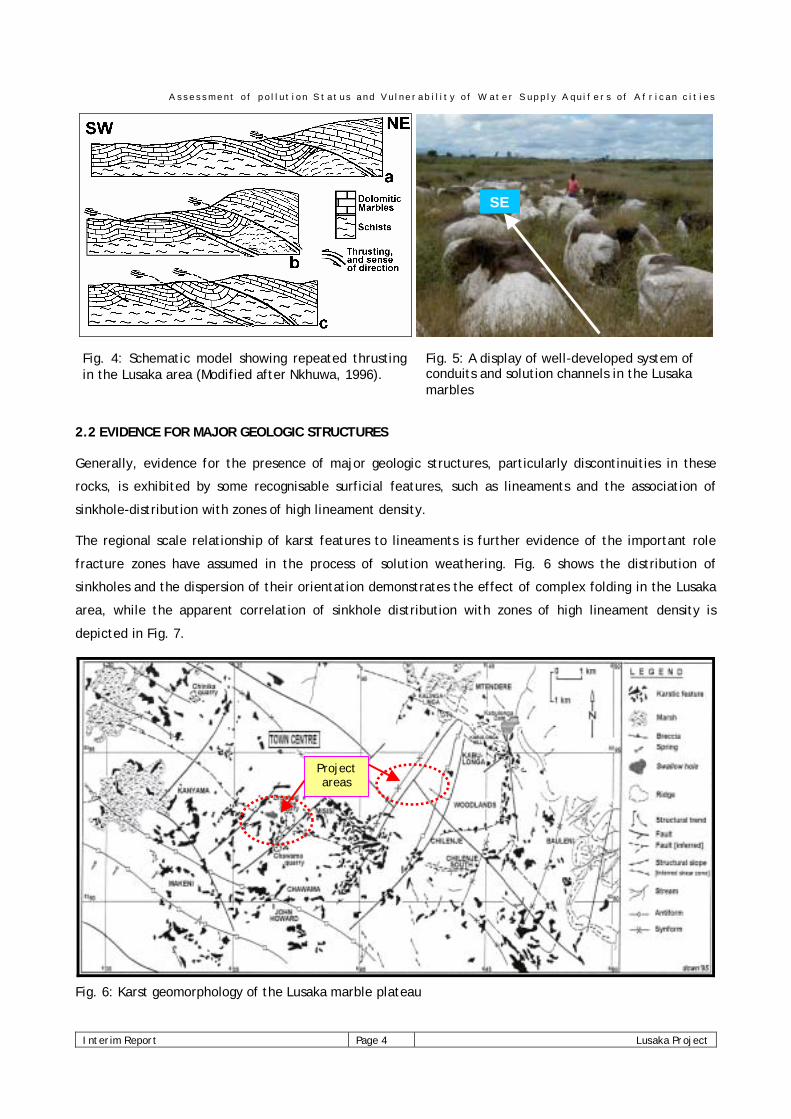
The main structures in the area trend SE – NW and they appear to have developed as a result of repeated
overthrusting (Fig. 4), which coincides with the main SE –NW trend. Associated with these tectonic
activities are three sets of joints, whose presence and those of other discontinuities, has enabled water to
be transmitted through the rock mass, causing differential and preferential dissolution of the marbles and
the subsequent development of an integrated and well-developed system of conduits and solution
channels. Development of cavities in these rocks appears to follow the main fracture-direction from south-
east to north-west as depicted in Figure 5.
A s s e s s m e n t o f p o l l u t i o n S t a t u s a n d V u l n e r a b i l i t y o f W a t e r S u p p l y A q u i f e r s o f A f r i c a n c i t i e s
Interim Report Page 4 Lusaka Project
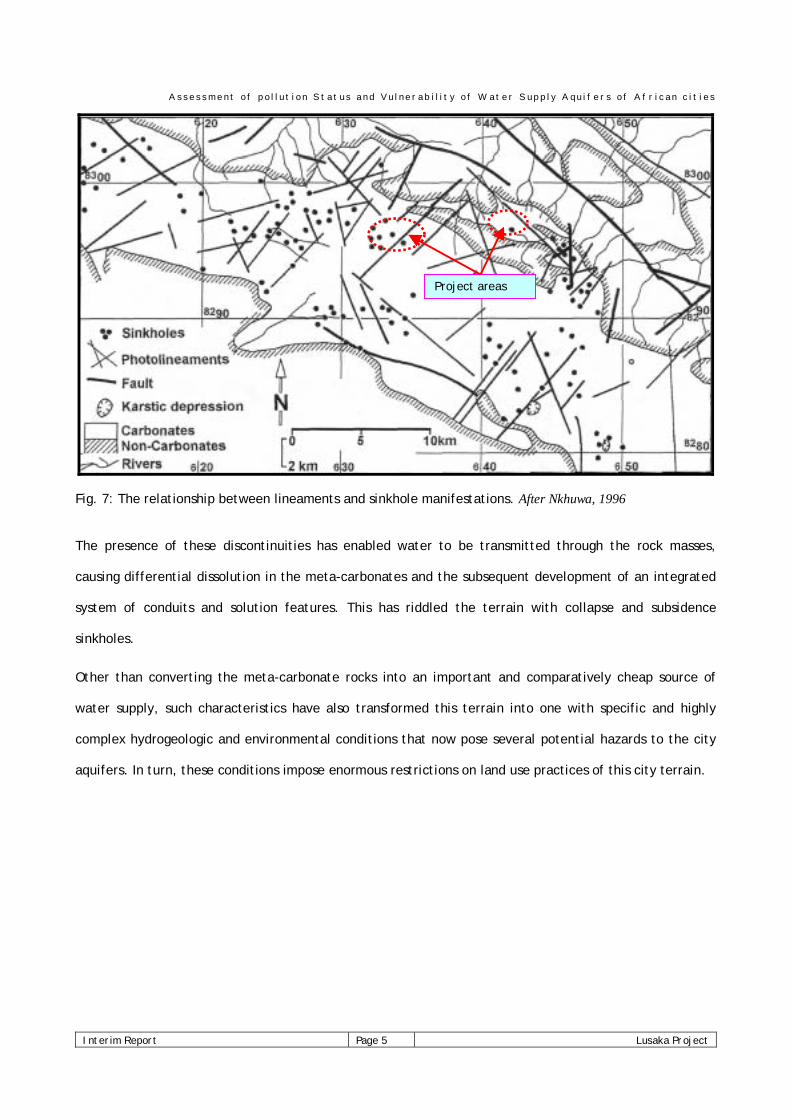
2.2 EVIDENCE FOR MAJOR GEOLOGIC STRUCTURES
Generally, evidence for the presence of major geologic structures, particularly discontinuities in these
rocks, is exhibited by some recognisable surficial features, such as lineaments and the association of
sinkhole-distribution with zones of high lineament density.
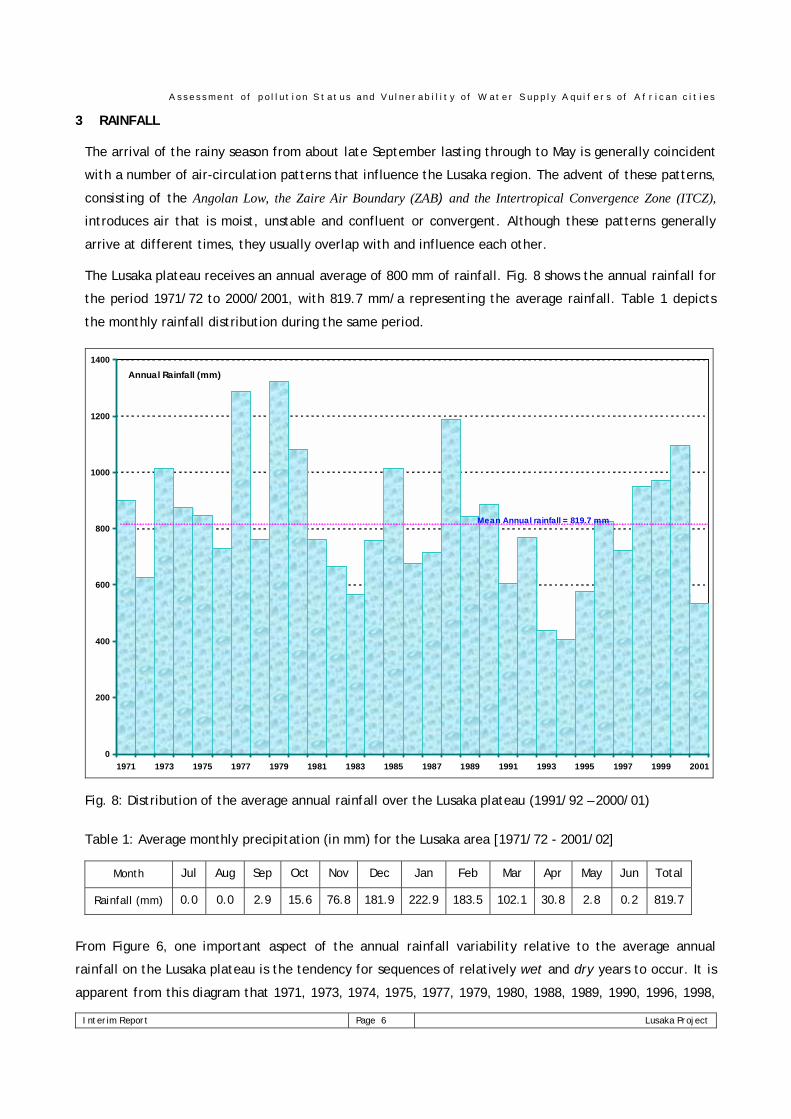
The regional scale relationship of karst features to lineaments is further evidence of the important role
fracture zones have assumed in the process of solution weathering. Fig. 6 shows the distribution of
sinkholes and the dispersion of their orientation demonstrates the effect of complex folding in the Lusaka
area, while the apparent correlation of sinkhole distribution with zones of high lineament density is
depicted in Fig. 7.
Fig. 6: Karst geomorphology of the Lusaka marble plateau
SE
Fig. 4: Schematic model showing repeated thrustingin the Lusaka area (Modified after Nkhuwa, 1996).
Fig. 5: A display of well-developed system ofconduits and solution channels in the Lusakamarbles
Projectareas
A s s e s s m e n t o f p o l l u t i o n S t a t u s a n d V u l n e r a b i l i t y o f W a t e r S u p p l y A q u i f e r s o f A f r i c a n c i t i e s
Interim Report Page 5 Lusaka Project
Fig. 7: The relationship between lineaments and sinkhole manifestations. After Nkhuwa, 1996
The presence of these discontinuities has enabled water to be transmitted through the rock masses,
causing differential dissolution in the meta-carbonates and the subsequent development of an integrated
system of conduits and solution features. This has riddled the terrain with collapse and subsidence
sinkholes.
Other than converting the meta-carbonate rocks into an important and comparatively cheap source of
water supply, such characteristics have also transformed this terrain into one with specific and highly
complex hydrogeologic and environmental conditions that now pose several potential hazards to the city
aquifers. In turn, these conditions impose enormous restrictions on land use practices of this city terrain.
Project areas
A s s e s s m e n t o f p o l l u t i o n S t a t u s a n d V u l n e r a b i l i t y o f W a t e r S u p p l y A q u i f e r s o f A f r i c a n c i t i e s
Interim Report Page 6 Lusaka Project
3 RAINFALL
The arrival of the rainy season from about late September lasting through to May is generally coincident
with a number of air-circulation patterns that influence the Lusaka region. The advent of these patterns,
consisting of the Angolan Low, the Zaire Air Boundary (ZAB) and the Intertropical Convergence Zone (ITCZ),
introduces air that is moist, unstable and confluent or convergent. Although these patterns generally
arrive at different times, they usually overlap with and influence each other.
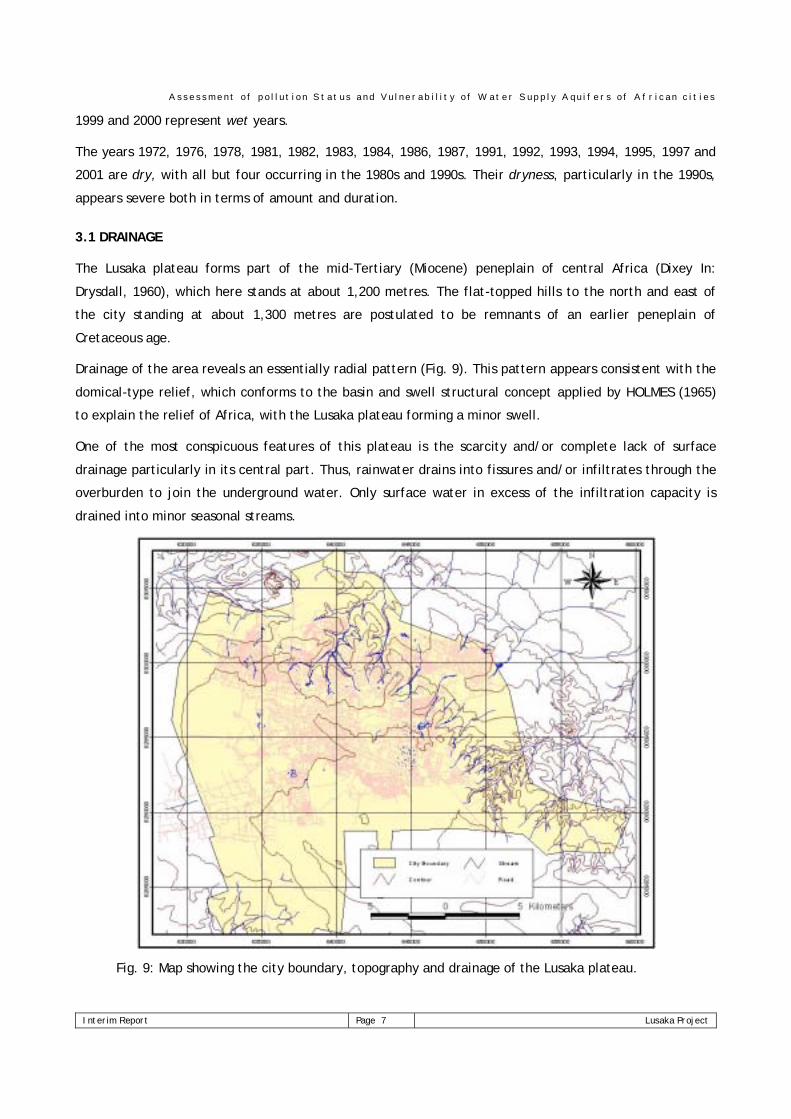
The Lusaka plateau receives an annual average of 800 mm of rainfall. Fig. 8 shows the annual rainfall for
the period 1971/72 to 2000/2001, with 819.7 mm/a representing the average rainfall. Table 1 depicts
the monthly rainfall distribution during the same period.
0
200
400
600
800
1000
1200
1400
1971 1973 1975 1977 1979 1981 1983 1985 1987 1989 1991 1993 1995 1997 1999 2001
Annual Rainfall (mm)
Mean Annual rainfall = 819.7 mm
Fig. 8: Distribution of the average annual rainfall over the Lusaka plateau (1991/92 – 2000/01)
Table 1: Average monthly precipitation (in mm) for the Lusaka area [1971/72 - 2001/02]
Month Jul Aug Sep Oct Nov Dec Jan Feb Mar Apr May Jun Total
Rainfall (mm) 0.0 0.0 2.9 15.6 76.8 181.9 222.9 183.5 102.1 30.8 2.8 0.2 819.7
From Figure 6, one important aspect of the annual rainfall variability relative to the average annual
rainfall on the Lusaka plateau is the tendency for sequences of relatively wet and dry years to occur. It is
apparent from this diagram that 1971, 1973, 1974, 1975, 1977, 1979, 1980, 1988, 1989, 1990, 1996, 1998,
A s s e s s m e n t o f p o l l u t i o n S t a t u s a n d V u l n e r a b i l i t y o f W a t e r S u p p l y A q u i f e r s o f A f r i c a n c i t i e s
Interim Report Page 7 Lusaka Project
1999 and 2000 represent wet years.
The years 1972, 1976, 1978, 1981, 1982, 1983, 1984, 1986, 1987, 1991, 1992, 1993, 1994, 1995, 1997 and
2001 are dry, with all but four occurring in the 1980s and 1990s. Their dryness, particularly in the 1990s,
appears severe both in terms of amount and duration.
3.1 DRAINAGE
The Lusaka plateau forms part of the mid-Tertiary (Miocene) peneplain of central Africa (Dixey In:
Drysdall, 1960), which here stands at about 1,200 metres. The flat-topped hills to the north and east of
the city standing at about 1,300 metres are postulated to be remnants of an earlier peneplain of
Cretaceous age.
Drainage of the area reveals an essentially radial pattern (Fig. 9). This pattern appears consistent with the
domical-type relief, which conforms to the basin and swell structural concept applied by HOLMES (1965)
to explain the relief of Africa, with the Lusaka plateau forming a minor swell.
One of the most conspicuous features of this plateau is the scarcity and/or complete lack of surface
drainage particularly in its central part. Thus, rainwater drains into fissures and/or infiltrates through the
overburden to join the underground water. Only surface water in excess of the infiltration capacity is
drained into minor seasonal streams.
Fig. 9: Map showing the city boundary, topography and drainage of the Lusaka plateau.
A s s e s s m e n t o f p o l l u t i o n S t a t u s a n d V u l n e r a b i l i t y o f W a t e r S u p p l y A q u i f e r s o f A f r i c a n c i t i e s
Interim Report Page 8 Lusaka Project
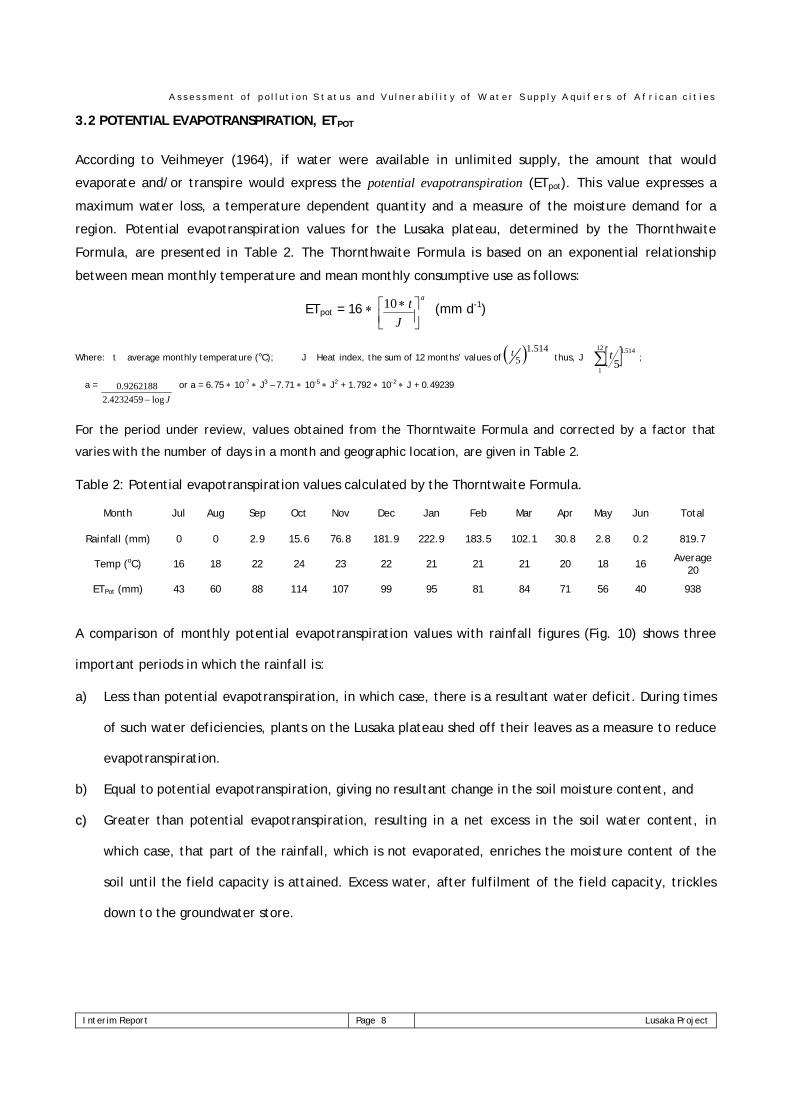
3.2 POTENTIAL EVAPOTRANSPIRATION, ETPOT
According to Veihmeyer (1964), if water were available in unlimited supply, the amount that would
evaporate and/or transpire would express the potential evapotranspiration (ETpot). This value expresses a
maximum water loss, a temperature dependent quantity and a measure of the moisture demand for a
region. Potential evapotranspiration values for the Lusaka plateau, determined by the Thornthwaite
Formula, are presented in Table 2. The Thornthwaite Formula is based on an exponential relationship
between mean monthly temperature and mean monthly consumptive use as follows:
ETpot = 16 ∗ a
Jt
∗10 (mm d-1)
Where: t � average monthly temperature (oC); J � Heat index, the sum of 12 months’ values of ( ) 514.15
t thus, J � [ ]∑12
1
514.1
5t ;
a =
Jlog4232459.29262188.0
− or a = 6.75 ∗ 10-7 ∗ J3 – 7.71 ∗ 10-5 ∗ J2 + 1.792 ∗ 10-2 ∗ J + 0.49239
For the period under review, values obtained from the Thorntwaite Formula and corrected by a factor that
varies with the number of days in a month and geographic location, are given in Table 2.
Table 2: Potential evapotranspiration values calculated by the Thorntwaite Formula.
Month Jul Aug Sep Oct Nov Dec Jan Feb Mar Apr May Jun Total
Rainfall (mm) 0 0 2.9 15.6 76.8 181.9 222.9 183.5 102.1 30.8 2.8 0.2 819.7
Temp (oC) 16 18 22 24 23 22 21 21 21 20 18 16 Average20
ETPot (mm) 43 60 88 114 107 99 95 81 84 71 56 40 938
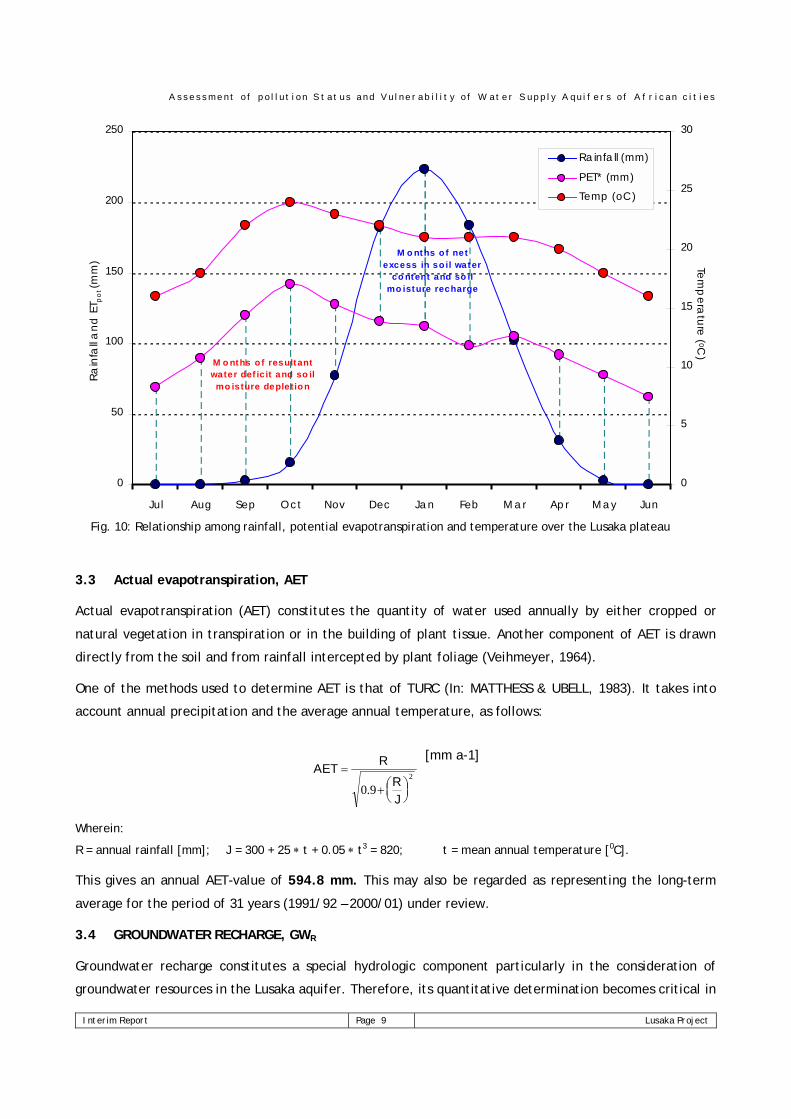
A comparison of monthly potential evapotranspiration values with rainfall figures (Fig. 10) shows three
important periods in which the rainfall is:
a) Less than potential evapotranspiration, in which case, there is a resultant water deficit. During times
of such water deficiencies, plants on the Lusaka plateau shed off their leaves as a measure to reduce
evapotranspiration.
b) Equal to potential evapotranspiration, giving no resultant change in the soil moisture content, and
cc)) Greater than potential evapotranspiration, resulting in a net excess in the soil water content, in
which case, that part of the rainfall, which is not evaporated, enriches the moisture content of the
soil until the field capacity is attained. Excess water, after fulfilment of the field capacity, trickles
down to the groundwater store.
A s s e s s m e n t o f p o l l u t i o n S t a t u s a n d V u l n e r a b i l i t y o f W a t e r S u p p l y A q u i f e r s o f A f r i c a n c i t i e s
Interim Report Page 9 Lusaka Project
0
50
100
150
200
250
Jul Aug Sep Oc t Nov Dec Ja n Feb M a r Ap r M a y Jun
0
5
10
15
20
25
30
Ra infa ll (mm)
PET* (mm)
Temp (oC)
Rain
fall a
nd E
T po
t (m
m) Tem
pera
ture ( 0C)
M o nths o f resultant water def ic it and so il
mo isture depletion
M o nths o f net excess in so il water
co ntent and so il mo isture recharge
3.3 Actual evapotranspiration, AET
Actual evapotranspiration (AET) constitutes the quantity of water used annually by either cropped or
natural vegetation in transpiration or in the building of plant tissue. Another component of AET is drawn
directly from the soil and from rainfall intercepted by plant foliage (Veihmeyer, 1964).
One of the methods used to determine AET is that of TURC (In: MATTHESS & UBELL, 1983). It takes into
account annual precipitation and the average annual temperature, as follows:
AET =
+
R
RJ
0 92
.
[mm a-1]
Wherein:
R = annual rainfall [mm]; J = 300 + 25 ∗ t + 0.05 ∗ t3 = 820; t = mean annual temperature [0C].
This gives an annual AET-value of 594.8 mm. This may also be regarded as representing the long-term
average for the period of 31 years (1991/92 – 2000/01) under review.
3.4 GROUNDWATER RECHARGE, GWR
Groundwater recharge constitutes a special hydrologic component particularly in the consideration of
groundwater resources in the Lusaka aquifer. Therefore, its quantitative determination becomes critical in
Fig. 10: Relationship among rainfall, potential evapotranspiration and temperature over the Lusaka plateau
A s s e s s m e n t o f p o l l u t i o n S t a t u s a n d V u l n e r a b i l i t y o f W a t e r S u p p l y A q u i f e r s o f A f r i c a n c i t i e s
Interim Report Page 10 Lusaka Project
the planning, exploitation use and possible threats to quality and quantity of the available water
resources.
In Lusaka, recharge is derived from rainfall, which falls directly on the plateau. When rain falls on the soil
surface, both gravity and capillary potential tend to cause its downward movement by infiltration.
Although earlier studies have indicated the recharge area to lie south-east of the city, the presence of
well-developed karstic features over the entire marble terrain would indicate that recharge occurs over
the whole city area underlain by the marble. The conspicuous lack of permanent surface-drainage over
the Lusaka plateau is evidence that the area imbibes most of the rain water that falls on it, which implies
that the area is mainly drained underground except during periods of excessive rains, when rates of
infiltration may be overwhelmed.
However, very little information is available about groundwater levels in the Lusaka aquifer because there
are piezometers or wells from which these recordings would be obtainable, other that those from which
groundwater is abstracted for supply to the city. In addition, measuring gauges that would allow
determination of groundwater levels as influenced by precipitation are not available. Consequently, the
estimation of groundwater recharge is only based upon general hydrological parameters, mainly
precipitation, potential and actual evapotranspiration.
On the basis of the acquired and calculated hydrologic data, the components of total runoff (STRO), which
is composed of groundwater recharge (GWR) and surface runoff (SRO), can be determined as follows:
GWR + SRO = R – AET (mm/a)
GWR + SRO = 819.7 – 594.8 (mm/a)
GWR + SRO = 224.9 (mm/a)
Because of problems pertaining to the partitioning of GWR and SRO, two optimistic assumptions have been
made as regards the amount of groundwater recharge:
• That the total runoff constitutes groundwater recharge. The ubiquitous lack of surface drainage on the
Lusaka plateau may justify the assumption.
• The calculated total runoff of 224.9 mm/a represents 27% of the annual rainfall. Coincidentally, Von
HOYER at al. (1978) and UBELL (1961) determined for the Lusaka and Hungarian karst areas,
respectively, that groundwater recharge contributes 22% of the total annual rainfall. Implicitly,
although the two areas lie in different geographic and climatic zones, similarities in quantities of
groundwater recharge would probably be compensated by components of runoff and
evapotranspiration. On the basis that 22% of the annual precipitation constitutes recharge, a resultant
annual replenishment to the groundwater store of 180 mm is attainable.
Thus, a conservative arithmetic average of 180 mm per annum constitutes the long-term groundwater
recharge for the Lusaka plateau. For a total surface area of 680 km2 for Lusaka and its environs, an
average of 122 ∗ 106 m3/a recharge may be assumed to have infiltrated to the groundwater store during
A s s e s s m e n t o f p o l l u t i o n S t a t u s a n d V u l n e r a b i l i t y o f W a t e r S u p p l y A q u i f e r s o f A f r i c a n c i t i e s
Interim Report Page 11 Lusaka Project
the period under review.
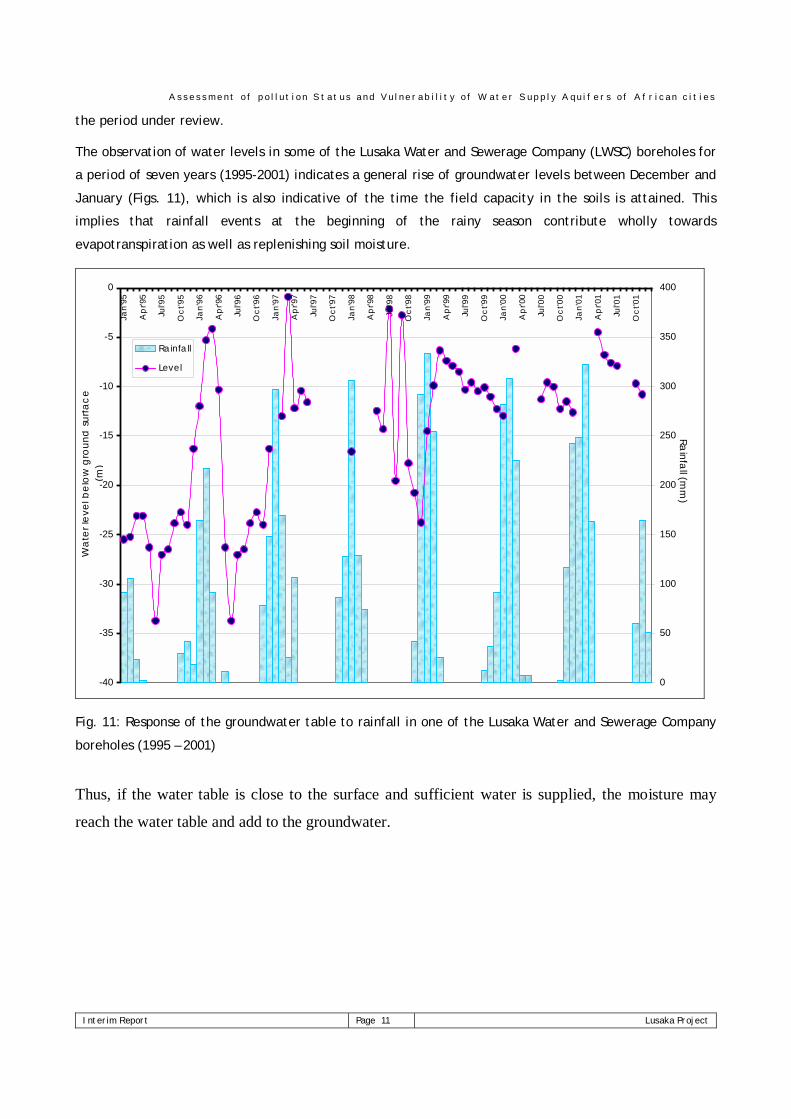
The observation of water levels in some of the Lusaka Water and Sewerage Company (LWSC) boreholes for
a period of seven years (1995-2001) indicates a general rise of groundwater levels between December and
January (Figs. 11), which is also indicative of the time the field capacity in the soils is attained. This
implies that rainfall events at the beginning of the rainy season contribute wholly towards
evapotranspiration as well as replenishing soil moisture.
-40
-35
-30
-25
-20
-15
-10
-5
0
Jan'
95
Ap
r'95
Jul'9
5
Oct
'95
Jan'
96
Ap
r'96
Jul'9
6
Oct
'96
Jan'
97
Ap
r'97
Jul'9
7
Oct
'97
Jan'
98
Ap
r'98
Jul'9
8
Oct
'98
Jan'
99
Ap
r'99
Jul'9
9
Oct
'99
Jan'
00
Ap
r'00
Jul'0
0
Oct
'00
Jan'
01
Ap
r'01
Jul'0
1
Oct
'01
0
50
100
150
200
250
300
350
400
Ra infa ll
Level
Rainfall (m
m)
Wat
er le
vel b
elow
gro
und
surfa
ce
(m)
Fig. 11: Response of the groundwater table to rainfall in one of the Lusaka Water and Sewerage Company
boreholes (1995 – 2001)
Thus, if the water table is close to the surface and sufficient water is supplied, the moisture may
reach the water table and add to the groundwater.