Zambeef Plc FY 2016 financial results (London)
32
25 November 2016 Zambeef Products plc (“Zambeef” or the “Group”) Results for the Year Ended 30 September 2016 Zambeef (AIM: ZAM), the fully integrated agri-business with operations in Zambia, Nigeria and Ghana, announce its final audited results for the year ended 30 September 2016. Financial Performance Summary * adjusted to exclude unrealised foreign exchange differences (Figures in 000’s) 2016 2015 % 2016 2015 % USD USD Change ZMW ZMW Change Turnover 219,404 220,237 (0.38)% 2,376,148 1,554,872 52.82% Gross Profits 80,881 94,436 (14.35)% 875,946 666,713 31.38% Operating Profits 17,321 22,958 (24.56)% 187,593 162,078 15.74% Profit before tax excluding exchange losses 7,040 15,126 (53.46)% 76,247 106,783 (28.60)% Realised exchange gains/(losses) 2,744 (13,525) 120.29% 29,719 (95,485) 131.12% Adjusted Profit/(Loss) before tax* 9,784 1,601 511.12% 105,966 11,298 837.92% Unrealised exchange gains/(losses) 2,643 (6,639) 139.81% 28,626 (46,873) 161.07% Profit/(loss) before tax 12,427 (5,038) 346.67% 134,592 (35,575) 478.33% Net cash inflow from operations activities 12,109 37,361 (67.59)% 131,148 263,775 (50.28)% Gross Profit Margin 36.86% 42.88% (14.04)% 36.86% 42.88% (14.04)% EBITDA Margin 13.32% 9.62% 38.46% 13.32% 9.62% 38.46% Debt/Equity (Gearing) 26% 60% (61.67)% 26% 60% (61.67)% Debt-To-EBITDA 1.73 4.24 (59.20) 1.73 4.24 (59.20)%
-
Upload
africanfinancials-investor-presentations -
Category
Investor Relations
-
view
91 -
download
1
Transcript of Zambeef Plc FY 2016 financial results (London)

25 November 2016
Zambeef Products plc (“Zambeef” or the “Group”)
Results for the Year Ended 30 September 2016
Zambeef (AIM: ZAM), the fully integrated agri-business with operations in Zambia, Nigeria and Ghana, announce its final audited results for the year ended 30 September 2016.
Financial Performance Summary
* adjusted to exclude unrealised foreign exchange differences
(Figures in 000’s)
2016 2015 %
2016 2015 %
USD USD Change
ZMW ZMW Change
Turnover 219,404 220,237 (0.38)%
2,376,148 1,554,872 52.82%
Gross Profits 80,881 94,436 (14.35)%
875,946 666,713 31.38%
Operating Profits 17,321 22,958 (24.56)%
187,593 162,078 15.74%
Profit before tax excluding exchange losses 7,040 15,126 (53.46)%
76,247 106,783 (28.60)%
Realised exchange gains/(losses) 2,744 (13,525) 120.29%
29,719 (95,485) 131.12%
Adjusted Profit/(Loss) before tax* 9,784 1,601 511.12%
105,966 11,298 837.92%
Unrealised exchange gains/(losses) 2,643 (6,639) 139.81%
28,626 (46,873) 161.07%
Profit/(loss) before tax 12,427 (5,038) 346.67%
134,592 (35,575) 478.33%
Net cash inflow from operations activities 12,109 37,361 (67.59)%
131,148 263,775 (50.28)%
Gross Profit Margin 36.86% 42.88% (14.04)%
36.86% 42.88% (14.04)%
EBITDA Margin 13.32% 9.62% 38.46%
13.32% 9.62% 38.46%
Debt/Equity (Gearing) 26% 60% (61.67)% 26% 60% (61.67)%
Debt-To-EBITDA 1.73 4.24 (59.20) 1.73 4.24 (59.20)%
Note the figures for 2015 exclude the figures for Zamanita as these are shown in the Statement of Comprehensive Income as income from discontinued operations after the tax line. Key Highlights
• 10.8 per cent. growth in cold chain volumes has delivered a strong financial performance leading to record profitability for the Group:
Profit After Tax of ZMW157.4 million (USD14.5 million), compared with a loss of ZMW54.6 million (USD7.7 million) for the same period last year;
EBITDA has increased by 111.1 per cent. in ZMW terms (38 per cent. in USD), from ZMW149.5 million to ZMW316.6 million (USD21.2 million to USD29.2 million );
Administrative costs as a percentage of turnover improved from 28.2 per cent. (2015) to 25.7 per cent. (2016), as a result of more effective cost management;
Group debt reduced by 23.6 per cent. from USD72 million (2015) to USD55 million (2016); Gearing reduced significantly from 60.3 per cent. (2015) to 26 per cent. (2016); Debt-to-EBITDA ratio has improved from 4.2 (2015) to 1.7 (2016).
• Successful completion of the USD65 million CDC Group PLC equity investment into Zambeef. • Cash settlement (USD23.4m) of RCL Foods Ltd put options in Zam Chick Ltd and Zamhatch Ltd, giving
Zambeef full control of its poultry operations. • Strong performance from the Cold Chain Food Products division, achieved through a market-driven
strategy involving continued roll out of new macro outlets. • During the year, Zambeef’s total retail network increased from 154 outlets to 171 outlets. • Final settlement reached with the Zambia Revenue Authority (ZRA) over the historical and disputed
Zamanita Ltd tax liability, resulting in a write-back to the profit and loss account of approximately ZMW34 million (USD3.1 million).
Commenting on the results, Zambeef Chairman Dr. Jacob Mwanza, said: “Zambeef has ended the financial year in a strong position. A 10.8 per cent. volume growth in cold chain food products and a 15.3 per cent. volume growth in stock feed has delivered record profits through the efficient delivery of our strategic priorities, and a platform has been created from which to continue sustainable long term growth. The balance sheet has been significantly strengthened as a result of CDC having made a substantial investment in the Group. Zambeef now has the ability once again to invest in growing its business, accelerate the roll-out of its new macro stores and expand its cold chain foods production capacity in order to meet the growing demand for its products, both in Zambia and in the surrounding SADC/COMESA regions. Zambeef operates in a dynamic expanding market, where the demand for its products, both locally and in neighboring countries, is expected to grow rapidly in order to meet the needs of an increasing population. We are entering into a new era for Zambeef, and I am confident that the Group is well positioned to take advantage of the opportunities that lie ahead.”
For further information, please contact: Zambeef Products plc Tel: +260 (0) 211 369003 Carl Irwin, Joint Chief Executive Officer Francis Grogan, Joint Chief Executive Officer Strand Hanson Limited (Nominated Adviser) Tel: +44 (0) 20 7409 3494 James Spinney

Ritchie Balmer Frederick Twist Finncap Tel: +44 (0) 20 7220 0500 Joanna Scott Chris Raggett Raymond Greaves Powerscourt Tel: +44 (0)20 7250 1446 Nick Dibden Nick Brown Pangaea Securities Peter Zulu Tel: +260 (0) 211 220707 Wendy Tembo Tel: +260 (0) 211 238709 Notes to Editors The Zambeef Group is one of the largest integrated cold chain food producers in Zambia, involved in the production, processing, distribution and retailing of beef, chicken, pork, milk, eggs, dairy products, fish, flour and stock feed. The Group also has large cereal row cropping operations (principally maize, soya beans and wheat), with approximately 7,971 hectares of row crops under irrigation, which are planted twice a year and a further 8,623 hectares of rain-fed/dry-land crops available for planting each year. The Group is also expanding its West Africa operations in Nigeria and Ghana. The Group employed an average of 6,000 employees in the period. Further information can be found on www.zambeefplc.com This publication is in line with standard practice for London Stock Exchange.

ZAMBEEF PRODUCTS PLC AND ITS SUBSIDIARIES
CHAIRMAN’S REPORT
Overview
The 2016 financial year has been a momentous year for the Zambeef Group.
The improved performance that the Group reported in its interim results statement in June continued into the second half and
resulted in the Group reporting record profits for the year.
We signed an investment agreement with CDC Group Plc (CDC) under which they have become a significant and supportive
shareholder in the Group and provided us with USD65 million of new capital. We have utilized part of this amount to regain
100 per cent. control of our poultry operations, a key strategic area for our business, through the cash settlement of the two
put options held by RCL Foods Ltd over their 49 per cent. shareholding in Zam Chick Ltd, and 51 per cent. shareholding in
Zamhatch Ltd.
Operational results
It is pleasing to be able to report the Group’s Profit After Tax of ZMW157.4 million (USD14.5 million), compared with a loss
of ZMW54.6 million (USD7.7 million) for the same period last year.
Volumes handled by our retail business grew 11 per cent. with a particularly strong performance from the value added branded
dairy products.
EBITDA has increased by 111.1 per cent. in Zambian Kwacha terms (38 per cent. in US Dollars), from ZMW149.5 million to
ZMW316.6 million (USD21.2 million to USD29.2 million). Administrative costs as a percentage of turnover improved from
28.2 per cent. in the year-ended 30 September 2015 to 25.7 per cent. for the current year, as a result of more effective cost
management.
These results have been helped by the final settlement reached with the Zambia Revenue Authority (ZRA) over an historical
disputed Zamanita Ltd tax liability, resulting in a write-back to the profit and loss account of approximately ZMW34 million
(USD3.1 million).
The strong operational performance during the year, together with the cash injection from CDC, has significantly strengthened
Zambeef’s balance sheet and enabled the Group to settle, in cash, the USD23.4 million due to RCL Foods Ltd for settlement
of the put options it held and exercised over Zam Chick Ltd and Zamhatch Ltd, as well as fund Group capital expenditure of
ZMW178.8 million (USD16.5 million), particularly focused on the roll out of the macro retail stores as well as reducing Group
debt by 24 per cent. from USD72 million to USD55 million.
Operating environment
After volatile performance in the 2015 financial year, the Zambian Kwacha has shown improved stability during the period
under review.
The closing rate at 30 September 2016 was 10.01ZMW/USD, as against 12.02ZMW/USD at 30 September 2015. However,
the average rate for this year was 10.83ZMW/USD, compared with 7.06ZMW/USD in 2015, which had a negative impact on
the US Dollar turnover and gross profit growth comparisons compared with last year.
Zambia is regarded as one of Africa’s most mature and stable political democracies. In support of this reputation, peaceful
General Elections were held during September 2016, in which President Edgar Chagwa Lungu’s ruling Patriotic Front party
was returned to office for a further five years. The President has committed to addressing the Balance of Payments deficit and
to a balanced budget.
To this end, the government has sought support from the International Monetary Fund (IMF), which should lead to
continuing Kwacha stability and improved economic growth.
Investment in Zambeef by CDC Group Plc (CDC)
In line with our objective of forging strategic alliances that will contribute to Zambeef’s sustained long-term growth,
negotiations with CDC were successfully concluded in September of this year. Under the agreement, CDC has invested
USD65 million in Zambeef through the issue of 52,601,435 new Ordinary Shares at a price of USD0.18 per share, for a total
of USD9.5 million, and 100,057,658 Convertible Redeemable Preference Shares at a price of USD0.55 per share for a total of
USD55.5 million.
On the assumption that CDC converts its Convertible Redeemable Preference Shares to Ordinary Zambeef shares, it would
potentially hold 38 per cent. of the Company’s enlarged share capital. While this will result in a dilution of existing
shareholders, it was the view of the board that the benefits that will flow from this significant inward investment will create
additional shareholder value that will offset the effects of the dilution. At an Extraordinary General Meeting held on 8
September, existing shareholders voted unanimously to approve this transaction. CDC’s voting rights are currently limited to
34.85 per cent.
CDC, established in 1948, is the UK’s leading development finance institution, active in Africa and South Asia. Its strategic
vision is to help grow businesses, create jobs and make a lasting difference to the people in those parts of the world where they
are active. Zambeef is proud to have them as a major shareholder. We welcome CDC’s David Osborne and Tim Pollock who
have joined the Zambeef board, and look forward to their contribution. The experience they bring to the board, together with
the commitment by CDC to encouraging best practice in relation to the social and environmental impact, operational safety
and corporate governance in all the companies in which they invest, will assist Zambeef in its quest to be a leader in Africa in
these areas.
Strategic priorities
Zambeef’s vision is to become a major provider of Cold Chain Food Products in Zambia and the Southern African
Development Community (SADC) / Common Market for Eastern and Southern Africa (COMESA) regions, where there is a
population of 450 million people. In pursuit of this vision, the Group is committed to a number of strategic priorities:
1. Expansion of our retail network
The Zambeef retail network encompasses 56 meat butchery concessions in the Shoprite chain of supermarkets in Zambia,
Nigeria and Ghana, and 115 stand-alone Company stores, located principally in Zambia. The retail network is the strategic
distribution channel for the sale of the broad range of Cold Chain products including beef, poultry meat, pork products and
dairy products, stockfeed and day-old chicks, produced within the Group.
This market-driven retail approach is Zambeef’s critical differentiator in the Zambian market, the source of a major
competitive advantage, and makes Zambeef a significant retailer on the African continent.
The new concept: large format ‘macro stores’, has been a success, and we will continue to roll out new outlets of this type in
the coming year. The retail network is expected to have a major pull effect on our Cold Chain, stockfeed and day-old chick
production in the coming years.
2. Expansion of our Cold Chain production facilities
The strong market demand fuelling our continued retail chain growth is dependent on consistent supplies of product to satisfy
existing and potential customer demand. To this end there is a need to continually maintain and, where necessary, expand
capacity in our Cold Chain, stockfeed and day-old chick production facilities. Accordingly, in the coming year, capital
expenditure will be allocated to complete the stockfeed plant expansion at Mpongwe; the installation of a new rotary milking
parlour at Kalundu Dairy; the expansion of the day-old chick hatchery; the expansion of the Masterpork processing plant and
to increase the Zam Chick slaughtering and processing capacity.
Budgeted capital expenditure spend for the coming year is expected to be approximately USD21 million.
3. Reducing gearing
It is pleasing to report that debt levels have been reduced further during the past year, with the debt-to-equity ratio reducing
from 60 per cent. to 26 per cent. The Group’s underlying operating cash flows should permit it to continue to reduce gearing
over the coming year.

4. Dividend policy
With the improved operational performance of the Group, and the strengthening of the balance sheet through the CDC
transaction, the board’s intention is to adopt a policy of regular progressive dividend payments to shareholders from 2017
onwards.
Board changes
During the year, Irene Muyenga and Adam Fleming retired from the board, having both served as directors for 12 years. We
thank Irene and Adam for their valued contributions over this period, and wish them both well in the future. We welcome
Graham Clark to the board. Graham brings a considerable depth of experience of African agribusiness and the foods sector.
Following completion of the CDC investment, we are pleased to welcome CDC directors, David Osborne and Tim Pollock, to
the board and look forward to benefitting from their insight and contribution.
Conclusion and outlook
Zambeef has ended the financial year in a strong position.
Operationally, it has delivered record profits through efficient delivery of its strategic priorities, and a platform has been
created from which to continue sustainable long term growth.
The balance sheet has been significantly strengthened as a result of CDC having made a substantial investment in the Group.
Zambeef now has the ability once again to invest in growing its business, accelerate the roll-out of its new macro stores and
expand its production capacity in order to meet the growing demand for its products, both in Zambia and in the surrounding
SADC/COMESA regions.
We have an outstanding management team, and loyal, committed and motivated staff, whose efforts have driven us to this
position of strength. I thank them all for their valued contribution.
Zambeef operates in a dynamic expanding market, where the demand for its products, both locally and in neighboring
countries, is expected to grow rapidly in order to meet the needs of an increasing population.
We are entering into a new era for Zambeef, and I am confident that the Group is well positioned to take advantage of the
opportunities that lie ahead.
Finally, I would like to thank my board colleagues for their support and commitment during the year.
Dr. Jacob Mwanza
Chairman
22 November 2016

ZAMBEEF PRODUCTS PLC AND ITS SUBSIDIARIES
JOINT CHIEF EXECUTIVES’ REVIEW
Overview
The 2016 financial year has been a highly successful year for Zambeef Products PLC, with the Group achieving a record profit
after tax of ZMW157.4 million (USD14.5 million) compared with a loss of ZMW54.6 million (USD7.7 million) in the previous
year.
EBITDA increased in Zambian Kwacha terms by 111.7 per cent. from ZMW149.5 million to ZMW316.6 million and in US
Dollar terms by 38 per cent. from USD21.2 million to USD29.2 million.
The adjusted profit after tax, adjusting for unrealised exchange gains and losses as well as the tax write-back in relation to the
former Zamanita edible oils division, increased from ZMW6.6 million to ZMW95.2 million and in US Dollars from USD0.9
million to USD8.8 million.
These strong financial results are an endorsement of the board’s strategy to focus on its retailing and Cold Chain Food
Products divisions while implementing its strategy to reduce gearing and address exposure to currency fluctuations.
The year has also seen a significant strengthening of the Zambeef balance sheet and improvement in liquidity ratios. The
current ratio has increased from 1.0 to 1.58, and the debt-to-equity ratio has fallen from 60 per cent. to 26 per cent. The total
debt-to-EBITDA ratio has dropped from 4.24 to 1.73, while total Group debt has reduced from USD72 million to USD55
million. This places the Group in a strong position to continue to grow its retailing and distribution network, both in Zambia
and West Africa, and expand its Cold Chain Food Product operations.
Not only has 2016 been a successful year in terms of financial performance but it has also been a transformational year for
Zambeef as a Company.
Negotiations were concluded with CDC Group Plc, which have resulted in CDC becoming a significant shareholder in
Zambeef, through the investment of USD65 million of new capital. CDC is the UK’s developmental finance institution which
invests in Africa and South Asia to help to grow businesses, create jobs and make a lasting difference to the people in those
parts of the world. CDC has a long and successful history in Zambia, and Zambeef is pleased to welcome it as a shareholder of
the Group.
Acquisition of 100 per cent. of Zam Chick Ltd and Zamhatch Ltd
On 23 March 2016, Zambeef received notification from RCL Foods Ltd that it was exercising its put options, requiring
Zambeef to acquire its shares in Zam Chick Ltd and Zamhatch Ltd, either in exchange for Zambeef shares or cash. The total
settlement value of the put options was agreed as USD23,385,604 with either party having the right to pursue a disputed
amount of around USD1 million, which both parties believed due to them. The Zambeef board took the view that the
settlement of the put options in Zambeef shares would have resulted in a dilution to the existing shareholders of Zambeef
without any balance sheet benefits flowing from such a dilution, and hence resolved to settle the put options in cash. This was
completed on 22 September 2016, resulting in Zam Chick Ltd and Zamhatch Ltd becoming 100 per cent. subsidiaries of
Zambeef Products PLC.
Zam Chick Ltd is the company through which Zambeef conducts its chicken broiler operations, while Zamhatch Ltd is a
green field company which commissioned one of the best hatcheries in the region in September 2015, has a breeder farm and
is in the process of completing a 12,000 ton per month modern stockfeed plant, due for completion in early 2017. The
combined turnover of these operations was ZMW279 million (USD25.7 million) and a net profit of ZMW44 million (USD4.1
million). These are core parts of the business. The chicken broiler operation is a material part of the Cold Chain Food Product
operations, while the hatchery and stockfeed operations are key growth areas of the business with Zambeef using its new
macro stores to sell stockfeed and day-old chicks to small-scale farmers and the informal sector. These will be important
growth areas for Zambeef going forward, driven by the expansion of the Zambeef retail network, and hence Zambeef
shareholders will benefit from having these poultry and stockfeed operations fully owned by Zambeef.

Investment by CDC Group PLC (CDC) into Zambeef
On 8 September 2016, Zambeef shareholders approved the investment by CDC of USD65 million in Zambeef through the
issue of 52,601,435 new Ordinary Shares at a price of USD0.18 each, for a total consideration of USD9.5 million and the
issuance of 100,057,658 Convertible Redeemable Preference Shares at a price of USD0.55 each for a total of USD55.5 million.
The ordinary shares issued represent 17.5 per cent. of the enlarged ordinary issued share capital of Zambeef. The preference
shares are convertible in whole or in part by CDC into ordinary shares on a one-for-one basis for the first eight years and
thereafter on a basis of 3.0833 ordinary shares for each preference share. Zambeef has the right to redeem all or part of the
preference shares at the redemption price, which will give CDC a 12 per cent. compounded return on investment. The zero-
coupon preference shares pay a dividend only if a dividend is paid to ordinary shareholders, and in such cases, the dividend
per share will be the same as that for ordinary shares. CDC has voting rights over 34.85 per cent. of the Company’s share
capital.
CDC is the UK’s developmental finance institution established in 1948 and which currently has net assets of around USD5
billion. CDC has a long and successful history of investing in Zambia, which includes having been involved with the
establishment of Chilanga Cement, Zambia Sugar, Kariba Dam and Mpongwe Farm. CDC prioritises investing in
agribusinesses because it is a sector where growth leads to jobs and it helps provide access to safe and nutritious food to meet
expanding populations’ food requirements. Zambeef is pleased to welcome CDC as a supportive long-term investor in
Zambeef.
The proceeds from this investment by CDC have been used to settle the put options to RCL Foods Ltd of USD23.4 million
and reduce debt. In addition, it will allow Zambeef to grow its business and in particular its retailing platform and Cold Chain
Food business as well as expanding its stockfeed operations.
Expansion of retail network
In line with the strategic priorities set out in our 2015 Annual Report, a key focus area for the year has been the expansion of
Zambeef’s retailing activities. During the year, Zambeef’s total retail network increased from 154 outlets to 171 outlets. This
expansion has been driven both by the expansion of the Shoprite retail network both in Zambia, Nigeria and Ghana, as well as
Zambeef expanding its own retail network, with the building of new Zambeef macro outlets. Shoprite is the South African
supermarket giant with which Zambeef has a concession agreement for its in-store meat market butcheries in Zambia and
West Africa.
During the year, Shoprite opened five new stores in Zambia, six in Nigeria and one in Ghana all with Zambeef concessions
within. Zambeef opened 11 new stores in Zambia, while six outdated Zambeef stores were relocated or closed during the year.
All of the new Zambeef stores are on premises owned by Zambeef and are outlets that have been built and fitted to Zambeef’s
specifications with the Group’s own construction, IT and refrigeration teams, ensuring cost effective and timely delivery of our
roll-out programme. During the next financial year, we expect this momentum to continue, with Shoprite planning an
additional four stores in Zambia, four in Nigeria and one in Ghana. In addition, Zambeef is looking to roll out an additional
ten Zambeef macro stores.
Going forward, the retail operations will remain the key focus for Zambeef. The retailing expansion will be the engine room
that will drive Zambeef’s growth and ensure the Group plays a leading role in providing food to a fast growing and urbanising
population in Zambia, West Africa and the wider SADC/COMESA regions. Due to the strategic focus on retailing, Zambeef
has restructured its retailing operations so that the entire Zambian retailing and distribution functions are now operated
through a wholly owned subsidiary called Zambeef Retailing Ltd. In addition, the segmental report now separates out the
Zambian retailing activities, allowing a greater focus on this critical area of the business.
In order to ensure constant supply for this expansion of its retailing operations, Zambeef will continue to invest in its Cold
Chain Food Product divisions as well as the hatchery and stockfeed operations, as all of these operations are driven by the
retail expansion. In addition, Zambeef plans to construct a large new depot outside Kitwe in order to improve distribution to
the expanding Copperbelt retailing network, which will improve efficiencies in terms of supplying the Copperbelt.
It is worth noting that 56.7 per cent. of Zambeef’s total group revenue is generated from retail sales through its own retail
network, making Zambeef a major retailer on the continent.

New stockfeed plant
Zambeef’s stockfeed operation, which trades under the brand name Novatek, has been the fastest growing and top performing
division within the Group this year, helped by the expansion of the retail network and growth in demand from ruminant,
monogastric and aquaculture producer customers in both the formal and informal sectors. The existing plant in Lusaka is
operating at full capacity and is not able to keep up with demand. Following Zambeef’s acquisition of 100 per cent. of
Zamhatch, Novatek will now take full control of the modern new stockfeed plant that Zamhatch will be commissioning in
early 2017, nearly doubling the production capacity of Novatek.
Accounting for the new stockfeed plant will be consolidated into the Novatek division. The new plant, which is being built at
Zambeef’s Mpongwe Farm, will ensure Novatek has one plant in Lusaka to supply Lusaka, the southern half of Zambia and
the southern export markets, and a second plant which is ideally placed to supply the Copperbelt market, the northern half of
Zambia and the northern export markets. This will save in transport costs and further improve the efficiencies of Novatek.
The second plant will cost a further USD2 million to complete and will be operational in February 2017. The additional
capacity will facilitate the continued growth of Novatek sales of stockfeed and Zambeef’s day-old chicks in the Zambian
market. External sales to ruminant, monogastric and aquaculture producer customers now account for 71.2 per cent. of
Novatek’s annual volumes.
Debt reduction
A key strategic objective of the Zambeef board for the last two years has been to reduce the gearing of Zambeef and address
exposure to currency fluctuations which have distorted financial performance in recent years. During the 2015 financial year,
net debt was reduced from USD118.5 million to USD72.3 million. It is pleasing to again have reduced this net debt position to
USD55.5 million at 30 September 2016. Zambeef is now in a position where it has a strong balance sheet with a debt-to-equity
ratio of 26 per cent. and a total debt to EBITDA ratio of 1.73. The Group’s underlying operating cash flows should permit it
to continue to reduce gearing further over the coming year.
Outlook and conclusion
Zambeef is clearly focused on areas of operations where it considers itself the market leader in the region. These involve the
retailing of beef, chicken, pork, eggs, dairy products and fish; the management of a vertically integrated proteins supply chain
covering production, processing and distribution; as well as the production of stockfeed and day-old chicks for both external
and internal channels. These activities constitute the core areas of our business and Zambeef will continue to invest in growing
these areas. Expanding the retail network, which is the engine room that will drive the growth in the core operations, continues
to be the priority for the foreseeable future.
Zambeef is fortunate to be operating in areas with some of the fastest growing urbanising populations in the world. The
consequence of this is that the demand for food is growing rapidly and the challenge will be for Zambeef to continue to invest
in its core operations to meet this growing demand. Zambeef aims to make its Zambian operations an efficient production
base from which it can become a leading supplier of affordable proteins to the wider SADC/COMESA regions. These regions
have a population of around 450 million people and as a result, are an exciting market for Zambeef going forward. It is
pleasing to note that Zambeef is making real progress in becoming a food provider to these wider regions and is exporting to
Zimbabwe, Angola, Democratic Republic of Congo, Burundi, Botswana and Malawi. Continued efforts will be made to
continue to grow exports into these regions.
It has been a difficult year for the Nigerian business and economy. However, Shoprite are continuing their impressive
expansion and, as a result, our operations will continue to grow strongly. With an established presence in one of Africa’s
biggest economies, Zambeef is well positioned in Nigeria and believes this business will become a material part of Zambeef’s
operations going forward.
It has been an extremely busy two years at Zambeef. We feel incredibly proud of our entire 6,000 workforce and what they
have achieved over this period. Our operations are becoming world-class and as a result we believe Zambeef can become a
meaningful food provider to the wider SADC/COMESA regions as well as West Africa. The Company is well placed to take
full advantage of the significant opportunities that exist and can look forward to the future with a great deal of confidence.
We thank our entire workforce for the contribution they have all made to the success of Zambeef. In addition, we would like
to thank our Chairman, Dr. Jacob Mwanza, as well as our entire board of directors for their valuable guidance and support.

Carl Irwin/Francis Grogan
Joint CEOs
22 November 2016
OPERATIONAL AND FINANCIAL REVIEW
The 2016 financial year has seen Zambeef achieve strong volume growth in its operations. The Cold Chain Food production
operations achieved volume growth of around 11 per cent. while the stockfeed volumes increased by 15 per cent. largely
driven by the retailing expansion during the year. This has been coupled with strong cost control, resulting in administration
costs excluding depreciation as a percentage of turnover reducing from 28.2 per cent. to 25.8 per cent. This strong volume
growth with strict cost controls has contributed to a record profit after tax of ZMW157 million (USD14.5 million).
The new hatchery, which came on line during the year, contributed ZMW11.7 million (USD1.0 million) to these profits in its
first year of operation, and is likely to prove to be a significant profit contributor in the future. We believe Zambeef’s share of
the Zambian proteins market continues to grow. Shareholders can be satisfied with this performance, particularly with the
average exchange rate for the year having depreciated by 53.4 per cent. from 7.06ZMW/USD in 2015 to 10.82ZMW/USD in
2016, and Zambia’s economy having slowed down in the last year.
Turnover for the year increased by 52.8 per cent. in ZMW but reduced slightly by 0.4 per cent. in USD as a result of the
depreciation of the ZMW. The decision to retain 12,000 tons of wheat in stock from the 2016 harvest, in order to mill into
flour for sale during 2017, has impacted negatively on sales growth for 2016, but will benefit next year’s turnover results. The
improved margin from selling the wheat as flour will also be reflected in next year’s profits.
Operating profits increased by 15.7 per cent. in ZMW but down by 24.6 per cent. in USD, while operating profit margins
reduced from 10.4 per cent. to 7.9 per cent. This reduction was primarily driven by the cropping division, whose income is
largely received in USD, having benefited in 2015 from a depreciating ZMW currency and been negatively impacted on in
2016 by an appreciating currency. This division was also impacted by wheat prices reducing from around USD440/ton to
USD400/ton.
EBITDA increased by 111.7 per cent. in ZMW and 38 per cent. in USD, and the EBITDA margin increased from 9.6 per
cent. to 13.3 per cent. Adjusted profits after tax increased from ZMW6.6 million (USD0.9 million) to ZMW95.2 million
(USD8.8 million). Debt levels have come down from USD118.5 million in 2014 to USD55.5 million in 2016. This will
significantly reduce the impact of exchange rate movements on future results.
Zambeef aims to build on these strong results by growing the business through the continued expansion of its retailing
network and Cold Chain Food Products division, while maintaining margins and controlling administration costs.
Exchange rate movements
During the year, the ZMW initially depreciated from 12.02ZMW/USD at 30 September 2015 to just under 15.00ZMW/USD
in November 2015. Since then we have seen an appreciation of the ZMW with the exchange rate finishing the financial year at
10.01ZMW/USD. The effect of this was that the average exchange rate for the year was 10.83ZMW/USD - a 53.4 per cent.
depreciation on the average rate of 7.06ZMW/USD for 2015.
The exchange rates for the last two years are summarised in the table below:
2016 2015
ZMW/USD ZMW/USD
Average rate for year 10.83 7.06
Closing rate at 30 September 10.01 12.02
The depreciating ZMW exchange rate during 2016 has made our products competitive into the region, as our prices have
reduced in USD terms. This has helped towards achieving our long term goal of being a major food producer for the wider
SADC/COMESA regions.
The appreciation of the ZMW year end exchange rates has resulted in both realised and unrealised exchange gains being
recorded of ZMW58.4 million (USD5.4 million). It is worth noting that the business has a natural hedge in that most of its
cropping income is USD denominated. Hence the exchange gains from an appreciating currency are partially offset by
reduction in cropping profits.
The ZMW has been stable for the last six months and it is hoped that this stability will continue. With Zambeef having
significantly reduced its gearing over the last two years, the potential impact arising from exchange rate movements has been
significantly reduced.
ADMINISTRATION AND OVERHEAD COSTS
Strong control of administrative and overhead costs has continued to be a key focus of management, with these costs
excluding depreciation as a percentage of turnover reducing from 28.2 per cent. in 2015 to 25.7 per cent. in 2016. The control
of these costs will remain a priority. However, there will be upward pressure on these costs during 2017. The largest single cost
is wages and salaries, which accounts for 50.3 per cent. of total administration and overhead costs. Fuel represents five per
cent. of costs. Since the year end we have already seen an increase in the fuel price of 30 per cent., with further increases
expected as the Government fuel subsidy is reduced. Electricity represents 5.8 per cent. of costs and large price increases are
also expected as Zambia moves towards a market-based electricity pricing policy. Zambia is expected to have good rains this
year, which should be positive for power generation. As a result it is hoped that power load shedding will reduce which will, to
a degree, offset these cost increases.
FINANCE COSTS
This period has seen finance costs for the Group increasing from ZMW55.3 million (USD7.8 million) to ZMW111.3 million
(USD10.3 million). This large increase was made up of three parts:
Following the rapid depreciation of the ZMW at the end of 2015, Zambeef moved USD short term facilities to ZMW
at significantly higher interest rates, resulting in a larger proportion of the short term debt being at higher interest
rates;
ZMW interest rates increased from an average of around 16 per cent. in 2015 to around 28 per cent. in 2016 as
strong measures were implemented to curb inflation and stabilize the ZMW; and
The average exchange rate for the year depreciated by 53.4 per cent., resulting in the interest on dollar facilities
increasing significantly in ZMW.
With the Zambeef Group debt levels having reduced during the year these costs are expected to reduce substantially during
2017.
CAPITAL EXPENDITURE
Total capital expenditure during the year was ZMW178.8 million (USD16.5 million), with Zambeef having paid a further
USD23.4 million for the acquisition of 49 per cent. of Zam Chick Ltd and 51 per cent. of Zamhatch Ltd, which amount
included the repayment of shareholder loans to RCL Foods Ltd.
The largest item of capital expenditure was ZMW22.6 million (USD2.09 million) on the new stockfeed plant in Zamhatch Ltd,
which will commence operations in February 2017 and increase the Novatek capacity from 140,000 tons of stockfeed per year
to 250,000 tons per year. Farming replacement capex during the year was ZMW19.9 million (USD1.8 million), ensuring our
farming operations remain world class assets. Capex of ZMW15.6 million (USD1.4 million) was spent increasing capacity at
Masterpork, which remains one of the fastest growing parts of Zambeef’s operations. Capex on Zampalm was ZMW13.5
million (USD1.2 million) in order to fund a further 150 hectares of palms planted during the year. The egg layer operations
invested ZMW13.5 million (USD1.2 million) to increase the layer operations from 153,000 to 273,000 layers in order to meet
the demand for eggs. ZMW7.5 million (USD0.69 million) was spent on building four new macro stores opened during the
year, and ZMW7.8 million (USD0.72 million) on the new Kitwe processing plant, which will open during 2017, and allow for
the expansion of our Copperbelt operations and supply into North Western Province in Zambia. ZMW7.1 million (USD0.7
million) was spent on upgrading our distribution fleet, and ZMW4.1 million (USD0.4 million) on a new beef abattoir in Mbala
to ensure the supply of beef.
For 2017, the capex budget is approximately USD21 million, with the main focus being on investments in the high return parts
of the business. The main projects include:
USD3.2 million on the construction of a further ten macro outlets and the completion of the Kitwe processing plant;
USD1.5 million on expanding the dairy operations;
USD2.8 million on completing the second stockfeed plant;

USD1.7 million expanding the hatchery from 215,000 day-old chicks per week to 315,000;
USD1 million in Nigeria to ensure we have the capacity to keep growing in line with the Shoprite expansion;
USD1.5 million on the delivery and implementation of the ESAP; and
USD0.6 million on upgrade and expansion of Masterpork operations.
It is worth noting that that as part of the CDC investment in Zambeef, we will be following programs to ensure we work
towards meeting the highest international standards in terms of Quality and Control, Health and Safety, Environmental and
Social Policy and Animal Welfare. It is pleasing to report that Novatek is now the only stockfeed operation in Zambia which is
ISO 9001 compliant, while Zamleather has received ISO 20345 certification for some of its boots for the mining sector, and
our beef, dairy and pork operations are working on programs for FSSC 22000 compliance which will ensure that the highest
international standards are met in food safety.
DIVISIONAL PERFORMANCE
The board has decided to simplify the reporting structure of the business to provide a clearer strategic focus on performance
of core activities for Zambeef’s shareholders and potential investors. Henceforth, the Group will report upon five key business
units being “Retail”, “Cold Chain Food Production”, “Stockfeed”, “Row Crops” and “Other Businesses” (which include
Milling and Zamleather), rather than reporting upon 16 divisions. In 2017, it is our intention to start to publish the EBT and
return on capital employed within each of the five units.
The two tables below provide a summary of the segmental and divisional performance.
Table 1: Segmental turnover and gross profit in ZMW
Division
2016
Turnover
ZMW
2015
Turnover
ZMW
% Change
2015 to
2016
2016 Gross
Profit ZMW
2015 Gross
Profit ZMW
% Change
2015 to 2016
Retailing - Zambia 1,131,524 843,269 34.2% 132,872 96,299 38.0%
Retailing - West Africa 216,535 129,951 66.6% 48,827 31,124 56.9%
Total Retailing 1,348,059 973,220 38.5% 181,699 127,423 42.6%
Cold Chain Food Production 1,134,693 850,986 33.3% 266,080 195,487 36.1%
Stockfeed 697,563 407,863 71.0% 143,916 73,821 95.0%
Row Crops 413,391 397,125 4.1% 251,860 253,326 -0.6%
Others 213,964 307,389 -30.4% 32,391 64,555 -49.8%
Total 3,807,669 2,936,583 29.7% 875,946 714,612 22.6%
Less: Intra/Inter Group Sales (1,431,522) (1,128,268) 26.9% -
Less: Discontinued Operations (253,443)
(47,899)
Group Total 2,376,148 1,554,872 52.8% 875,946 666,713 31.4%
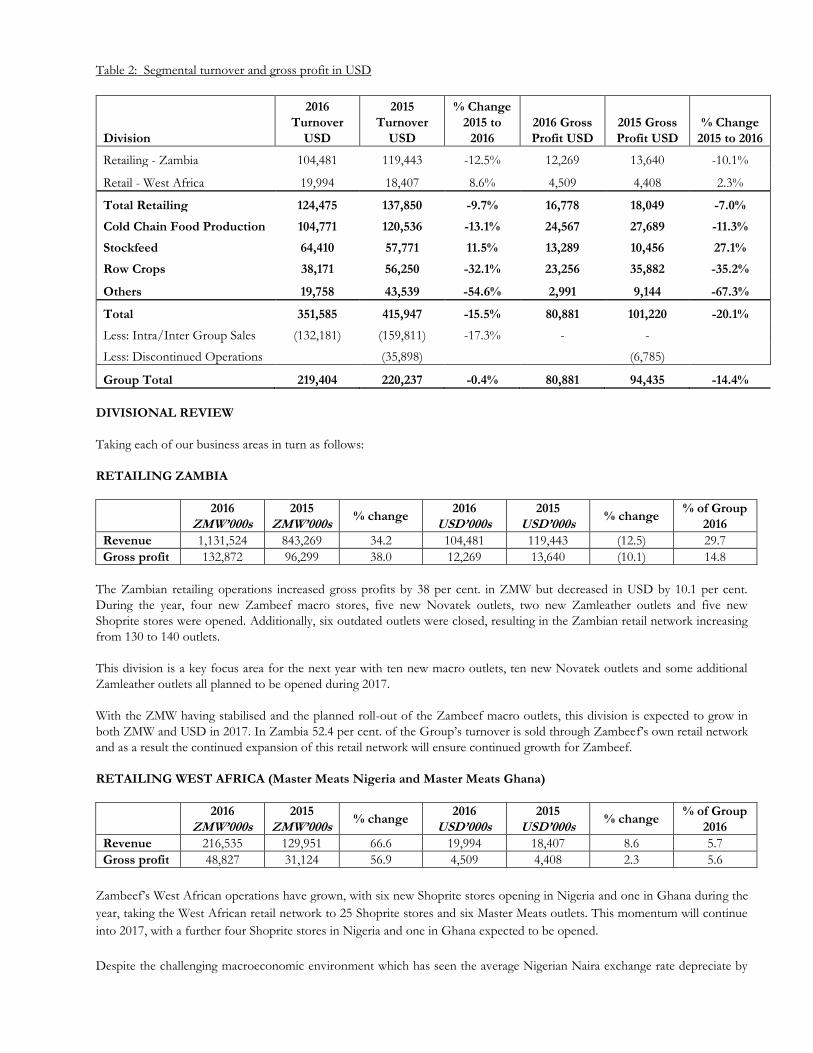
Table 2: Segmental turnover and gross profit in USD
Division
2016
Turnover
USD
2015
Turnover
USD
% Change
2015 to
2016
2016 Gross
Profit USD
2015 Gross
Profit USD
% Change
2015 to 2016
Retailing - Zambia 104,481 119,443 -12.5% 12,269 13,640 -10.1%
Retail - West Africa 19,994 18,407 8.6% 4,509 4,408 2.3%
Total Retailing 124,475 137,850 -9.7% 16,778 18,049 -7.0%
Cold Chain Food Production 104,771 120,536 -13.1% 24,567 27,689 -11.3%
Stockfeed 64,410 57,771 11.5% 13,289 10,456 27.1%
Row Crops 38,171 56,250 -32.1% 23,256 35,882 -35.2%
Others 19,758 43,539 -54.6% 2,991 9,144 -67.3%
Total 351,585 415,947 -15.5% 80,881 101,220 -20.1%
Less: Intra/Inter Group Sales (132,181) (159,811) -17.3% - -
Less: Discontinued Operations
(35,898)
(6,785)
Group Total 219,404 220,237 -0.4% 80,881 94,435 -14.4%
DIVISIONAL REVIEW
Taking each of our business areas in turn as follows:
RETAILING ZAMBIA
2016
ZMW’000s
2015
ZMW’000s % change
2016
USD’000s 2015
USD’000s % change
% of Group
2016
Revenue 1,131,524 843,269 34.2 104,481 119,443 (12.5) 29.7
Gross profit 132,872 96,299 38.0 12,269 13,640 (10.1) 14.8
The Zambian retailing operations increased gross profits by 38 per cent. in ZMW but decreased in USD by 10.1 per cent.
During the year, four new Zambeef macro stores, five new Novatek outlets, two new Zamleather outlets and five new
Shoprite stores were opened. Additionally, six outdated outlets were closed, resulting in the Zambian retail network increasing
from 130 to 140 outlets.
This division is a key focus area for the next year with ten new macro outlets, ten new Novatek outlets and some additional
Zamleather outlets all planned to be opened during 2017.
With the ZMW having stabilised and the planned roll-out of the Zambeef macro outlets, this division is expected to grow in
both ZMW and USD in 2017. In Zambia 52.4 per cent. of the Group’s turnover is sold through Zambeef’s own retail network
and as a result the continued expansion of this retail network will ensure continued growth for Zambeef.
RETAILING WEST AFRICA (Master Meats Nigeria and Master Meats Ghana)
2016
ZMW’000s
2015
ZMW’000s % change
2016
USD’000s 2015
USD’000s % change
% of Group
2016
Revenue 216,535 129,951 66.6 19,994 18,407 8.6 5.7
Gross profit 48,827 31,124 56.9 4,509 4,408 2.3 5.6
Zambeef’s West African operations have grown, with six new Shoprite stores opening in Nigeria and one in Ghana during the
year, taking the West African retail network to 25 Shoprite stores and six Master Meats outlets. This momentum will continue
into 2017, with a further four Shoprite stores in Nigeria and one in Ghana expected to be opened.
Despite the challenging macroeconomic environment which has seen the average Nigerian Naira exchange rate depreciate by
64 per cent., and the Ghana Cedi by 7.3 per cent. to the USD, as well as severe fuel and foreign exchange shortages, it is
pleasing to report an increase in gross profits of 56.9 per cent. in ZMW and 2.3 per cent. in USD. West Africa accounts for 5.6
per cent. of Group gross profits.
Nigeria remains one of the largest markets in Africa with a population of around 180 million people. Although it has been a
difficult year in Nigeria, Zambeef is well positioned in this market. With Shoprite’s continued expansion and the Nigerian
macroeconomic fundamentals improving, these operations are expected to become material for Zambeef.
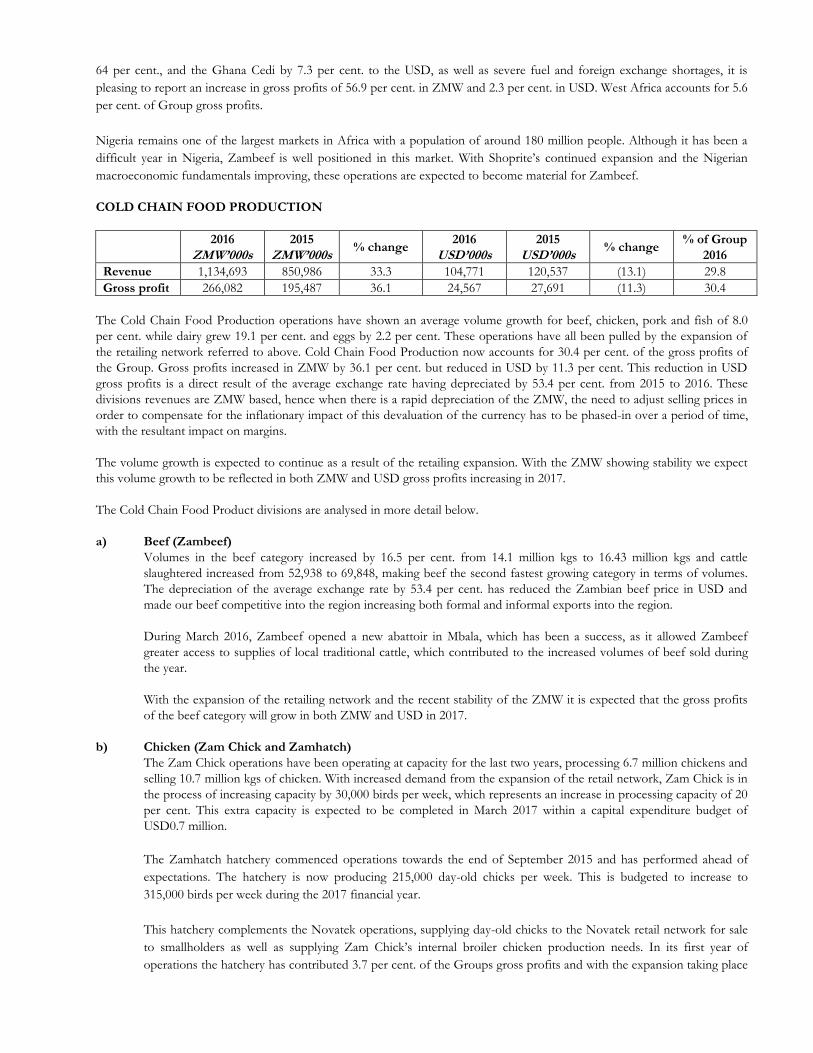
COLD CHAIN FOOD PRODUCTION
2016
ZMW’000s
2015
ZMW’000s % change
2016
USD’000s 2015
USD’000s % change
% of Group
2016
Revenue 1,134,693 850,986 33.3 104,771 120,537 (13.1) 29.8
Gross profit 266,082 195,487 36.1 24,567 27,691 (11.3) 30.4
The Cold Chain Food Production operations have shown an average volume growth for beef, chicken, pork and fish of 8.0
per cent. while dairy grew 19.1 per cent. and eggs by 2.2 per cent. These operations have all been pulled by the expansion of
the retailing network referred to above. Cold Chain Food Production now accounts for 30.4 per cent. of the gross profits of
the Group. Gross profits increased in ZMW by 36.1 per cent. but reduced in USD by 11.3 per cent. This reduction in USD
gross profits is a direct result of the average exchange rate having depreciated by 53.4 per cent. from 2015 to 2016. These
divisions revenues are ZMW based, hence when there is a rapid depreciation of the ZMW, the need to adjust selling prices in
order to compensate for the inflationary impact of this devaluation of the currency has to be phased-in over a period of time,
with the resultant impact on margins.
The volume growth is expected to continue as a result of the retailing expansion. With the ZMW showing stability we expect
this volume growth to be reflected in both ZMW and USD gross profits increasing in 2017.
The Cold Chain Food Product divisions are analysed in more detail below.
a) Beef (Zambeef)
Volumes in the beef category increased by 16.5 per cent. from 14.1 million kgs to 16.43 million kgs and cattle
slaughtered increased from 52,938 to 69,848, making beef the second fastest growing category in terms of volumes.
The depreciation of the average exchange rate by 53.4 per cent. has reduced the Zambian beef price in USD and
made our beef competitive into the region increasing both formal and informal exports into the region.
During March 2016, Zambeef opened a new abattoir in Mbala, which has been a success, as it allowed Zambeef
greater access to supplies of local traditional cattle, which contributed to the increased volumes of beef sold during
the year.
With the expansion of the retailing network and the recent stability of the ZMW it is expected that the gross profits
of the beef category will grow in both ZMW and USD in 2017.
b) Chicken (Zam Chick and Zamhatch)
The Zam Chick operations have been operating at capacity for the last two years, processing 6.7 million chickens and
selling 10.7 million kgs of chicken. With increased demand from the expansion of the retail network, Zam Chick is in
the process of increasing capacity by 30,000 birds per week, which represents an increase in processing capacity of 20
per cent. This extra capacity is expected to be completed in March 2017 within a capital expenditure budget of
USD0.7 million.
The Zamhatch hatchery commenced operations towards the end of September 2015 and has performed ahead of
expectations. The hatchery is now producing 215,000 day-old chicks per week. This is budgeted to increase to
315,000 birds per week during the 2017 financial year.
This hatchery complements the Novatek operations, supplying day-old chicks to the Novatek retail network for sale
to smallholders as well as supplying Zam Chick’s internal broiler chicken production needs. In its first year of
operations the hatchery has contributed 3.7 per cent. of the Groups gross profits and with the expansion taking place
will continue to be a fast growing part of Zambeef’s business.
With extra capacity coming on line for both the chicken broiler operations and hatchery in 2017, the Group’s chicken
operations can look forward to growth in 2017.
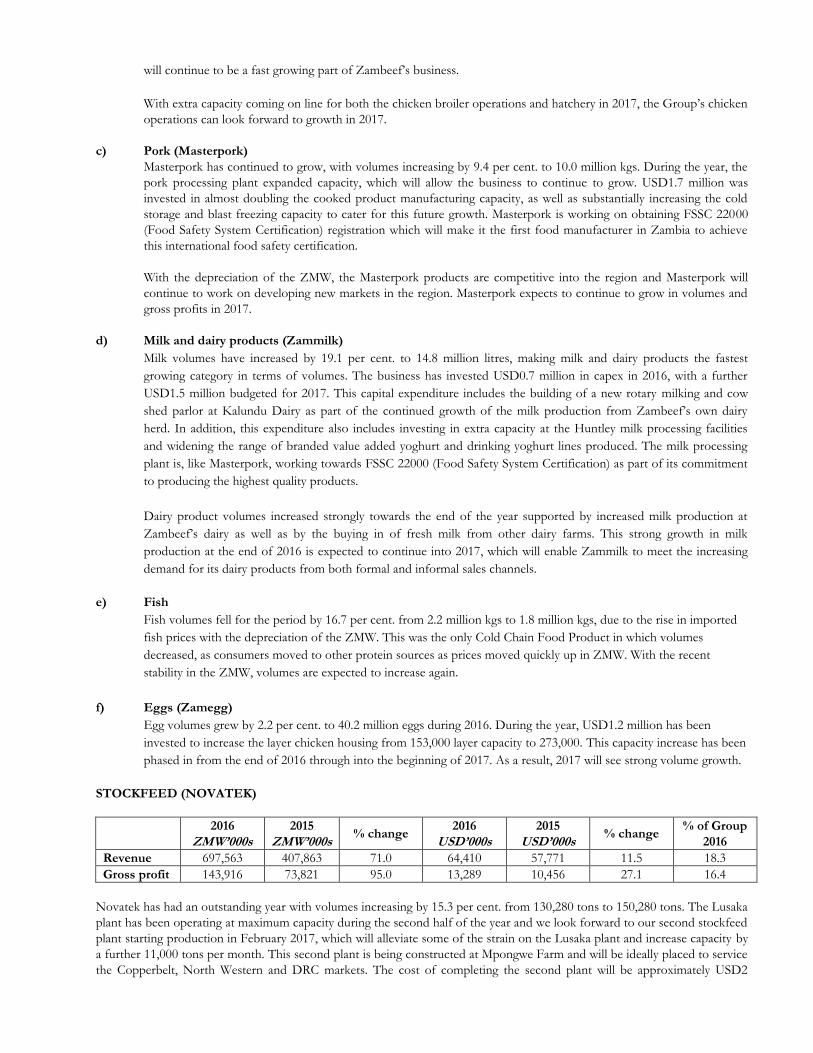
c) Pork (Masterpork)
Masterpork has continued to grow, with volumes increasing by 9.4 per cent. to 10.0 million kgs. During the year, the
pork processing plant expanded capacity, which will allow the business to continue to grow. USD1.7 million was
invested in almost doubling the cooked product manufacturing capacity, as well as substantially increasing the cold
storage and blast freezing capacity to cater for this future growth. Masterpork is working on obtaining FSSC 22000
(Food Safety System Certification) registration which will make it the first food manufacturer in Zambia to achieve
this international food safety certification.
With the depreciation of the ZMW, the Masterpork products are competitive into the region and Masterpork will
continue to work on developing new markets in the region. Masterpork expects to continue to grow in volumes and
gross profits in 2017.
d) Milk and dairy products (Zammilk)
Milk volumes have increased by 19.1 per cent. to 14.8 million litres, making milk and dairy products the fastest
growing category in terms of volumes. The business has invested USD0.7 million in capex in 2016, with a further
USD1.5 million budgeted for 2017. This capital expenditure includes the building of a new rotary milking and cow
shed parlor at Kalundu Dairy as part of the continued growth of the milk production from Zambeef’s own dairy
herd. In addition, this expenditure also includes investing in extra capacity at the Huntley milk processing facilities
and widening the range of branded value added yoghurt and drinking yoghurt lines produced. The milk processing
plant is, like Masterpork, working towards FSSC 22000 (Food Safety System Certification) as part of its commitment
to producing the highest quality products.
Dairy product volumes increased strongly towards the end of the year supported by increased milk production at
Zambeef’s dairy as well as by the buying in of fresh milk from other dairy farms. This strong growth in milk
production at the end of 2016 is expected to continue into 2017, which will enable Zammilk to meet the increasing
demand for its dairy products from both formal and informal sales channels.
e) Fish
Fish volumes fell for the period by 16.7 per cent. from 2.2 million kgs to 1.8 million kgs, due to the rise in imported
fish prices with the depreciation of the ZMW. This was the only Cold Chain Food Product in which volumes
decreased, as consumers moved to other protein sources as prices moved quickly up in ZMW. With the recent
stability in the ZMW, volumes are expected to increase again.
f) Eggs (Zamegg)
Egg volumes grew by 2.2 per cent. to 40.2 million eggs during 2016. During the year, USD1.2 million has been
invested to increase the layer chicken housing from 153,000 layer capacity to 273,000. This capacity increase has been
phased in from the end of 2016 through into the beginning of 2017. As a result, 2017 will see strong volume growth.
STOCKFEED (NOVATEK)
2016
ZMW’000s
2015
ZMW’000s % change
2016
USD’000s 2015
USD’000s % change
% of Group
2016
Revenue 697,563 407,863 71.0 64,410 57,771 11.5 18.3
Gross profit 143,916 73,821 95.0 13,289 10,456 27.1 16.4
Novatek has had an outstanding year with volumes increasing by 15.3 per cent. from 130,280 tons to 150,280 tons. The Lusaka
plant has been operating at maximum capacity during the second half of the year and we look forward to our second stockfeed
plant starting production in February 2017, which will alleviate some of the strain on the Lusaka plant and increase capacity by
a further 11,000 tons per month. This second plant is being constructed at Mpongwe Farm and will be ideally placed to service
the Copperbelt, North Western and DRC markets. The cost of completing the second plant will be approximately USD2

million and will give Novatek the capacity to meet the underlying growth in demand for quality stockfeeds.
The stockfeed operations account for 16.4 per cent. of the gross profits of the Group. During the year gross profits increased
by 95.0 per cent. in ZMW and 27.1 per cent. in USD.
Novatek volumes have been boosted by the Zamhatch hatchery, which came on stream at the end of September 2015,
allowing Zambeef to sell day-old chicks and stockfeed together to both the formal and informal sectors. Novatek sales have
also been helped by the roll-out of the new Novatek outlets within the Zambeef macro outlets that opened during the past
year.
The increase in Novatek’s production capacity as the second stockfeed plant comes on stream in February 2017 should enable
Novatek to meet growth in demand from ruminant, monogastric and aquaculture producer customers in both the formal and
informal sectors.
CROPPING
2016
ZMW’000s
2015
ZMW’000s % change
2016
USD’000s 2015
USD’000s % change
% of Group
2016
Revenue 413,391 397,125 4.1 38,171 56,250 (32.1) 10.9
Gross profit 251,860 253,326 (0.6) 23,256 35,882 (35.2) 28.8
The cropping division accounted for 28.8 per cent. of the Group’s gross profit contribution. Gross profits were down by 0.6
per cent. in ZMW and 35.2 per cent. in USD. The cropping division incurs most of its income in USD as maize, wheat and
soya are traded mainly in USD in Zambia. As a result, this division significantly benefitted in 2015 from a depreciating ZMW
currency, which translated into a one-off currency translation gain on closing grain stocks of circa. USD9.6 million (ZMW119
million), while in 2016, the division was adversely affected by the impact of an appreciating ZMW currency. In addition, the
weakening global wheat markets resulted in wheat prices falling from USD440/ton to USD400/ton.
Despite the currency movements the farming operations performed well. The summer soya crop was on budget harvesting
39,942 tons with the summer maize crop slightly behind budget at 15,532 tons and the silage on budget at 27,334 tons. This
was an excellent achievement in a very difficult season, with the region having experienced a severe drought as well as power
shortages. These excellent yields in one of the toughest seasons Zambia has experienced shows the quality of the Zambeef
farming assets and the importance of irrigation.
For the 2016 winter crop, Zambeef came in on budget at 40,643 tons for the wheat and slightly behind budget at 17,024 tons
for the winter maize. Again, these are outstanding results, with the winter crop being subject to power shortages which
impacted this irrigated crop.
OTHER BUSINESSES
Flour Milling: performed satisfactorily during the year with gross profits increasing in ZMW by 71.5 per cent. and USD by
11.8 per cent. During the year, only 12,996 tons of wheat were milled as Zambeef had sold large volumes of wheat during the
2015 harvest rather than store it for milling in the 2016 year. For 2017, Zambeef has decided to increase the quantity of wheat
to be milled from 13,000 tons to 25,000 tons. The intention is to retail this additional flour through the Zambeef retail
network, thereby meeting expected growth in demand from existing customers.
Zamleather: has had a difficult year with world hide prices dropping with oversupply from Brazil and Chinese demand
dropping. This has made the lower grade hides difficult to move on the international market. At the same time the demand for
mining boots decreased following a slowdown in the mining sector in Zambia. This resulted in the number of shoes sold from
the Zamshu plant decreasing by 24.1 per cent. from 89,197 to 67,746.
This has led to gross profits decreasing by 25.3 per cent. in ZMW and 51.3 per cent. in USD. Expectations are that the world
leather industry will have another tough year in 2017, hence 2017 is expected to be another difficult year for Zamleather.

DISCONTINUED ACTIVITIES
Edible Oils: Zambeef sold its edible oil processing operation, Zamanita Ltd, to Cargill Holdings BV in June 2015. Since then
Zambeef has continued to sell Zamanita oil through its retailing network on commission. Consequently, revenue has fallen
from ZMW219 million (USD40.0 million) to ZMW92 million (USD8.5 million), and gross profit has fallen from ZMW40
million (USD5.7 million) to ZMW2.7 million (USD0.3 million).

ZAMBEEF PRODUCTS PLC AND ITS SUBSIDIARIES
CONSOLIDATED STATEMENT OF COMPREHENSIVE INCOME
FOR THE YEAR ENDED 30 SEPTEMBER 2016
Group Notes 2016
ZMW’000s
2016
USD’000s
2015
ZMW’000s
2015
USD’000s
Revenue 5 2,376,148 219,404 1,554,872 220,237
Net gain/(loss) arising from price changes in
fair value of biological assets
16 13,257 1,224 (4,528) (641)
Cost of sales (1,513,459) (139,747) (883,631) (125,160)
Gross profit 875,946 80,881 666,713 94,436
Administrative expenses (690,047) (63,716) (505,343) (71,578)
Other income 1,694 156 708 100
Operating profit 6 187,593 17,321 162,078 22,958
Exchange gains/(losses) on translating foreign
currency transactions and balances
58,345 5,387 (142,358) (20,164)
Finance costs 8 (111,346) (10,281) (55,295) (7,832)
Profit/(loss) before taxation 134,592 12,427 (35,575) (5,038)
Taxation charge 9 (10,798) (997) (4,661) (660)
Group income/(loss) for the year from
continuing operations
123,794 11,430 (40,236) (5,698)
Profit/(loss) from discontinued operations (i) 33,592 3,101 (14,377) (2,036)
Group income/(loss) for the year 157,386 14,531 (54,613) (7,734)
(i) The profit from discontinued operations in the current year results from the reversal of a portion of the tax
liability for a previously owned subsidiary (Zamanita Limited)

ZAMBEEF PRODUCTS PLC AND ITS SUBSIDIARIES
CONSOLIDATED STATEMENT OF COMPREHENSIVE INCOME
FOR THE YEAR ENDED 30 SEPTEMBER 2016 (CONTINUED)
Notes 2016
ZMW’000s
2016
USD’000s
2015
ZMW’000s
2015
USD’000s Group income/(loss) attributable to: ZMW’000s USD’000s ZMW’000s USD’000s
Equity holders of the parent 137,103 12,659 (63,614) (9,009)
Non-controlling interest 20,283 1,872 9,001 1,275
157,386 14,531 (54,613) (7,734)
Other comprehensive income:
Exchange gains/ (losses) on translating
presentational currency
(86,511) 16,909 186,567 (83,779)
Total comprehensive income /(loss) for
the year
70,875 31,440 131,954 (91,513)
Total comprehensive income /(loss) for
the year attributable to:
Equity holders of the parent 52,292 29,473 121,212 (90,626)
Non-controlling interest 18,583 1,967 10,742 (887)
70,875 31,440 131,954 (91,513)
Ngwee Cents Ngwee Cents
Earnings per share
Basic and diluted earnings per share –
continued operations
11 41.38 3.82 (19.86) (2.81)
Basic and diluted earnings per share –
discontinued operations
11 13.42 1.24 (5.80) (0.82)
Total Basic and diluted earnings per share 11 54.80 5.06 (25.66) (3.63)

ZAMBEEF PRODUCTS PLC AND ITS SUBSIDIARIES
CONSOLIDATED STATEMENT OF CHANGES IN EQUITY
FOR THE YEAR ENDED 30 SEPTEMBER 2016
(i) In Zambian Kwacha
Issued share
capital
ZMW’000s
Share
premium
ZMW’000s
Preference
share capital
ZMW’000s
Foreign
exchange
reserve
ZMW’000s
Revaluation
reserve
ZMW’000s
Retained
earnings
ZMW’000s
Total
attributable
to owners of
the parent
ZMW’000s
Non-
controlling
interest
ZMW’000s
Total equity
ZMW’000s
At 1 October 2014 2,480 506,277 - 3,506 513,620 294,114 1,319,997 23,341 1,343,338
Loss for the year - - - - - (63,614) (63,614) 9,001 (54,613)
Transfer of surplus
depreciation - - - - (8,949) 8,949 - - -
Other comprehensive
income:
Exchange gains on
translating
presentational currency - - - 184,826 - - 184,826 1,741 186,567
Total comprehensive
income - - - 184,826 (8,949) (54,665) 121,212 10,742 131,954
At 30 September 2015 2,480 506,277 - 188,332 504,671 239,449 1,441,209 34,083 1,475,292
Profit for the year - - - - - 137,103 137,103 20,283 157,386
Transfer of surplus
depreciation (18,906) 18,906 - - -
Other comprehensive
income:
Exchange gain on
translating
presentational currency (84,811) (84,811) (1,700) (86,511)
Total comprehensive
income - - - (84,811) (18,906) 156,009 52,292 18,583 70,875
Transactions with
owners
Non-controlling
interest shares acquired - - - - - 22,177 22,177 (60,282) (38,105)
Shares issued 526 618,735 1,000 620,261 - 620,261
Total Transactions
with owners 526 618,735 1,000 - - 22,177 642,438 (60,282) 582,156
At 30 September 2016 3,006 1,125,012 1,000 103,521 485,765 417,635 2,135,939 (7,616) 2,128,323

22
ZAMBEEF PRODUCTS PLC AND ITS SUBSIDIARIES
CONSOLIDATED STATEMENT OF CHANGES IN EQUITY
FOR THE YEAR ENDED 30 SEPTEMBER 2016 (CONTINUED)
(ii) In US Dollar
Issued share
capital
USD’000s
Preference
share capital
USD’000s
Share
premium
USD’000s
Foreign
exchange
reserve
USD’000s
Revaluation
reserve
USD’000s
Retained
earnings
USD’000s
Total
attributable
to owners
of the
parent
USD’000s
Non-
controlling
interest
USD’000s
Total equity
USD’000s
At 1 October 2014 396 - 123,283 (80,095) 101,777 65,165 210,526 3,723 214,249
Loss for the year - - - - - (9,009) (9,009) 1,275 (7,734)
Transfer of surplus
depreciation - - - - (1,268) 1,268 - - -
Other comprehensive
income:
Exchange losses on
translating presentational
currency - - - (81,617) - - (81,617) (2,162) (83,779)
Total comprehensive
income - - - (81,617) (1,268) (7,741) (90,626) (887) (91,513)
At 30 September 2015 396 - 123,283 (161,712) 100,509 57,424 119,900 2,836 122,736
Profit for the year 12,659 12,659 1,872 14,531
Transfer of surplus
depreciation (1,746) 1,746
Other comprehensive
income:
Exchange losses on
translating presentational
currency 16,813 16,813 96 16,909
Total comprehensive
income - - - 16,813 (1,746) 14,404 29,472 1,968 31,440
Transactions with
owners
Non-controlling interest
shares acquired 2,047 2,047 (5,565) (3,518)
Shares issued 53 100 61,812 - - - 61,965 - 61,965
Total Transactions with
owners 53 100 61,812 - - 2,047 64,012 (5,565) 58,447
At 30 September 2016 449 100 185,095 (144,901) 98,763 73,875 213,384 (761) 212,623

23
ZAMBEEF PRODUCTS PLC
COMPANY STATEMENT OF CHANGES IN EQUITY
FOR THE YEAR ENDED 30 SEPTEMBER 2016
(i) In Zambian Kwacha Issued share
capital
ZMW’000s
Preference share
capital
ZMW’000s
Share premium
ZMW’000s
Revaluation
reserve
ZMW’000s
Retained
earnings
ZMW’000s
Total equity
ZMW’000s
At 1 October 2014 2,480 - 506,277 306,483 308,433 1,123,673
Profit for the year - - - - 5,438 5,438
Transfer of surplus
depreciation - - - (8,771) 8,771 -
Other comprehensive
income
Exchange gains on translating
presentational currency
- - - - 147,325 147,325
Total comprehensive
income - - - (8,771) 161,534 152,763
At 30 September 2015 2,480 - 506,277 297,712 469,967 1,276,436
Profit for the year - - - - 91,377 91,377
Transfer of surplus
depreciation - - - (16,731) 16,731 -
Other comprehensive
income:
Exchange gains on translating
presentational currency
(73,394) (73,394)
Total comprehensive
income - - - (16,731) 34,714 17,983
Shares issued 526 1,000 618,735 - - 620,261
Total transactions with
owners 526 1,000 618,735 - - 620,261
At 30 September 2016 3,006 1,000 1,125,012 280,891 504,681 1,914,680

24
ZAMBEEF PRODUCTS PLC
COMPANY STATEMENT OF CHANGES IN EQUITY
FOR THE YEAR ENDED 30 SEPTEMBER 2016 (CONTINUED)
(ii) In US Dollar
Issued share
capital
USD’000s
Preference
share capital
USD’000s
Share
premium
USD’000s
Revaluation
reserve
USD’000s
Foreign
exchange
reserve
USD’000s
Retained
earnings
USD’000s
Total equity
USD’000s
At 1 October 2014 396 - 123,283 57,775 (63,622) 61,382 179,214
Profit for the year - - - - - 770 770
Transfer of surplus
depreciation - - - (1,242) - 1,242 -
Other comprehensive
income:
Exchange losses on
translating presentational
currency - - - - (73,792) - (73,792)
Total comprehensive
income - - - (1,242) (73,792) 2,012 (73,022)
At 30 September 2015 396 - 123,283 56,533 (137,414) 63,394 106,192
Profit for the year 8,439 8,439
Transfer of surplus
depreciation (2,370) 2,370
Other comprehensive
income:
Exchange losses on
translating presentational
currency 14,708 - 14,708
Total comprehensive
income - - - (2,370) 14,708 10,809 23,147
Transactions with owners
Shares issued 53 100 61,812 - - - 61,965
Total transactions with
owners 53 100 61,812 - - - 61,965
At 30 September 2016 449 100 185,095 54,163 (122,706) 74,203 191,304

25
ZAMBEEF PRODUCTS PLC AND ITS SUBSIDIARIES
CONSOLIDATED STATEMENT OF FINANCIAL POSITION - 30 SEPTEMBER 2016
ASSETS Notes
2016
ZMW’000s
2016
USD’000s
2015
ZMW’000s
2015
USD’000s
Non-current assets
Goodwill 12 157,922 15,776 15,699 1,306
Property, plant and equipment 13 1,769,966 176,820 1,833,630 152,548
Plantation development expenditure 13 94,302 9,421 80,824 6,724
Biological assets 16 48,480 4,843 34,006 2,829
Deferred tax asset 9(e) 28,366 2,834 25,344 2,108
2,099,036 209,694 1,989,503 165,515
Current assets
Biological assets 16 187,026 18,684 155,192 12,911
Inventories 17 544,739 54,419 412,239 34,296
Trade and other receivables 18 113,151 11,304 210,229 17,491
Amounts due from related companies 19 10,543 1,053 8,893 740
Income tax recoverable 9(c) 1,759 176 4,571 380
Cash and cash equivalents 20 64,806 6,474 - -
922,024 92,110 791,124 65,818
Total assets 3,021,060 301,804 2,780,627 231,333
EQUITY AND LIABILITIES
Capital and reserves
Share capital 21 3,006 449 2,480 396
Preference share capital 21 1,000 100 - -
Share premium 22 1,125,012 185,095 506,277 123,283
Other reserves 1,006,921 27,740 932,452 (3,779)
2,135,939 213,384 1,441,209 119,900
Non-controlling interest (7,616) (761) 34,083 2,836
2,128,323 212,623 1,475,292 122,736

26
ZAMBEEF PRODUCTS PLC AND ITS SUBSIDIARIES
CONSOLIDATED STATEMENT OF FINANCIAL POSITION - 30 SEPTEMBER 2016 (CONTINUED)
Notes
2016
ZMW’000s
2016
USD’000s
2015
ZMW’000s
2015
USD’000s
Non-current liabilities
Interest bearing liabilities 23 261,734 26,147 439,282 36,546
Obligations under finance leases 24 31,485 3,145 15,198 1,264
Amounts due to related companies 27 - - 44,443 3,697
Deferred liability 25 10,442 1,043 9,254 770
Deferred tax liability 9(e) 4,039 403 8,115 675
307,700 30,738 516,292 42,952
Current liabilities
Interest bearing liabilities 23 116,223 11,611 120,943 10,062
Collateral management agreement 23 118,849 11,873 91,852 7,642
Obligations under finance leases 24 19,697 1,968 11,644 969
Trade and other payables 26 322,133 32,179 372,333 30,976
Amounts due to related companies 27 313 31 35 3
Taxation payable 9(c) 7,822 781 1,588 132
Cash and cash equivalents 20 - - 190,648 15,861
585,037 58,443 789,043 65,645
Total equity and liabilities 3,021,060 301,804 2,780,627 231,333

27
ZAMBEEF PRODUCTS PLC
COMPANY STATEMENT OF FINANCIAL POSITION - 30 SEPTEMBER 2016
ASSETS Notes 2016
ZMW’000s
2016
USD’000s
2015
ZMW’000s
2015
USD’000s
Non-current assets
Property, plant and equipment 13 1,161,485 116,032 1,291,810 107,472
Investment in subsidiaries 15 293,763 29,347 118,688 9,874
Deferred tax asset 9(e) 28,366 2,834 25,344 2,109
1,483,614 148,213 1,435,842 119,455
Current assets
Biological assets 16 170,511 17,034 148,910 12,389
Inventories 17 413,670 41,326 311,242 25,893
Cash and cash equivalents 20 37,193 3,716 - -
Trade and other receivables 18 45,866 4,582 149,719 12,456
Amounts due from related companies 19 463,114 46,265 284,432 23,663
Income tax recoverable 9(c) - - 4,038 336
1,130,354 112,924 898,341 74,737
Total assets 2,613,968 261,137 2,334,183 194,192
EQUITY AND LIABILITIES
Capital and reserves
Share capital 21 3,006 449 2,480 396
Preference share capital 21 1,000 100 - -
Share premium 22 1,125,012 185,095 506,277 123,283
Other reserves 785,662 5,660 767,679 (17,487)
1,914,680 191,304 1,276,436 106,192

28
ZAMBEEF PRODUCTS PLC
COMPANY STATEMENT OF FINANCIAL POSITION - 30 SEPTEMBER 2016 (CONTINUED)
Notes
2016
ZMW’000s
2016
USD’000s
2015
ZMW’000s
2015
USD’000s
Non-current liabilities
Interest bearing liabilities 23 261,734 26,147 432,464 35,979
Obligations under finance leases 24 19,685 1,967 12,765 1,062
Deferred liability 25 2,266 227 1,670 139
Deferred tax liability 9(e) 3,382 338 2,967 247
287,067 28,679 449,866 37,427
Current liabilities
Interest bearing liabilities 23 229,394 22,916 205,976 17,136
Obligations under finance leases 24 14,108 1,409 9,168 763
Trade and other payables 26 164,467 16,404 251,846 20,953
Amounts due to related companies 27 325 33 36 3
Taxation payable 9(c) 3,927 392 - -
Cash and cash equivalents 20 - - 140,855 11,718
412,221 41,154 607,881 50,573
Total equity and liabilities 2,617,415 261,137 2,334,183 194,192

29
ZAMBEEF PRODUCTS PLC AND ITS SUBSIDIARIES
CONSOLIDATED STATEMENT OF CASH FLOWS
FOR THE YEAR ENDED 30 SEPTEMBER 2016
Notes 2016
ZMW’000s
2016
USD’000s
2015
ZMW’000s
2015
USD’000s
Cash inflow from operating activities
Profit/(loss) before taxation 134,592 12,427 (35,575) (5,038)
Finance costs 8 111,346 10,281 59,585 8,440
Loss on disposal of property, plant and equipment 1,124 104 7,040 997
Depreciation 13 77,784 7,182 67,050 9,497
Profit on discontinued operations 33,592 3,101 - -
Fair value price adjustment 16 (13,257) (1,224) 4,528 641
Net unrealised foreign exchange losses (28,626) (2,643) 46,873 6,639
Earnings before interest, tax, depreciation and amortisation, fair
value adjustments and net unrealised foreign exchange losses
316,555 29,228 149,501 21,176
Increase in biological assets (46,308) (4,276) (26,995) (3,824)
(Increase)/decrease in inventory (132,500) (12,235) 32,214 4,563
Decrease/(increase) in trade and other receivables 97,078 8,949 (87,886) (12,448)
Increase/(decrease) in amounts due from related companies (1,650) (137) 2,640 374
(Decrease)/increase in trade and other payables (50,200) (4,636) 154,036 21,818
(Decrease)/increase in amounts due to related companies (44,165) (4,078) 44,478 6,300
Increase in deferred liability 1,188 110 1,781 252
Income tax paid 9(c) (8,850) (817) (6,144) (870)
Net cash inflow from operating activities 131,148 12,109 263,625 37,341
Investing activities
Purchase of property, plant and equipment 13 (166,513) (15,376) (235,048) (33,293)
Expenditure on plantation development 13 (12,259) (1,132) (11,654) (1,651)
Movement in investments - - 23,827 3,375
Proceeds from sale of assets 3,352 474
Proceeds from the issue of shares 620,262 57,273 - -
Purchase of shares (175,075) (16,166) - -
Proceeds from the sale of Zamanita - - 197,809 27,037
Net cash outflow on investing activities 266,415 24,599 (21,714) (4,058)
30
ZAMBEEF PRODUCTS PLC AND ITS SUBSIDIARIES
CONSOLIDATED STATEMENT OF CASH FLOWS
FOR THE YEAR ENDED 30 SEPTEMBER 2016 (CONTINUED)
Notes
2016
ZMW’000s
2016
USD’000s
2015
ZMW’000s
2015
USD’000s
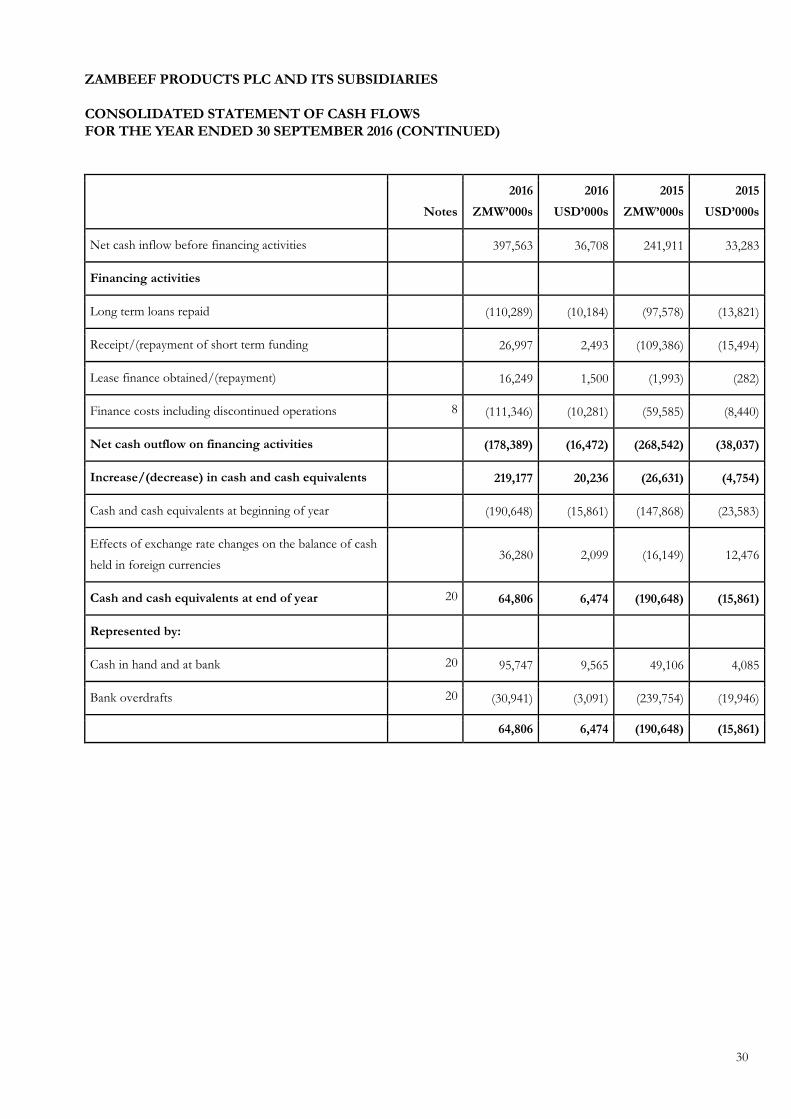
Net cash inflow before financing activities 397,563 36,708 241,911 33,283
Financing activities
Long term loans repaid (110,289) (10,184) (97,578) (13,821)
Receipt/(repayment of short term funding 26,997 2,493 (109,386) (15,494)
Lease finance obtained/(repayment) 16,249 1,500 (1,993) (282)
Finance costs including discontinued operations 8 (111,346) (10,281) (59,585) (8,440)
Net cash outflow on financing activities (178,389) (16,472) (268,542) (38,037)
Increase/(decrease) in cash and cash equivalents 219,177 20,236 (26,631) (4,754)
Cash and cash equivalents at beginning of year (190,648) (15,861) (147,868) (23,583)
Effects of exchange rate changes on the balance of cash
held in foreign currencies
36,280 2,099 (16,149) 12,476
Cash and cash equivalents at end of year 20 64,806 6,474 (190,648) (15,861)
Represented by:
Cash in hand and at bank 20 95,747 9,565 49,106 4,085
Bank overdrafts 20 (30,941) (3,091) (239,754) (19,946)
64,806 6,474 (190,648) (15,861)

31
ZAMBEEF PRODUCTS PLC
COMPANY STATEMENT OF CASH FLOWS
FOR THE YEAR ENDED 30 SEPTEMBER 2016
Notes
2016
ZMW’000s
2016
USD’000s
2015
ZMW’000s
2015
USD’000s
Cash inflow from operating activities
Profit/(loss) before taxation 101,173 9,342 (4,850) (687)
Finance costs 87,815 8,109 48,182 6,825
Depreciation 13 43,728 4,037 34,844 4,935
Fair value price adjustment 16 (12,587) (1,162) 4,904 695
Loss on disposal of property, plant and equipment 824 76 3,648 517
Loss on disposal of investment - - (112,168) (15,888)
Net unrealised foreign exchange differences (17,010) (1,571) 46,641 6,606
Earnings before interest, tax, depreciation and amortisation 203,943 18,831 21,201 3,003
Increase in biological assets (21,601) (1,995) (11,962) (1,694)
Increase in inventory (102,428) (9,458) (125,327) (17,752)
Decrease/(increase) in trade and other receivables 103,853 9,574 (96,027) (13,602)
(Increase)/decrease in amounts due from related companies (178,682) (16,484) 33,875 4,798
(Decrease)/increase in trade and other payables (87,379) (8,068) 175,869 24,911
Increase/(decrease) in amounts due to related companies 289 27 (60,761) (8,606)
Increase in deferred liability 596 55 98 14
Income tax paid 9(c) (4,438) (410) (592) (84)
Net cash outflow operating activities (85,847) (7,928) (63,626) (9,012)
Investing activities
Purchase of property, plant and equipment 13 (49,743) (4,593) (37,438) (5,303)
Proceeds from the issue of shares 620,261 57,273 - -
Movements in investments 14/15 (175,075) (16,166) 62,721 8,884
Proceeds from disposal of investment - - 197,809 28,018
Proceeds from sale of assets 65 6 - -
Net cash inflow from investing activities 395,509 36,520 223,092 31,599

32
ZAMBEEF PRODUCTS PLC
COMPANY STATEMENT OF CASH FLOWS
FOR THE YEAR ENDED 30 SEPTEMBER 2016 (CONTINUED)
Notes
2016
ZMW’000s
2016
USD’000s
2015
ZMW’000s
2015
USD’000s
Net cash inflow before financing activities 309,662 28,592 159,466 22,587
Financing activities
Long term loans repaid (101,811) (9,401) (58,732) (8,319)
Movement in short term funding 39,938 3,688 (14,494) (2,053)
Lease finance obtained/(repayment) 11,823 1,092 (3,716) (526)
Interest paid (87,815) (8,109) (48,182) (6,825)
Net cash outflow from financing activities (137,865) (12,730) (125,124) (17,723)
Increase in cash and cash equivalents 171,797 15,862 34,342 4,864
Cash and cash equivalents at beginning of year (140,855) (11,718) (112,115) (17,881)
Effects of exchange rate changes on the balance of
cash held in foreign currencies
6,251 (428) (63,082) 1,299
Cash and cash equivalents at end of year 20 37,193 3,716 (140,855) (11,718)
Represented by:
Cash in hand and at bank 20 52,239 5,219 7,322 609
Bank overdrafts 20 (15,046) (1,503) (148,177) (12,327)
37,193 3,716 (140,855) (11,718)