ZAIN GROUP FINANCIAL RESULTS · PDF file · 2017-08-222015 2016 2017 F Capex Capex...
26
Q2 2017 ZAIN GROUP FINANCIAL RESULTS
Transcript of ZAIN GROUP FINANCIAL RESULTS · PDF file · 2017-08-222015 2016 2017 F Capex Capex...

Q2 2017
ZAIN GROUP FINANCIALRESULTS
ZAIN GROUP Q2 2017 IR PRESENTATION 1
❖ Mobile Telecommunications Company KSCP “Zain Group” has prepared this presentation to the best of its abilities, however, no warranty or representation, express or implied is made as to the adequacy, correctness, completeness or accuracy of any numbers, statements, opinions, estimates, or other information contained in this presentation.
❖ Certain portions of this document contain “forward-looking statements”, which are based on current expectations and reasonable assumptions, we can however give no assurance they will be achieved.
❖ The information contained in this presentation is subject to change and we disclaim any obligation to update you of any such changes, particularly those pertaining to the forward-looking statements.
❖ Furthermore, it should be noted that there are a myriad potential risks, uncertainties and unforeseen factors that could cause the actual results to differ materially from the forward-looking statements made herein.
❖ Accordingly, this presentation does not constitute an offering of securities or otherwise constitute an invitation or inducement to any person to underwrite, subscribe for, or otherwise acquire or dispose of, securities in any company within Zain Group.
For further information about Zain Group, or the materials contained within this presentation, please direct your enquiries to our Investor Relations team via email at [email protected] or visit www.zain.com/en/investor-relations/
DISCLAIMER
ZAIN GROUP OVERVIEW
ZAIN OPERATIONS OVERVIEW
FINANCIAL STATEMENTS
CONTENTS
ZAIN GROUP OVERVIEW
ZAIN GROUP Q2 2017 IR PRESENTATION 4
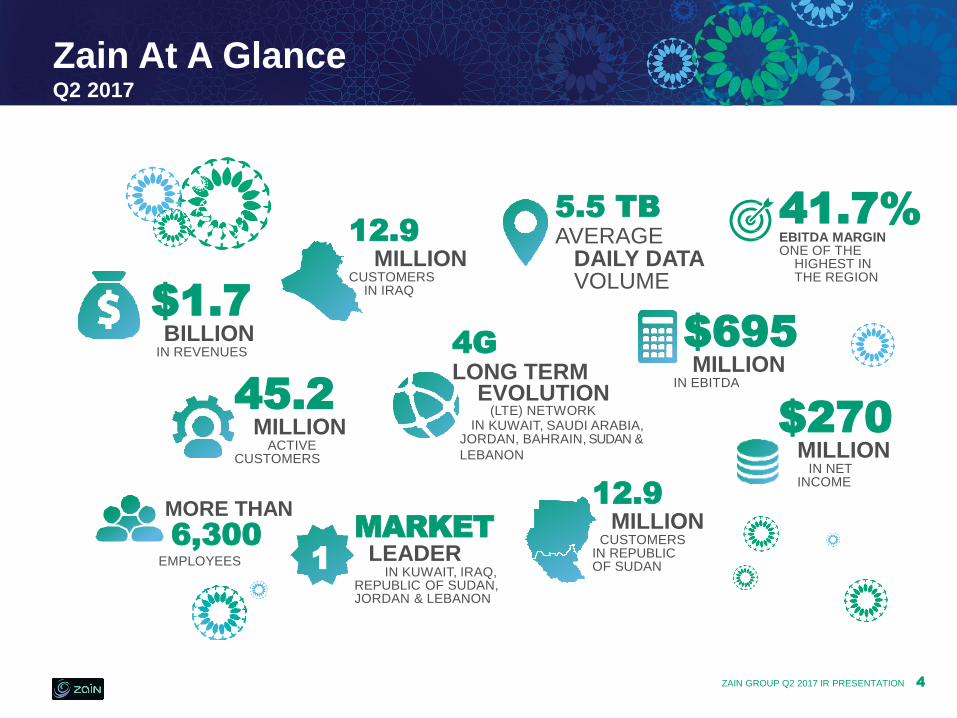
45.2MILLION
ACTIVE CUSTOMERS
12.9MILLION
CUSTOMERSIN IRAQ
4GLONG TERM
EVOLUTION(LTE) NETWORK
IN KUWAIT, SAUDI ARABIA,JORDAN, BAHRAIN, SUDAN &
LEBANON
MORE THAN
6,300EMPLOYEES
MARKETLEADER
IN KUWAIT, IRAQ,REPUBLIC OF SUDAN, JORDAN & LEBANON
$695MILLION
IN EBITDA
12.9MILLION
CUSTOMERSIN REPUBLICOF SUDAN
$1.7BILLION
IN REVENUES
5.5 TBAVERAGE
DAILY DATA VOLUME
1
$270MILLION
IN NETINCOME
41.7%EBITDA MARGINONE OF THE
HIGHEST IN THE REGION
Zain At A GlanceQ2 2017
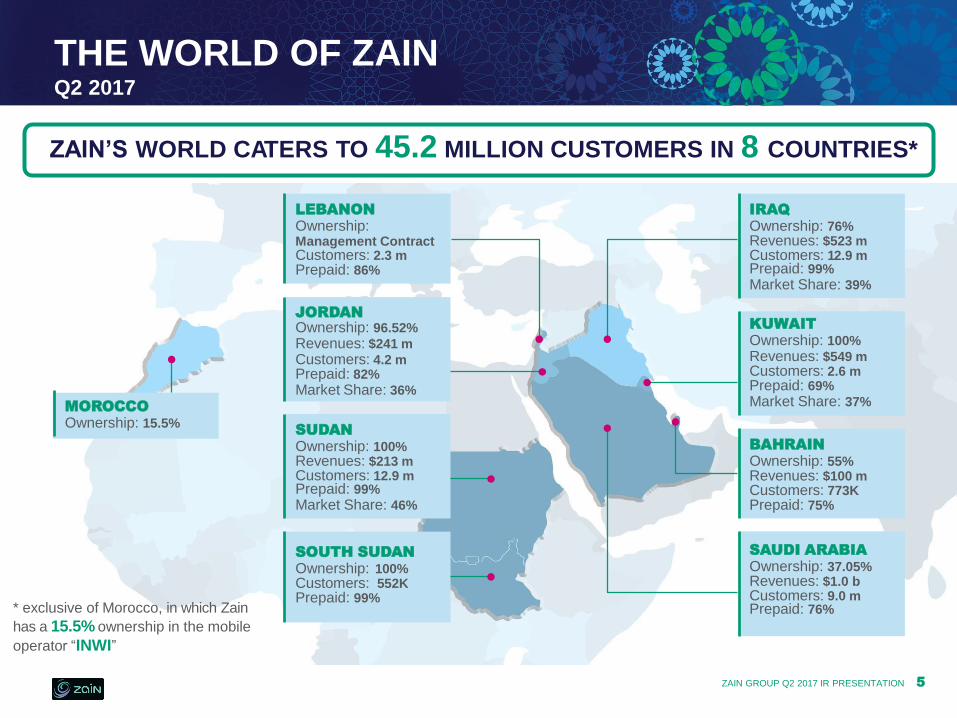
IRAQOwnership: 76% Revenues: $523 m Customers: 12.9 mPrepaid: 99%
Market Share: 39%
KUWAITOwnership: 100%
Revenues: $549 mCustomers: 2.6 mPrepaid: 69%
Market Share: 37%
BAHRAINOwnership: 55% Revenues: $100 m Customers: 773K Prepaid: 75%
SAUDI ARABIAOwnership: 37.05% Revenues: $1.0 bCustomers: 9.0 mPrepaid: 76%
MOROCCOOwnership: 15.5%
LEBANONOwnership: Management Contract Customers: 2.3 mPrepaid: 86%
JORDANOwnership: 96.52%
Revenues: $241 m
Customers: 4.2 mPrepaid: 82%
Market Share: 36%
SUDANOwnership: 100% Revenues: $213 m Customers: 12.9 mPrepaid: 99%
Market Share: 46%
SOUTH SUDANOwnership: 100%Customers: 552KPrepaid: 99%
* exclusive of Morocco, in which Zain
has a 15.5% ownership in the mobile
operator “INWI”
THE WORLD OF ZAINQ2 2017
ZAIN GROUP Q2 2017 IR PRESENTATION 5
ZAIN’S WORLD CATERS TO 45.2 MILLION CUSTOMERS IN 8 COUNTRIES*
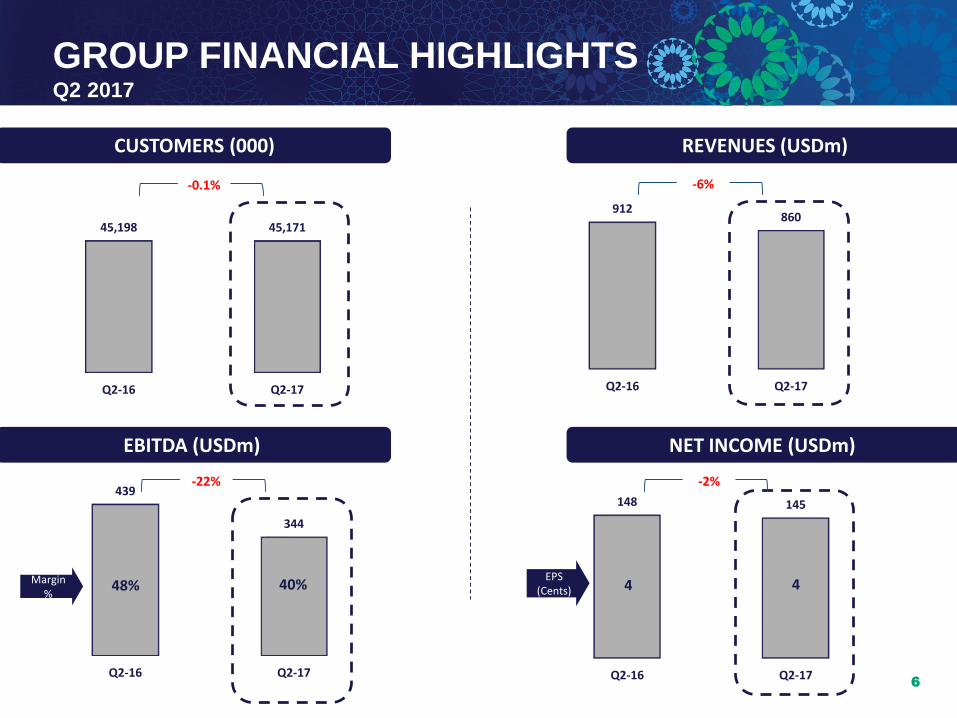
148 145
Q2-16 Q2-17
439
344
Q2-16 Q2-17
912860
Q2-16 Q2-17
GROUP FINANCIAL HIGHLIGHTSQ2 2017
CUSTOMERS (000)
48% 40% 4 4
REVENUES (USDm)
EBITDA (USDm) NET INCOME (USDm)
45,198 45,171
Q2-16 Q2-17
-0.1% -6%
-22%
Margin %
-2%
EPS (Cents)
6
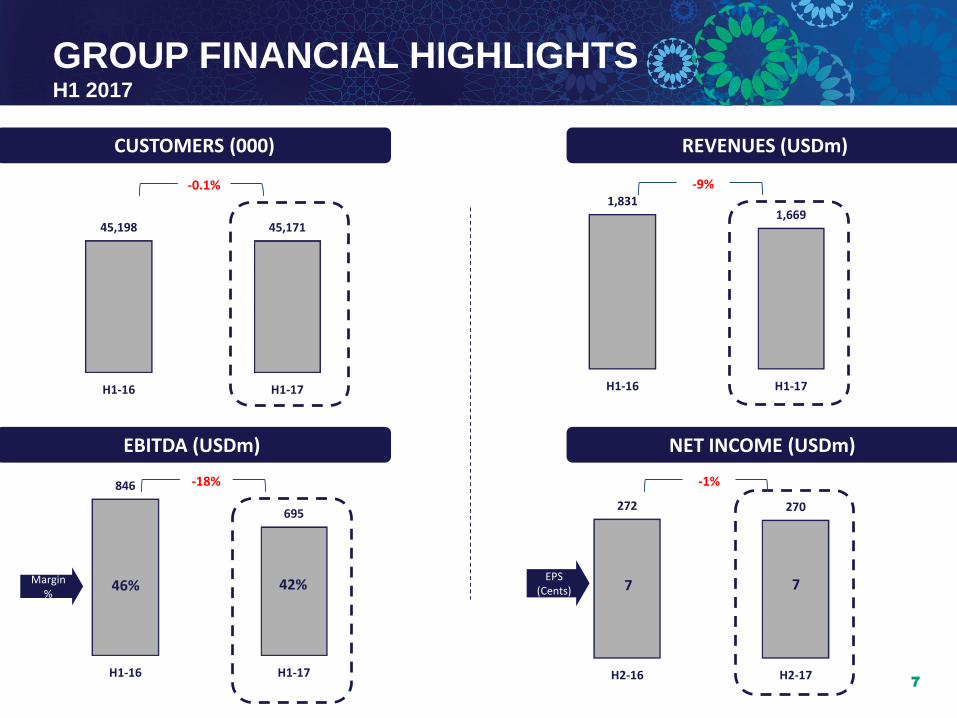
272 270
H2-16 H2-17
846
695
H1-16 H1-17
1,8311,669
H1-16 H1-17
GROUP FINANCIAL HIGHLIGHTSH1 2017
CUSTOMERS (000)
46% 42% 7 7
REVENUES (USDm)
EBITDA (USDm) NET INCOME (USDm)
45,198 45,171
H1-16 H1-17
-0.1% -9%
-18%
Margin %
-1%
EPS (Cents)
7
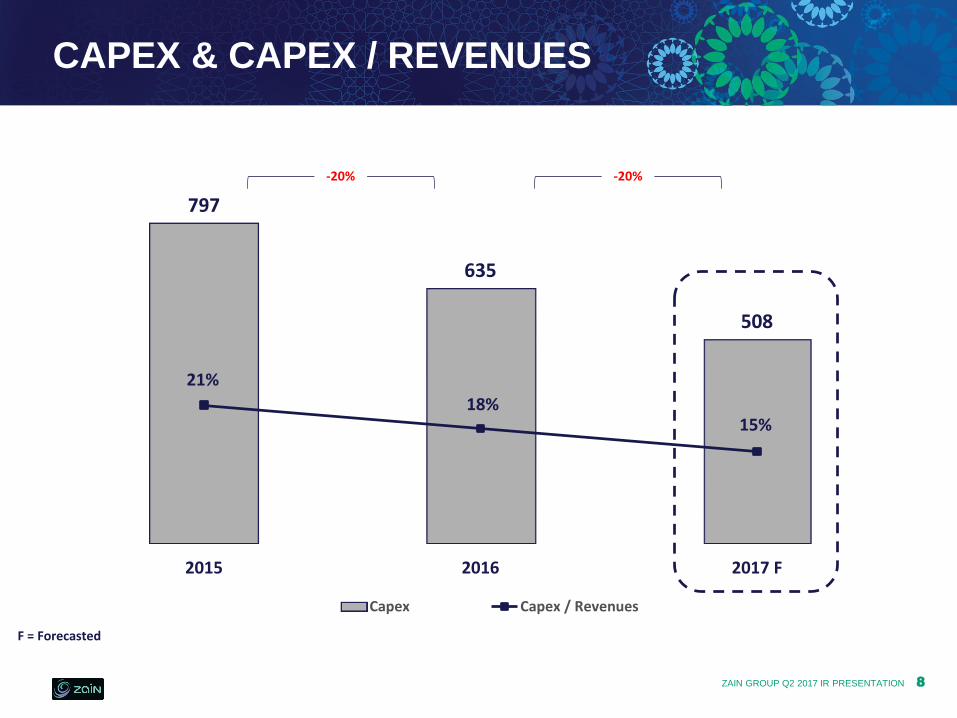
797
635
508
21%
18%15%
2015 2016 2017 F
Capex Capex / Revenues
ZAIN GROUP Q2 2017 IR PRESENTATION 8
CAPEX & CAPEX / REVENUES
F = Forecasted
-20% -20%
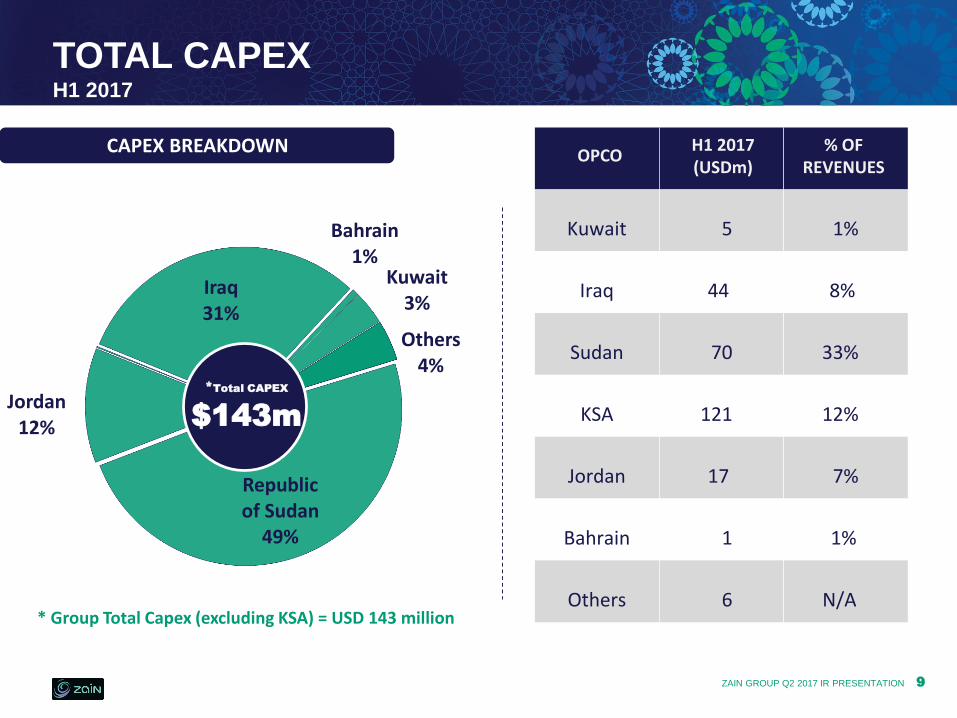
Republic of Sudan
49%
Jordan12%
Iraq31%
Bahrain1%
Kuwait3%
Others4%
CAPEX BREAKDOWN
* Group Total Capex (excluding KSA) = USD 143 million
TOTAL CAPEXH1 2017
*Total CAPEX
$143m
Kuwait 5 1%
Iraq 44 8%
Sudan 70 33%
KSA 121 12%
Jordan 17 7%
Bahrain 1 1%
Others 6 N/A
OPCOH1 2017(USDm)
% OF REVENUES
ZAIN GROUP Q2 2017 IR PRESENTATION 9
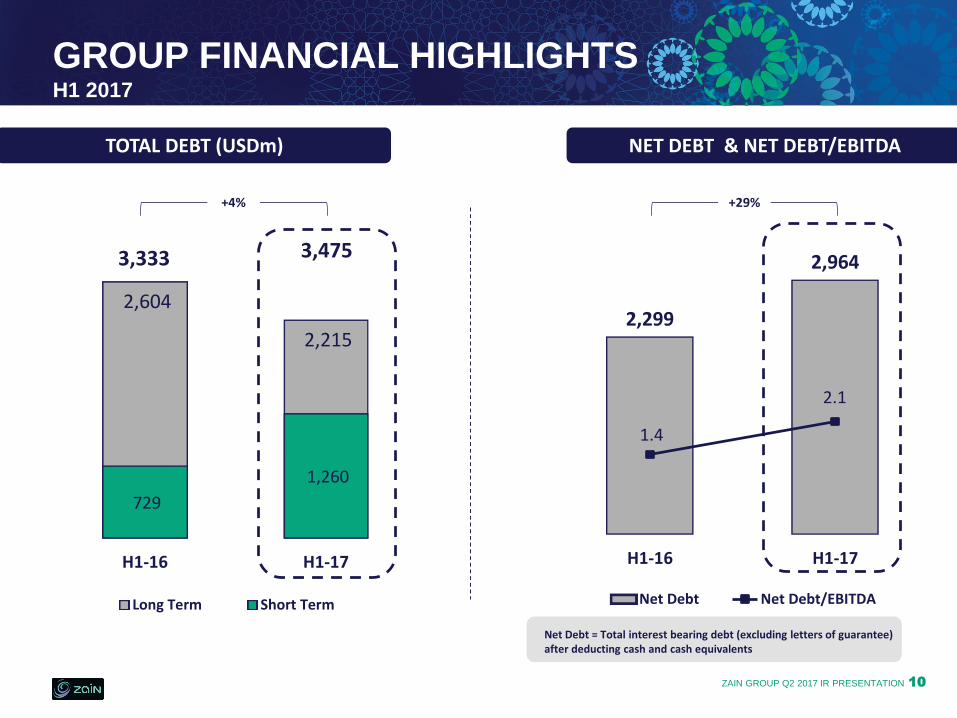
2,604
2,215
729
1,260
H1-16 H1-17
Long Term Short Term
ZAIN GROUP Q2 2017 IR PRESENTATION 10
2,299
2,964
1.4
2.1
H1-16 H1-17
Net Debt Net Debt/EBITDA
Net Debt = Total interest bearing debt (excluding letters of guarantee) after deducting cash and cash equivalents
GROUP FINANCIAL HIGHLIGHTSH1 2017
TOTAL DEBT (USDm) NET DEBT & NET DEBT/EBITDA
3,4753,333
+4% +29%
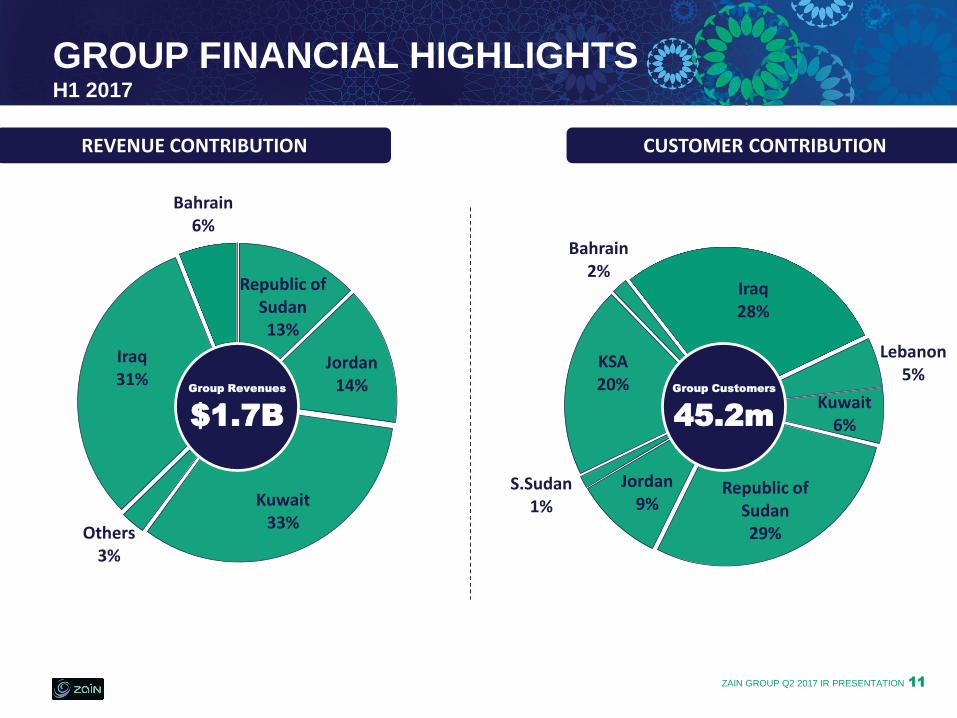
Kuwait6%
Republic of Sudan29%
Jordan9%
S.Sudan1%
KSA20%
Bahrain2%
Iraq28%
Lebanon5%
Republic of Sudan13%
Jordan14%
Kuwait33%
Others3%
Iraq31%
Bahrain6%
GROUP FINANCIAL HIGHLIGHTSH1 2017
Group Customers
45.2m
REVENUE CONTRIBUTION CUSTOMER CONTRIBUTION
Group Revenues
$1.7B
ZAIN GROUP Q2 2017 IR PRESENTATION 11
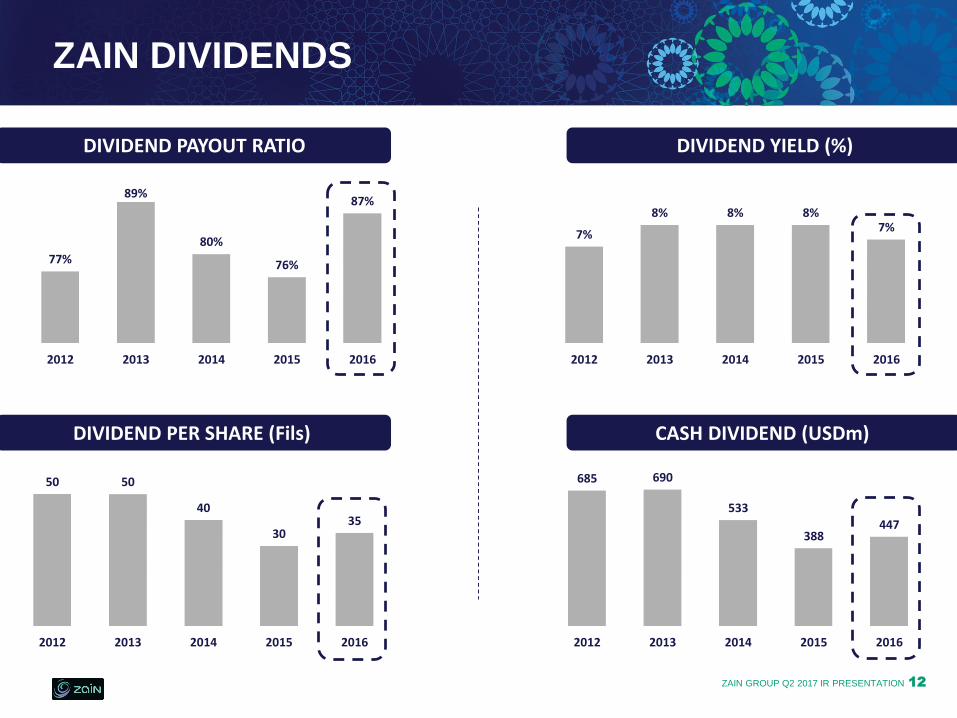
77%
89%
80%
76%
87%
2012 2013 2014 2015 2016
7%
8% 8% 8%7%
2012 2013 2014 2015 2016
50 50
40
3035
2012 2013 2014 2015 2016
685 690
533
388447
2012 2013 2014 2015 2016
ZAIN GROUP Q2 2017 IR PRESENTATION 12
ZAIN DIVIDENDS
DIVIDEND PAYOUT RATIO DIVIDEND YIELD (%)
DIVIDEND PER SHARE (Fils) CASH DIVIDEND (USDm)
ZAIN OPERATIONS OVERVIEW
ZAIN GROUP Q2 2017 IR PRESENTATION 14
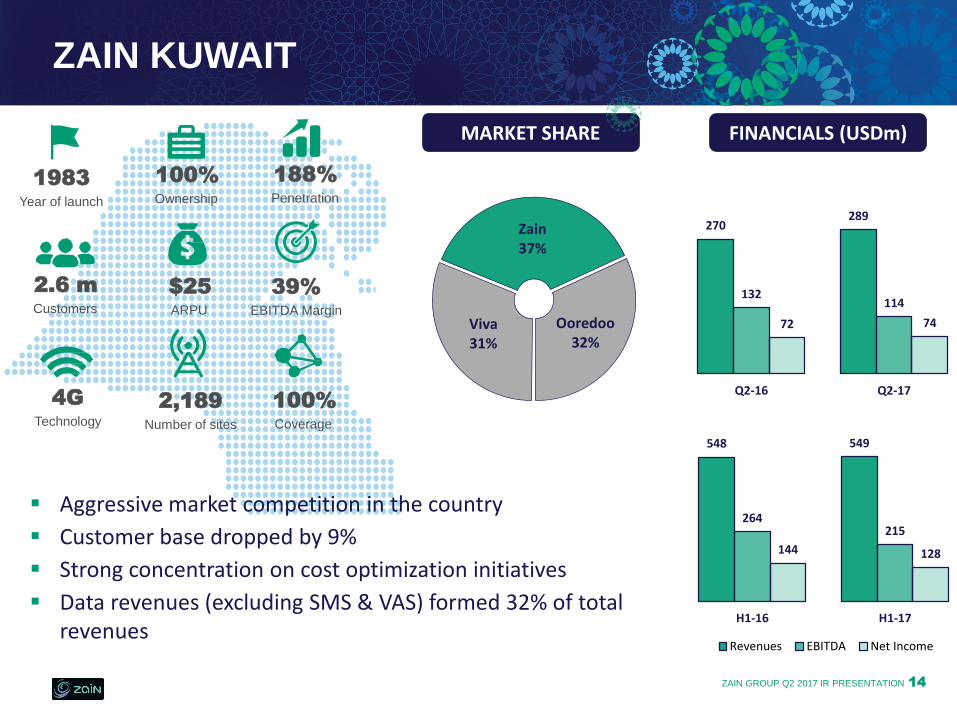
$25ARPU
188%Penetration
1983Year of launch
2.6 mCustomers
100%Ownership
▪ Aggressive market competition in the country
▪ Customer base dropped by 9%
▪ Strong concentration on cost optimization initiatives
▪ Data revenues (excluding SMS & VAS) formed 32% of total revenues
ZAIN38%
OOREEDOO31%
VIVA31%
4GTechnology
100%Coverage
2,189Number of sites
270289
132114
72 74
Q2-16 Q2-17
FINANCIALS (USDm)
Zain37%
Ooredoo32%
Viva31%
MARKET SHARE
ZAIN KUWAIT
39%EBITDA Margin
548 549
264215
144 128
H1-16 H1-17
Revenues EBITDA Net Income
ZAIN GROUP Q2 2017 IR PRESENTATION 15
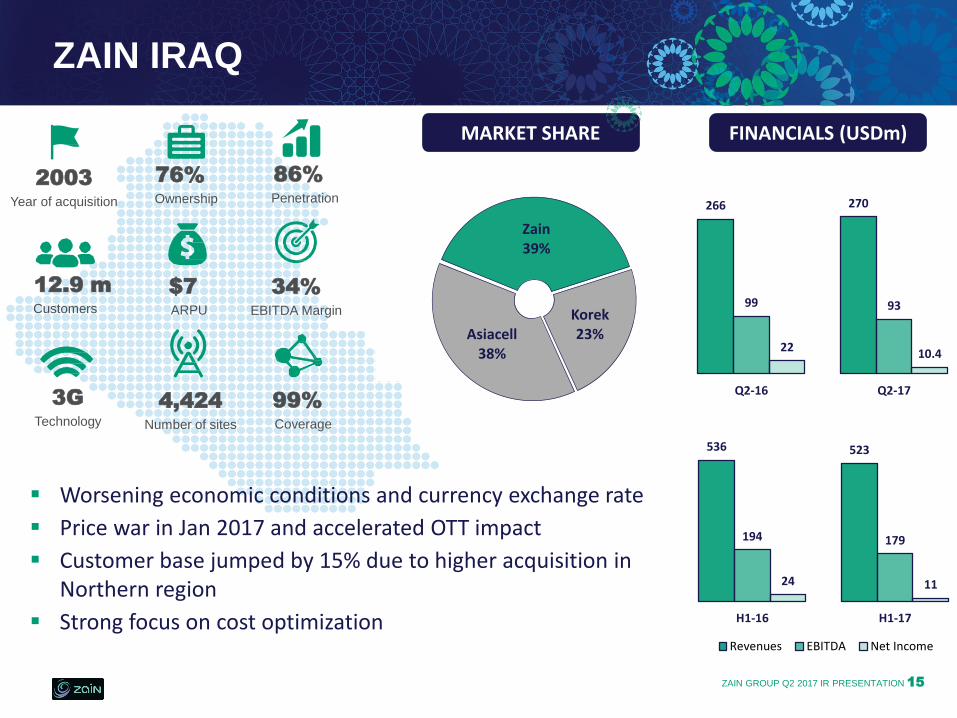
$7ARPU
86%Penetration
2003Year of acquisition
12.9 mCustomers
76%Ownership
ZAIN38%
OOREEDOO31%
VIVA31%
3GTechnology
99%Coverage
4,424Number of sites
266 270
99 93
22 10.4
Q2-16 Q2-17
FINANCIALS (USDm)
Zain39%
Korek 23%Asiacell
38%
MARKET SHARE
ZAIN IRAQ
34%EBITDA Margin
▪ Worsening economic conditions and currency exchange rate
▪ Price war in Jan 2017 and accelerated OTT impact
▪ Customer base jumped by 15% due to higher acquisition in Northern region
▪ Strong focus on cost optimization
536 523
194 179
24 11
H1-16 H1-17
Revenues EBITDA Net Income
ZAIN GROUP Q2 2017 IR PRESENTATION 16
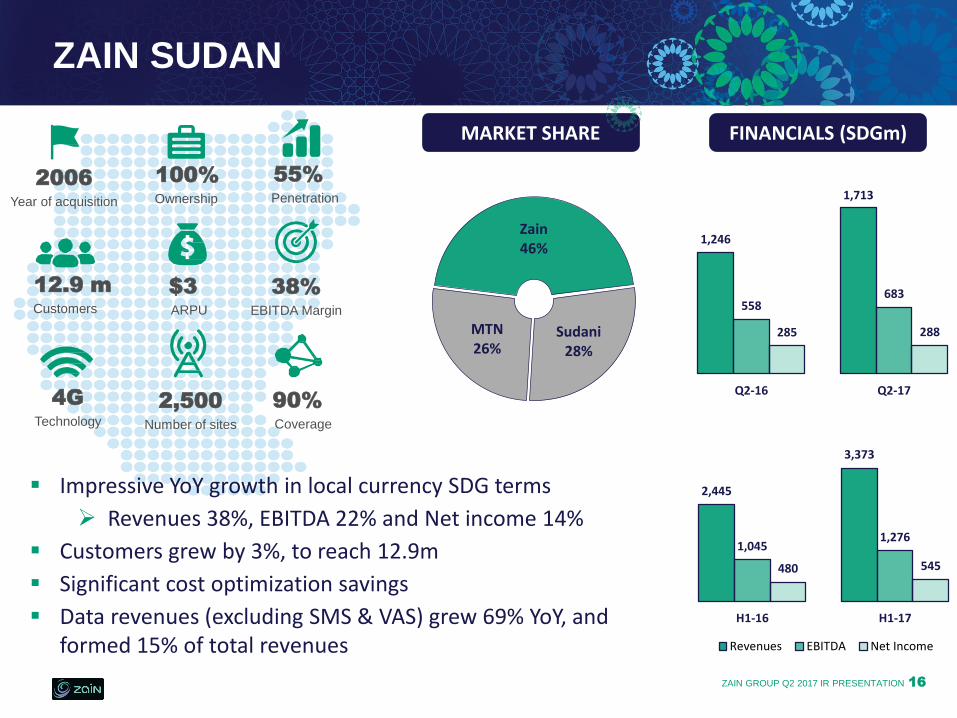
$3ARPU
55%Penetration
12.9 mCustomers
100%Ownership
ZAIN38%
OOREEDOO31%
VIVA31%
4GTechnology
90%Coverage
2,500Number of sites
1,246
1,713
558683
285 288
Q2-16 Q2-17
FINANCIALS (SDGm)
Zain46%
Sudani28%
MTN26%
MARKET SHARE
ZAIN SUDAN
38%EBITDA Margin
2006Year of acquisition
▪ Impressive YoY growth in local currency SDG terms
➢ Revenues 38%, EBITDA 22% and Net income 14%
▪ Customers grew by 3%, to reach 12.9m
▪ Significant cost optimization savings
▪ Data revenues (excluding SMS & VAS) grew 69% YoY, and formed 15% of total revenues
2,445
3,373
1,0451,276
480 545
H1-16 H1-17
Revenues EBITDA Net Income
ZAIN GROUP Q2 2017 IR PRESENTATION 17
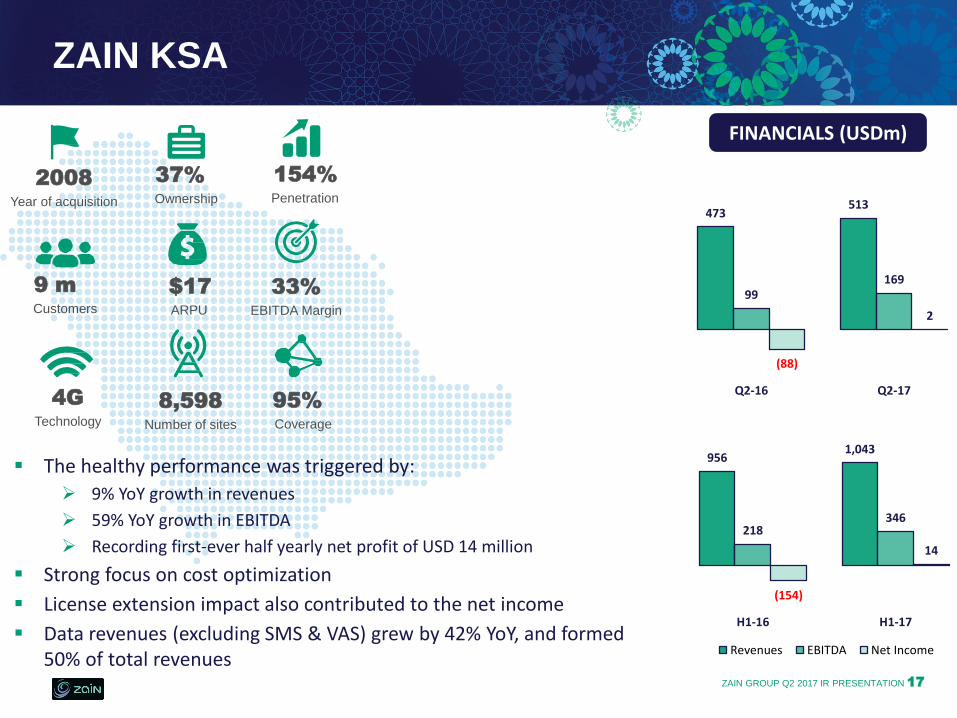
$17ARPU
154%Penetration
9 mCustomers
37%Ownership
ZAIN38%
OOREEDOO31%
VIVA31%
4GTechnology
95%Coverage
8,598Number of sites
473513
99169
(88)
2
Q2-16 Q2-17
FINANCIALS (USDm)
ZAIN KSA
33%EBITDA Margin
▪ The healthy performance was triggered by:
➢ 9% YoY growth in revenues
➢ 59% YoY growth in EBITDA
➢ Recording first-ever half yearly net profit of USD 14 million
▪ Strong focus on cost optimization
▪ License extension impact also contributed to the net income
▪ Data revenues (excluding SMS & VAS) grew by 42% YoY, and formed 50% of total revenues
2008Year of acquisition
9561,043
218346
(154)
14
H1-16 H1-17
Revenues EBITDA Net Income
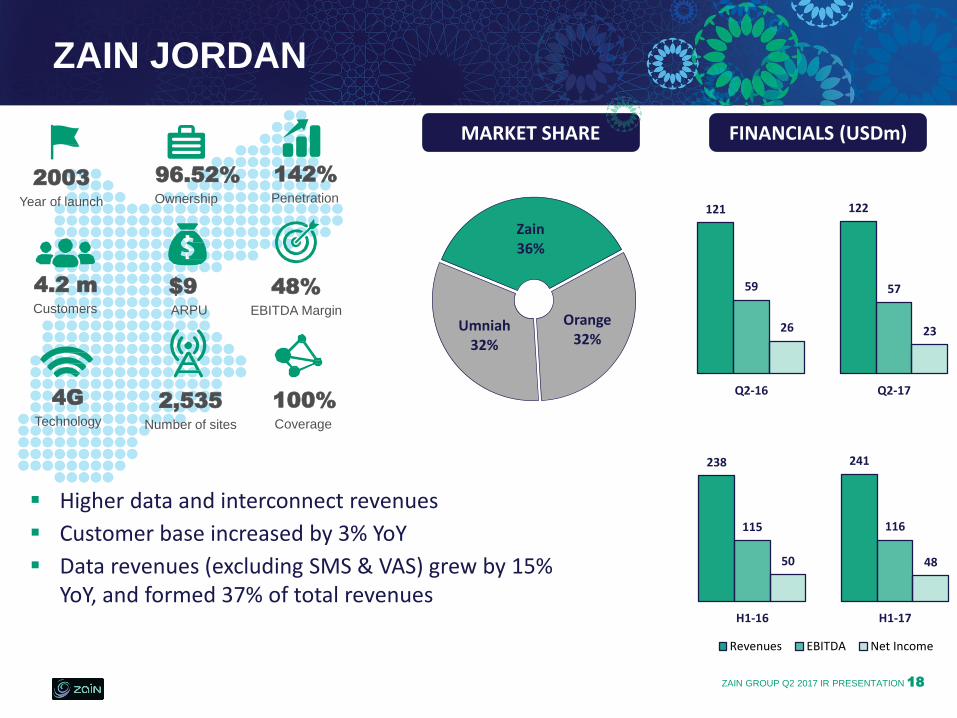
ZAIN GROUP Q2 2017 IR PRESENTATION 18
$9ARPU
142%Penetration
2003Year of launch
4.2 mCustomers
96.52%Ownership
ZAIN38%
OOREEDOO31%
VIVA31%
4GTechnology
100%Coverage
2,535Number of sites
121 122
59 57
26 23
Q2-16 Q2-17
FINANCIALS (USDm)
Zain36%
Orange32%
Umniah32%
MARKET SHARE
ZAIN JORDAN
48%EBITDA Margin
▪ Higher data and interconnect revenues
▪ Customer base increased by 3% YoY
▪ Data revenues (excluding SMS & VAS) grew by 15% YoY, and formed 37% of total revenues
238 241
115 116
50 48
H1-16 H1-17
Revenues EBITDA Net Income
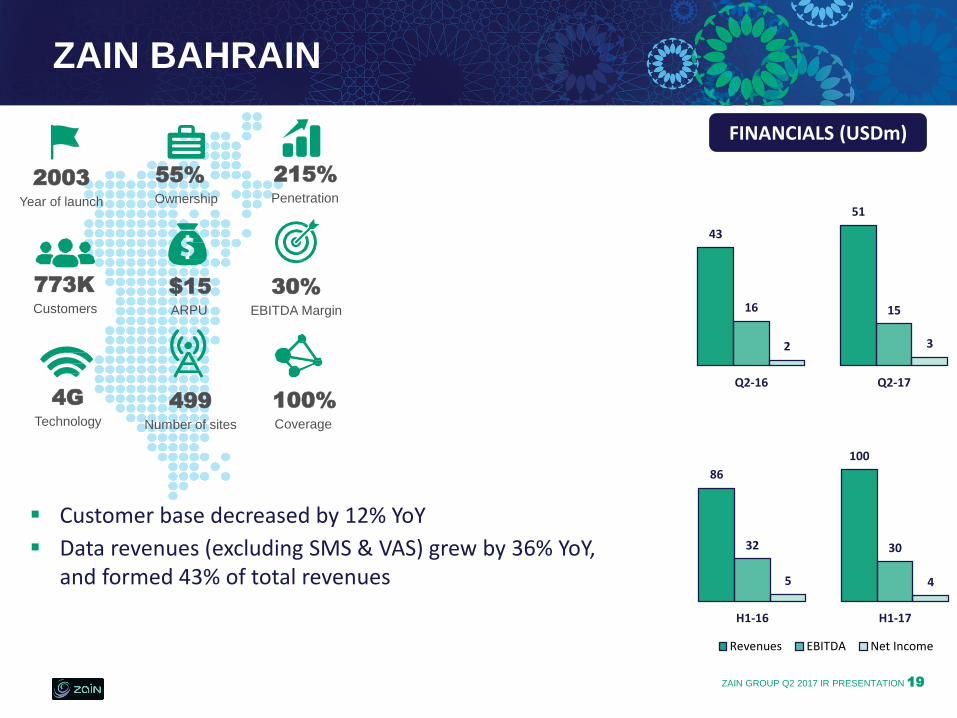
ZAIN GROUP Q2 2017 IR PRESENTATION 19
$15ARPU
215%Penetration
2003Year of launch
773KCustomers
55%Ownership
ZAIN38%
OOREEDOO31%
VIVA31%
4GTechnology
100%Coverage
499Number of sites
43
51
16 15
2 3
Q2-16 Q2-17
FINANCIALS (USDm)
ZAIN BAHRAIN
30%EBITDA Margin
▪ Customer base decreased by 12% YoY
▪ Data revenues (excluding SMS & VAS) grew by 36% YoY, and formed 43% of total revenues
86
100
32 30
5 4
H1-16 H1-17
Revenues EBITDA Net Income

ZAIN GROUP Q2 2017 IR PRESENTATION 20
83%Penetration
2004Year of acquisition
2.3 mCustomers
MCOwnership
ZAIN38%
OOREEDOO31%
VIVA31%
4GTechnology
99%Coverage
1,311Number of sites
touch54%
Alfa46%
MARKET SHARE
TOUCHManagement Contract
▪ Zain operates in Lebanon under a management contract since June 2004, when it was rebranded to mtc-touch, and subsequently to “touch”

FINANCIAL STATEMENTS
ZAIN GROUP Q2 2017 IR PRESENTATION 22
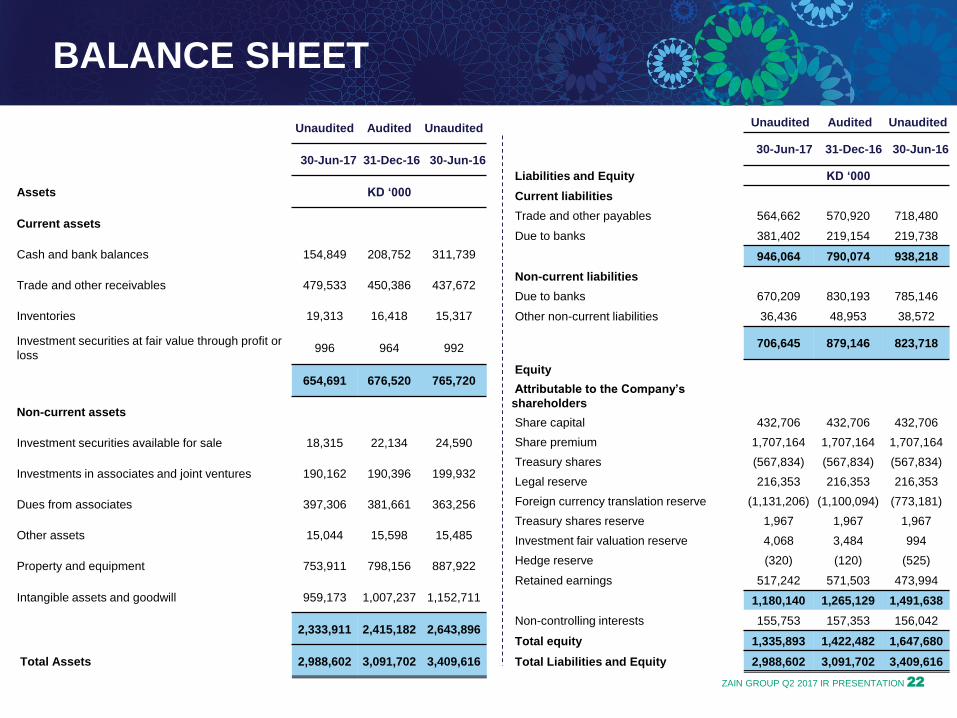
Unaudited Audited Unaudited
30-Jun-17 31-Dec-16 30-Jun-16
Assets KD ‘000
Current assets
Cash and bank balances 154,849 208,752 311,739
Trade and other receivables 479,533 450,386 437,672
Inventories 19,313 16,418 15,317
Investment securities at fair value through profit or
loss996 964 992
654,691 676,520 765,720
Non-current assets
Investment securities available for sale 18,315 22,134 24,590
Investments in associates and joint ventures 190,162 190,396 199,932
Dues from associates 397,306 381,661 363,256
Other assets 15,044 15,598 15,485
Property and equipment 753,911 798,156 887,922
Intangible assets and goodwill 959,173 1,007,237 1,152,711
2,333,911 2,415,182 2,643,896
Total Assets 2,988,602 3,091,702 3,409,616
Unaudited Audited Unaudited
30-Jun-17 31-Dec-16 30-Jun-16
Liabilities and Equity KD ‘000
Current liabilities
Trade and other payables 564,662 570,920 718,480
Due to banks 381,402 219,154 219,738
946,064 790,074 938,218
Non-current liabilities
Due to banks 670,209 830,193 785,146
Other non-current liabilities 36,436 48,953 38,572
706,645 879,146 823,718
Equity
Attributable to the Company’s
shareholders
Share capital 432,706 432,706 432,706
Share premium 1,707,164 1,707,164 1,707,164
Treasury shares (567,834) (567,834) (567,834)
Legal reserve 216,353 216,353 216,353
Foreign currency translation reserve (1,131,206) (1,100,094) (773,181)
Treasury shares reserve 1,967 1,967 1,967
Investment fair valuation reserve 4,068 3,484 994
Hedge reserve (320) (120) (525)
Retained earnings 517,242 571,503 473,994
1,180,140 1,265,129 1,491,638
Non-controlling interests 155,753 157,353 156,042
Total equity 1,335,893 1,422,482 1,647,680
Total Liabilities and Equity 2,988,602 3,091,702 3,409,616
BALANCE SHEET
ZAIN GROUP Q2 2017 IR PRESENTATION 23
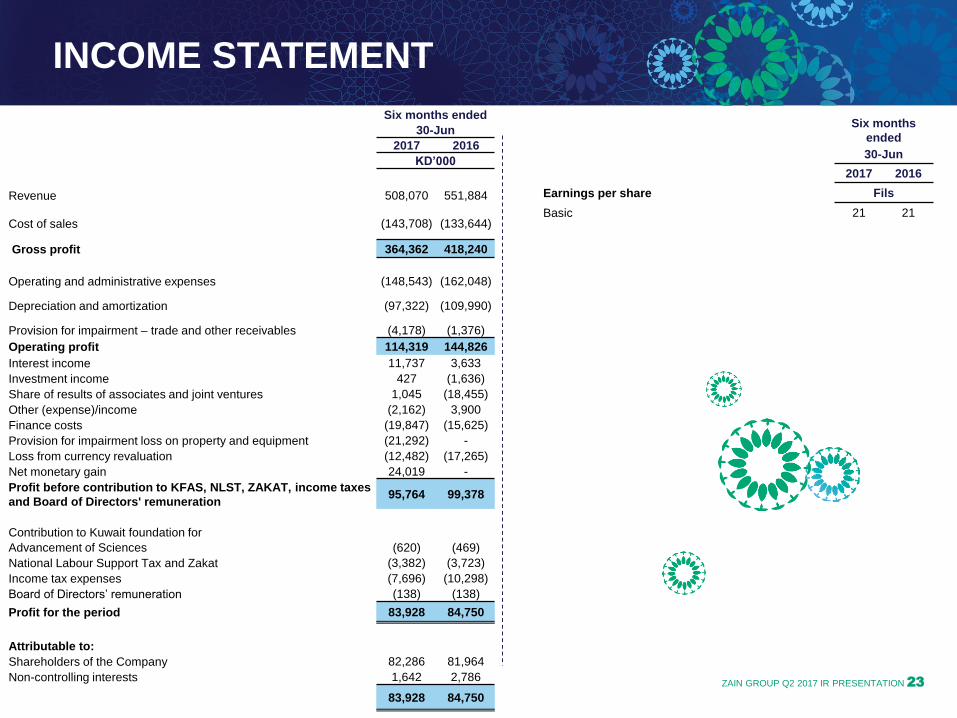
Six months
ended
30-Jun
2017 2016
Earnings per share Fils
Basic 21 21
INCOME STATEMENT
Six months ended
30-Jun
2017 2016
KD’000
Revenue 508,070 551,884
Cost of sales (143,708) (133,644)
Gross profit 364,362 418,240
Operating and administrative expenses (148,543) (162,048)
Depreciation and amortization (97,322) (109,990)
Provision for impairment – trade and other receivables (4,178) (1,376)
Operating profit 114,319 144,826
Interest income 11,737 3,633
Investment income 427 (1,636)
Share of results of associates and joint ventures 1,045 (18,455)
Other (expense)/income (2,162) 3,900
Finance costs (19,847) (15,625)
Provision for impairment loss on property and equipment (21,292) -
Loss from currency revaluation (12,482) (17,265)
Net monetary gain 24,019 -
Profit before contribution to KFAS, NLST, ZAKAT, income taxes
and Board of Directors' remuneration95,764 99,378
Contribution to Kuwait foundation for
Advancement of Sciences (620) (469)
National Labour Support Tax and Zakat (3,382) (3,723)
Income tax expenses (7,696) (10,298)
Board of Directors’ remuneration (138) (138)
Profit for the period 83,928 84,750
Attributable to:
Shareholders of the Company 82,286 81,964
Non-controlling interests 1,642 2,786
83,928 84,750
ZAIN GROUP Q2 2017 IR PRESENTATION 24
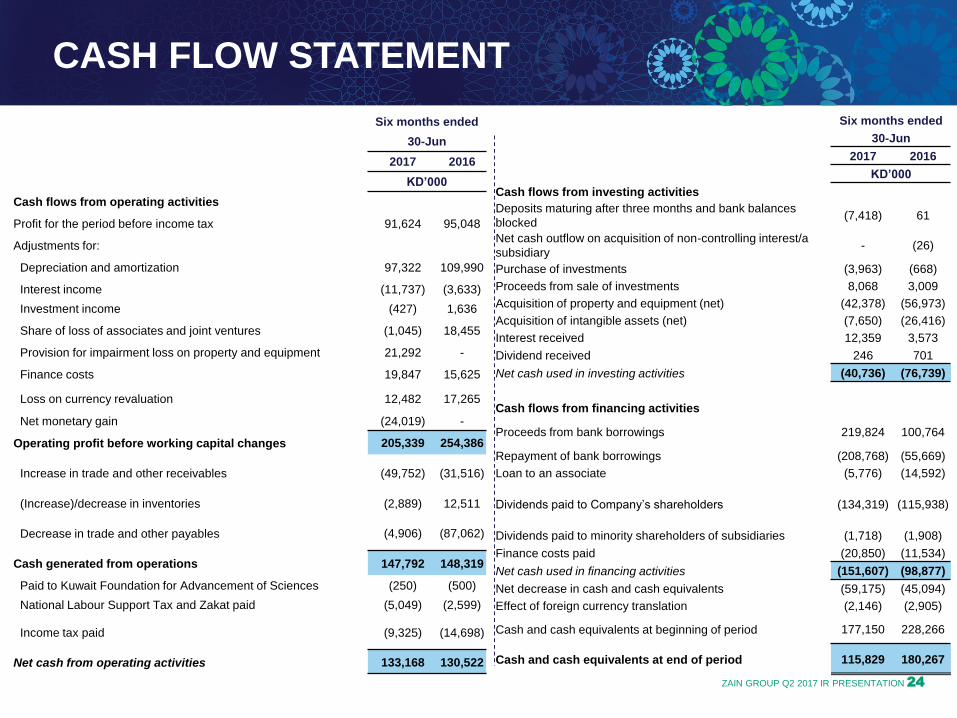
CASH FLOW STATEMENT
Six months ended
30-Jun
2017 2016
KD’000
Cash flows from operating activities
Profit for the period before income tax 91,624 95,048
Adjustments for:
Depreciation and amortization 97,322 109,990
Interest income (11,737) (3,633)
Investment income (427) 1,636
Share of loss of associates and joint ventures (1,045) 18,455
Provision for impairment loss on property and equipment 21,292 -
Finance costs 19,847 15,625
Loss on currency revaluation 12,482 17,265
Net monetary gain (24,019) -
Operating profit before working capital changes 205,339 254,386
Increase in trade and other receivables (49,752) (31,516)
(Increase)/decrease in inventories (2,889) 12,511
Decrease in trade and other payables (4,906) (87,062)
Cash generated from operations 147,792 148,319
Paid to Kuwait Foundation for Advancement of Sciences (250) (500)
National Labour Support Tax and Zakat paid (5,049) (2,599)
Income tax paid (9,325) (14,698)
Net cash from operating activities 133,168 130,522
Six months ended
30-Jun
2017 2016
KD’000
Cash flows from investing activities
Deposits maturing after three months and bank balances
blocked(7,418) 61
Net cash outflow on acquisition of non-controlling interest/a
subsidiary- (26)
Purchase of investments (3,963) (668)
Proceeds from sale of investments 8,068 3,009
Acquisition of property and equipment (net) (42,378) (56,973)
Acquisition of intangible assets (net) (7,650) (26,416)
Interest received 12,359 3,573
Dividend received 246 701
Net cash used in investing activities (40,736) (76,739)
Cash flows from financing activities
Proceeds from bank borrowings 219,824 100,764
Repayment of bank borrowings (208,768) (55,669)
Loan to an associate (5,776) (14,592)
Dividends paid to Company’s shareholders (134,319) (115,938)
Dividends paid to minority shareholders of subsidiaries (1,718) (1,908)
Finance costs paid (20,850) (11,534)
Net cash used in financing activities (151,607) (98,877)
Net decrease in cash and cash equivalents (59,175) (45,094)
Effect of foreign currency translation (2,146) (2,905)
Cash and cash equivalents at beginning of period 177,150 228,266
Cash and cash equivalents at end of period 115,829 180,267

FINANCIAL STATEMENTS
Website : zain.com
Email : [email protected]
Note: Mobile Penetration rates are sourced from WCIS as of June 2017
THANK YOU