Zack Lane ReCAP Coordinator July 31, 2012 ReCAP Columbia University.
50
ASCC: ReCAP Data Summary Zack Lane ReCAP Coordinator July 31, 2012 ReCAP Columbia University
-
Upload
beverley-warren -
Category
Documents
-
view
228 -
download
0
Transcript of Zack Lane ReCAP Coordinator July 31, 2012 ReCAP Columbia University.
ASCC:ReCAP Data Summary
Zack LaneReCAP Coordinator
July 31, 2012
ReCAPColumbia University
ReCAPColumbia University
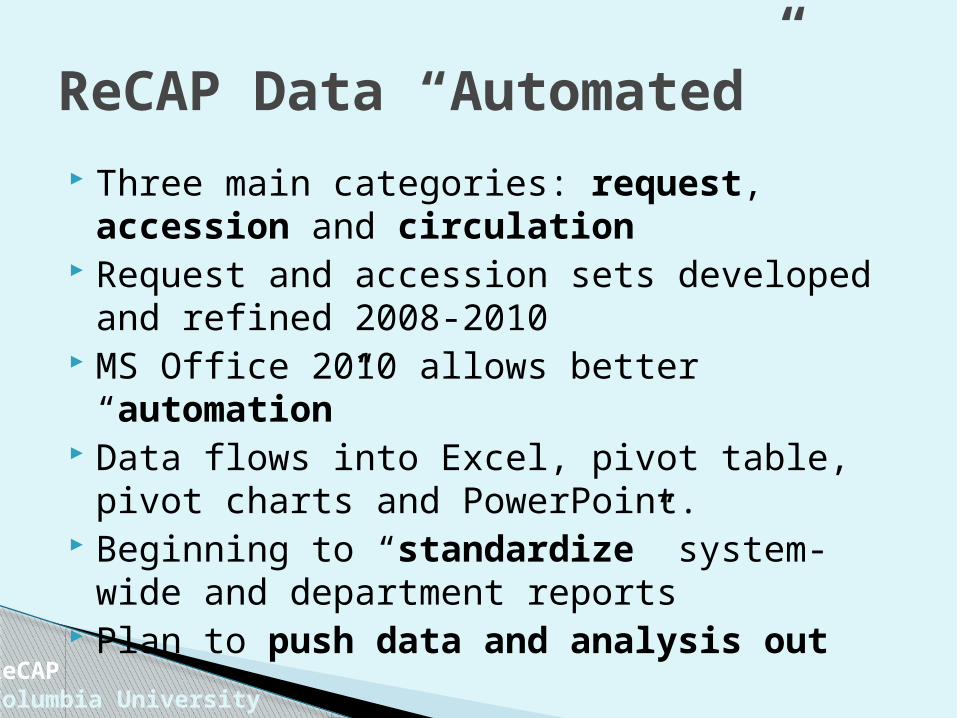
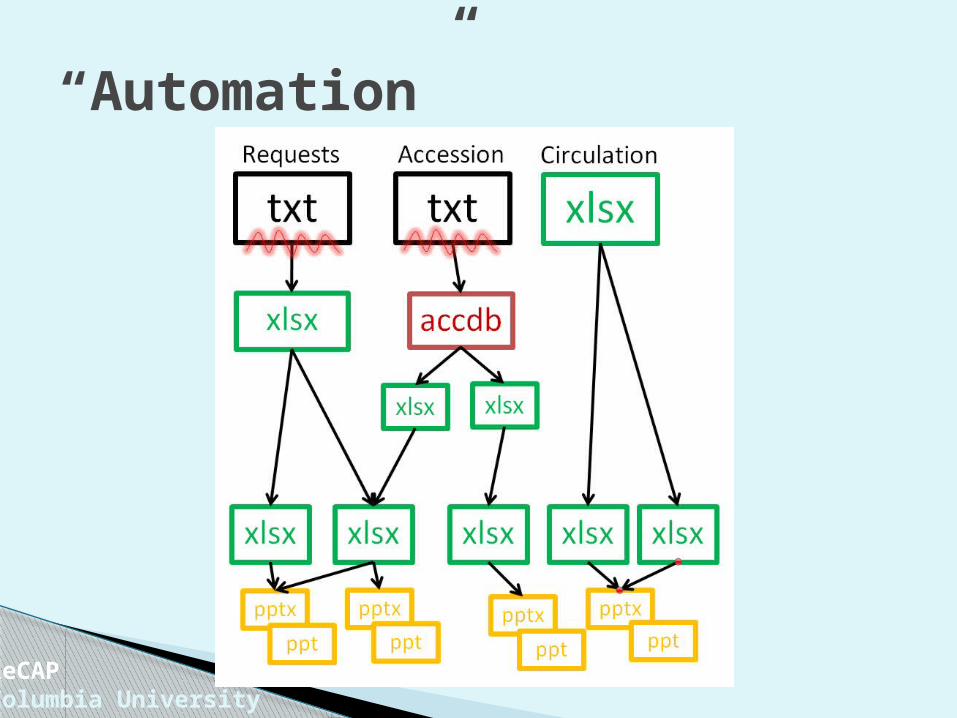
ReCAP Data “Automated” Three main categories: request, accession
and circulation Request and accession sets developed and
refined 2008-2010 MS Office 2010 allows better “automation” Data flows into Excel, pivot table, pivot
charts and PowerPoint. Beginning to “standardize” system-wide
and department reports Plan to push data and analysis out
ReCAPColumbia University
“Automation”
ReCAPColumbia University
Where is the data? ReCAP Data Center is clearinghouse for
system-wide data and analysis◦ Request rate◦ Timing of requests◦ High use titles◦ High volume requests◦ EDD◦ Publication Date (Monographs)
Department websites have both explicit data and presentations
ReCAPColumbia University
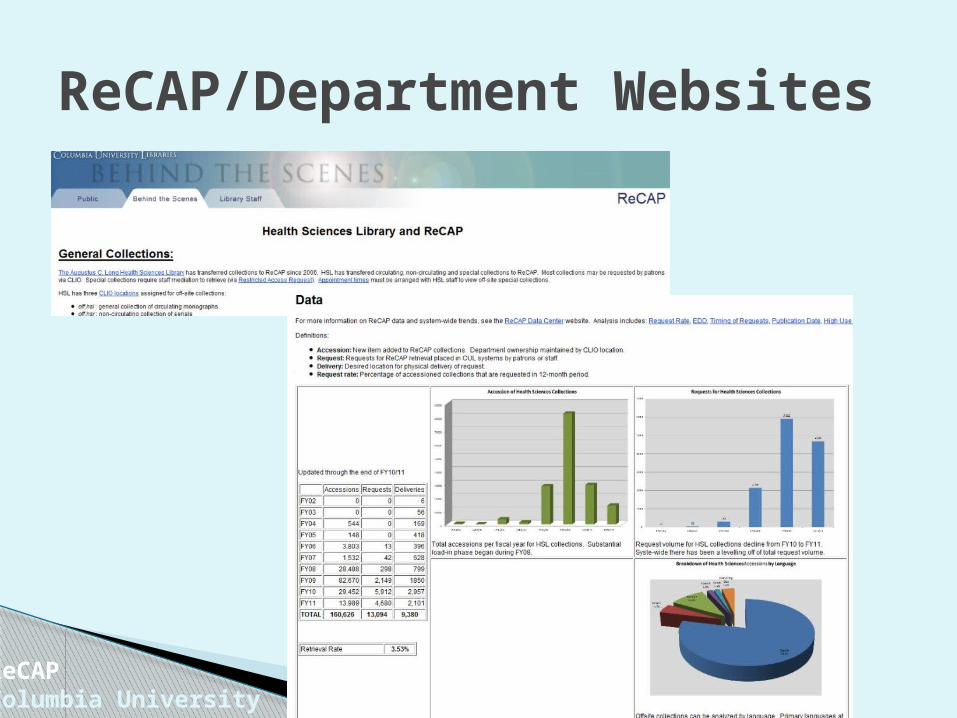
ReCAP/Department Websites
ReCAPColumbia University
Circulation Mining ReCAP data but also looking at
system-wide and department trends Internship project found evidence in data of:
◦ Policy changes: REG loan period 4-weeks to 1 term◦ System/Procedure: BDirect loans charge to BDX◦ User behavior patterns: charge/renewal patterns
Dept. analysis limits by happening location Crafting analysis will be iterative process Note: Circ data includes on campus
collections Can interesting visuals be useful?
ReCAPColumbia University
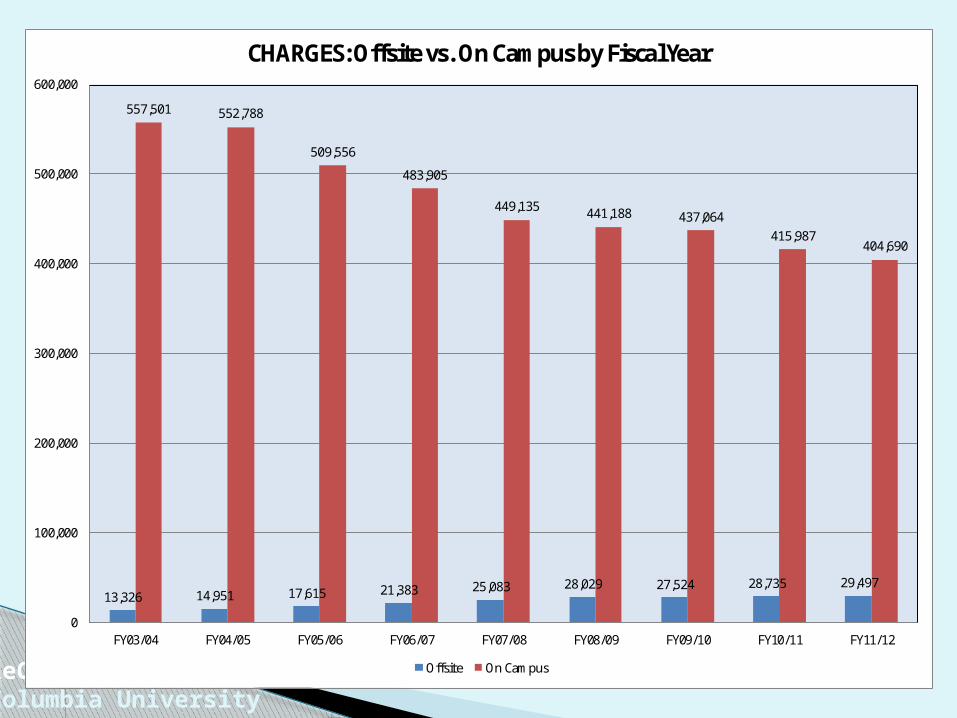
13,326 14,951 17,615 21,383 25,083 28,029 27,524 28,735 29,497
557,501 552,788
509,556
483,905
449,135 441,188 437,064415,987
404,690
0
100,000
200,000
300,000
400,000
500,000
600,000
FY03/04 FY04/05 FY05/06 FY06/07 FY07/08 FY08/09 FY09/10 FY10/11 FY11/12
CHARGES: Offsite vs. On Campus by Fiscal Year
Offsite On Campus
ReCAPColumbia University
0
100,000
200,000
300,000
400,000
500,000
600,000
700,000
800,000
January February March April May June July August September October November December
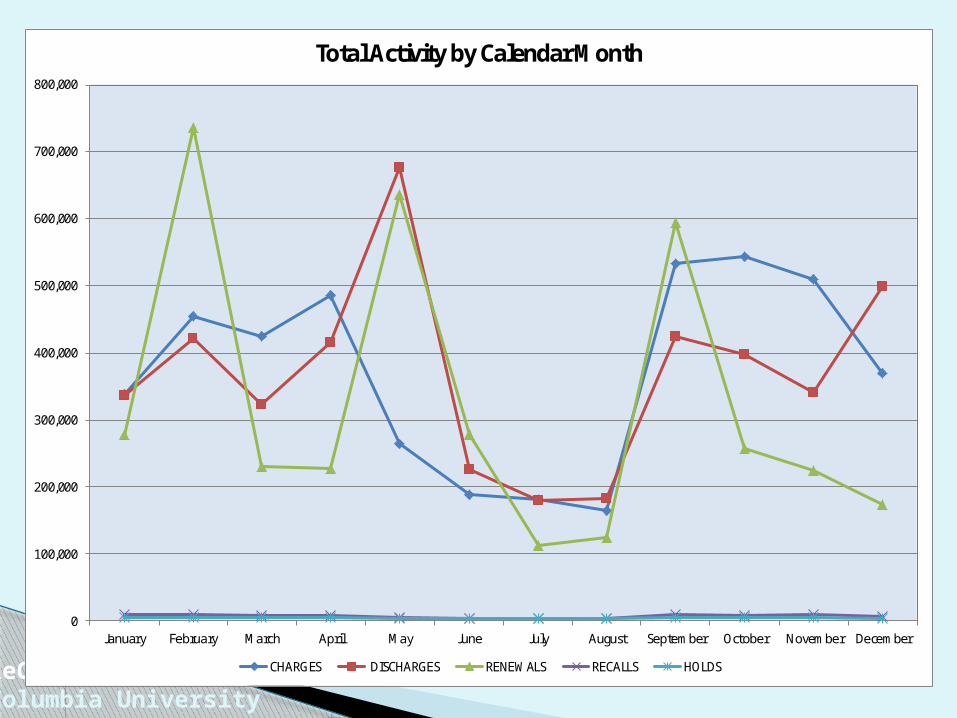
Total Activity by Calendar Month
CHARGES DISCHARGES RENEWALS RECALLS HOLDS
ReCAPColumbia University
0
50,000
100,000
150,000
200,000
250,000
300,000
January February March April May June July August September October November December
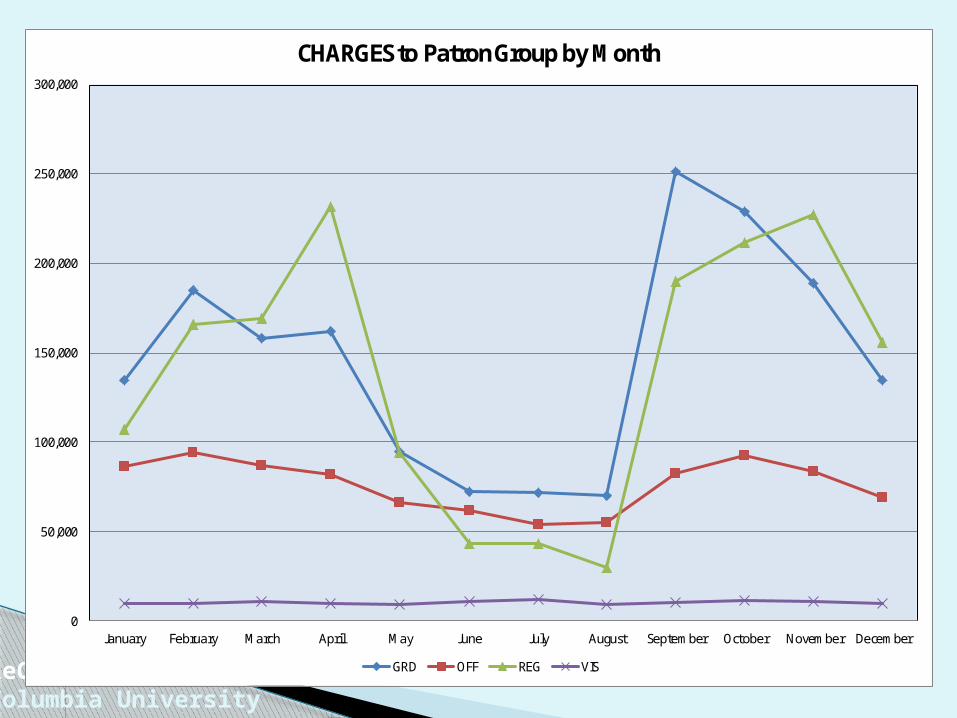
CHARGES to Patron Group by Month
GRD OFF REG VIS
ReCAPColumbia University
0
100,000
200,000
300,000
400,000
500,000
600,000
FY03/04 FY04/05 FY05/06 FY06/07 FY07/08 FY08/09 FY09/10 FY10/11 FY11/12
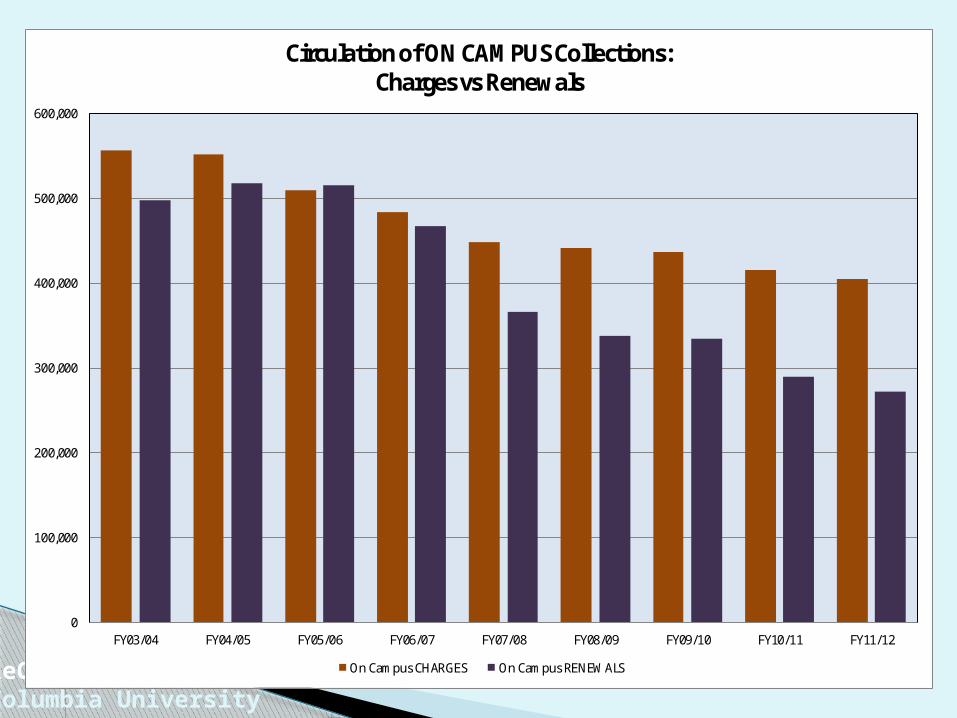
Circulation of ON CAMPUS Collections: Charges vs Renewals
On Campus CHARGES On Campus RENEWALS
ReCAPColumbia University
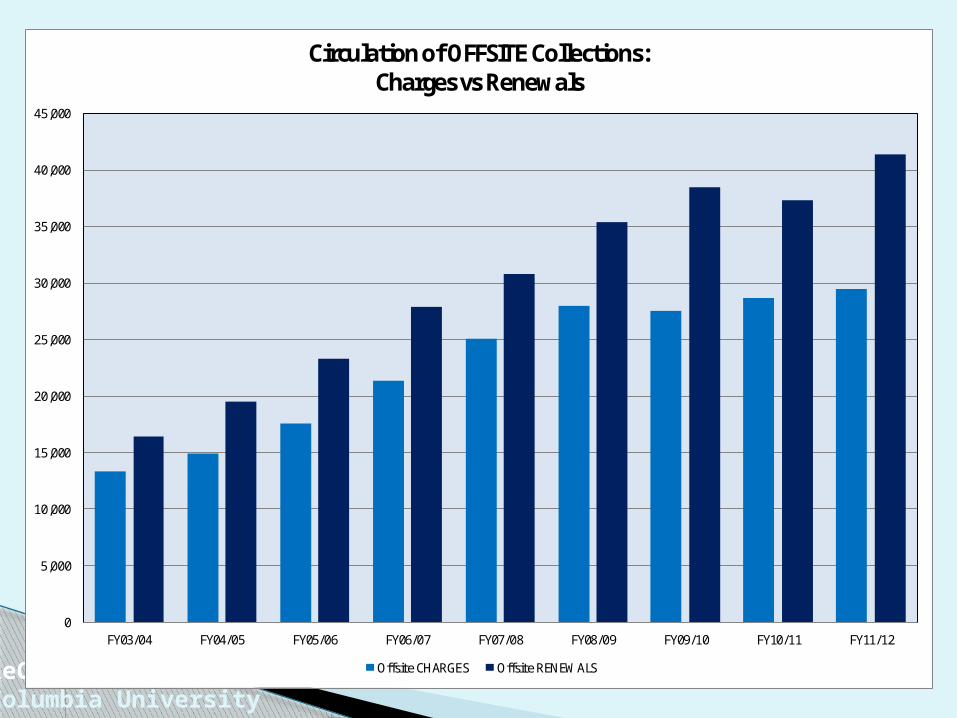
0
5,000
10,000
15,000
20,000
25,000
30,000
35,000
40,000
45,000
FY03/04 FY04/05 FY05/06 FY06/07 FY07/08 FY08/09 FY09/10 FY10/11 FY11/12
Circulation of OFFSITE Collections: Charges vs Renewals
Offsite CHARGES Offsite RENEWALS
ReCAPColumbia University
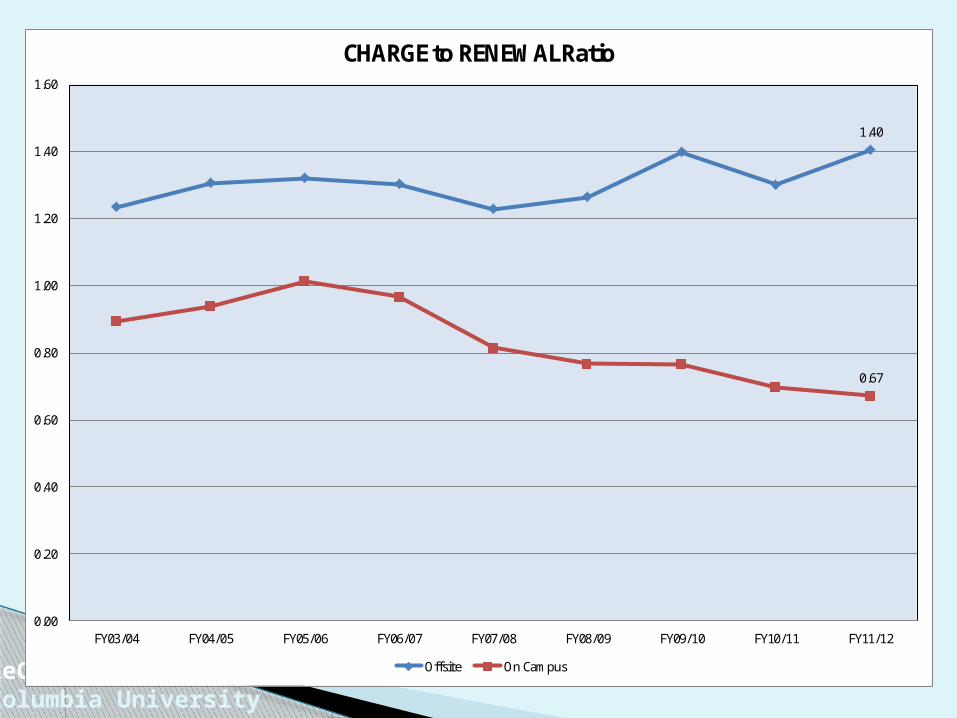
0.67
1.40
0.00
0.20
0.40
0.60
0.80
1.00
1.20
1.40
1.60
FY03/04 FY04/05 FY05/06 FY06/07 FY07/08 FY08/09 FY09/10 FY10/11 FY11/12
CHARGE to RENEWAL Ratio
Offsite On Campus
ReCAPColumbia University
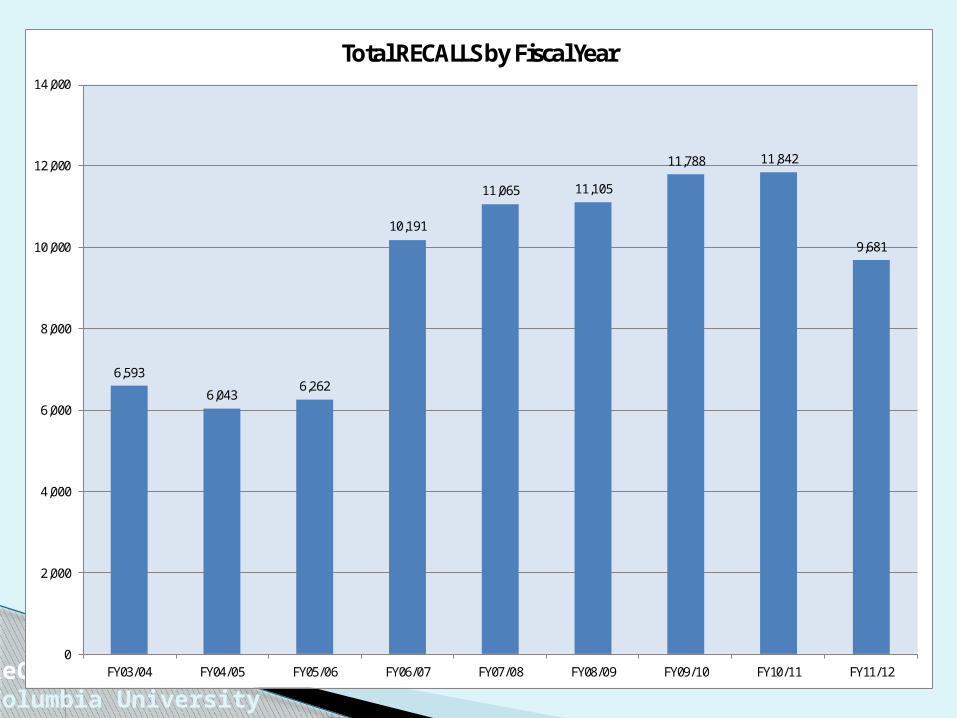
6,593
6,0436,262
10,191
11,065 11,105
11,788 11,842
9,681
0
2,000
4,000
6,000
8,000
10,000
12,000
14,000
FY03/04 FY04/05 FY05/06 FY06/07 FY07/08 FY08/09 FY09/10 FY10/11 FY11/12
Total RECALLS by Fiscal Year
ReCAPColumbia University
0
2,000
4,000
6,000
8,000
10,000
12,000
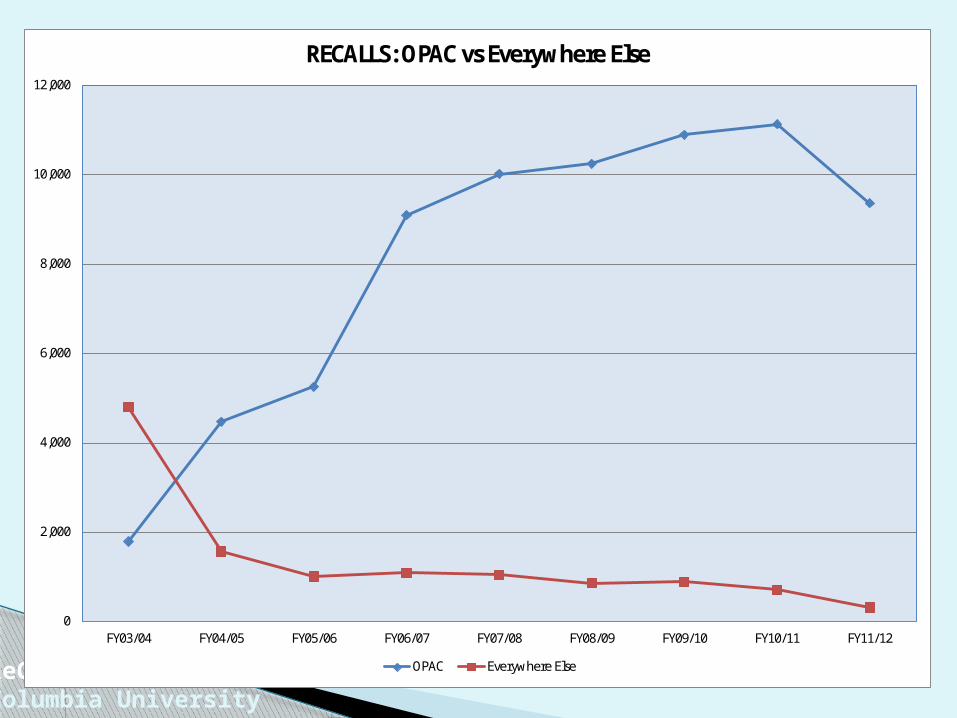
FY03/04 FY04/05 FY05/06 FY06/07 FY07/08 FY08/09 FY09/10 FY10/11 FY11/12
RECALLS: OPAC vs Everywhere Else
OPAC Everywhere Else
ReCAPColumbia University
0
1,000
2,000
3,000
4,000
5,000
6,000
7,000
8,000
FY03/04 FY04/05 FY05/06 FY06/07 FY07/08 FY08/09 FY09/10 FY10/11 FY11/12
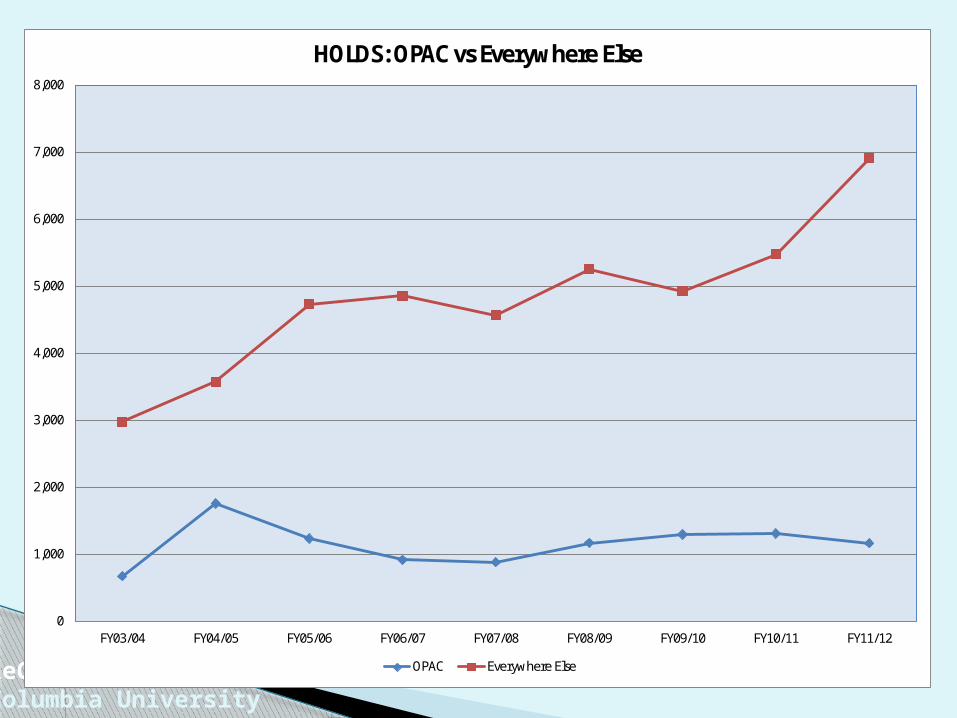
HOLDS: OPAC vs Everywhere Else
OPAC Everywhere Else
Tailored to both department data and need
Available on ReCAP website Metrics by
◦ Activity types◦ Total charges◦ Patron Group◦ Sub-collections
Department Circ Analysis
ReCAPColumbia University
ReCAPColumbia University
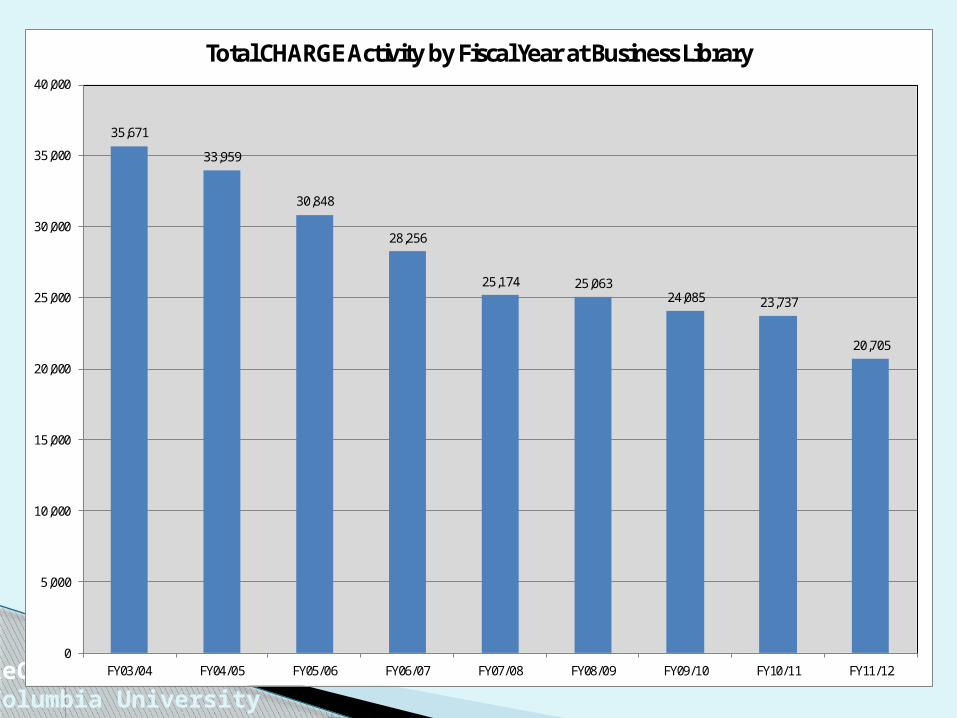
35,671
33,959
30,848
28,256
25,174 25,06324,085 23,737
20,705
0
5,000
10,000
15,000
20,000
25,000
30,000
35,000
40,000
FY03/04 FY04/05 FY05/06 FY06/07 FY07/08 FY08/09 FY09/10 FY10/11 FY11/12
Total CHARGE Activity by Fiscal Year at Business Library
ReCAPColumbia University
0%
10%
20%
30%
40%
50%
60%
70%
80%
90%
100%
FY03/04 FY04/05 FY05/06 FY06/07 FY07/08 FY08/09 FY09/10 FY10/11
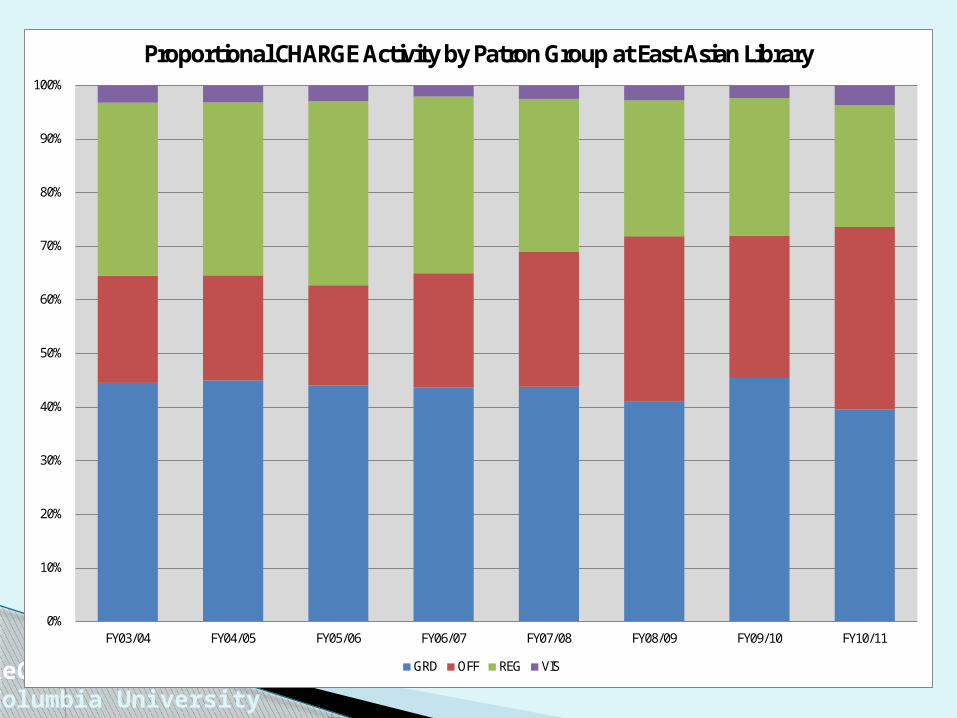
Proportional CHARGE Activity by Patron Group at East Asian Library
GRD OFF REG VIS
ReCAPColumbia University
0
2,000
4,000
6,000
8,000
10,000
12,000
14,000
16,000
FY03/04 FY04/05 FY05/06 FY06/07 FY07/08 FY08/09 FY09/10 FY10/11 FY11/12
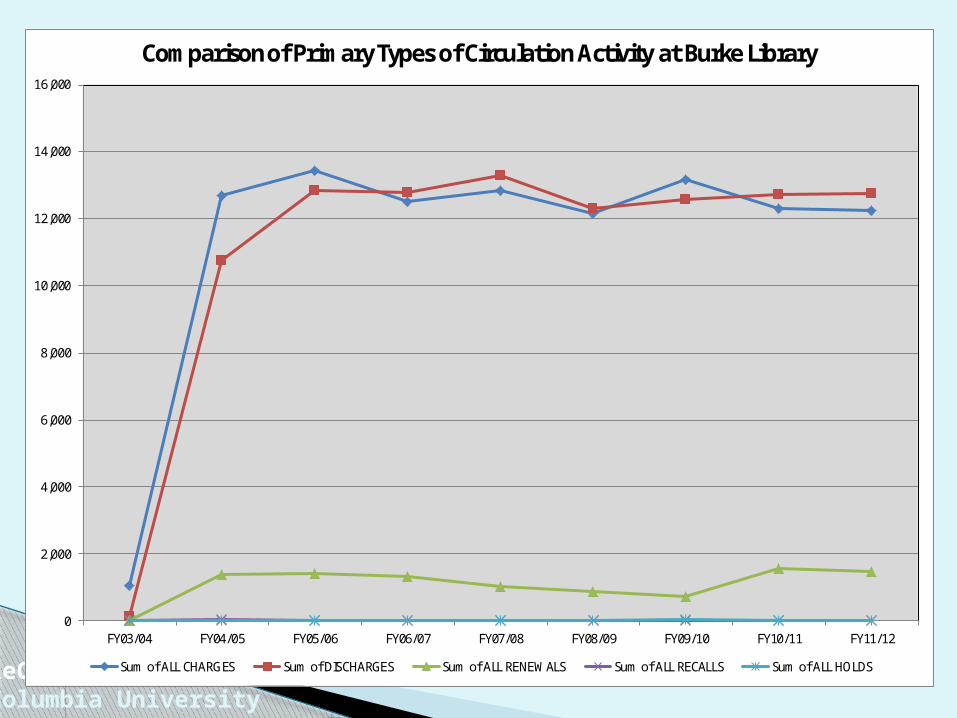
Comparison of Primary Types of Circulation Activity at Burke Library
Sum of ALL CHARGES Sum of DISCHARGES Sum of ALL RENEWALS Sum of ALL RECALLS Sum of ALL HOLDS
ReCAPColumbia University
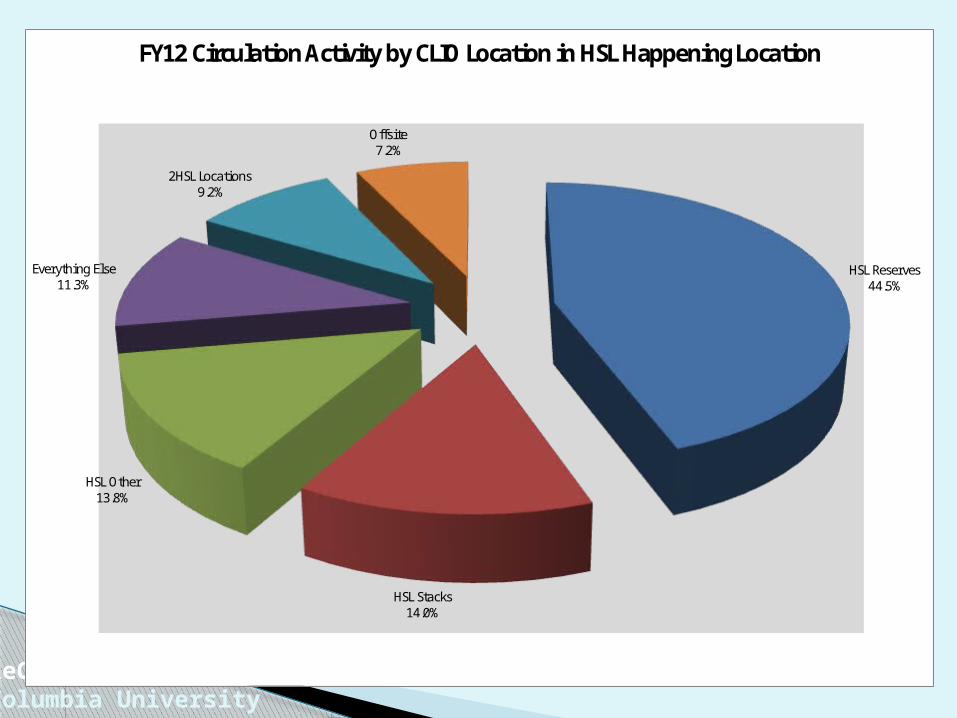
HSL Reserves44.5%
HSL Stacks14.0%
HSL Other13.8%
Everything Else11.3%
2HSL Locations9.2%
Offsite7.2%
FY12 Circulation Activity by CLIO Location in HSL Happening Location
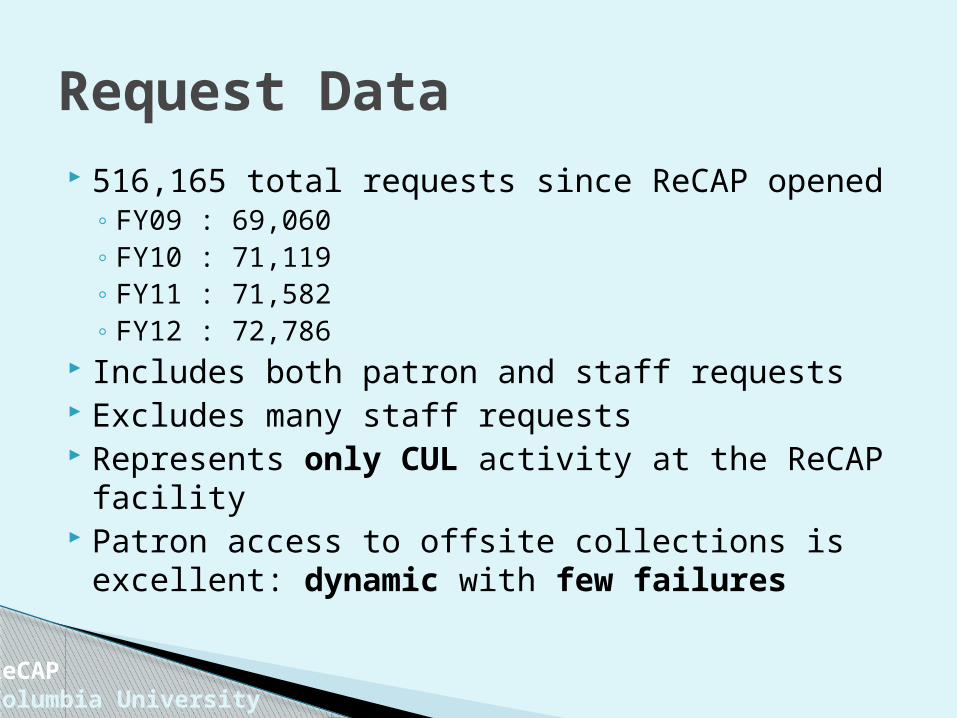
516,165 total requests since ReCAP opened◦ FY09 : 69,060◦ FY10 : 71,119◦ FY11 : 71,582◦ FY12 : 72,786
Includes both patron and staff requests Excludes many staff requests Represents only CUL activity at the ReCAP
facility Patron access to offsite collections is
excellent: dynamic with few failures
Request Data
ReCAPColumbia University
ReCAPColumbia University
0
1,000
2,000
3,000
4,000
5,000
6,000
7,000
8,0003/
1/20
02
6/1/
2002
9/1/
2002
12/1
/200
2
3/1/
2003
6/1/
2003
9/1/
2003
12/1
/200
3
3/1/
2004
6/1/
2004
9/1/
2004
12/1
/200
4
3/1/
2005
6/1/
2005
9/1/
2005
12/1
/200
5
3/1/
2006
6/1/
2006
9/1/
2006
12/1
/200
6
3/1/
2007
6/1/
2007
9/1/
2007
12/1
/200
7
3/1/
2008
6/1/
2008
9/1/
2008
12/1
/200
8
3/1/
2009
6/1/
2009
9/1/
2009
12/1
/200
9
3/1/
2010
6/1/
2010
9/1/
2010
12/1
/201
0
3/1/
2011
6/1/
2011
9/1/
2011
12/1
/201
1
3/1/
2012
6/1/
2012
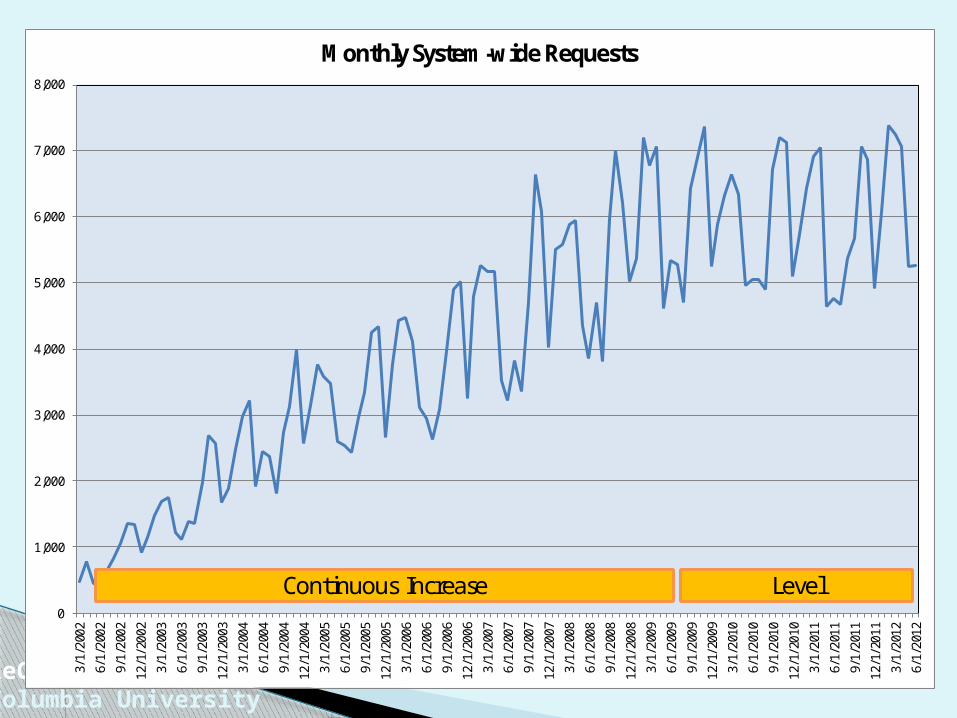
Monthly System-wide Requests
Continuous Increase Level
ReCAPColumbia University
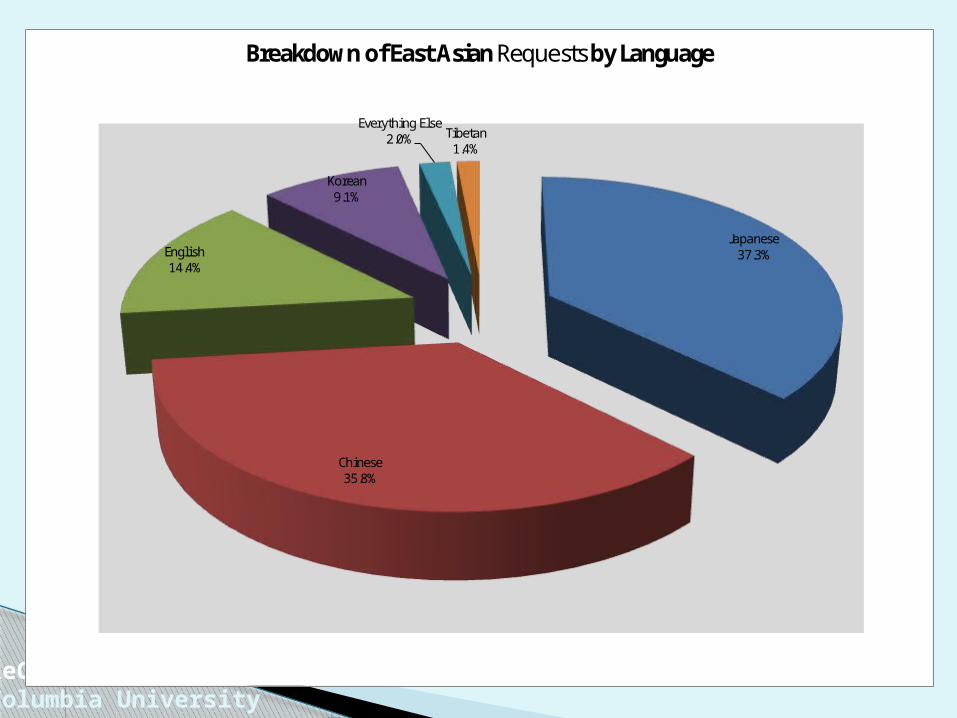
Japanese37.3%
Chinese35.8%
English14.4%
Korean9.1%
Everything Else2.0% Tibetan
1.4%
Breakdown of East Asian Requests by Language
ReCAPColumbia University
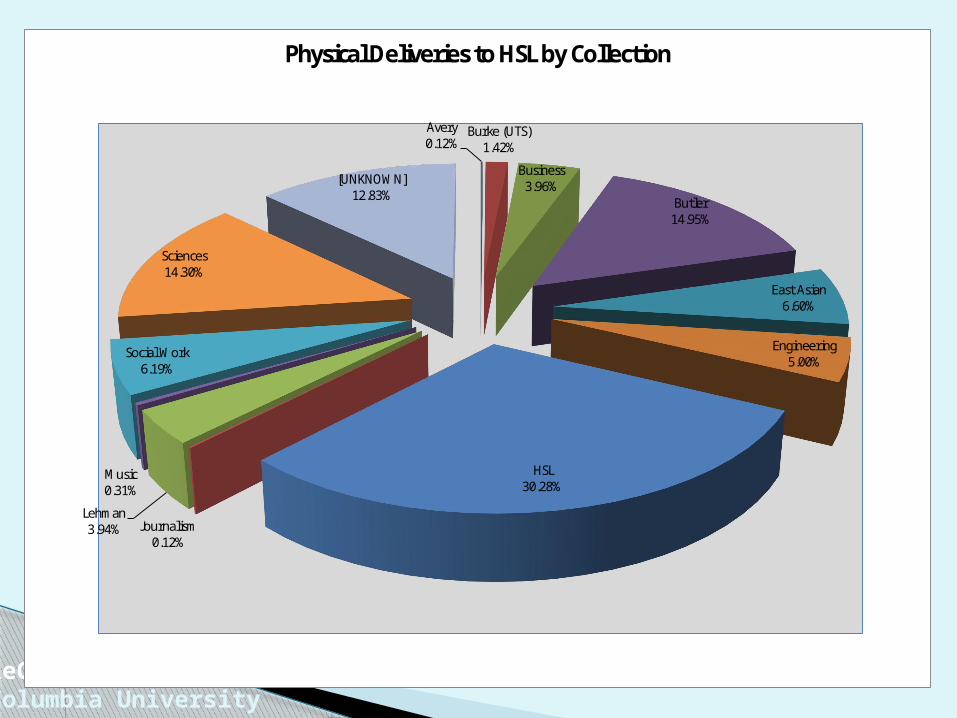
Avery0.12%
Burke (UTS)1.42%
Business3.96%
Butler14.95%
East Asian6.60%
Engineering5.00%
HSL30.28%
Journalism0.12%
Lehman3.94%
Music0.31%
Social Work6.19%
Sciences14.30%
[UNKNOWN]12.83%
Physical Deliveries to HSL by Collection
ReCAPColumbia University
0
50
100
150
200
250
300
350
400
450
5003/
1/20
02
6/1/
2002
9/1/
2002
12/1
/200
2
3/1/
2003
6/1/
2003
9/1/
2003
12/1
/200
3
3/1/
2004
6/1/
2004
9/1/
2004
12/1
/200
4
3/1/
2005
6/1/
2005
9/1/
2005
12/1
/200
5
3/1/
2006
6/1/
2006
9/1/
2006
12/1
/200
6
3/1/
2007
6/1/
2007
9/1/
2007
12/1
/200
7
3/1/
2008
6/1/
2008
9/1/
2008
12/1
/200
8
3/1/
2009
6/1/
2009
9/1/
2009
12/1
/200
9
3/1/
2010
6/1/
2010
9/1/
2010
12/1
/201
0
3/1/
2011
6/1/
2011
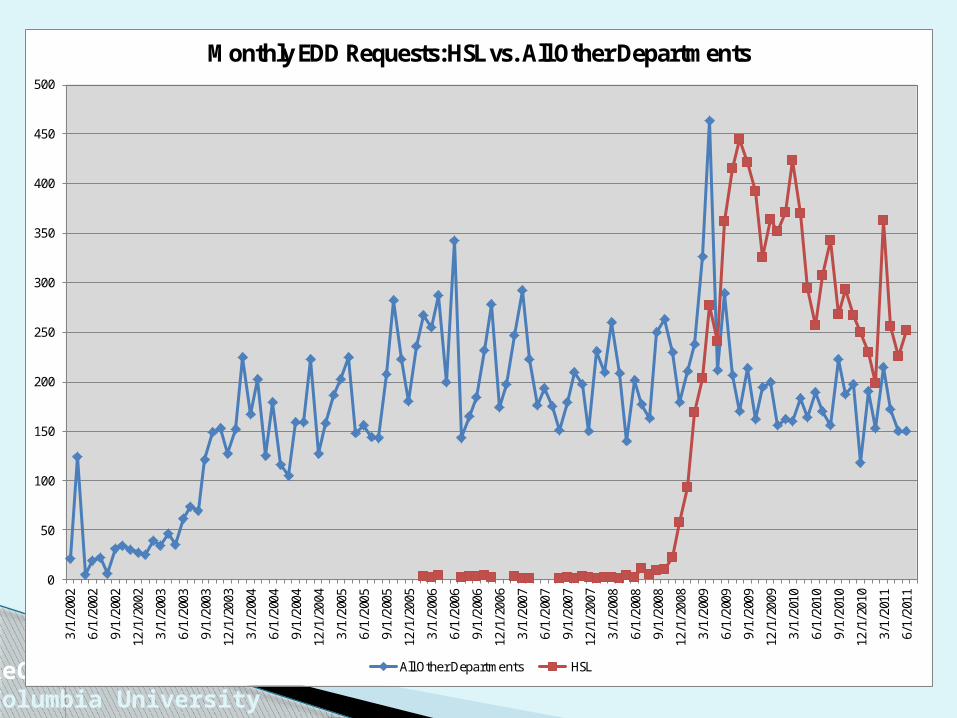
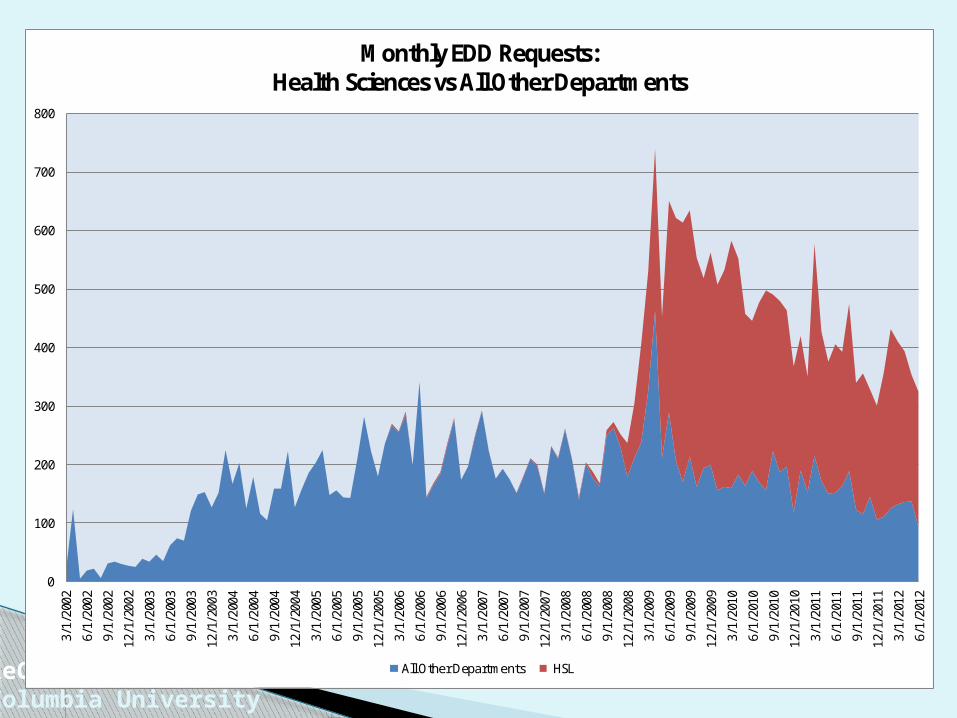
Monthly EDD Requests: HSL vs. All Other Departments
All Other Departments HSL
ReCAPColumbia University
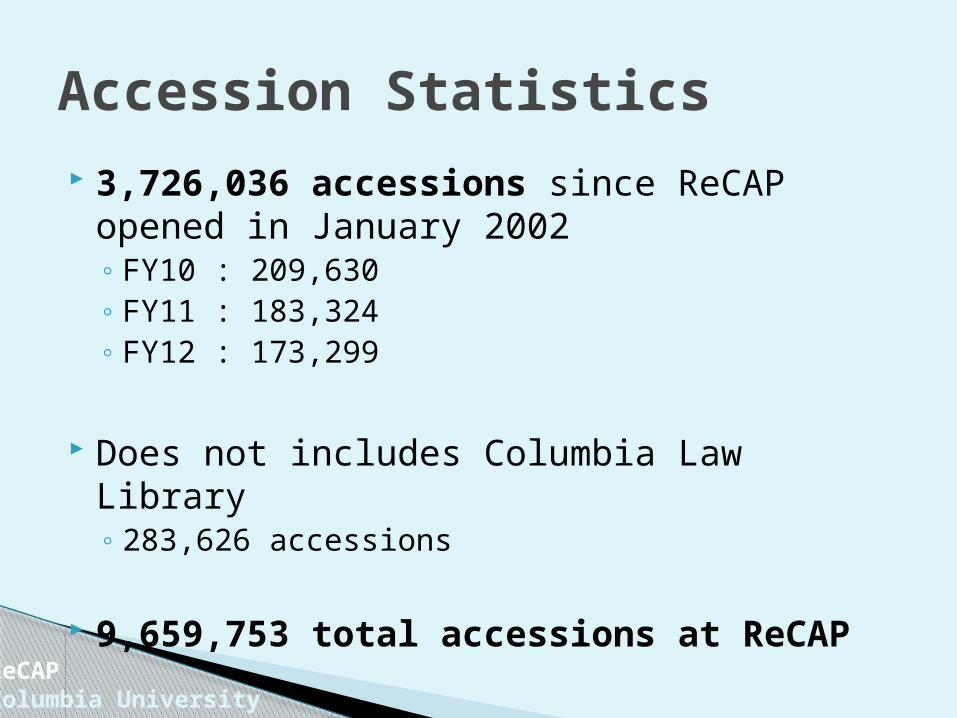
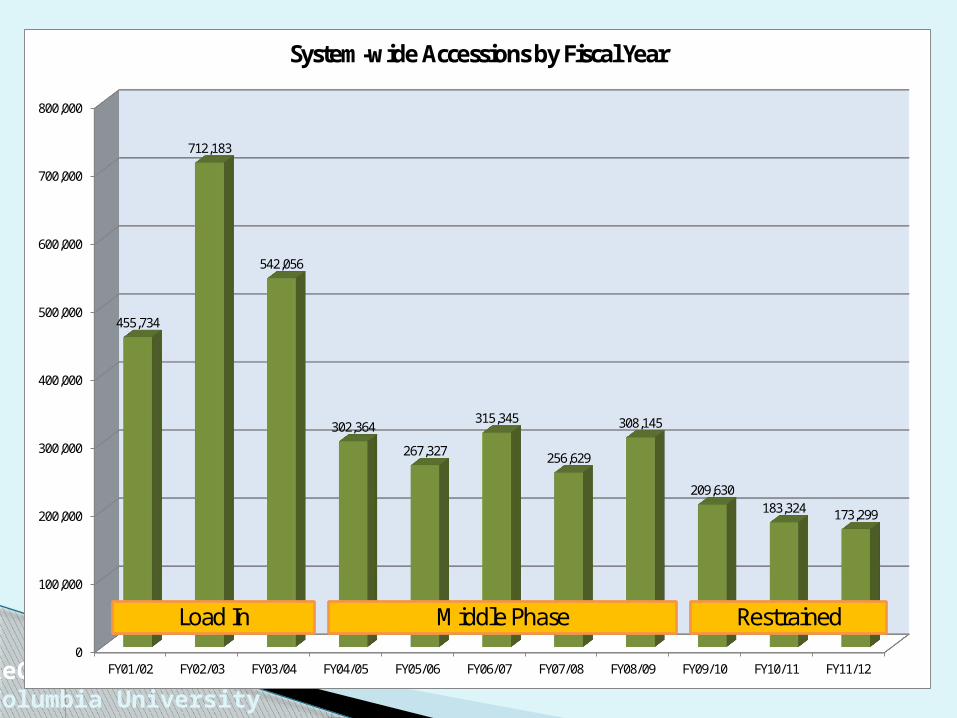
Accession Statistics 3,726,036 accessions since ReCAP
opened in January 2002◦ FY10 : 209,630◦ FY11 : 183,324 ◦ FY12 : 173,299
Does not includes Columbia Law Library◦ 283,626 accessions
9,659,753 total accessions at ReCAP
ReCAPColumbia University
0
100,000
200,000
300,000
400,000
500,000
600,000
700,000
800,000
FY01/02 FY02/03 FY03/04 FY04/05 FY05/06 FY06/07 FY07/08 FY08/09 FY09/10 FY10/11 FY11/12
455,734
712,183
542,056
302,364
267,327
315,345
256,629
308,145
209,630183,324 173,299
System-wide Accessions by Fiscal Year
Load In Middle Phase Restrained
ReCAPColumbia University
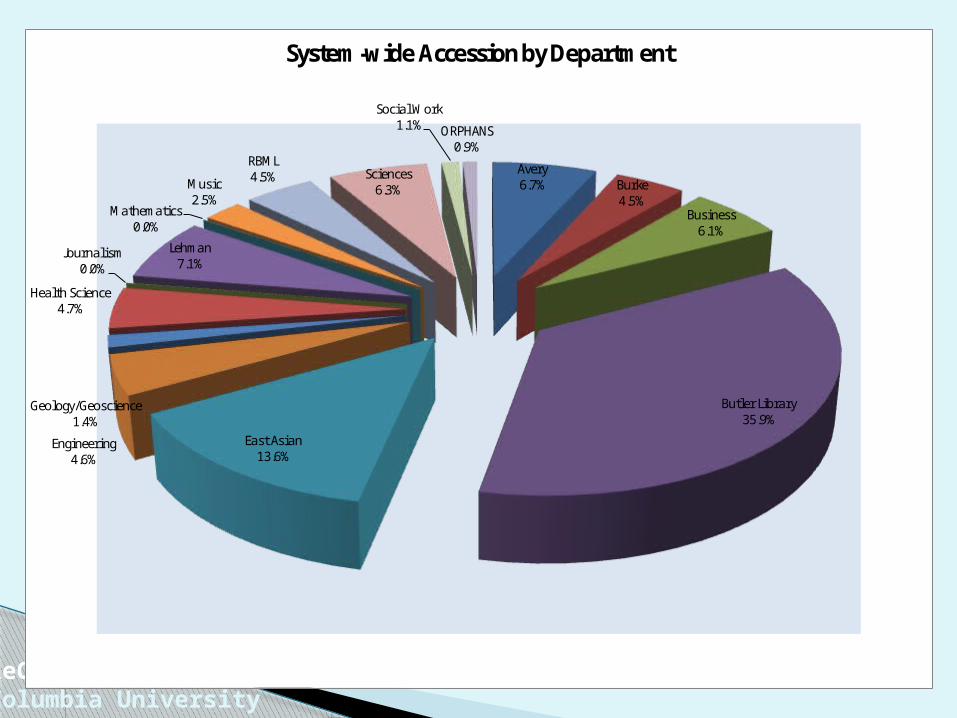
Avery6.7% Burke
4.5%Business
6.1%
Butler Library35.9%
East Asian13.6%
Engineering4.6%
Geology/Geoscience1.4%
Health Science4.7%
Journalism0.0%
Lehman7.1%
Mathematics0.0%
Music2.5%
RBML4.5% Sciences
6.3%
Social Work1.1% ORPHANS
0.9%
System-wide Accession by Department
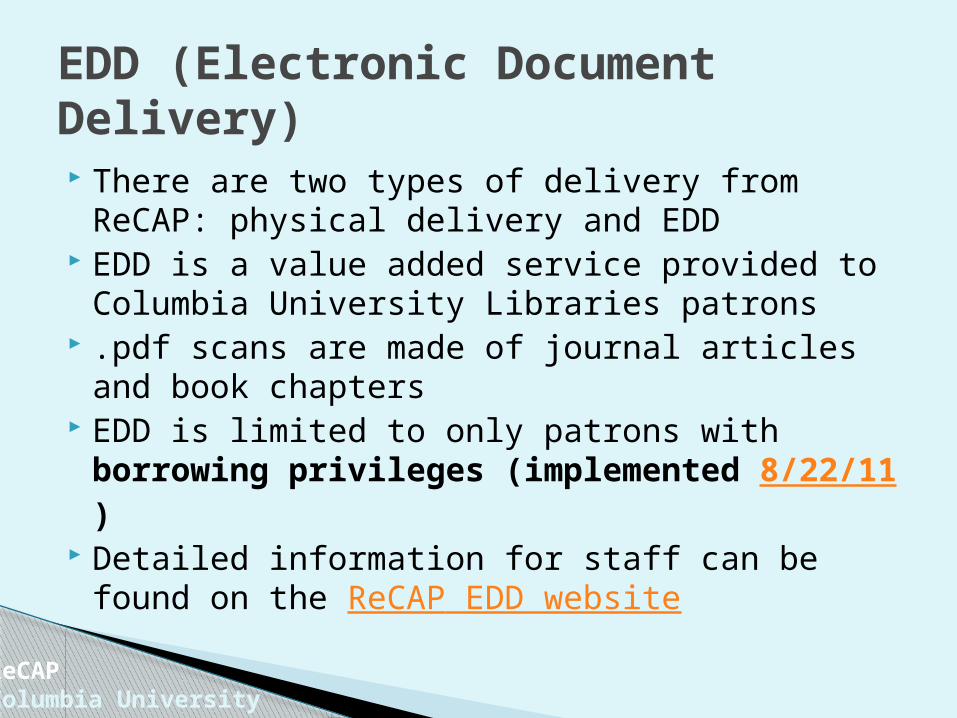
There are two types of delivery from ReCAP: physical delivery and EDD
EDD is a value added service provided to Columbia University Libraries patrons
.pdf scans are made of journal articles and book chapters
EDD is limited to only patrons with borrowing privileges (implemented 8/22/11)
Detailed information for staff can be found on the ReCAP EDD website
EDD (Electronic Document Delivery)
ReCAPColumbia University
ReCAPColumbia University
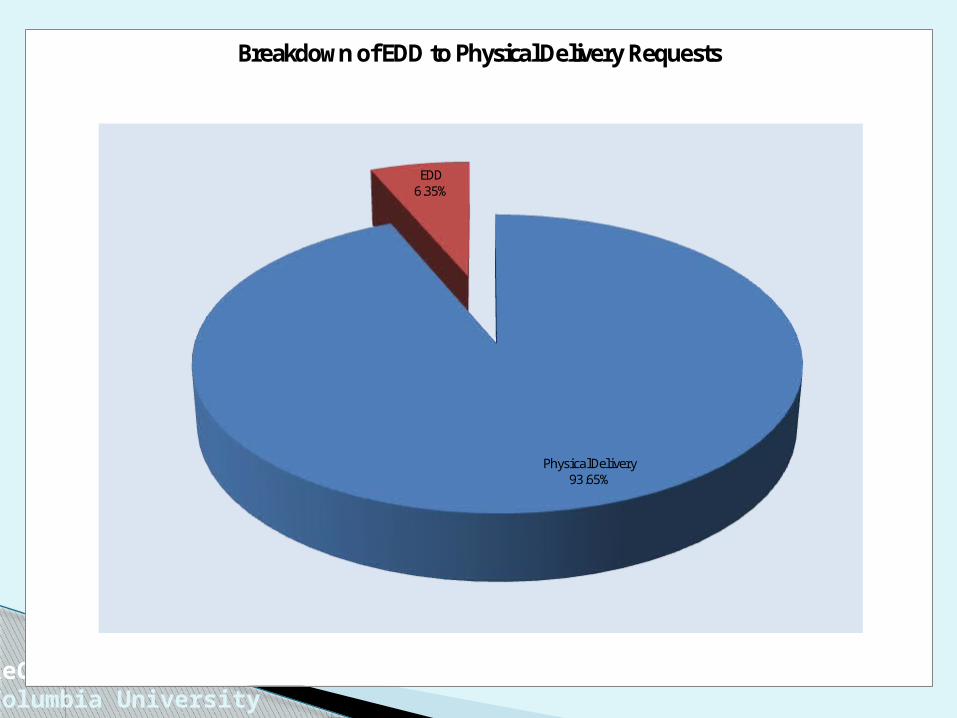
Physical Delivery93.65%
EDD6.35%
Breakdown of EDD to Physical Delivery Requests
ReCAPColumbia University
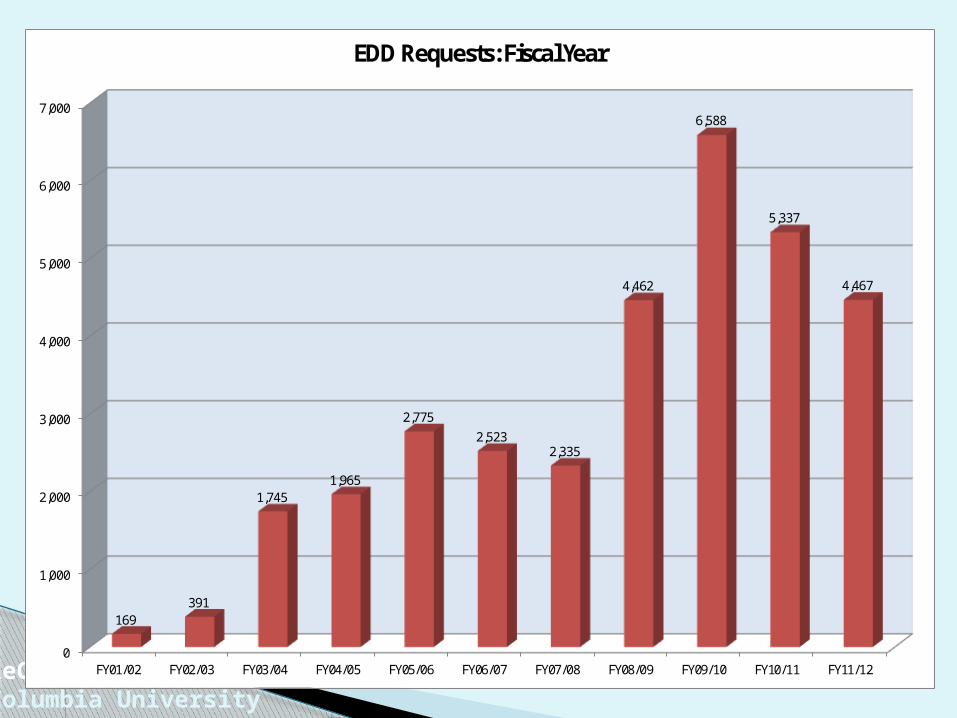
0
1,000
2,000
3,000
4,000
5,000
6,000
7,000
FY01/02 FY02/03 FY03/04 FY04/05 FY05/06 FY06/07 FY07/08 FY08/09 FY09/10 FY10/11 FY11/12
169391
1,7451,965
2,7752,523
2,335
4,462
6,588
5,337
4,467
EDD Requests: Fiscal Year
ReCAPColumbia University
0
100
200
300
400
500
600
700
800
3/1/
2002
6/1/
2002
9/1/
2002
12/1
/200
2
3/1/
2003
6/1/
2003
9/1/
2003
12/1
/200
3
3/1/
2004
6/1/
2004
9/1/
2004
12/1
/200
4
3/1/
2005
6/1/
2005
9/1/
2005
12/1
/200
5
3/1/
2006
6/1/
2006
9/1/
2006
12/1
/200
6
3/1/
2007
6/1/
2007
9/1/
2007
12/1
/200
7
3/1/
2008
6/1/
2008
9/1/
2008
12/1
/200
8
3/1/
2009
6/1/
2009
9/1/
2009
12/1
/200
9
3/1/
2010
6/1/
2010
9/1/
2010
12/1
/201
0
3/1/
2011
6/1/
2011
9/1/
2011
12/1
/201
1
3/1/
2012
6/1/
2012
Monthly EDD Requests:Health Sciences vs All Other Departments
All Other Departments HSL
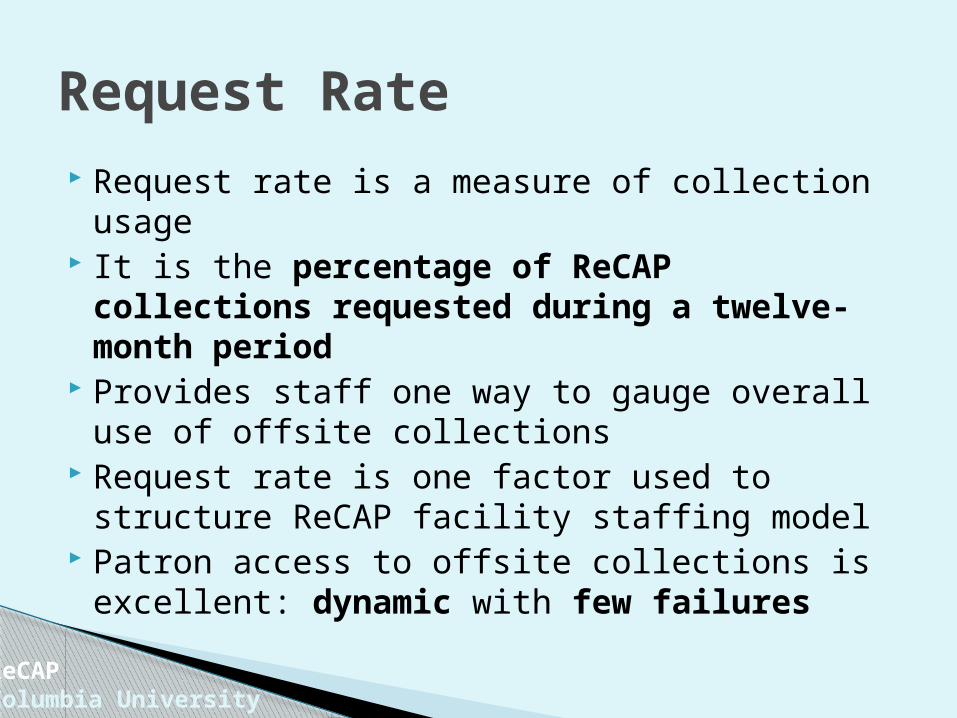
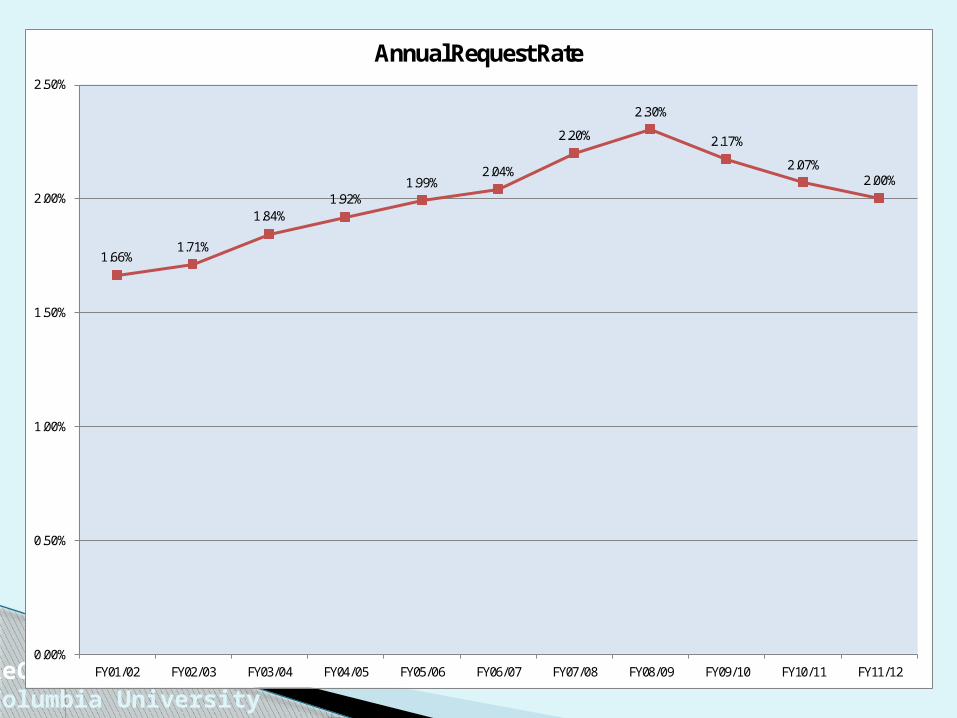
Request rate is a measure of collection usage It is the percentage of ReCAP collections
requested during a twelve-month period Provides staff one way to gauge overall use of
offsite collections Request rate is one factor used to structure
ReCAP facility staffing model Patron access to offsite collections is
excellent: dynamic with few failures
Request Rate
ReCAPColumbia University
ReCAPColumbia University
0.00%
0.50%
1.00%
1.50%
2.00%
2.50%
FY01/02 FY02/03 FY03/04 FY04/05 FY05/06 FY06/07 FY07/08 FY08/09 FY09/10 FY10/11 FY11/12
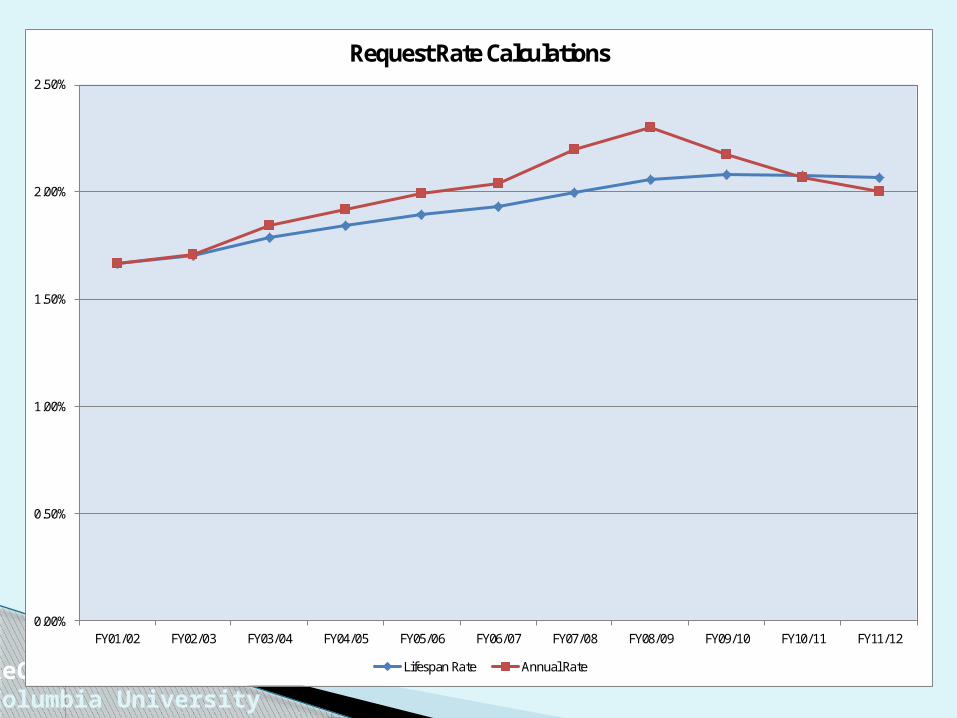
Request Rate Calculations
Lifespan Rate Annual Rate
ReCAPColumbia University
1.66%1.71%
1.84%1.92%
1.99%2.04%
2.20%
2.30%
2.17%
2.07%2.00%
0.00%
0.50%
1.00%
1.50%
2.00%
2.50%
FY01/02 FY02/03 FY03/04 FY04/05 FY05/06 FY06/07 FY07/08 FY08/09 FY09/10 FY10/11 FY11/12
Annual Request Rate
ReCAPColumbia University
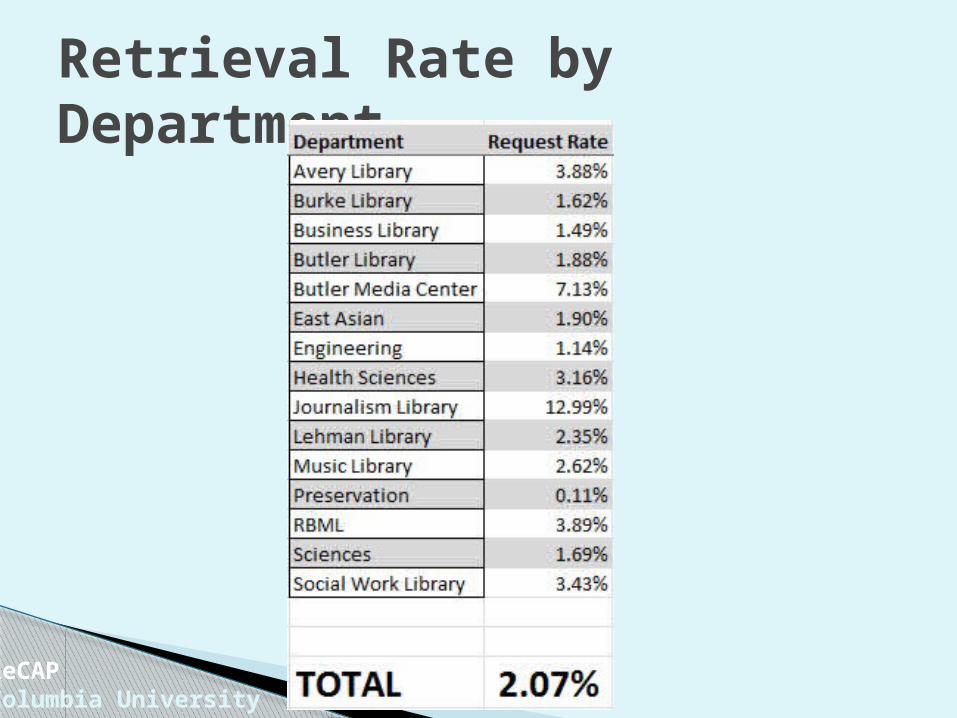
Retrieval Rate by Department
ReCAPColumbia University
0.00%
2.00%
4.00%
6.00%
8.00%
10.00%
12.00%
14.00%
1850
1854
1858
1862
1866
1870
1874
1878
1882
1886
1890
1894
1898
1902
1906
1910
1914
1918
1922
1926
1930
1934
1938
1942
1946
1950
1954
1958
1962
1966
1970
1974
1978
1982
1986
1990
1994
1998
2002
2006
2010
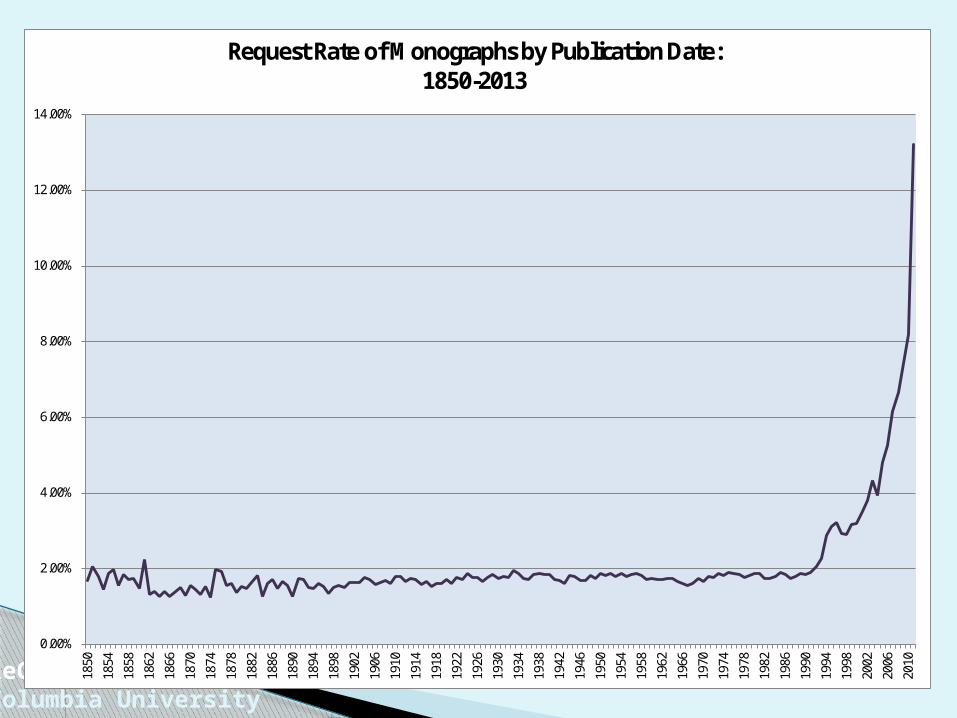
Request Rate of Monographs by Publication Date:1850-2013
ReCAPColumbia University
0.00%
2.00%
4.00%
6.00%
8.00%
10.00%
12.00%
14.00%
16.00%
18.00%
20.00%
FY01/02 FY02/03 FY03/04 FY04/05 FY05/06 FY06/07 FY07/08 FY08/09 FY09/10 FY10/11 FY11/12
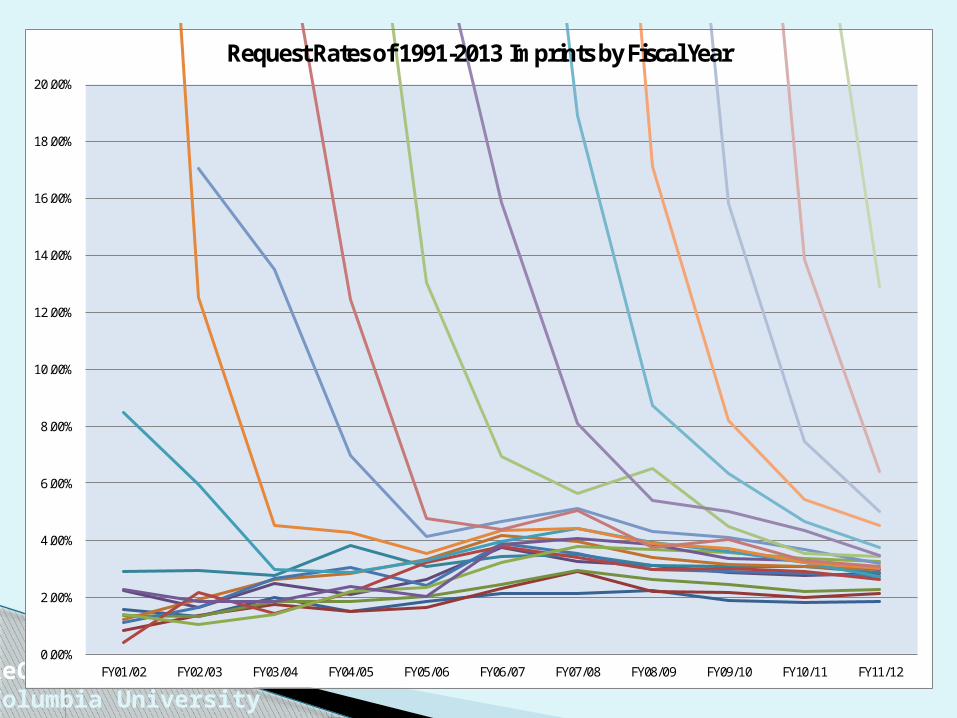
Request Rates of 1991-2013 Imprints by Fiscal Year
ReCAPColumbia University
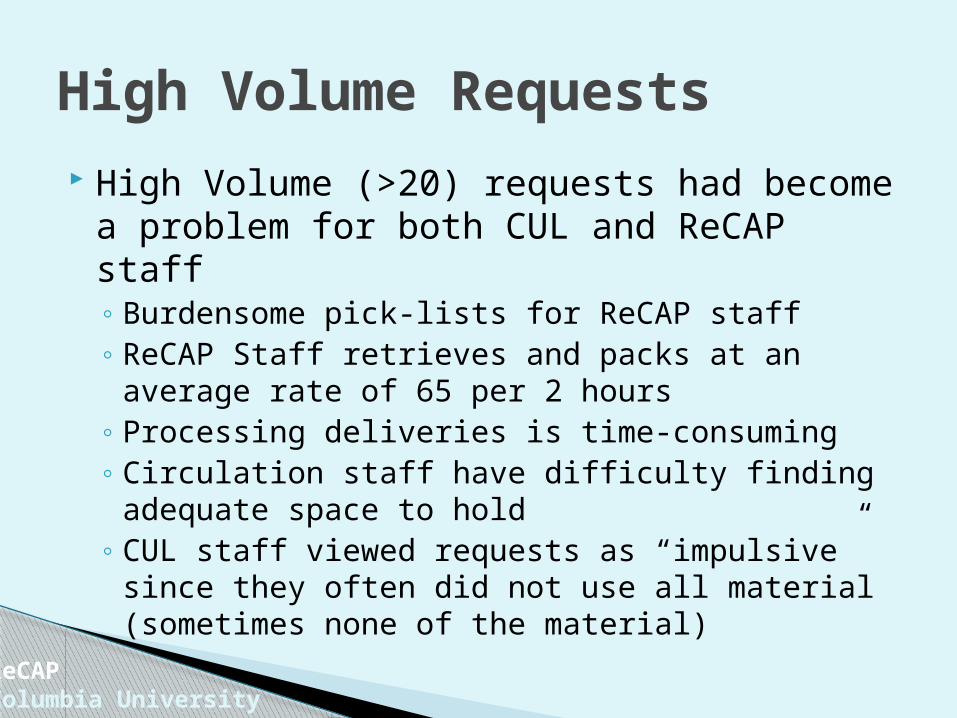
High Volume Requests High Volume (>20) requests had become a
problem for both CUL and ReCAP staff◦ Burdensome pick-lists for ReCAP staff◦ ReCAP Staff retrieves and packs at an average
rate of 65 per 2 hours◦ Processing deliveries is time-consuming◦ Circulation staff have difficulty finding adequate
space to hold◦ CUL staff viewed requests as “impulsive” since
they often did not use all material (sometimes none of the material)

ReCAPColumbia University
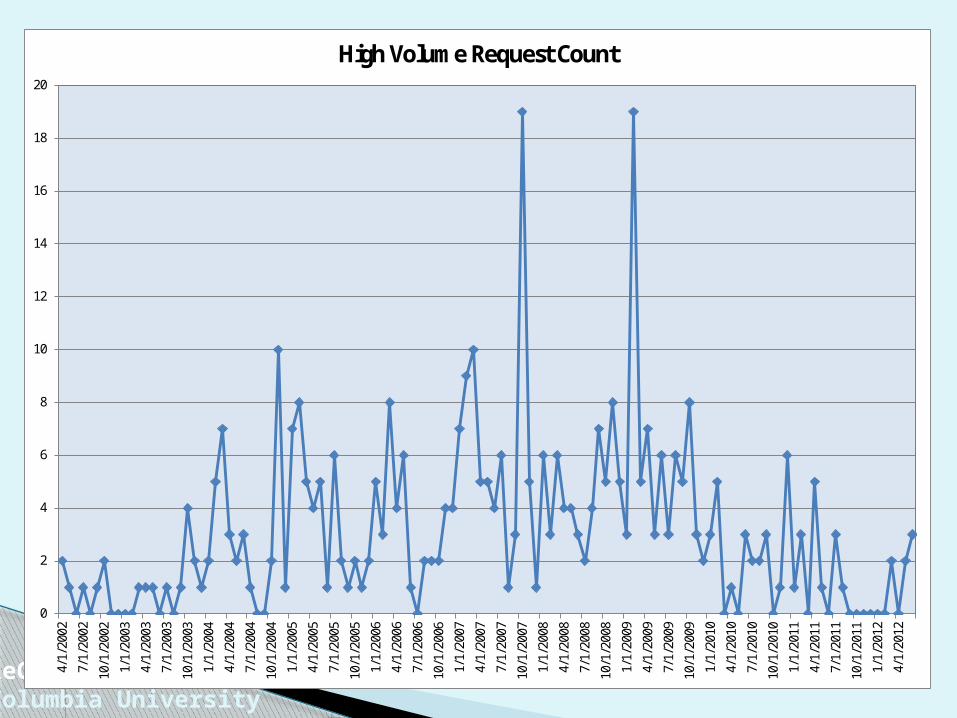
High Volume Requests Request limit set Nov. 5, 2009 Documentation here 20 volume limit was precedent from Prentis
Did it work?
(Short answer: yes)
ReCAPColumbia University
0
2
4
6
8
10
12
14
16
18
20
4/1/
2002
7/1/
2002
10/1
/200
2
1/1/
2003
4/1/
2003
7/1/
2003
10/1
/200
3
1/1/
2004
4/1/
2004
7/1/
2004
10/1
/200
4
1/1/
2005
4/1/
2005
7/1/
2005
10/1
/200
5
1/1/
2006
4/1/
2006
7/1/
2006
10/1
/200
6
1/1/
2007
4/1/
2007
7/1/
2007
10/1
/200
7
1/1/
2008
4/1/
2008
7/1/
2008
10/1
/200
8
1/1/
2009
4/1/
2009
7/1/
2009
10/1
/200
9
1/1/
2010
4/1/
2010
7/1/
2010
10/1
/201
0
1/1/
2011
4/1/
2011
7/1/
2011
10/1
/201
1
1/1/
2012
4/1/
2012
High Volume Request Count
ReCAPColumbia University
0
2
4
6
8
10
12
14
16
18
20
4/1/
2002
7/1/
2002
10/1
/200
2
1/1/
2003
4/1/
2003
7/1/
2003
10/1
/200
3
1/1/
2004
4/1/
2004
7/1/
2004
10/1
/200
4
1/1/
2005
4/1/
2005
7/1/
2005
10/1
/200
5
1/1/
2006
4/1/
2006
7/1/
2006
10/1
/200
6
1/1/
2007
4/1/
2007
7/1/
2007
10/1
/200
7
1/1/
2008
4/1/
2008
7/1/
2008
10/1
/200
8
1/1/
2009
4/1/
2009
7/1/
2009
10/1
/200
9
1/1/
2010
4/1/
2010
7/1/
2010
10/1
/201
0
1/1/
2011
4/1/
2011
7/1/
2011
10/1
/201
1
1/1/
2012
4/1/
2012
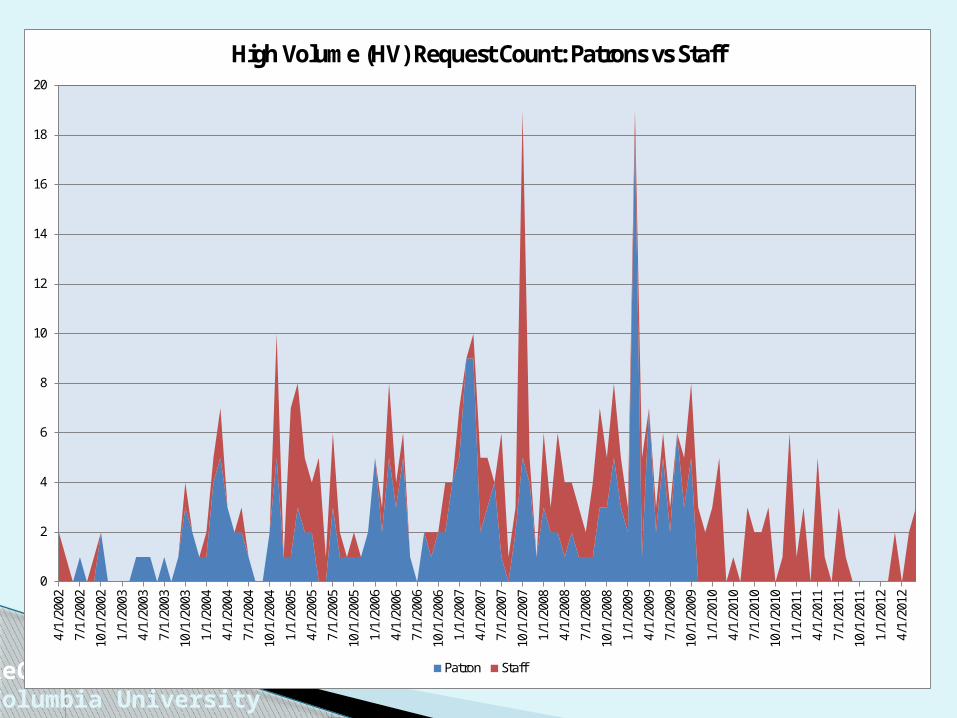
High Volume (HV) Request Count: Patrons vs Staff
Patron Staff
ReCAPColumbia University
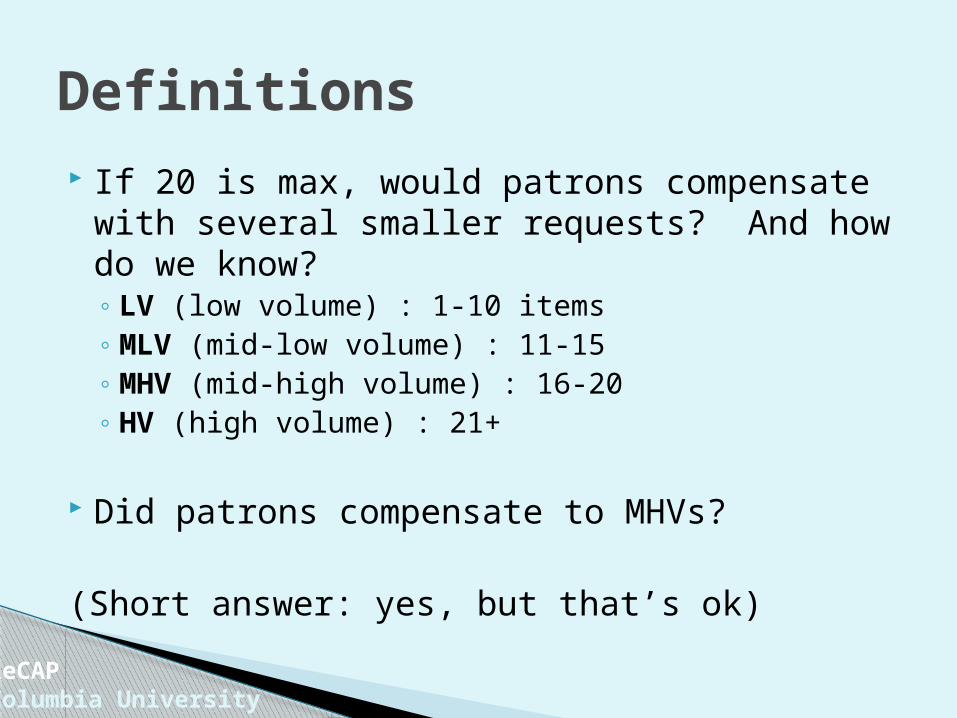
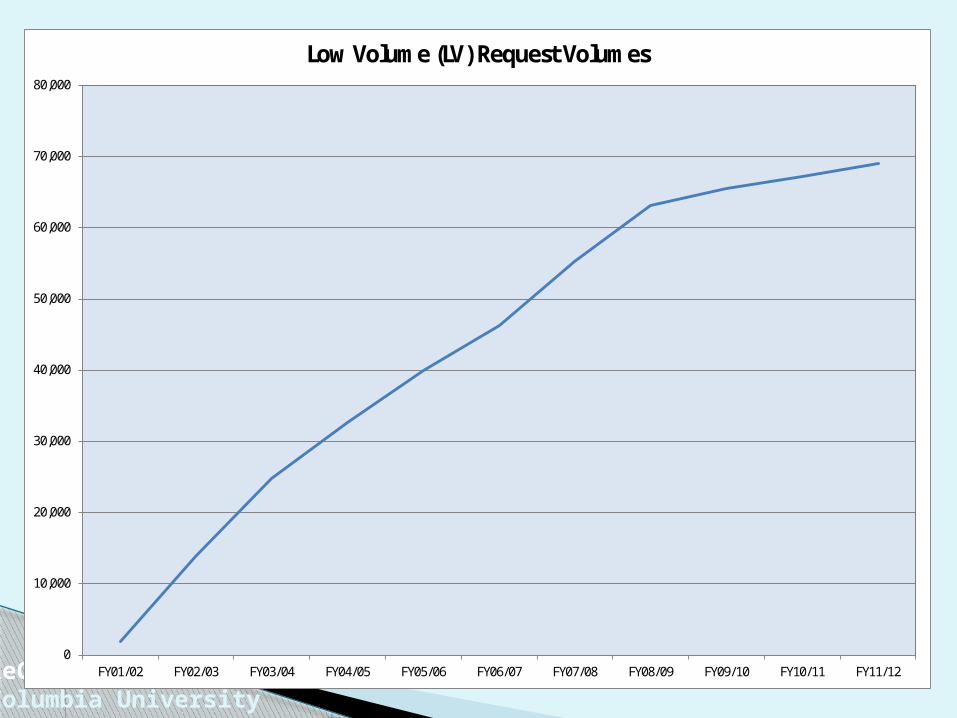
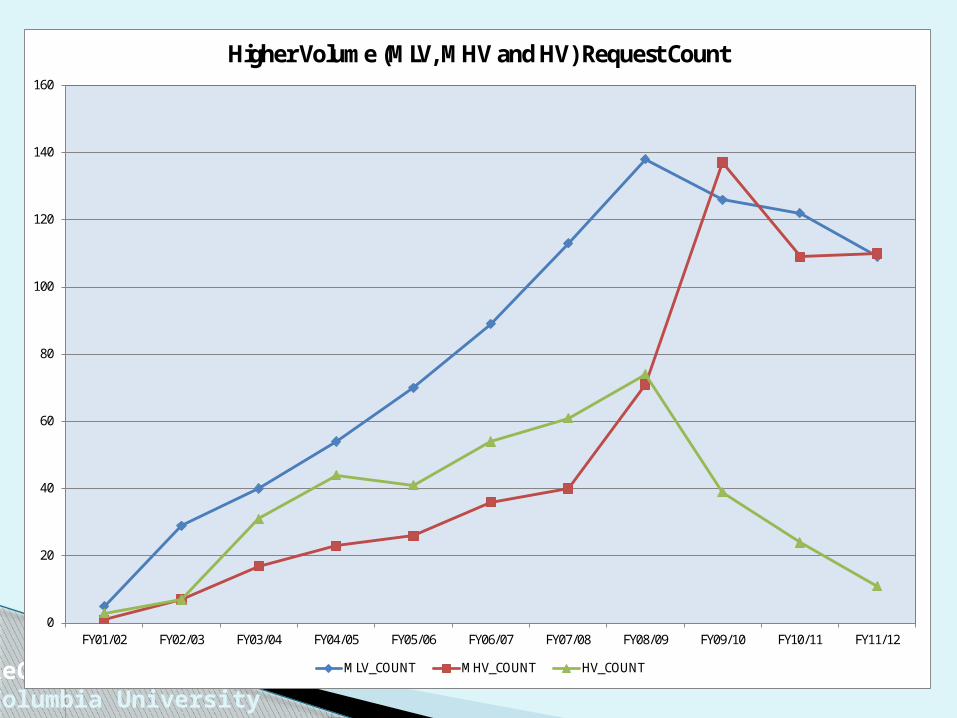
Definitions If 20 is max, would patrons compensate with
several smaller requests? And how do we know?◦ LV (low volume) : 1-10 items◦ MLV (mid-low volume) : 11-15 ◦ MHV (mid-high volume) : 16-20◦ HV (high volume) : 21+
Did patrons compensate to MHVs?
(Short answer: yes, but that’s ok)
ReCAPColumbia University
0
10,000
20,000
30,000
40,000
50,000
60,000
70,000
80,000
FY01/02 FY02/03 FY03/04 FY04/05 FY05/06 FY06/07 FY07/08 FY08/09 FY09/10 FY10/11 FY11/12
Low Volume (LV) Request Volumes
ReCAPColumbia University
0
20
40
60
80
100
120
140
160
FY01/02 FY02/03 FY03/04 FY04/05 FY05/06 FY06/07 FY07/08 FY08/09 FY09/10 FY10/11 FY11/12
Higher Volume (MLV, MHV and HV) Request Count
MLV_COUNT MHV_COUNT HV_COUNT
ReCAPColumbia University
0
500
1,000
1,500
2,000
2,500
3,000
3,500
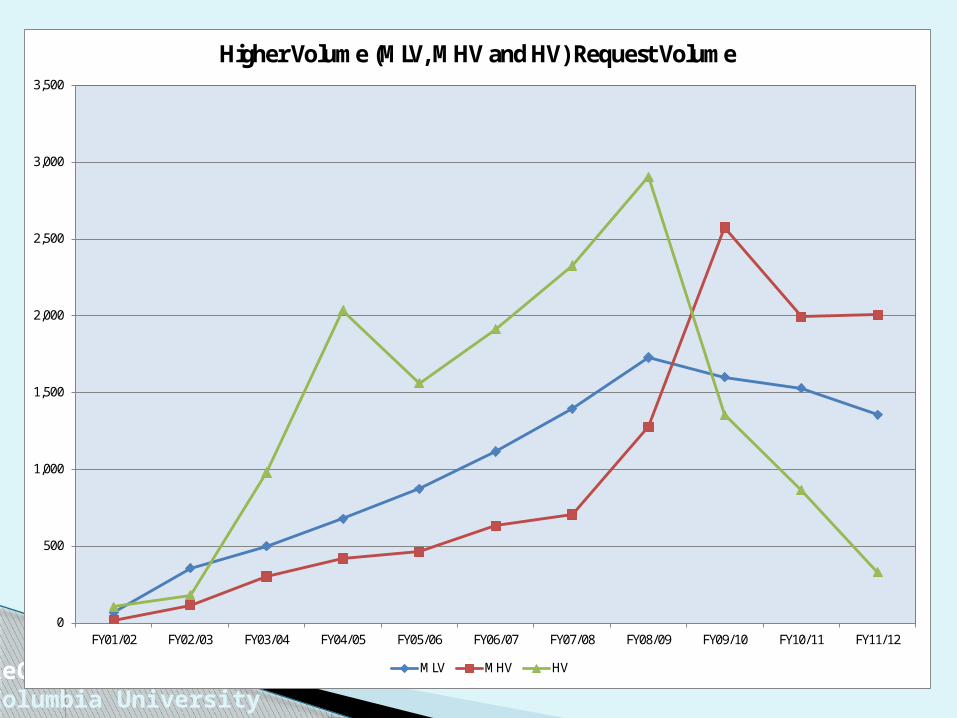
FY01/02 FY02/03 FY03/04 FY04/05 FY05/06 FY06/07 FY07/08 FY08/09 FY09/10 FY10/11 FY11/12
Higher Volume (MLV, MHV and HV) Request Volume
MLV MHV HV
ReCAPColumbia University
0
1,000
2,000
3,000
4,000
5,000
6,000
7,000
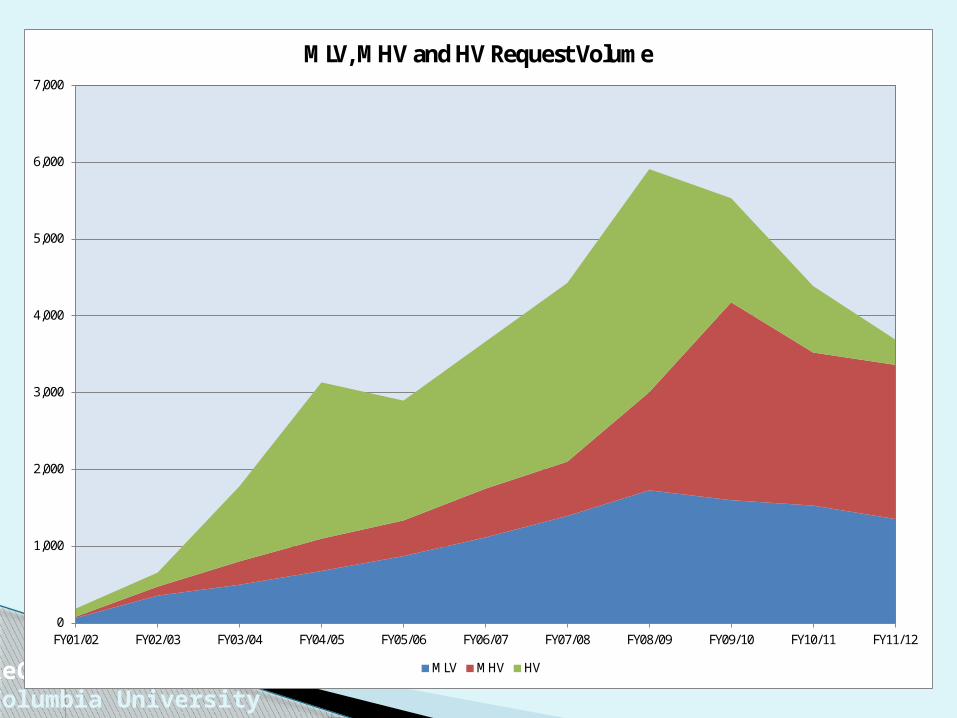
FY01/02 FY02/03 FY03/04 FY04/05 FY05/06 FY06/07 FY07/08 FY08/09 FY09/10 FY10/11 FY11/12
MLV, MHV and HV Request Volume
MLV MHV HV
ReCAPColumbia University
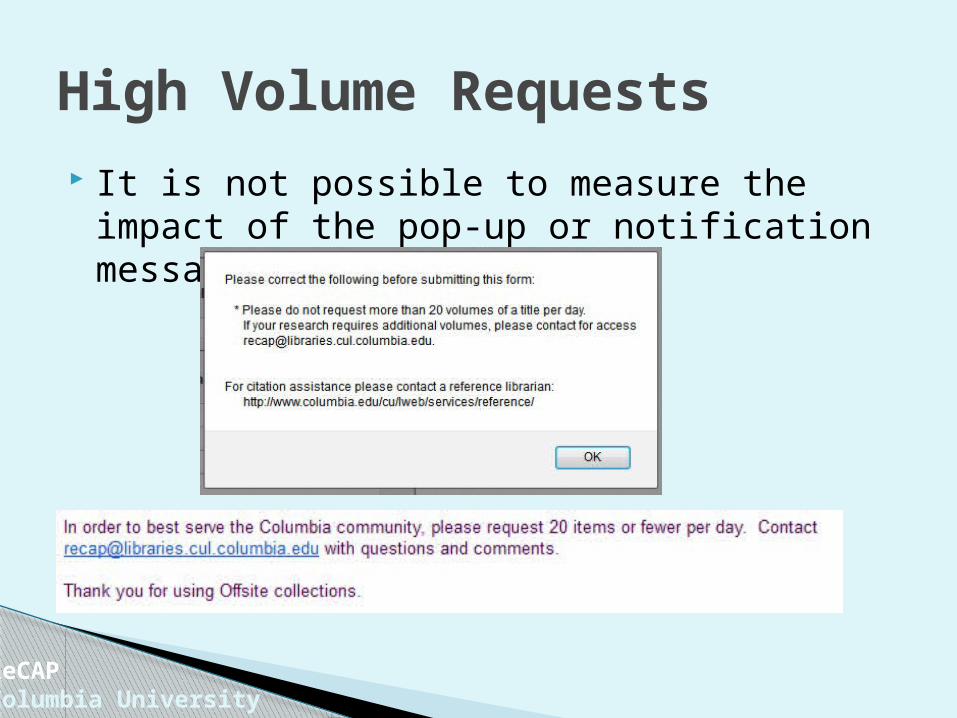
High Volume Requests It is not possible to measure the impact of
the pop-up or notification messages:
ReCAPColumbia University
Data suggested a 2.04% overall reduction based on FY09 statistics
Impact not yet totally quantified, but apparent
Before : HV average size 38.4 items and 161.7 items requested per month
After : HV average size 31.3 items and 81.5 items requested per month
Anecdotal impact: no complaints
High Volume Requests
More information about data sets can be found on the ReCAP Data Center website
Primary data categories include: accession, retrieval, delivery and circulation
Tailored data sets and analysis will be provided to staff via the ReCAP Coordinator
Please see the main ReCAP website for general information about CUL procedures and systems
More Data Available
ReCAPColumbia University