z Assessment of Climate for Learning, Living, and Working...•Climate is defined by R&A as the...
241
z September 10-11, 2019 Assessment of Climate for Learning, Living, and Working
Transcript of z Assessment of Climate for Learning, Living, and Working...•Climate is defined by R&A as the...

z
September 10-11, 2019
Assessment of Climate for
Learning, Living, and Working

z
Climate In Higher Education
Climate (Living,
Working, Learning)
Create and
Distribute Knowledge
Barcelo, 2004; Bauer, 1998; Harper, 2012; Hurtado, S., Griffin, K. A., Arellano, L., & Cuellar, M., 2008; Ingle,
2005; Kuh & Whitt, 1998; Milhem, 2005; Peterson, 1990; Rankin, 1994, 1998, 2003, 2005; Rankin &
Reason, 2008; Smith, 2009; Tierney, 1990; Worthington, 2008; Maramba, D. C., & Museus, S. D., 2011;
Soria, K. M., 2018; Strayhorn, T. L., 2019

z
Assessing Campus Climate
https://www.rankin-consulting.com
Definition
• Climate is defined by R&A as the current attitudes and behaviors of faculty, staff, administrators, and students, as well as institutional policies and procedures, which influence the level of respect for individual needs, abilities, and potential
Measurement
• Personal Experiences
• Perceptions
• Institutional Efforts

z
Campus Climate & Students
How students experience their
campus environment influences both learning and
developmental outcomes.1
Discriminatory environments have a negative effect on student learning.2
Research supports the pedagogical
value of a diverse student body and
faculty on enhancing learning
outcomes.3
1 Harper & Hurtado, 2009; Maramba. & Museus, 2011; Mayhew, M. J., Rockenbach, A. N., Bowman, N. A., Seifert, T. A., & Wolniak, G. C. 2016; Patton,
2011; Strayhorn, 2012; Buckley, J. B., & Park, J. J., 2019, Fernandez, F., Merson, D., Ro, H. K., & Rankin, S., 2019.2 Mayhew, M. J., Rockenbach, A. N., Bowman, N. A., Seifert, T. A., & Wolniak, G. C., 2016, Shelton, L. J. 2019, Yosso, T. J., Smith, W. A.,
Ceja, M., & Solórzano, D. G., 2009; Crisp, G., Taggart, A., & Nora, A. ,2015; 3 Hale, 2004; Harper, & Hurtado, 2009; Harper & Quaye, 2004; Hurtado, 2003; Nelson & Niskodé-Dossett, 2010; Strayhorn, 2013; Samura,
M., 2016; Museus, S. D., Shiroma, K., & Dizon, J. P. ,2016.

z
Campus Climate & Faculty/Staff
The personal and professional
development of employees are
impacted by campus climate.1
Faculty members who judge their campus
climate more positively are more likely to feel personally supported
and perceive their work unit as more supportive.2
Research underscores the relationships
between (1) workplace discrimination and
negative job and career attitudes and (2)
workplace encounters with prejudice and
lower health and well-being..3
1 Gardner, 2013; Jayakumar, Howard, Allen, & Han, 2009; Smith, D. G. , 2015; Urrieta, L., Méndez, L., & Rodríguez, E., 20152 Costello, 2012; Griffin, Pérez , Holmes, & Mayo, 2010; Kaminski, & Geisler, 2012; Vaccaro, A., 2012, Griffin, K. A., Pifer, M. J., Humphrey, J. R., &
Hazelwood, A. M., 2011; Vaccaro, A., 20123 Young, K., Anderson, M., & Stewart, S. 2014; Costello, C. A., 2012; Garcia, G. A. , 2016; Mayhew, M., Grunwald, H., & Dey, E.; 2006

Climate Matters

Climate Matters

Academic Freedom Hate Speech
Climate Matters
Student Activism

z
What Are Students Demanding?
While the demands vary by institutional context, a qualitative analysis reveals similar themes across the 76 institutions and
organizations (representing 73 U.S. colleges and universities, three
Canadian universities, one coalition of universities and one consortium of
Atlanta HBCUs.)
Chessman & Wayt explore these overarching themes in an effort to
provide collective insight into what is important to today’s students in the
heated context of racial or other bias-related incidents on college and
university campuses.
Source: Chessman & Wayt, 2016; http://www.thedemands.org/

z
Seven Major Themes
Policy (91%)
Leadership (89%)
Resources (88%)
Increased Diversity (86%)
Training (71%)Curriculum (68%)
Support (61%)
Source: Chessman & Wayt, 2016; http://www.thedemands.org/

Responses to Unwelcoming Campus Climates
What are students’ behavioral
responses?

z
Lack of Persistence
30% of respondents have seriously considered leaving
their institution
What do students offer as the main reason for their
departure?
Source: R&A, 2015; Rankin et al., 2010; Strayhorn, 2012

z
Student Departure
Experienced Harassment/ Victimization
(Microaggressions)
Lack of Social Support
Feelings of Hopelessness
Suicidal Ideation or Self-Harm
Source: Liu & Mustanski, 2012

z
Projected Outcomes
UNH will add to their knowledge base with regard to how constituent groups currently feel about their particular campus climate and how the community responds to them (e.g., work-life issues, curricular integration, inter-group/intra-group relations, respect issues).
UNH will use the results of the survey to inform current/on-going work.

z
Setting the Context for Beginning the Work
Examine the Research
• Review work already completed
Preparation
• Readiness of each campus
Survey
• Examine the climate
Follow-up
• Building on the successes and addressing the challenges

Current
Campus
Climate
Access
Retention
Research
Scholarship
Curriculum
Pedagogy
University
Policies/Service
Intergroup &
Intragroup
Relations
Transformational Tapestry Model©
Baseline
Organizational
Challenges
Systems
Analysis
Local / Sate /
Regional
Environments
Contextualized Campus Wide Assessment
Advanced
Organizational
Challenges
Consultant
Recommendations
Assessment
Transformation
via
Intervention
Fiscal
Actions
Symbolic
Actions
Administrative
Actions
Educational
Actions
Transformed
Campus
Climate
Access
Retention
Research
Scholarship
Curriculum
Pedagogy
University
Policies/Service
Intergroup &
Intragroup
Relations
© 2001
External
Relations
External
Relations

17
Project Overview
• Initial Proposal Meetings
• Survey Tool Development and Implementation
• Outreach Plan
Phase I
• Data Analysis
Phase II
• Final Report and Presentation
Phase III

Phase I Summer 2018 – Spring 2019
The Climate Study Working Group (CSWG; includes faculty, administrators, staff, and students) was created.
Meetings with the CSWG to develop the survey instrument
The CSWG reviewed multiple drafts of the survey and approved the final survey instrument.
The final survey was distributed to the entire UNH College community (students, staff, administrators, faculty) via an invitation from President James W. Dean Jr.

Phase II Spring 2019
Quantitative and qualitative analyses conducted

z Phase IIISummer/Early Fall 2019
Report draft reviewed by the CSWG
Final report submitted to UNH
Presentation to UNH campus community

z
Instrument/Sample
Online Survey Instrument
▪ 120 questions including space for respondents to provide commentary
Sample = Population
▪ All community members were invited to take the survey
▪ Available from February 26th through April 5th, 2019

z
Structure of the Survey
Section1: Personal Experiences of Campus Climate
2: Workplace Climate for Employees
3. Demographic Information
4. Perceptions of Campus Climate
5. Institutional Actions

z
Survey Limitations
Self-selection bias
Response rates
Social desirability
Caution in generalizing results
for constituent groups with low response
rates

z
Protecting Confidentiality
Data were not reported for groups of fewer than 5
individuals where identity could be compromised
Instead, small groups were combined to eliminate possibility
of identifying individuals

Results: Response Rates

z
Who are the respondents?
6,544 surveys were returned
34% overall response rate

z
Response Rates by Employee Position
45%• Tenured/Tenure-Track Faculty (n = 279)
48%• Not on the Tenure-Track Faculty (n = 250)
48%• Staff (n = 1,285)

z
Response Rates by Student Position
29%• Undergraduate Student (n = 3,831)
32%• Graduate/Law Student (n = 899)

z
Response Rates by Gender Identity
39%• Women (n = 4,239)
24%• Men (n = 2,154)
N/A• Trans-spectrum (n = 47)
N/A• Multiple (n = 42)

z
Response Rates by Racial Identity
47%• Asian/Asian American (n = 270)
31%• Black/African American (n = 73)
16%• Hispanic/Latinx/Chicanx (n = 104)
35%• White/European American (n = 5,488)

z
Response Rates by Racial Identity
N/A• Middle Eastern (n = 47)
26%• Amer Ind/Alaska Native (n = 8)
N/A• South Asian (n = 39)
>100%• Native Hawaiian/Pacific Islander (n = 6)
87%• Multiracial (n = 304)

z
Sample Characteristics
z
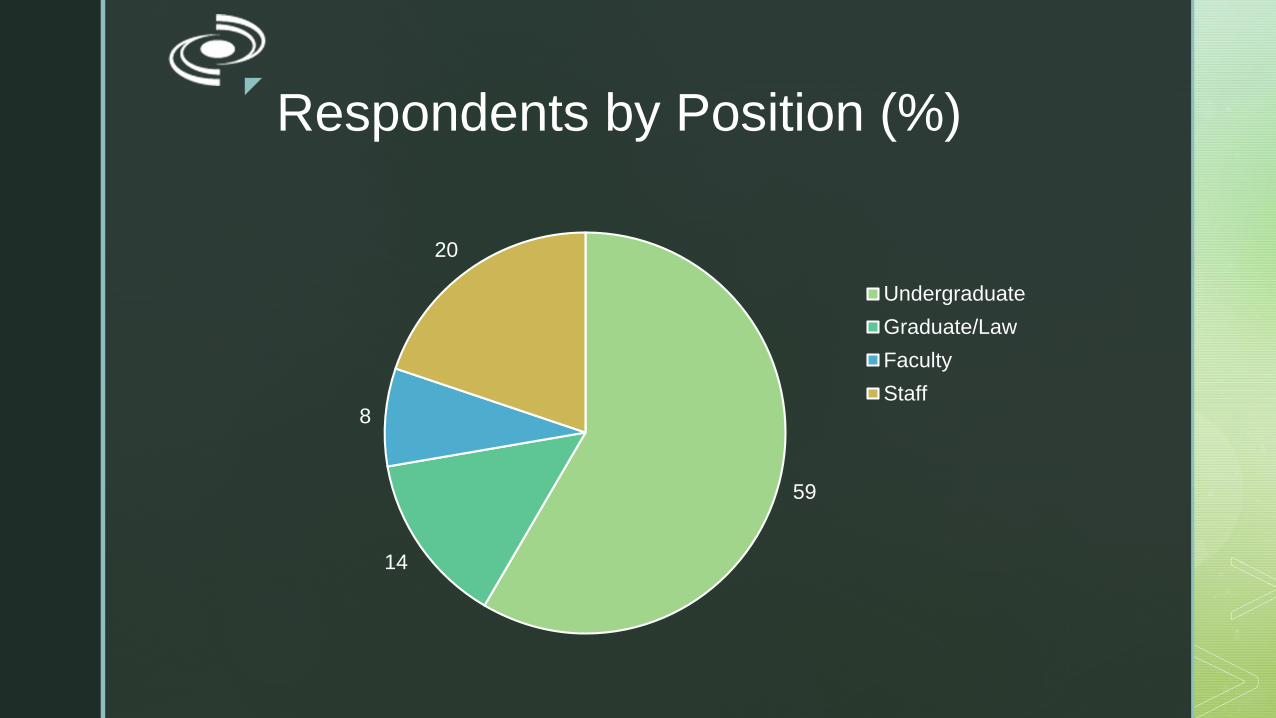
Respondents by Position (%)
59
14
8
20
Undergraduate
Graduate/Law
Faculty
Staff

z
Respondents’ Full-Time Status in Primary Positions
98% (n = 3,751) of Undergraduate Students
85% (n = 763) of Graduate/Law Students
92% (n = 486) of Faculty
94% (n = 1,204) of Staff

z
Respondents by Gender Identity and Position Status (%)
66%
55%
59%
68%
33%
44%
39%
31%
1%
0%
1%
1%
1%
1%
1%
0% 10% 20% 30% 40% 50% 60% 70% 80% 90% 100%
Staff
Faculty
Graduate/LawStudent
Undergrad Student
Multiple
Trans-spectrum
Men
Women

z
Respondents by Racial Identity (%) -Duplicated Total
1%
1%
1%
2%
4%
5%
84%
0% 10% 20% 30% 40% 50% 60% 70% 80% 90% 100%
Other/Unknown
Pacific Islander/Hawaiian
Jewish
American Indian/Alaskan Native
South Asian
Middle Eastern
African American/Black
Hispanic/Latinx/Chicanx
Asian American
Multiracial
White/European American

z
Respondents by Racial Identity (%) -Unduplicated Total
3%
5%
8%
84%
0% 10% 20% 30% 40% 50% 60% 70% 80% 90% 100%
Other/Missing/Unknown
Multiracial
Person of Color
White

z
Respondents by Sexual Identity and Position Status (n)
273 276
3,201
63 60
734
16 34
442
38 65
1,077
0
500
1,000
1,500
2,000
2,500
3,000
3,500
Bisexual Queer-spectrum Heterosexual
Undergrad Student
Graduate Student
Faculty
Staff

z
13% (n = 842) of Respondents Had a Condition that Influenced Their Learning, Living, or Working Activities
Top conditions for those with a disability n %
Mental health/psychological condition451 53.6
Learning difference/disability290 34.4
Chronic diagnosis or medical condition183 21.7

z
Respondents by Religious or Spiritual Identity (%)
14%
1%
7%
15%
16%
48%
0% 10% 20% 30% 40% 50% 60% 70% 80% 90% 100%
Missing
Multiple Affiliations
Other Religious Affiliation
Catholic Affiliation
Christian Affiliation
No Affiliation

z
Citizenship Status
Citizenship n %
U.S. citizen, birth 5,824 89.0
A visa holder (such as F-1, J-1, H1-B, U) 267 4.1
U.S. citizen, naturalized 224 3.4
Permanent resident 173 2.6
Other legally documented status < 5 ---
Refugee status < 5 ---
Currently under a withholding of
removal status
< 5 ---
DACA (Deferred Action for Childhood
Arrival)
< 5 ---
Undocumented resident 0 0.0

z
Military Status
Military n %
I have never served in the U.S. Armed Forces. 5,859 89.5
I am a child, spouse, or partner of a currently
serving or former member of the U.S. Armed
Forces. 257 3.9
I am not currently serving, but have served
(e.g., retired/veteran). 115 1.8
I am currently a member of the National Guard
(but not in ROTC). 35 0.5
I am in ROTC. 30 0.5
I am currently a member of the Reserves (but
not in ROTC). 8 0.1
I am currently on active duty. < 5 ---
z
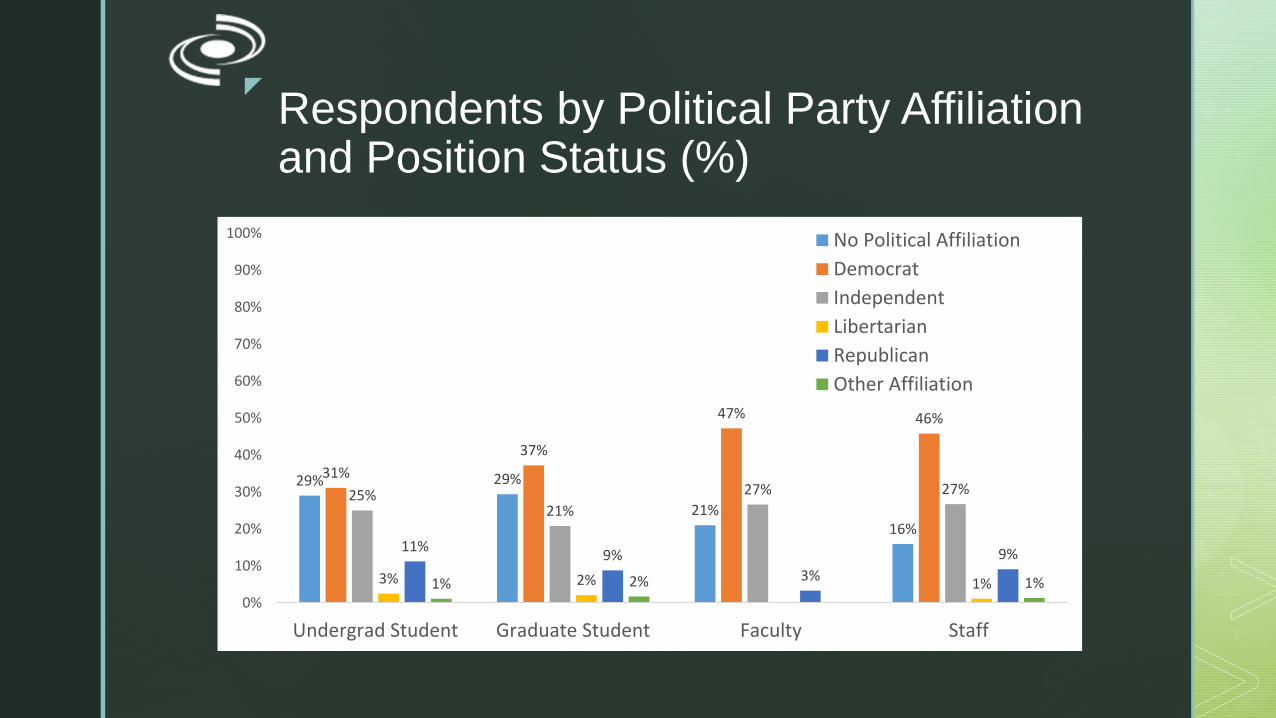
Respondents by Political Party Affiliation and Position Status (%)
29% 29%
21%16%
31%
37%
47% 46%
25%21%
27% 27%
3% 2% 1%
11%9%
3%
9%
1% 2% 1%0%
10%
20%
30%
40%
50%
60%
70%
80%
90%
100%
Undergrad Student Graduate Student Faculty Staff
No Political Affiliation
Democrat
Independent
Libertarian
Republican
Other Affiliation
z
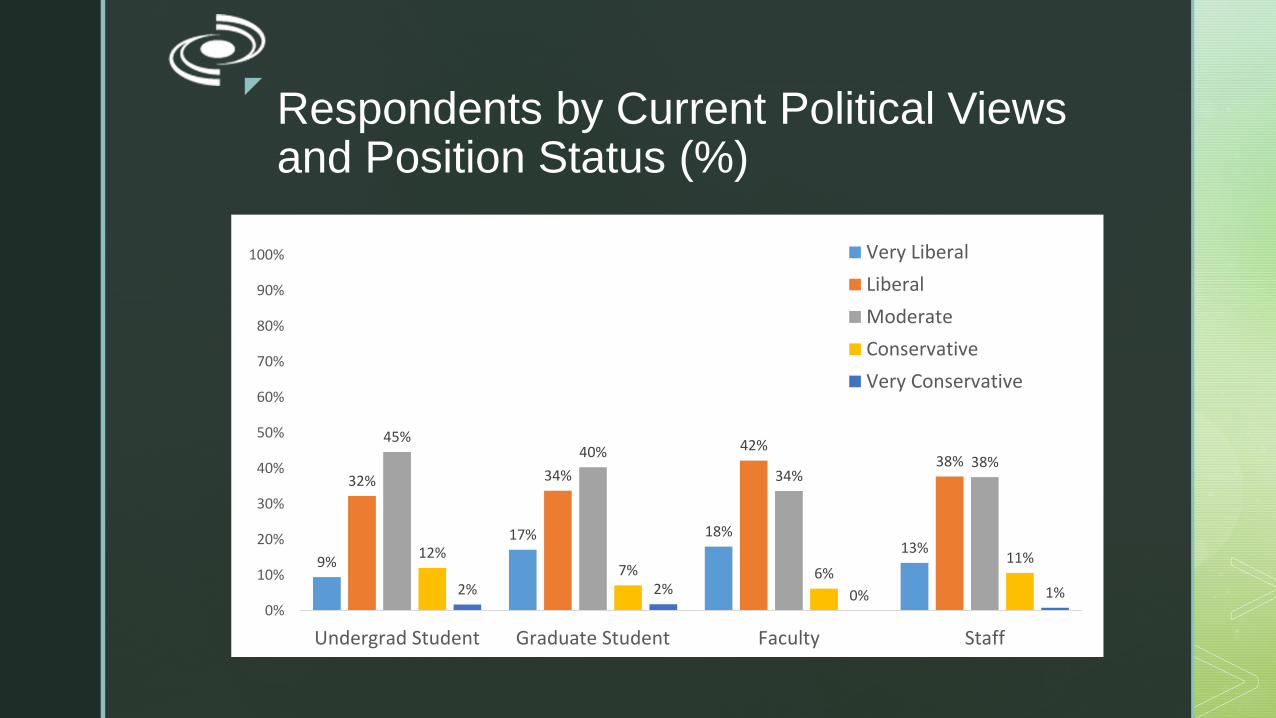
Respondents by Current Political Views and Position Status (%)
9%
17% 18%13%
32% 34%
42%38%
45%40%
34%38%
12%7% 6%
11%
2% 2% 0% 1%0%
10%
20%
30%
40%
50%
60%
70%
80%
90%
100%
Undergrad Student Graduate Student Faculty Staff
Very Liberal
Liberal
Moderate
Conservative
Very Conservative

z
Student Respondents by Age (n)
Note: Responses with n < 5 are not presented in the figure.
1,474
1,684
518
9217 50 10
283
449
9829 9
0
200
400
600
800
1,000
1,200
1,400
1,600
1,800
19 oryounger
20-21 22-24 25-34 35-44 45-54 55-64 65-74 75 andolder
Undergrad Student
Graduate Student

z
Employee Respondents by Age (n)
Note: Responses with n < 5 are not presented in the figure.
0 0
26
6650 45
1231
281
313
366 368
78
0
50
100
150
200
250
300
350
400
19 oryounger
20-21 22-24 25-34 35-44 45-54 55-64 65-74 75 andolder
Faculty
Staff

z
Student Respondents by Caregiving Responsibilities (%)
Note: Percentages are based on respondents who indicated that they had dependent care responsibilities.
Responses with n < 5 are not presented in the figure.
32%
41%
13%9%
0%
32%
47%43%
8% 10%16%
0%
10%
20%
30%
40%
50%
60%
70%
80%
90%
100%
Children less than6 yrs
Children 6-18 yrs Dependent child18 yrs or older
Independent child18 yrs or older
Sick/disabledpartner
Senior/other
Undergrad Student
Graduate Student

z
Employee Respondents by Caregiving Responsibilities (%)
Note: Percentages are based on respondents who indicated that they had dependent care responsibilities.
Responses with n < 5 are not presented in the figure.
31%
55%
14%7%
21%26%
53%
18%
10%5%
25%
0%
10%
20%
30%
40%
50%
60%
70%
80%
90%
100%
Children lessthan 6
Children 6-18 yrs Dependent child18 yrs or older
Independentchild 18 yrs or
older
Sick/disabledpartner
Senior/other
Faculty
Staff
z
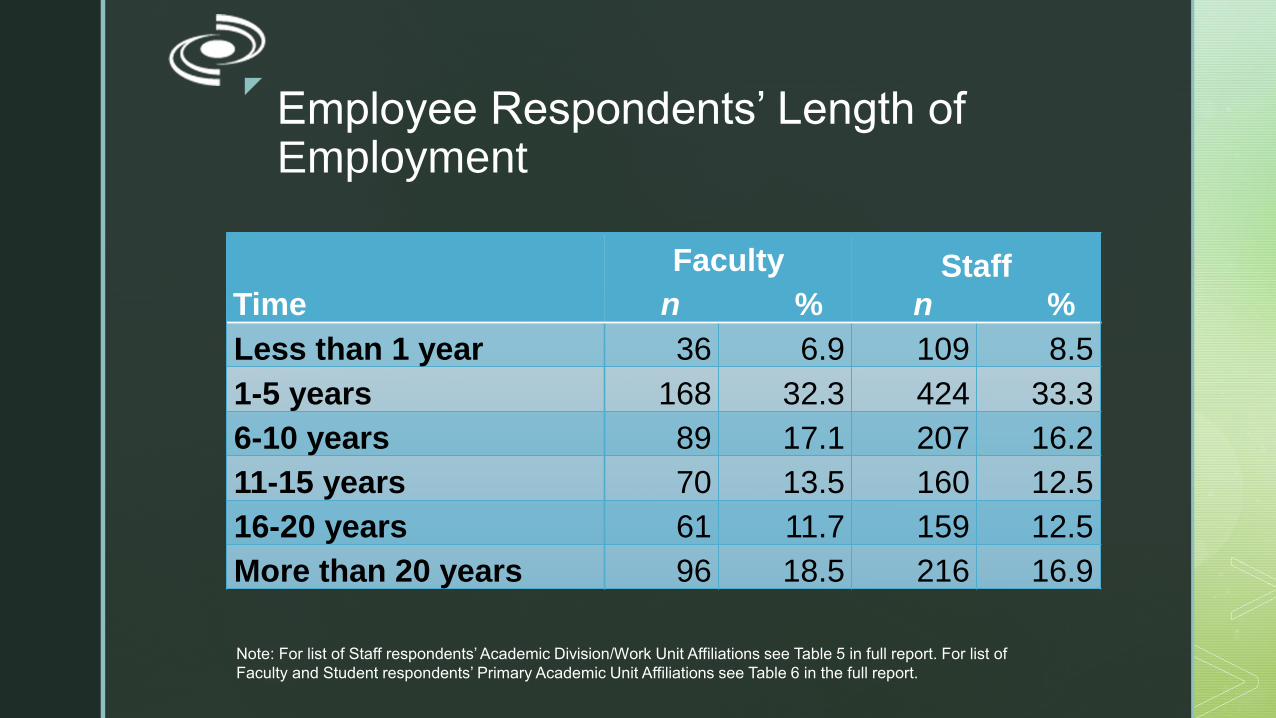
Employee Respondents’ Length of Employment
Time
Faculty
n %
Staff
n %
Less than 1 year 36 6.9 109 8.5
1-5 years 168 32.3 424 33.3
6-10 years 89 17.1 207 16.2
11-15 years 70 13.5 160 12.5
16-20 years 61 11.7 159 12.5
More than 20 years 96 18.5 216 16.9
Note: For list of Staff respondents’ Academic Division/Work Unit Affiliations see Table 5 in full report. For list of
Faculty and Student respondents’ Primary Academic Unit Affiliations see Table 6 in the full report.

z
Student Respondents’ Percentage of Classes Taken Exclusively Online
64%
30%
2%4%
50%
33%
3%
14%
0%
10%
20%
30%
40%
50%
60%
70%
80%
90%
100%
None Some Most All
Undergrad Student
Graduate Student

z
Undergraduate Student Respondents’ Years at UNH
Year n %
First year 1,075 28.1
Second year 1,047 27.3
Third year 903 23.6
Fourth year 738 19.3
Fifth year 52 1.4
Sixth year (or more) 15 0.4
Note: For a complete list of Undergraduate Student respondents’ current or intended majors, please see Table 12 in full report.

z
Graduate/Law Student Respondents’ Years at UNH
Year
Master’s
degree
students
n %
Doctoral
degree
students
n %
Law
students
n %
First year 277 54.9 53 21.8 38 51.4
Second year 192 38.0 53 21.8 22 29.7
Third year 27 5.3 53 21.8 14 18.9
Fourth year or more 9 1.8 84 34.6 0 0.0
Note: For a complete list of Graduate/Law Student respondents’ programs, please see Table 14 in full report.

z
Undergraduate Student Respondents’ Residence
Campus housing54%(n = 2,565)
Non-campus housing36%(n = 1,682)
Living with family member/ guardian
10%(n = 460)
Housing insecure0.3%(n = 15)
Note: For a complete list of Undergraduate Student respondents’ residences, please see Table 18 in full report.

z
Student Respondents’ Participation in Clubs/Organizations at UNH
Top five responses n %
I do not participate in any clubs or
organizations at UNH. 1,437 30.4
Academic and academic honorary
organizations 920 19.5
Recreational organization 619 13.1
Social sorority or fraternity 578 12.2
Club sport 568 12.0
Note: For a complete list of Student respondents’ participation in clubs/organizations, please see Table 19 in full report.

z
Student Respondents’ Income by Dependency Status (%)
47%
22%
28%
6%
13%
15%
16%
8%
9%
9%
18%
14%
12%
13%
14%
20%
11%
22%
13%
24%
4%
8%
7%
13%
2%
5%
3%
7%
2%
5%
2%
6%
1%
2%
0% 20% 40% 60% 80% 100%
Independent grad student
Dependent grad student
Independent undergradstudent
Dependent undergradstudent
$500,000 or more
$250,000 - $499,999
$200,000 - $249,999
$150,000 - $199,999
$100,000 - $149,999
$70,000 - $99,999
$50,000 - $69,999
$30,000 - $49,999
$29,99 and below

z
44% (n = 2,066) of Student respondents experienced financial hardship while attending UNH
Top financial hardships n %
Tuition 1,323 28.0
Books/course materials 1,209 25.6
Housing 981 20.7
Food 701 14.8
Other campus fees 643 13.6
Note: For a complete list of how Student respondents experienced financial hardship, please see Table 16 in full report.

z
How Student Respondents Were Paying For College
Funding n %
Loans 2,761 58.4
Family contribution 2,595 54.9
Personal contribution/job 1,481 31.3
Non-need-based scholarship 1,246 26.3
Grant (e.g., Pell) 1,131 23.9
Need-based scholarship (e.g., Gates) 741 15.7
Note: For a complete list of how Student respondents were paying for college, please see Table 17 in full report.

z
Undergraduate Student Employment
Hours n %
No 1,449 37.8
Yes, I work on campus 1,344 35.1
1-10 hours/week 887 23.2
11-20 hours/week 354 9.2
21-30 hours/week 59 1.5
31-40 hours/week < 5 ---
More than 40 hours/week < 5 ---
Yes, I work off campus 1,239 32.3
1-10 hours/week 492 12.8
11-20 hours/week 422 11.0
21-30 hours/week 175 4.6
31-40 hours/week 77 2.0
More than 40 hours/week 24 0.6

z
Graduate/Law Student Employment
Hours n %
No 269 29.9
Yes, I work on campus 349 38.8
1-10 hours/week 86 9.6
11-20 hours/week 168 18.7
21-30 hours/week 43 4.8
31-40 hours/week 19 2.1
More than 40 hours/week 21 2.3
Yes, I work off campus 316 35.2
1-10 hours/week 74 8.2
11-20 hours/week 68 7.6
21-30 hours/week 39 4.3
31-40 hours/week 49 5.5
More than 40 hours/week 74 8.2

z
Student Respondents’ Reported GPA
GPA
Undergraduate
n %
Graduate/Law
n %
No GPA at the time – first
semester at UNH 68 1.8 35 3.9
3.75 – 4.00 927 24.3 562 63.1
3.50 – 3.74 741 19.4 145 16.3
3.25 – 3.49 648 17.0 77 8.6
3.00 – 3.24 617 16.2 48 5.4
2.75 - 2.99 406 10.7 17 1.9
2.50 – 2.74 212 5.6 < 5 ---
2.25 – 2.49 79 2.1 < 5 ---
2.00 – 2.24 55 1.4 0 0.0
1.99 and below 57 1.5 < 5 ---

z
Respondents’ One-Way Commute Time to their Primary UNH Campus
Minutes
Student
n %
Employee
n %
10 or fewer 2,654 56.1 312 17.2
11-20 655 13.8 580 32.0
21-30 355 7.5 454 25.0
31 - 40 210 4.4 208 11.5
41-50 217 4.6 117 6.4
51-60 231 4.9 90 5.0
60 or more 468 9.9 81 4.5

z
Respondents’ Primary Method of Transportation to UNH
1% 2% 0% 2%6%
3% 2%
33%
71%
92% 90%
10% 8%2% 2%0% 0% 0%1% 0% 0%
0%
10%
20%
30%
40%
50%
60%
70%
80%
90%
100%
Undergrad Student Graduate Student Faculty Staff
Bicycle Carpool (e.g., Private pool, SCOOP)
Personal vehicle Public transportation
Ride-sharing services (e.g., Lyft, Uber) Walk

Findings

z
81% of Respondents were Comfortable with Overall Climate at UNH
• Staff respondents less comfortable than Student respondents
• Trans-spectrum respondents less comfortable than Women and Men respondents
• Respondents of Color and Multiracial respondents less comfortable than White respondents
Significant Differences
Note: Answered by all respondents.

z
81% of Respondents were Comfortable with Overall Climate at UNH
Note: Answered by all respondents.
• Bisexual and Queer-spectrum respondents less comfortable than Heterosexual respondents
• Respondents With Multiple Disabilities and a Single Disability less comfortable than Respondents with No Disability
• Non-Campus Housing Student respondents less comfortable than Residential Life Student respondents
Significant Differences

z
81% of Respondents were Comfortable with Overall Climate at UNH
Note: Answered by all respondents.
• Non-U.S. Citizen respondents less comfortable than U.S. Citizen-Birth respondents
• Staff respondents with a Master’s degree less comfortable than Staff respondents with a Bachelor’s degree
Significant Differences

z
Note: Answered by Faculty and Staff respondents.
74% of Faculty and Staff Respondents were Comfortable with Department/Program or Work Unit Climate
• Faculty respondents less comfortable than Staff respondents
• Women respondents less comfortable than Men respondents
• Multiracial respondents less comfortable than White respondents
Significant Differences

z
Note: Answered by Faculty and Staff respondents.
74% of Faculty and Staff Respondents were Comfortable with Department/Program or Work Unit Climate
• Bisexual respondents less comfortable than Heterosexual respondents
• Respondents With Multiple Disabilities less comfortable than Respondents with No Disability
Significant Differences

z
86% of Faculty and Student Respondents were Comfortable with Classroom Climate
• Student respondents less comfortable than Faculty respondents
• Trans-spectrum and Women respondents less comfortable than Men respondents
• Respondents of Color less comfortable than White respondents
Significant Differences
Note: Answered by Faculty and Student respondents

z
86% of Faculty and Student Respondents were Comfortable with Classroom Climate
• Bisexual respondents less comfortable than Heterosexual respondents
• Respondents With Multiple Disabilities and a Single Disability less comfortable than Respondents with No Disability
• Non-Campus Housing Student respondents less comfortable than Residential Life Student respondents
Significant Differences
Note: Answered by Faculty and Student respondents

z
Challenges and Opportunities

z
Personal Experiences of Exclusionary, Intimidating, Offensive or Hostile Conduct
•
• experienced exclusionary (e.g., shunned, ignored), intimidating, offensive and/or hostile (bullied, harassed) conduct at UNH within the past year
16% (n = 1,027) of respondents

z
Personal Experiences of Exclusionary Conduct as a Result of Position (%)
13% 10%14%
31%29%33%
20%
48%
0%
10%
20%
30%
40%
50%
60%
70%
80%
90%
100%
Overall experienced conduct Of those who experienced exclusionaryconduct, said they experienced conduct as a
result of their position status
Undergrad Student
Grad/Law Student
Faculty
Staff
↓↓
↓
↓↓
↓↓
Note: Red arrows show statistically significant differences.
z
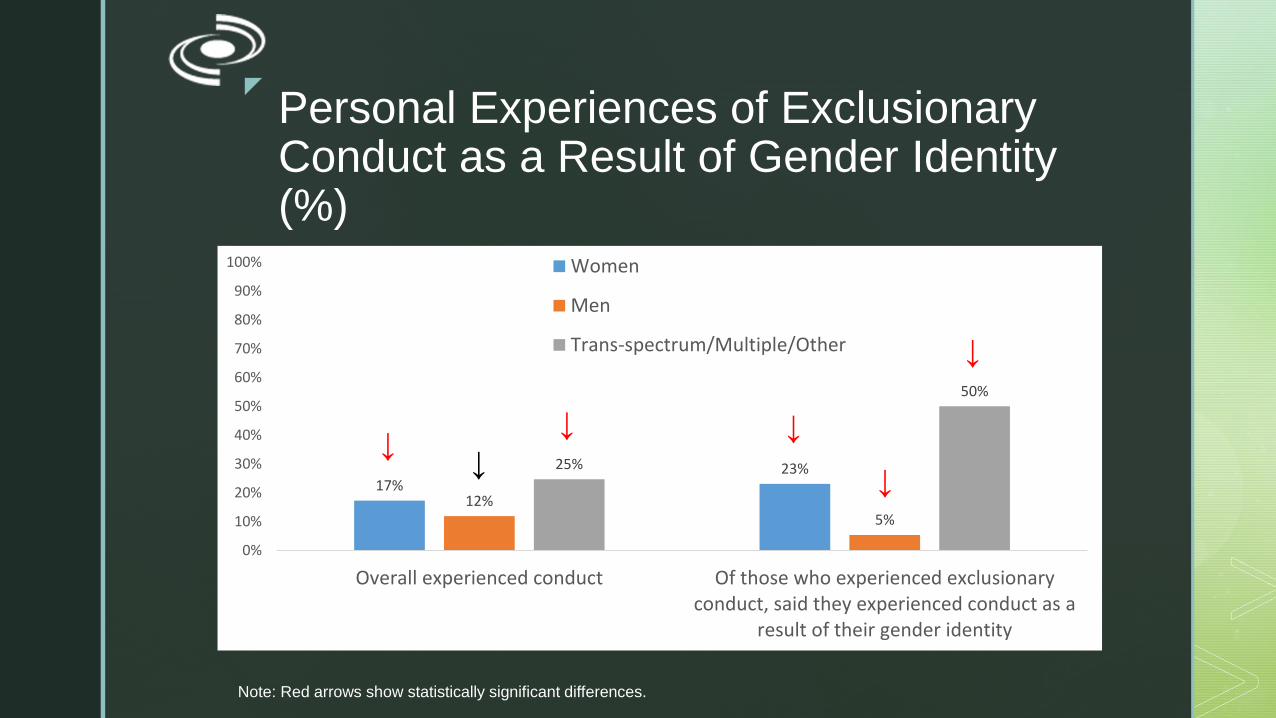
Personal Experiences of Exclusionary Conduct as a Result of Gender Identity (%)
17%23%
12%5%
25%
50%
0%
10%
20%
30%
40%
50%
60%
70%
80%
90%
100%
Overall experienced conduct Of those who experienced exclusionaryconduct, said they experienced conduct as a
result of their gender identity
Women
Men
Trans-spectrum/Multiple/Other
Note: Red arrows show statistically significant differences.
↓↓
↓↓
↓
↓
z
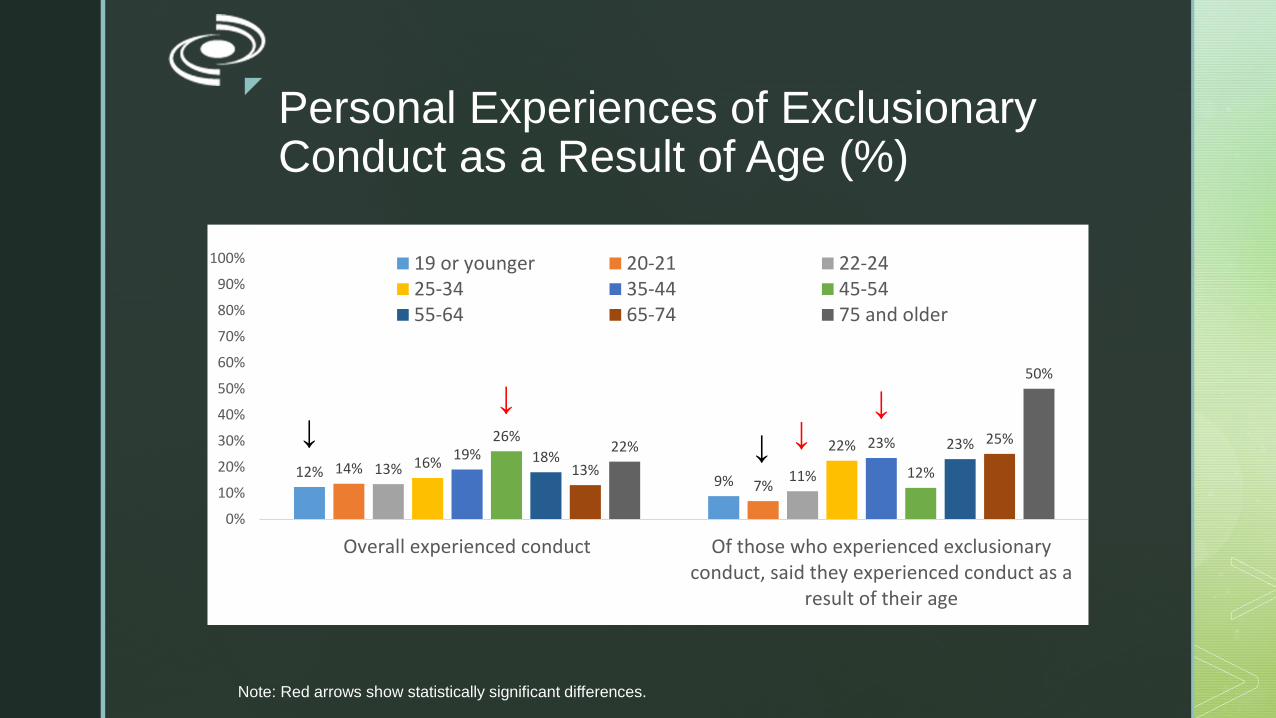
Personal Experiences of Exclusionary Conduct as a Result of Age (%)
12%9%
14%7%
13% 11%16%
22%19%
23%26%
12%18%
23%
13%
25%22%
50%
0%
10%
20%
30%
40%
50%
60%
70%
80%
90%
100%
Overall experienced conduct Of those who experienced exclusionaryconduct, said they experienced conduct as a
result of their age
19 or younger 20-21 22-2425-34 35-44 45-5455-64 65-74 75 and older
Note: Red arrows show statistically significant differences.
↓↓ ↓
↓
↓

z
Staff Respondents’ Top Bases of Experienced Exclusionary Conduct
Basis n %
Position status 154 43.0
Age 84 23.5
Gender identity 71 19.8
Length of service 68 19.0
Educational credential 45 12.6
Note: Reports only responses from Staff respondents who indicated on the survey that they experienced exclusionary,
intimidating, offensive, and/or hostile conduct (n = 358). Percentages do not sum to 100 due to multiple responses.

z
Faculty Respondents’ Top Bases of Experienced Exclusionary Conduct
Basis n %
Position status 20 37.7
Gender identity 12 22.6
Parental status 7 13.2
Educational credentials 6 11.3
Length of service 6 11.3
Note: Reports only responses from Faculty respondents who indicated on the survey that they experienced
exclusionary, intimidating, offensive, and/or hostile conduct (n = 53). Percentages do not sum to 100 due to multiple
responses.
z
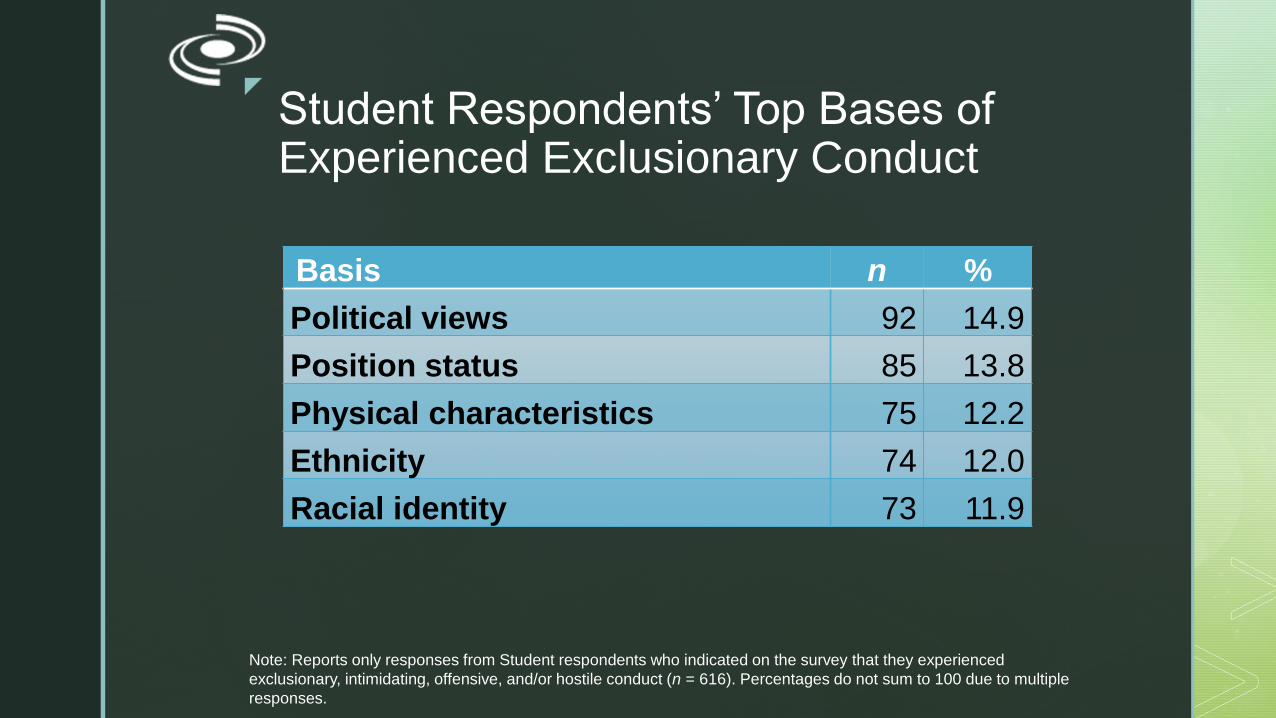
Student Respondents’ Top Bases of Experienced Exclusionary Conduct
Basis n %
Political views 92 14.9
Position status 85 13.8
Physical characteristics 75 12.2
Ethnicity 74 12.0
Racial identity 73 11.9
Note: Reports only responses from Student respondents who indicated on the survey that they experienced
exclusionary, intimidating, offensive, and/or hostile conduct (n = 616). Percentages do not sum to 100 due to multiple
responses.

z
Staff Respondents’ Top Forms of Experienced Exclusionary Conduct
Note: Reports only responses from Staff respondents who indicated on the survey that they experienced exclusionary,
intimidating, offensive, and/or hostile conduct (n = 358). Percentages do not sum to 100 due to multiple responses.
48%
45%
36%
32%
29%
0% 20% 40% 60% 80% 100%
Hostile work environment
Ignored/excluded
Isolated/left out
Silenced
Intimidated/bullied
Staff respondents

z
Faculty Respondents’ Top Forms of Experienced Exclusionary Conduct
32%
35%
41%
42%
45%
0% 20% 40% 60% 80% 100%
Silenced
Isolated/left out
Hostile work environment
Workplace incivility
Ignored/excluded
Faculty Respondents
Note: Reports only responses from Faculty respondents who indicated on the survey that they experienced
exclusionary, intimidating, offensive, and/or hostile conduct (n = 53). Percentages do not sum to 100 due to multiple
responses.

z
Undergraduate Student Respondents’ Top Forms of Experienced Exclusionary Conduct
Note: Reports only responses from Student respondents who indicated on the survey that they experienced
exclusionary, intimidating, offensive, and/or hostile conduct (n = 616). Percentages do not sum to 100 due to multiple
responses.
22%
25%
27%
41%
42%
0% 20% 40% 60% 80% 100%
Silenced
Staring
Intimidated/bullied
Isolated/left out
Ignored/excluded
Undergraduate Student Respondents

z
Graduate/Law Student Respondents’ Top Forms of Experienced Exclusionary Conduct
Note: Reports only responses from Student respondents who indicated on the survey that they experienced
exclusionary, intimidating, offensive, and/or hostile conduct (n = 616). Percentages do not sum to 100 due to multiple
responses.
27%
27%
30%
32%
36%
0% 20% 40% 60% 80% 100%
Intimidated/bullied
Derogatory verbal remarks
Hostile classroom environment
Isolated/left out
Ignored/excluded
Graduate/Professional Student Respondents

z
Staff Respondents’ Top Locations of Experienced Exclusionary Conduct
Location n %
While working at a UNH job 201 56.1
In a meeting with a group of people 129 36.0
In a meeting with one other person 101 28.2
In a UNH administrative office 89 24.9
On phone calls/text messages/email 61 17.0
Note: Reports only responses from Staff respondents who indicated on the survey that they experienced exclusionary,
intimidating, offensive, and/or hostile conduct (n = 358). Percentages do not sum to 100 due to multiple responses.

z
Faculty Respondents’ Top Locations of Experienced Exclusionary Conduct
Location n %
In a meeting with a group of people 26 49.1
While working at a UNH job 26 49.1
In a meeting with one other person 14 26.4
In a faculty office 10 18.9
In a UNH administrative office 8 15.1
In other public spaces at UNH 8 15.1
Note: Reports only responses from Faculty respondents who indicated on the survey that they experienced
exclusionary, intimidating, offensive, and/or hostile conduct (n = 53). Percentages do not sum to 100 due to multiple
responses.
z
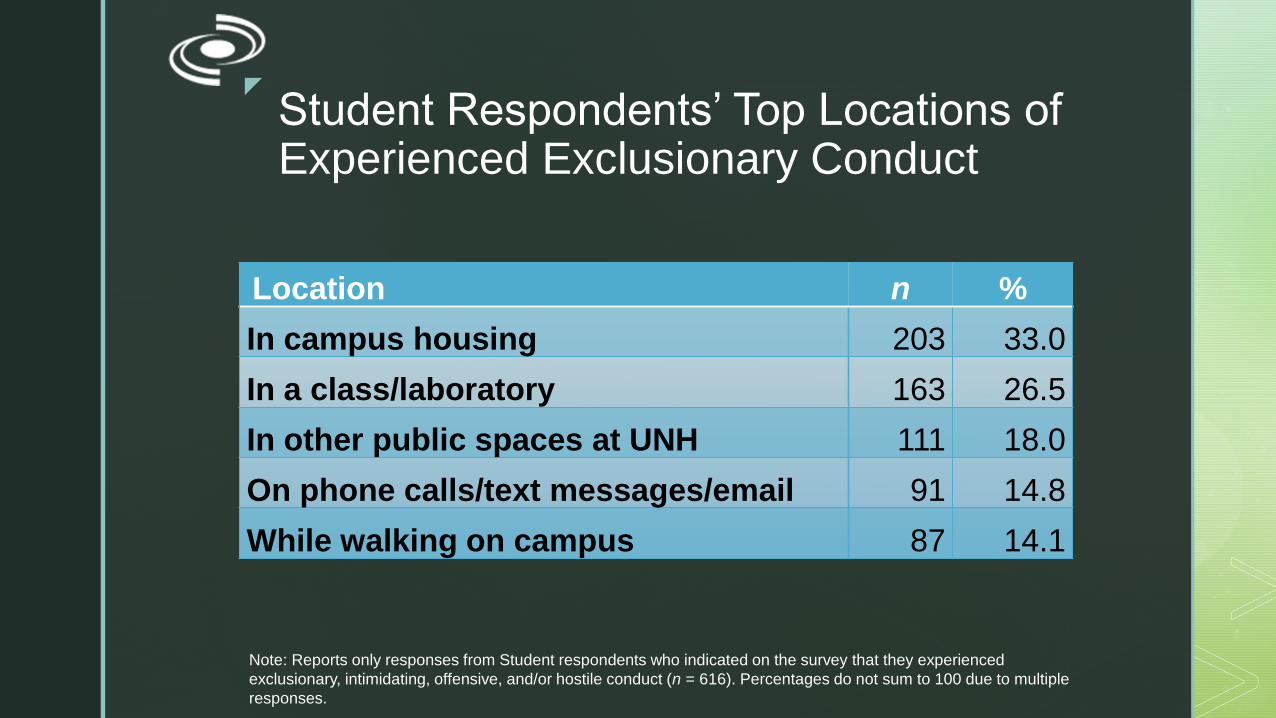
Student Respondents’ Top Locations of Experienced Exclusionary Conduct
Location n %
In campus housing 203 33.0
In a class/laboratory 163 26.5
In other public spaces at UNH 111 18.0
On phone calls/text messages/email 91 14.8
While walking on campus 87 14.1
Note: Reports only responses from Student respondents who indicated on the survey that they experienced
exclusionary, intimidating, offensive, and/or hostile conduct (n = 616). Percentages do not sum to 100 due to multiple
responses.

z
Top Sources of Experienced Exclusionary Conduct by Staff Position (%)
16%
19%
34%
42%
43%
0% 10% 20% 30% 40% 50% 60% 70% 80% 90% 100%
Senior administrator
Faculty
Staff
Supervisor/manager
Coworkers
Staff Respondents
Note: Reports only responses from Staff respondents who indicated on the survey that they experienced exclusionary,
intimidating, offensive, and/or hostile conduct (n = 358). Percentages do not sum to 100 due to multiple responses.

z
Top Sources of Experienced Exclusionary Conduct by Faculty Position (%)
Note: Reports only responses from Faculty respondents who indicated on the survey that they experienced
exclusionary, intimidating, offensive, and/or hostile conduct (n = 53). Percentages do not sum to 100 due to multiple
responses.
15%
18%
25%
45%
53%
0% 10% 20% 30% 40% 50% 60% 70% 80% 90% 100%
Senior administrator
Student
Dept/program chair
Faculty/instruct staff
Coworker/colleague
Faculty Respondents

z
Top Sources of Experienced Exclusionary Conduct for Undergraduate Students (%)
9%
11%
15%
29%
63%
0% 10% 20% 30% 40% 50% 60% 70% 80% 90% 100%
Staff
Faculty
Stranger
Friend
Student
Undergraduate Student Respondents
Note: Reports only responses from Student respondents who indicated on the survey that they experienced
exclusionary, intimidating, offensive, and/or hostile conduct (n = 616). Percentages do not sum to 100 due to multiple
responses.

z
Top Sources of Experienced Exclusionary Conduct for Graduate/Law Students (%)
Note: Reports only responses from Student respondents who indicated on the survey that they experienced
exclusionary, intimidating, offensive, and/or hostile conduct (n = 616). Percentages do not sum to 100 due to multiple
responses.
9%
15%
17%
39%
41%
0% 10% 20% 30% 40% 50% 60% 70% 80% 90% 100%
Supervisor
Staff
Academic Advisor
Faculty
Student
Graduate Student Respondents
z
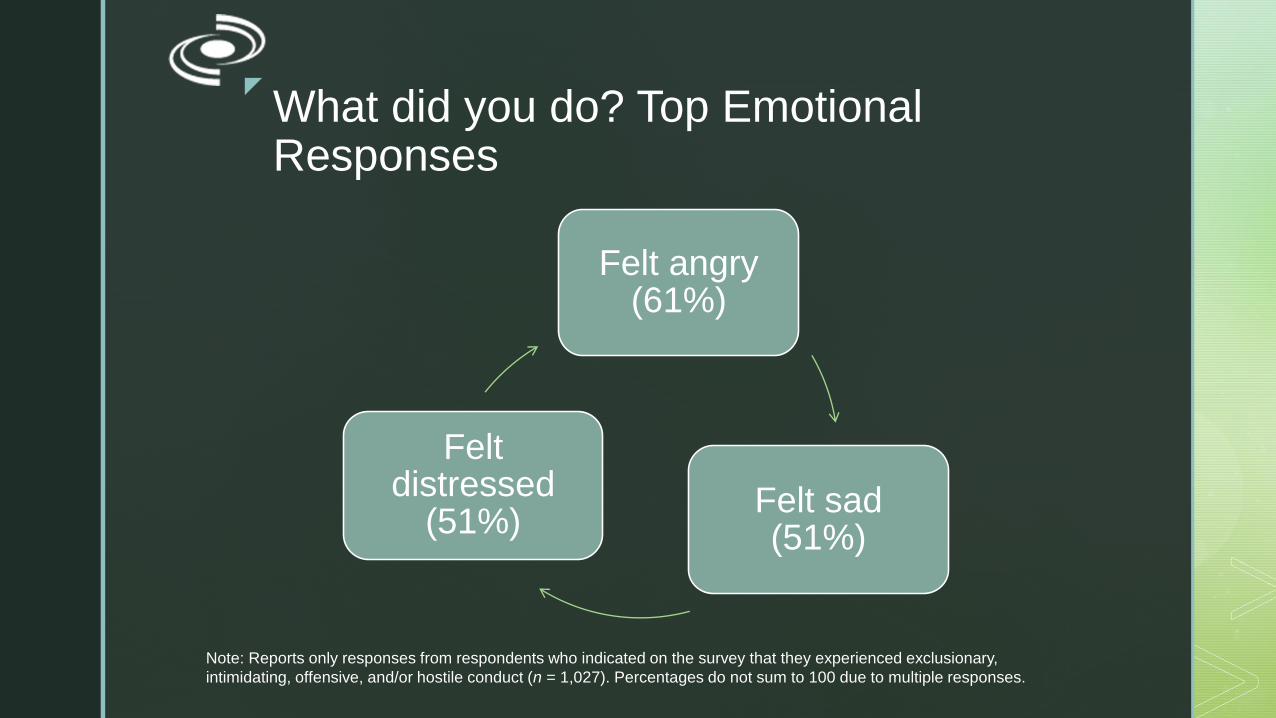
What did you do? Top Emotional Responses
Felt angry (61%)
Felt sad (51%)
Felt distressed
(51%)
Note: Reports only responses from respondents who indicated on the survey that they experienced exclusionary,
intimidating, offensive, and/or hostile conduct (n = 1,027). Percentages do not sum to 100 due to multiple responses.

z
What did you do? Top Actions
Told a friend (47%)
Avoided the
person/ venue (36%)
Told a family
member (36%)
Contacted UNH
resource (17%)
Note: Reports only responses from respondents who indicated on the survey that they experienced exclusionary,
intimidating, offensive, and/or hostile conduct (n = 1,027). Percentages do not sum to 100 due to multiple responses.

z
Which UNH resources did respondents contact?
▪ Human Resources
▪ Staff person
▪ Faculty member
▪ Dean’s Office
▪ PACS (Counseling Center)
Note: Reports only responses from respondents who indicated on the survey that they experienced exclusionary,
intimidating, offensive, and/or hostile conduct (n = 1,027). Percentages do not sum to 100 due to multiple responses.

z
11% (n = 108) Reported the Conduct
Felt satisfied with the outcome (33%)
Felt that it was addressed appropriately (11%)
Felt it was not addressed appropriately (44%)
Outcome is still pending (6%)
Outcome was not shared (6%)
Note: Reports only responses from respondents who indicated on the survey that they experienced exclusionary,
intimidating, offensive, and/or hostile conduct (n = 1,027). Percentages do not sum to 100 due to multiple responses.

z
Qualitative Themes
Experienced Exclusionary Conduct
Reporting process
Race-based incidents

z
Qualitative Themes
Experienced Exclusionary Conduct
Faculty and Staff respondents:
Negative workplace environment
Lack of respect
Student respondents:
Student misconduct
Accessibility

z
Top Facilities Barriers for Respondents with Disabilities
Facilities n %
Parking 108 13.8
Classrooms, laboratories (including
computer labs) 92 11.7
Walkways, pedestrian paths, crosswalks 83 10.8
Health & Wellness 84 10.7
College housing 83 10.6
Classroom buildings 83 10.5
Note: Reports only responses from individuals who indicated on the survey that they had a disability (n = 842).

z
Top Technology/Online Barriers for Respondents with Disabilities
Technology/online environment n %
Accessible electronic format 49 6.4
Computer equipment 39 5.1
Closed caption video/video audio
description 39 5.1
Access to alternative format texts 38 4.9
Office contact 36 4.7
Video/video audio description 17 8.9
Note: Reports only responses from individuals who indicated on the survey that they had a disability (n = 842).

z
Top Identity Barriers for Respondents with Disabilities
Identity n %
Intake forms (e.g., Health Center) 29 3.8
Learning technology 29 3.8
Management systems 27 3.6
Note: Reports only responses from individuals who indicated on the survey that they had a disability (n = 842).

z
Top Instructional/Campus Materials Barriers for Respondents with Disabilities
100
Instructional/campus materials n %
Academic accommodations 126 16.4
Food menus 51 6.6
Textbooks 44 5.8
Note: Reports only responses from individuals who indicated on the survey that they had a disability (n = 842).

z
Qualitative Themes for Respondents with Disabilities: Accessibility of UNH Campus
Elaborations on disability
Mobility concerns
Lack of accommodation
Great support/Difficulty accessing support

Unwanted Sexual Experiences
z
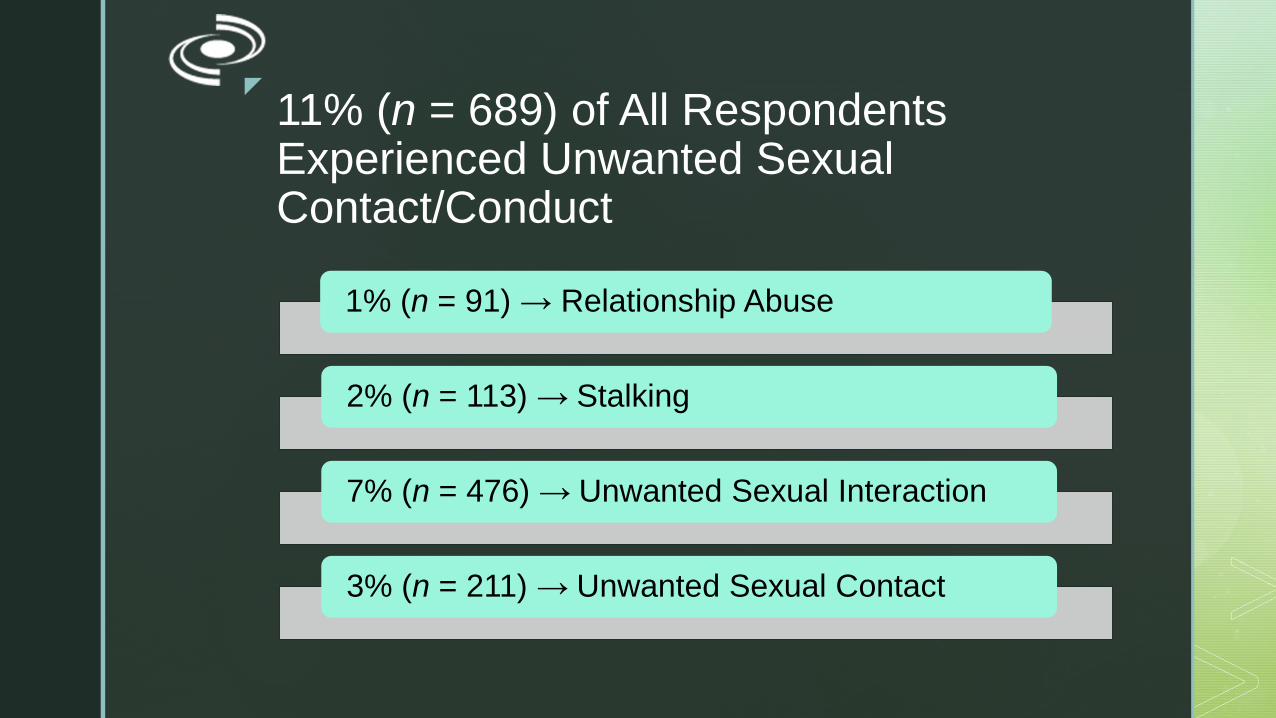
11% (n = 689) of All Respondents Experienced Unwanted Sexual Contact/Conduct
1% (n = 91) → Relationship Abuse
2% (n = 113) → Stalking
7% (n = 476) → Unwanted Sexual Interaction
3% (n = 211) → Unwanted Sexual Contact

z
Experienced Unwanted Sexual Conduct by Position Status (n)
Note: Responses with n < 5 are not presented in the figure.
68
621
7
8449
427
8
203
0
100
200
300
400
500
600
700
Employees Students
Relationship abuse
Stalking
Unwanted sexual interaction
Unwanted sexual contact

z
Experiences of Relationship Abuse While at UNH by Gender and Sexual Identity (n)
73
13
5
0 10 20 30 40 50 60 70 80
Women
Men
Trans-spectrum/Multiple/Other
14
14
62
0 10 20 30 40 50 60 70
Bisexual
Queer-spectrum
Heterosexual
←
←
←
←
←
←
Note: Red arrows show statistically significant differences.

z
Experiences of Relationship Abuse While at UNH by Disability Status (n)
11
71
9
0 10 20 30 40 50 60 70 80
Disability
No Disability
Multiple Disabilities ←
←
Note: Red arrows show statistically significant differences.

z
Alcohol/Drug Involvement in Relationship Abuse (Student Respondents)
Alcohol/Drug n %
No 56 66.7
Yes 28 33.3
Alcohol only 14 50.0
Drugs only 2 7.1
Both alcohol and drugs 12 42.9
Note: Only answered by respondents who indicated on the survey that they experienced Relationship Abuse (n = 91).

z
When Relationship Abuse Occurred
Time n %
Less than 6 months ago 23 25.3
6 - 12 months ago 20 22.0
13 - 23 months ago 24 26.4
2 - 4 years ago 16 17.6
5 - 10 years ago < 5 ---
11 - 20 years ago < 5 ---
More than 20 years ago < 5 ---
Note: Only answered by respondents who indicated on the survey that they experienced Relationship Abuse (n = 91).

z
Year in Which Student Respondents Experienced Relationship Abuse
Note: Only answered by respondents who indicated on the survey that they experienced Relationship Abuse (n = 91).
Year n %
During my time as a graduate/law student at
UNH < 5 ---
Prior to my first semester (e.g., Orientation,
pre-collegiate program at UNH) 13 15.5
Undergraduate first year 47 56.0
Undergraduate second year 32 38.1
Undergraduate third year 14 16.7
Undergraduate fourth year 5 6.0
After my fourth year as an undergraduate 0 0.0

z
Location of Relationship Abuse
On Campus (59%, n = 54)
Off Campus (62%, n = 56)
Note: Only answered by respondents who indicated on the survey that they experienced Relationship Abuse (n = 91).

z
Top Perpetrators of Relationship Abuse
Perpetrator n %
Current or former dating/intimate
partner 77 84.6
University of New Hampshire student 32 35.2
Acquaintance/friend 7 7.7
Note: Only answered by respondents who indicated on the survey that they experienced Relationship Abuse (n = 91).
z
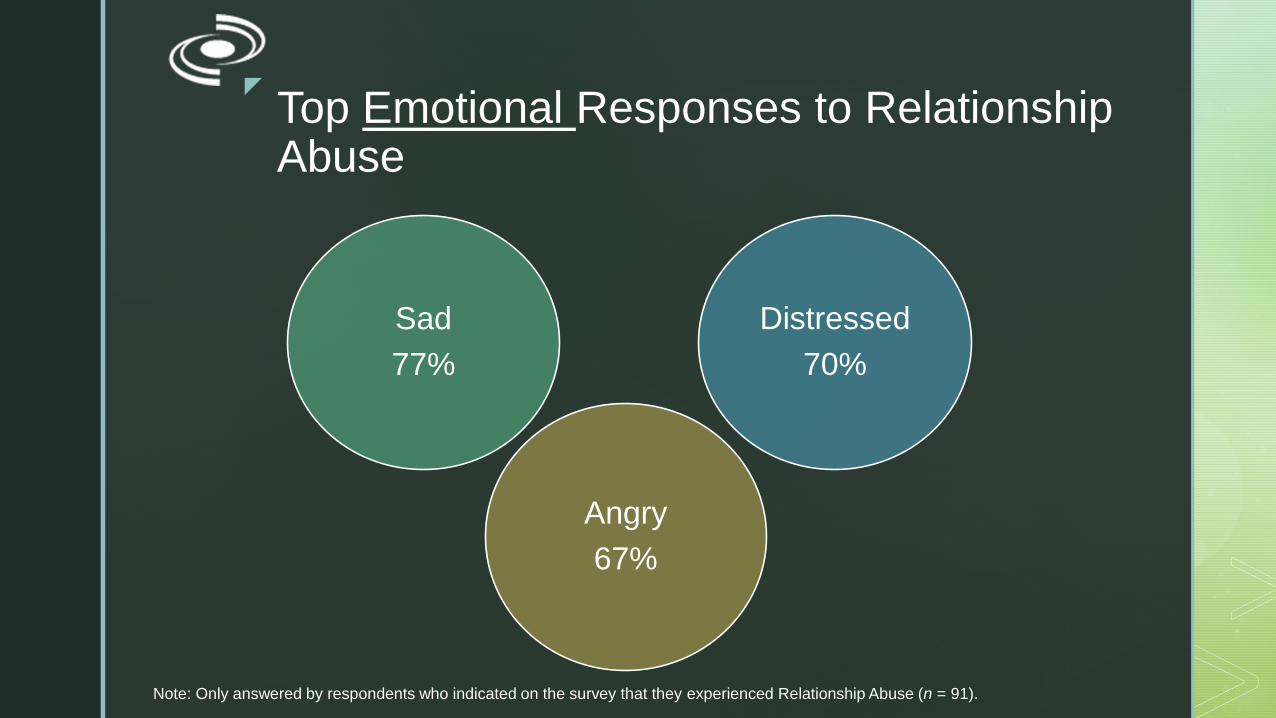
Top Emotional Responses to Relationship Abuse
Note: Only answered by respondents who indicated on the survey that they experienced Relationship Abuse (n = 91).
Sad
77%
Distressed
70%
Angry
67%
z
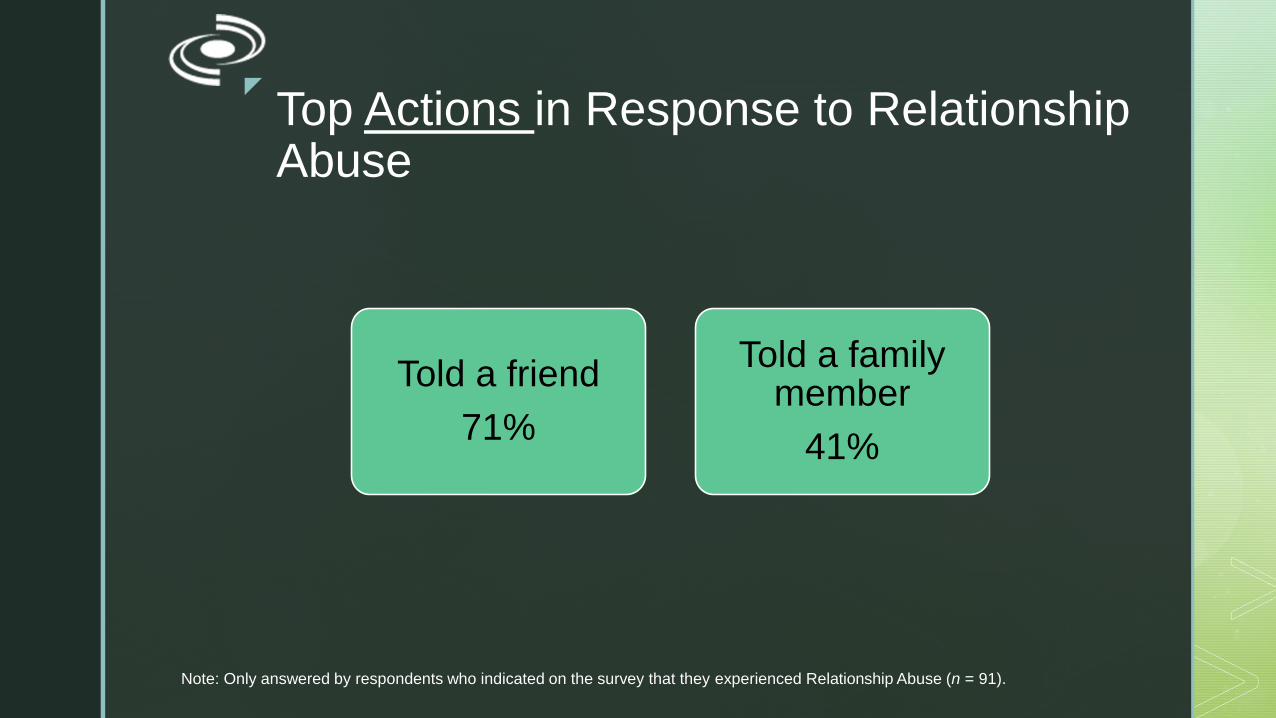
Top Actions in Response to Relationship Abuse
Note: Only answered by respondents who indicated on the survey that they experienced Relationship Abuse (n = 91).
Told a friend
71%
Told a family member
41%

z
Note: Only answered by respondents who indicated on the survey that they experienced Relationship Abuse (n = 18).
9% (n = 8) Reported the Conduct
Felt satisfied with the outcome (n < 5)
Felt that it was addressed appropriately (n < 5)
Felt it was not addressed appropriately (n < 5)
Outcome is still pending (n < 5)
Outcome was not shared (0%)

z
Qualitative Themes – Relationship Abuse
Handled it themselves
Naïve about the abuse
Not worth reporting
Not physical abuse
Worried about consequences

z
Experiences of Stalking While at UNH by Gender and Sexual Identity (n)
19
16
76
0 10 20 30 40 50 60 70 80
Bisexual
Queer-spectrum
Heterosexual
94
19
0
0 10 20 30 40 50 60 70 80 90 100
Women
Men
Trans-spectrum/Multiple/Other
←
←
←
←
←
Note: Red arrows show statistically significant differences.

z
Experiences of Stalking While at UNH by Disability Status (n)
13
86
11
0 10 20 30 40 50 60 70 80 90 100
Disability
No Disability
Multiple Disabilities ←
←
←
Note: Red arrows show statistically significant differences.

z
Alcohol/Drug Involvement in Stalking (Student Respondents)
Alcohol/Drug n %
No 88 85.4
Yes 15 14.6
Alcohol only 10 76.9
Drugs only 0 0.0
Both alcohol and drugs 3 23.1
Note: Only answered by respondents who indicated on the survey that they experienced Stalking (n = 113).

z
When Stalking Occurred
Time n %
Less than 6 months ago 37 32.7
6 - 12 months ago 32 28.3
13 - 23 months ago 22 19.5
2 - 4 years ago 14 12.4
5 - 10 years ago 7 6.2
11 - 20 years ago 0 0.0
More than 20 years ago < 5 ---
Note: Only answered by respondents who indicated on the survey that they experienced Stalking (n = 113).
z
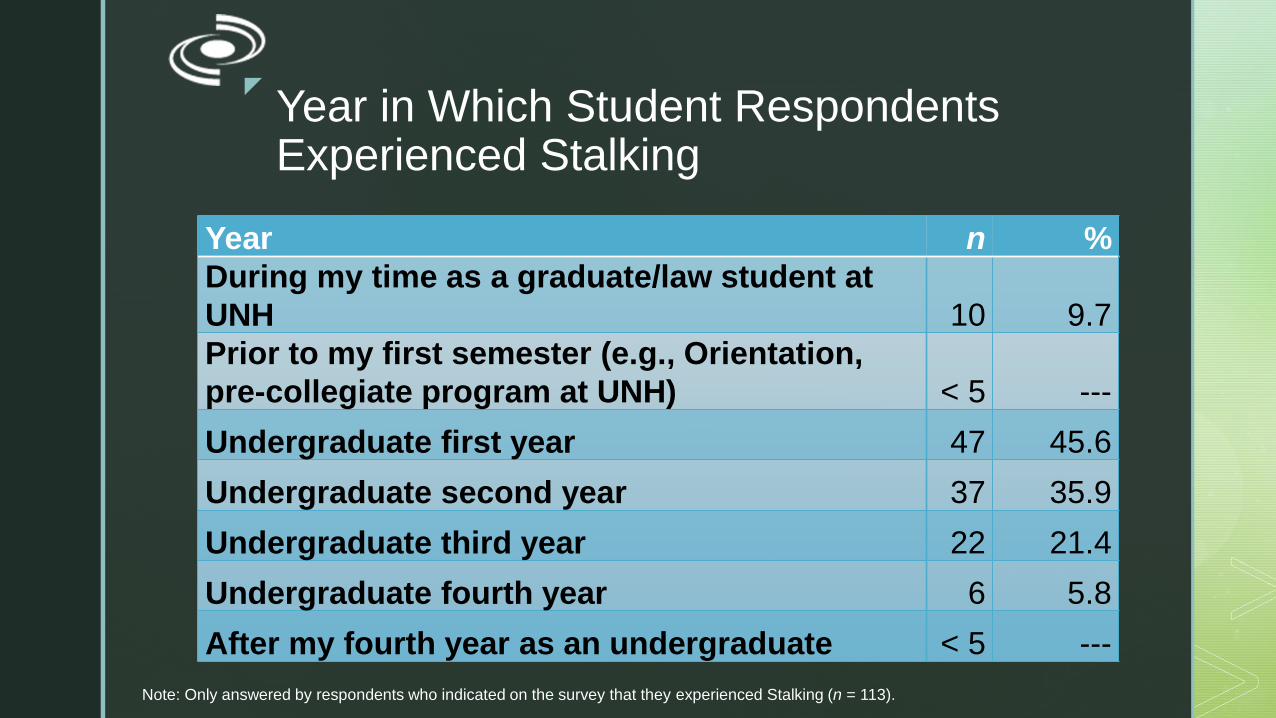
Year in Which Student Respondents Experienced Stalking
Note: Only answered by respondents who indicated on the survey that they experienced Stalking (n = 113).
Year n %
During my time as a graduate/law student at
UNH 10 9.7
Prior to my first semester (e.g., Orientation,
pre-collegiate program at UNH) < 5 ---
Undergraduate first year 47 45.6
Undergraduate second year 37 35.9
Undergraduate third year 22 21.4
Undergraduate fourth year 6 5.8
After my fourth year as an undergraduate < 5 ---

z
Location of Stalking
On Campus (74%, n = 83)
Off Campus (45%, n = 51)
Note: Only answered by respondents who indicated on the survey that they experienced Stalking (n = 113).

z
Top Perpetrators of Stalking
Perpetrator n %
University of New Hampshire student 69 61.1
Current or former dating/intimate partner 29 25.7
Acquaintance/friend 23 20.4
Stranger 19 16.8
Note: Only answered by respondents who indicated on the survey that they experienced Stalking (n = 113).

z
Top Emotional Responses to Stalking
Distressed
55%
Afraid
46%
Angry
41%
Note: Only answered by respondents who indicated on the survey that they experienced Stalking (n = 113).

z
Top Actions in Response to Stalking
Told a friend
62%
Avoided the person/venue
51%
Note: Only answered by respondents who indicated on the survey that they experienced Stalking (n = 113).

z
17% (n = 19) Reported the Conduct
Felt satisfied with the outcome (58%)
Felt that it was addressed appropriately (n < 5)
Felt it was not addressed appropriately (26%)
Outcome is still pending (0%)
Outcome was not shared (n < 5)
Note: Only answered by respondents who indicated on the survey that they experienced Stalking (n = 113).

z
Experiences of Unwanted Sexual Interaction While at UNH by Gender and Racial Identity (n)
434
28
11
0 100 200 300 400 500
Women
Men
Trans-spectrum/Multiple/Other
24
416
24
0 100 200 300 400 500
People of Color
White
Multiracial
←
←
←
←
←
Note: Red arrows show statistically significant differences.

z
Experiences of Unwanted Sexual Interaction While at UNH by Sexual Identity and Citizenship Status (n)
52
55
361
0 50 100 150 200 250 300 350 400
Bisexual
Queer-spectrum
Heterosexual
458
11
6
0 50 100 150 200 250 300 350 400 450 500
U.S. Citizen-Birth
U.S. Citizen-Natrualized
Non-U.S. Citizen
←
←
←
←
←
←
Note: Red arrows show statistically significant differences.
z
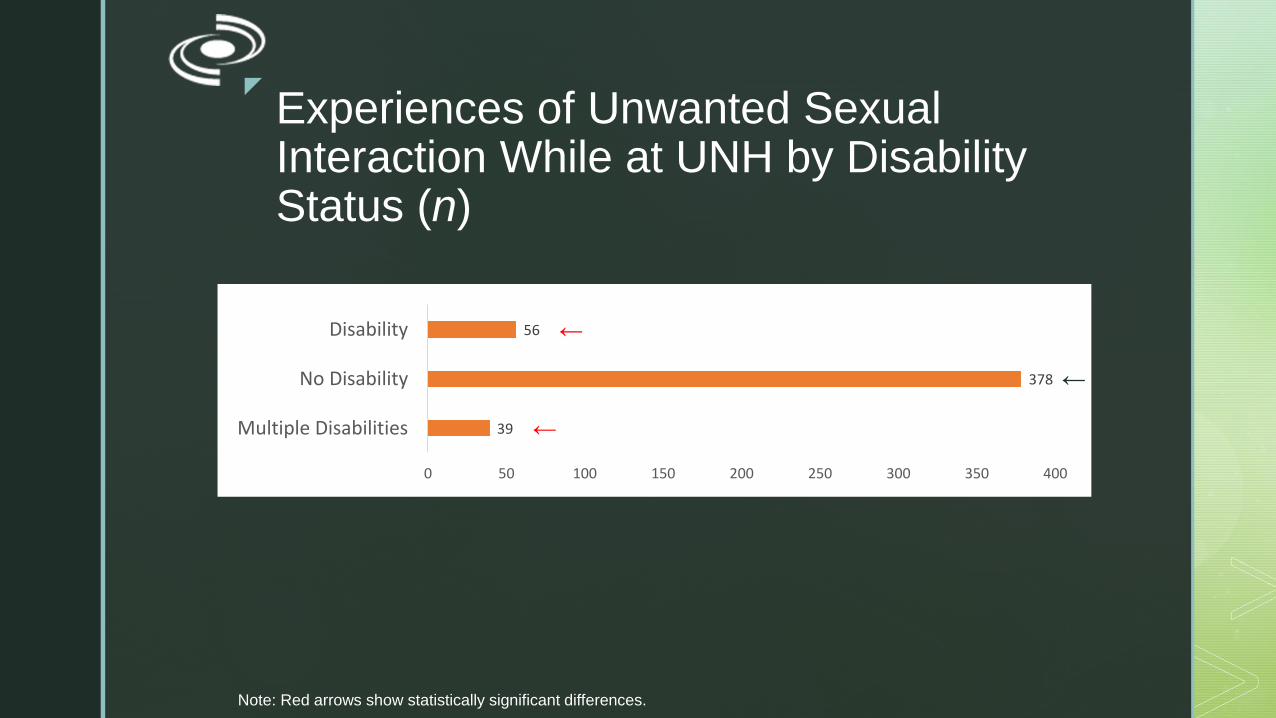
Experiences of Unwanted Sexual Interaction While at UNH by Disability Status (n)
56
378
39
0 50 100 150 200 250 300 350 400
Disability
No Disability
Multiple Disabilities ←
←
←
Note: Red arrows show statistically significant differences.

z
Alcohol/Drug Involvement in Unwanted Sexual Interaction (Student Respondents)
Alcohol/Drug n %
No 192 45.1
Yes 234 54.9
Alcohol only 161 77.8
Drugs only < 5 ---
Both alcohol and drugs 45 21.7
Note: Only answered by respondents who indicated on the survey that they experienced Unwanted Sexual Interaction (n = 476).

z
When Unwanted Sexual Interaction Occurred
Time n %
Less than 6 months ago 184 38.8
6 - 12 months ago 106 22.4
13 - 23 months ago 89 18.8
2 - 4 years ago 71 15.0
5 - 10 years ago 14 3.0
11 - 20 years ago 7 1.5
More than 20 years ago < 5 ---
Note: Only answered by respondents who indicated on the survey that they experienced Unwanted Sexual Interaction (n = 476).

z
Year in Which Student Respondents Experienced Unwanted Sexual Interaction
Year n %
During my time as a graduate/law student at
UNH 32 7.5
Prior to my first semester (e.g., Orientation,
pre-collegiate program at UNH) 8 1.9
Undergraduate first year 237 55.5
Undergraduate second year 156 36.5
Undergraduate third year 85 19.9
Undergraduate fourth year 49 11.5
After my fourth year as an undergraduate < 5 ---
Note: Only answered by respondents who indicated on the survey that they experienced Unwanted Sexual Interaction (n = 476).

z
Location of Unwanted Sexual Interaction
On Campus (70%, n = 333)
Off Campus (39%, n = 187)
Note: Only answered by respondents who indicated on the survey that they experienced Unwanted Sexual Interaction (n = 476).

z
Top Perpetrators of Unwanted Sexual Interaction
Perpetrator n %
UNH student 280 58.8
Stranger 191 40.1
Acquaintance/friend 105 22.1
Note: Only answered by respondents who indicated on the survey that they experienced Unwanted Sexual Interaction (n = 476).

z
Top Emotional Responses to Unwanted Sexual Interaction
Angry
51%
Embarrassed
47%
Distressed
42%
Note: Only answered by respondents who indicated on the survey that they experienced Unwanted Sexual Interaction (n = 476).

z
Top Actions in Response to Unwanted Sexual Interaction
Told a friend
55%
Did nothing
38%
Note: Only answered by respondents who indicated on the survey that they experienced Unwanted Sexual Interaction (n = 476).
Avoided the person/venue
33%

z
7% (n = 33) Reported the Conduct
Felt satisfied with the outcome (43%)
Felt that it was addressed appropriately (23%)
Felt it was not addressed appropriately (17%)
Outcome is still pending (n < 5)
Outcome was not shared (n < 5)
Note: Only answered by respondents who indicated on the survey that they experienced Unwanted Sexual Interaction (n = 476).

z
Qualitative Themes – Unwanted Sexual Interaction
Not serious enough
Fear of consequences
Common experience

z
Qualitative Themes – Unwanted Sexual Interaction
Handled situation on own
Lack of information
Expected a negative response

z
Experiences of Unwanted Sexual Contact While at UNH by Gender and Sexual Identity (n)
186
15
10
0 20 40 60 80 100 120 140 160 180 200
Women
Men
Trans-spectrum
30
30
144
0 20 40 60 80 100 120 140 160
Bisexual
Queer-spectrum
Heterosexual
←
←
←
←
←
←
Note: Red arrows show statistically significant differences.

z
Experiences of Unwanted Sexual Contact While at UNH by Housing and Disability Status (n)
70
35
79
0 10 20 30 40 50 60 70 80 90
Residential Life
Department of Housing
Non-Campus Housing
30
151
27
0 20 40 60 80 100 120 140 160
Single Disability
No Disability
Multiple Disabilities
←
←
←
←
←
←
Note: Red arrows show statistically significant differences.

z
When Unwanted Sexual Contact Occurred
Time n %
Less than 6 months ago 59 28.1
6 - 12 months ago 41 19.5
13 - 23 months ago 53 25.2
2 - 4 years ago 49 23.3
5 - 10 years ago < 5 ---
11 - 20 years ago < 5 ---
More than 20 years ago < 5 ---
Note: Only answered by respondents who indicated on the survey that they experienced Unwanted Sexual Contact (n = 211).

z
Year in Which Student Respondents Experienced Unwanted Sexual Contact
Year n %
During my time as a graduate/law student at
UNH 6 3.0
Prior to my first semester (e.g., Orientation,
pre-collegiate program at UNH) < 5 ---
Undergraduate first year 109 53.7
Undergraduate second year 49 24.1
Undergraduate third year 29 14.3
Undergraduate fourth year 12 5.9
After my fourth year as an undergraduate < 5 ---
Note: Only answered by respondents who indicated on the survey that they experienced Unwanted Sexual Contact (n = 211).

z
Alcohol/Drug Involvement in Unwanted Sexual Contact (Student Respondents)
Alcohol/Drug n %
No 53 26.4
Yes 148 73.6
Alcohol only 116 89.2
Drugs only 1 0.8
Both alcohol and drugs 13 10.0
Note: Only answered by respondents who indicated on the survey that they experienced Unwanted Sexual Contact (n = 211).

z
Location of Unwanted Sexual Contact
On Campus (57%, n = 120)
Off Campus (41%, n = 86)
Note: Only answered by respondents who indicated on the survey that they experienced Unwanted Sexual Contact (n = 211).

z
Top Perpetrators of Unwanted Sexual Contact
Perpetrator n %
University of New Hampshire student 109 51.7
Acquaintance/friend 67 31.8
Stranger 52 24.6
Current or former dating/intimate partner 24 11.4
Note: Only answered by respondents who indicated on the survey that they experienced Unwanted Sexual Contact (n = 211).
z
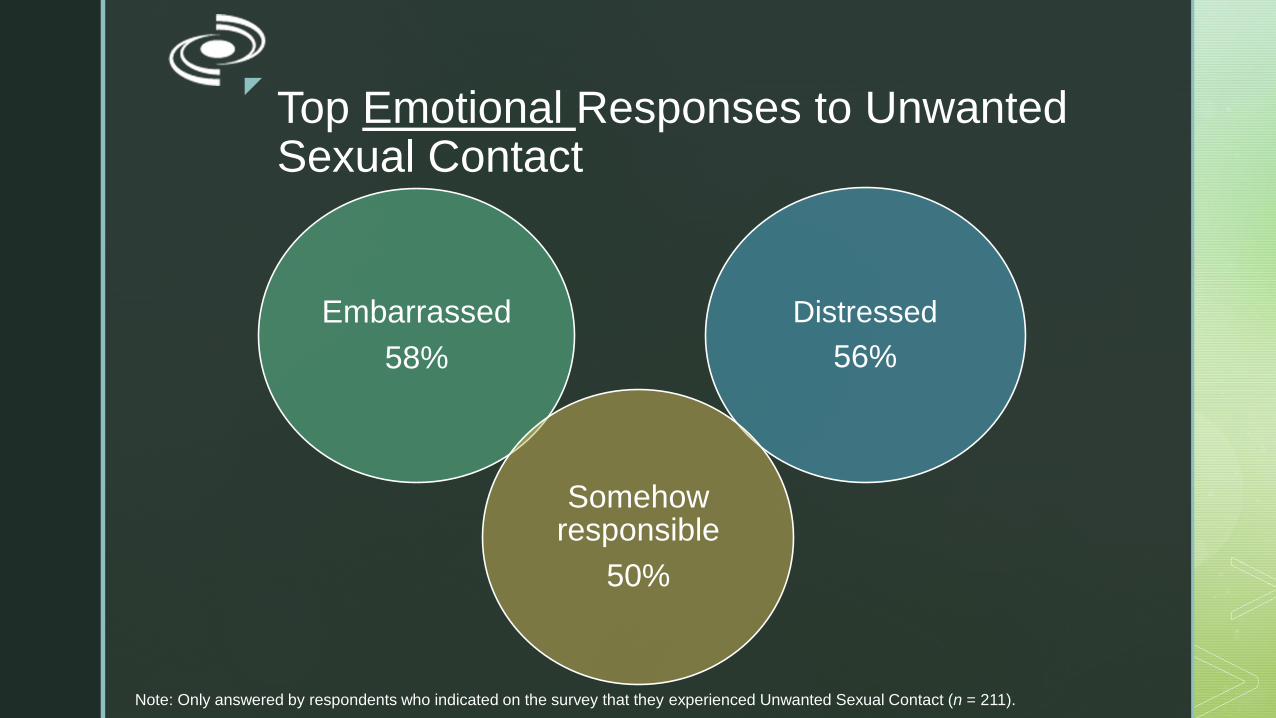
Top Emotional Responses to Unwanted Sexual Contact
Embarrassed
58%
Distressed
56%
Somehow responsible
50%
Note: Only answered by respondents who indicated on the survey that they experienced Unwanted Sexual Contact (n = 211).

z
Top Actions in Response to Unwanted Sexual Contact
Told a friend
68%
Avoided the person/venue
38%
Did nothing
29%
Note: Only answered by respondents who indicated on the survey that they experienced Unwanted Sexual Contact (n = 211).

z
10% (n = 20) Reported the Conduct
Felt satisfied with the outcome (32%)
Felt that it was addressed appropriately (26%)
Felt it was not addressed appropriately (n < 5)
Outcome is still pending (0%)
Outcome was not shared (26%)
Note: Only answered by respondents who indicated on the survey that they experienced Unwanted Sexual Contact (n = 211).

z
Qualitative Themes – Unwanted Sexual Contact
Not serious enough
Expected negative response
Fear of consequences
Just wanted to forget
Just wanted to avoid the reporting process

z
Knowledge of Unwanted Sexual Contact/Conduct Definitions, Policies, and Resources
91% were aware of the definition of
Affirmative Consent
76% knew how and where to report such
incidents
75% were aware of the role of UNH University
Title IX Coordinators with regard to reporting
incidents of unwanted sexual contact/conduct

z
Knowledge of Unwanted Sexual Contact/Conduct Definitions, Policies, and Resources
77% were familiar with the campus policies on
addressing sexual misconduct,
domestic/dating violence, and stalking
92% had a responsibility to report such incidents when
they saw them occurring on campus
or off campus
76% were aware of the campus resources listed on the survey

z
Knowledge of Unwanted Sexual Contact/Conduct Definitions, Policies, and Resources
80% understood that UNH standards of conduct/penalties
differed from standards of
conduct/penalties under the criminal
law
84% knew that UNH sends an emergency alert to the campus community
when such an incident occurs
63% knew that information about the
prevalence of sex offenses were
available in UNH Annual Clery Report

Intent to Persist

z
Who has seriously considered leaving UNH?
37% (n = 2,393)

z
Seriously Considered Leaving UNH by Position (%)
31%
23%
57% 56%
0%
10%
20%
30%
40%
50%
60%
70%
80%
90%
100%
Seriously considered leaving
Undergrad (n = 1,176)
Grad/Law Student (n = 204)
Faculty (n = 301)
Staff (n = 712)

z
Top Reasons Staff Respondents Seriously Considered Leaving UNH
Reason n %
Low salary/pay rate 427 26.9
Limited advancement opportunities 403 25.4
Note: Table reports only responses from Staff respondents who indicated on the survey that they had seriously considered leaving
UNH (n = 712).

z
Top Reasons Faculty Respondents Seriously Considered Leaving UNH
Reason n %
Low salary/pay rate 66 29.2
Limited advancement opportunities 62 27.4
Note: Table reports only responses from Faculty respondents who indicated on the survey that they had seriously considered
leaving UNH (n = 301).

z
Qualitative Themes for Employee
Respondents - Why Considered
Leaving…
Low salary
Lack of advancement opportunities
Concerns about leadership
Overwhelming workload
Feeling undervalued

z
Qualitative Themes for Employee
Respondents - Why Considered
Leaving…
Faculty respondents: Lack of Support
Not on the Tenure-Track Faculty respondents: No job security

z
Top Reasons Undergraduate Student Respondents Seriously Considered Leaving UNH
Reason n %
Lack of a sense of belonging 587 49.9
Lack of a social life at UNH 428 36.4
Financial reasons 415 35.3
Personal reasons 392 33.3
Note: Table reports only responses from Undergraduate Student respondents who indicated on the survey that they had seriously
considered leaving UNH (n = 1,176).

z
Top Reasons Graduate Student Respondents Seriously Considered Leaving UNH
Reason n %
Financial reasons 76 37.3
Lack of a sense of belonging 65 31.9
Note: Table reports only responses from Graduate Student respondents who indicated on the survey that they had seriously
considered leaving UNH (n = 204).

z
When Student RespondentsSeriously Considered Leaving UNH
74% in their first year
41% in their second year
13% in their third year
7% in their fourth year +
Note: Table reports only responses from Student respondents who indicated on the survey that they had seriously considered
leaving UNH (n = 1,380).

z
Undergraduate Student Respondents Who Seriously Considered Leaving by Racial Identity (%)
41%
• (n = 92)
• Multiracial respondents
37%
• (n = 113)
• Respondents of Color
29%
• (n = 938)
• White respondents

z
Graduate/Law Student Respondents Who Seriously Considered Leaving by Gender Identity (%)
60%
• (n = 9)
• Trans-spectrum respondents
25%
• (n = 86)
• Men respondents
20%
• (n = 108)
• Women respondents

z
Graduate/Law Student Respondents Who Seriously Considered Leaving by Sexual Identity (%)
33%
• (n = 20)
• Queer-spectrum respondents
27%
• (n = 17)
• Bisexual respondents
20%
• (n = 148)
• Heterosexual respondents

z
Graduate/Law Student Respondents Who Seriously Considered Leaving by Disability Status (%)
31%• (n = 34)
• Respondents with Disability
22%
• (n = 17)
• Respondents with No Disability

z
Qualitative Themes for Student
Respondents - Why Considered Leaving…
Financial worries
Lack of support
Undergraduate Student respondents: Concerns about major
Undergraduate Student respondents: Lack of social connections
Graduate/Law Student respondents: Concerns about advising

Perceptions

z
Respondents who observed conduct or communications directed towards a person/group of people that created an exclusionary, intimidating, offensive and/or hostile working or learning environment…
20% (n = 1,277)

z
Top Bases of Observed Exclusionary Conduct (%)
Note: Table reports only responses from individuals who indicated on the survey that they observed exclusionary,
intimidating, offensive, and/or hostile conduct (n = 1,277). Percentages do not sum to 100 due to multiple responses.
18%
18%
20%
25%
29%
0% 5% 10% 15% 20% 25% 30% 35% 40%
Political views
Sexual identity
Ethnicity
Gender/gender identity
Racial identity

z
Top Forms of Observed Exclusionary Conduct
Form n %
Derogatory verbal remarks 447 35.0
Person ignored or excluded 386 30.2
Person intimidated or bullied 351 27.5
Person isolated or left out 338 26.5
Note: Table reports only responses from individuals who indicated on the survey that they observed exclusionary,
intimidating, offensive, and/or hostile conduct (n = 1,277). Percentages do not sum to 100 due to multiple responses.

z
Top Targets of Observed Exclusionary Conduct
Student (51%)
Friend (23%)
Coworker/colleague (16%)
Note: Table reports only responses from individuals who indicated on the survey that they observed exclusionary,
intimidating, offensive, and/or hostile conduct (n = 1,277). Percentages do not sum to 100 due to multiple responses.
z
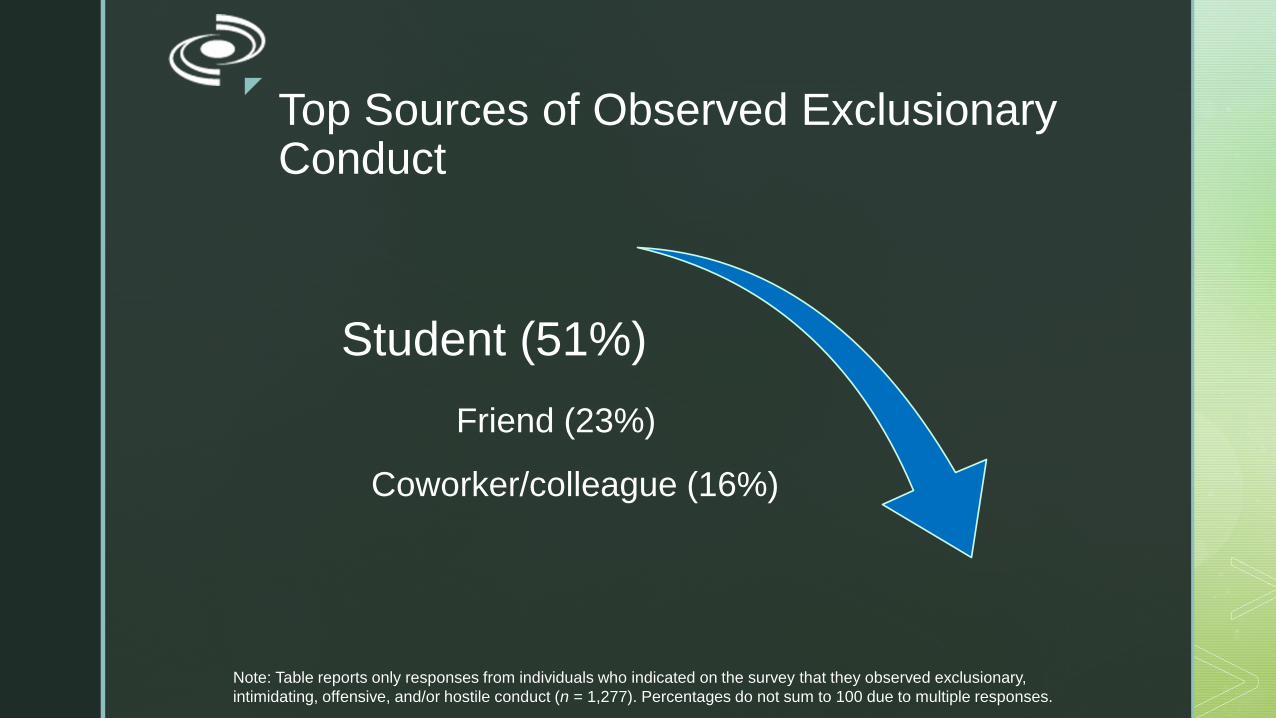
Top Sources of Observed Exclusionary Conduct
Student (51%)
Friend (23%)
Note: Table reports only responses from individuals who indicated on the survey that they observed exclusionary,
intimidating, offensive, and/or hostile conduct (n = 1,277). Percentages do not sum to 100 due to multiple responses.
Coworker/colleague (16%)

z
Top Location of Observed Exclusionary Conduct
In other public spaces at UNH
21%
Note: Table reports only responses from individuals who indicated on the survey that they observed exclusionary,
intimidating, offensive, and/or hostile conduct (n = 1,277). Percentages do not sum to 100 due to multiple responses.
z
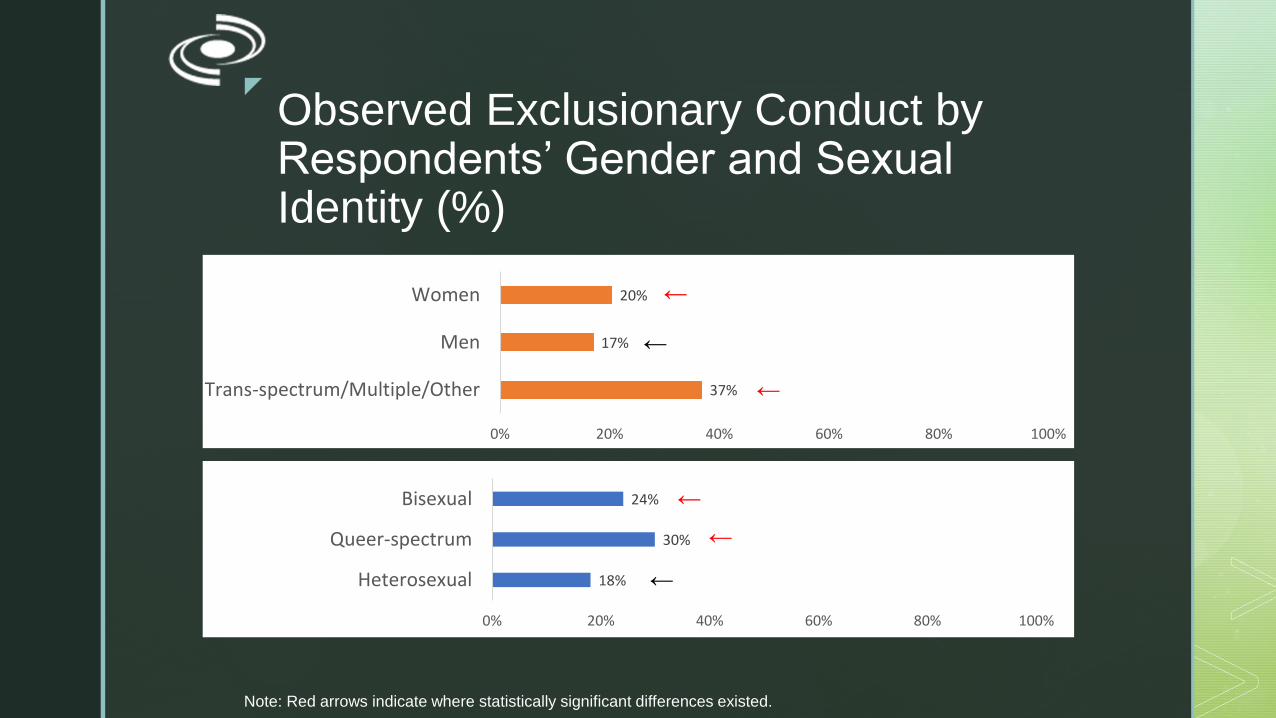
Observed Exclusionary Conduct by Respondents’ Gender and Sexual Identity (%)
Note: Red arrows indicate where statistically significant differences existed.
←
←20%
17%
37%
0% 20% 40% 60% 80% 100%
Women
Men
Trans-spectrum/Multiple/Other
24%
30%
18%
0% 20% 40% 60% 80% 100%
Bisexual
Queer-spectrum
Heterosexual
←
←
←
←
←
←

z
Observed Exclusionary Conduct by Respondents’ Political Views (%)
Note: Red arrows indicate where statistically significant differences existed.
20%
15%
16%
22%
31%
0% 20% 40% 60% 80% 100%
Very conservative
Conservative
Moderate
Liberal
Very liberal ←
←
←
←
←

z
Observed Exclusionary Conduct by Respondents’ Position (%)
Note: Red arrows indicate where statistically significant differences existed.
←18%
17%
28%
22%
0% 20% 40% 60% 80% 100%
Undergrad Student
Grad Student
Faculty
Staff
←
←
←
←

z
Top Actions in Response to Observed Exclusionary Conduct
Told a friend
35%Did
nothing
27%
Note: Table reports only responses from individuals who indicated on the survey that they observed exclusionary,
intimidating, offensive, and/or hostile conduct (n = 1,277). Percentages do not sum to 100 due to multiple responses.

z
9% (n = 113) Reported the Conduct
Felt satisfied with the outcome (46%)
Felt that it was addressed appropriately
(15%)
Felt it was not addressed appropriately
(29%)
Outcome is still pending (10%)
Note: Table reports only responses from individuals who indicated on the survey that they observed exclusionary,
intimidating, offensive, and/or hostile conduct (n = 1,277). Percentages do not sum to 100 due to multiple responses.

z
Qualitative Themes – Observed
Exclusionary Conduct
Conduct based on marginalized identity
Student misconduct
Choosing not to report
Politically-based conduct

Employee Perceptions

z
Employee Perceptions of Unjust Hiring
Practices
18% of Faculty respondents
19% of Staff respondents

z
Qualitative Themes – Unjust Hiring
Process
Rampant favoritism
Gender bias
Diversity hiring
Hiring protocol ignored
Bias against diversity candidates

z
Employee Perceptions of Unjust
Employment-Related Disciplinary Actions
12% of Faculty respondents
13% of Staff respondents

z
Qualitative Themes – Unjust Employment-
Related Disciplinary Actions
Personal reasons
Oppositional views
Poor management skills

z
Employee Perceptions of Unjust Promotion, Tenure, Reappointment, and/or Reclassification Practices
27% of Faculty respondents
25% of Staff respondents

z
Qualitative Themes – Unjust Promotion,
Tenure, Reappointment, and/or
Reclassification Practices
Gender bias
Criteria for promotion
Unequal treatment
Favoritism

z
Most Common Perceived Bases for
Unjust Employment Practices
Nepotism/ cronyism
Gender identity
Position
Age

Work-Life IssuesSUCCESSES & CHALLENGES
The majority of employee
respondents expressed positive views of campus
climate.

z
Staff Respondents - Examples of Successes
81% had supervisors who were supportive of their taking leave
80% were able to complete their assigned duties during scheduled hours
75% were included in opportunities that would help their careers as much as others in similar positions

z
Staff Respondents - Examples of Successes
70% would recommend UNH as a good place to work
Majority felt that their skills (75%) and work (76%) were valued.
Majority felt valued by coworkers in their department (86%), coworkers outside their department (73%), and their supervisors/ managers (81%)

z
Staff Respondents - Examples of Challenges
72%
• Burdened by work responsibilities beyond those of their colleagues with similar performance expectations
54%
• A hierarchy existed within staff positions that allowed some voices to be valued more than others
32%• Few felt that staff opinions were valued by UNH
faculty

z
Qualitative Themes for Staff Respondents
– Work-Life Attitudes
Overwhelming workload
Workload and staffing interactions
Performance evaluation concerns
z
Qualitative Themes for Staff Respondents
– Compensation, Professional
Development, and Work Environment
Lack of advancement opportunities
Limited professional development support
Leave taking
Lack of job security

z
Qualitative Themes for Staff Respondents
– Compensation, Professional
Development, and Work Environment
Benefits package
Salary
Flexible work schedules

z
Tenured/Tenure-Track Faculty Respondents - Examples of Successes
80% felt that teaching was valued by UNH
81% felt that research was valued by UNH
z
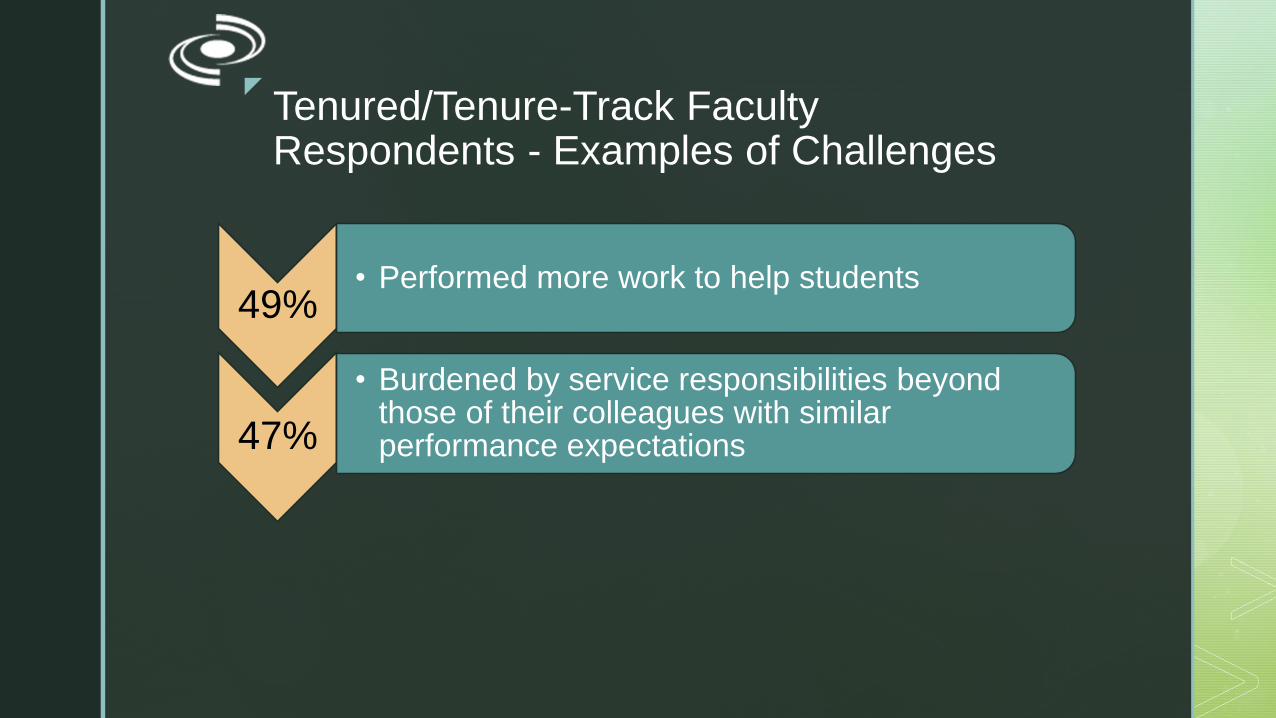
Tenured/Tenure-Track Faculty Respondents - Examples of Challenges
49%• Performed more work to help students
47%
• Burdened by service responsibilities beyond those of their colleagues with similar performance expectations

z
Qualitative Themes for Tenured/Tenure-
Track Faculty Respondents - Faculty Work
Criteria for tenure and promotion
Inequity in service workloads
Faculty mentorship
Lack of support for research

z
Non-Tenure-Track Faculty Respondents - Examples of Successes
78% felt that research was valued by UNH
76% felt that teaching was valued by UNH

z
Non-Tenure-Track Faculty Respondents - Examples of Challenges
40%
• Felt pressured to do extra work that was uncompensated
36%• Performed more work to help students

z
Qualitative Themes for Non-Tenure-Track
Faculty Respondents - Faculty Work
Lack of job security
Contract negotiations
Inequities compared with tenure-track faculty

z
All Faculty Respondents - Examples of Successes
Majority felt valued by faculty in their department/program (79%), their department/program chair (78%), other faculty (70%), and students in the classroom (81%)

z
All Faculty Respondents - Examples of Challenges
68%
• A hierarchy existed within faculty positions that allowed some voices to be valued more than others
38%• Few felt salaries for tenure-track faculty
positions were competitive

z
Qualitative Themes for Faculty
Respondents - Faculty Work
Benefits
Professional development resources
Salaries
Job security
Differential voices

Student Respondents’ Perceptions
z
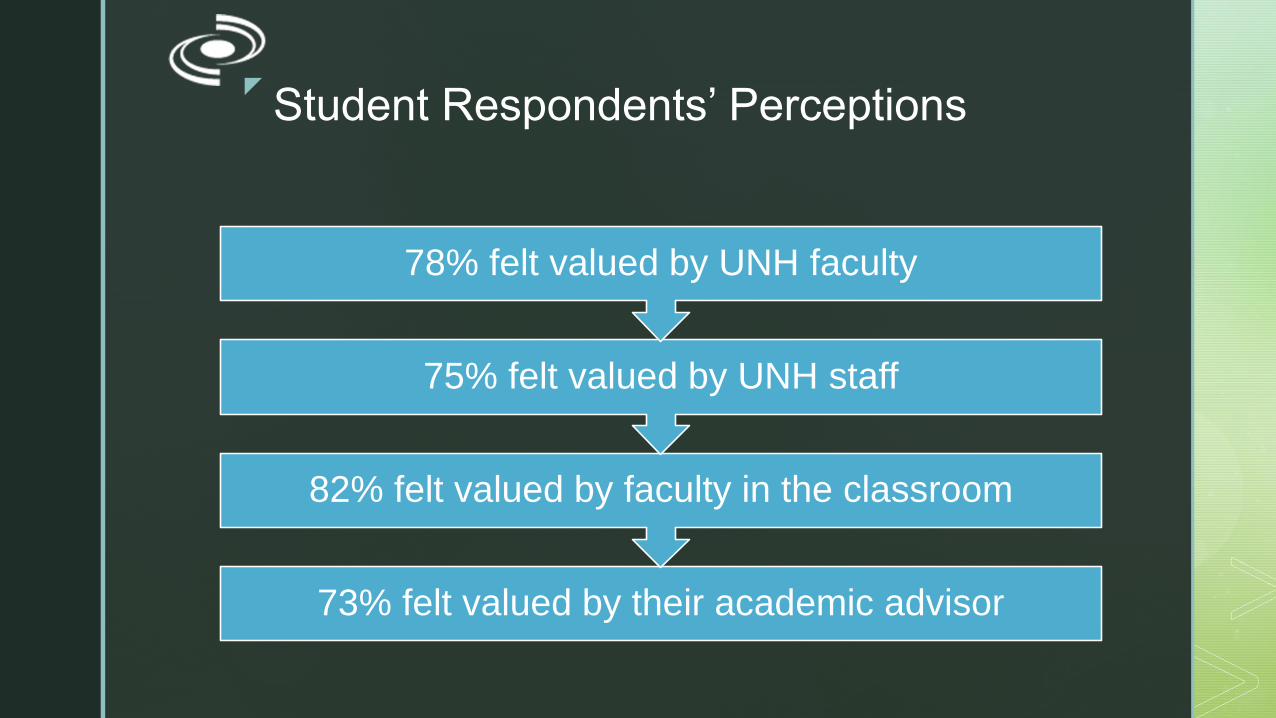
Student Respondents’ Perceptions
73% felt valued by their academic advisor
82% felt valued by faculty in the classroom
75% felt valued by UNH staff
78% felt valued by UNH faculty

z
Student Respondents’ Perceptions
76% had faculty whom they perceived as role models
73% felt valued by other students in the classroom

z
Graduate/Law Student Respondents’ Perceptions
84% felt that their department faculty members (other than their advisor) responded to their
emails, calls, or voicemails in a prompt manner
80% felt that their advisors responded to their emails, calls, or voicemails in a prompt manner
79% had adequate access to their advisors

z
Graduate/Law Student Respondents’ Perceptions
81% felt comfortable sharing their professional goals with their advisors
88% felt that their department staff members (other than their advisor) responded to their
emails, calls, or voicemails in a prompt manner

z
Qualitative Themes for Graduate/Law
Student Respondents’ Perceptions
Varying views on quality of advising
Faculty interactions
Departmental support
Student Respondents’ Perceived Academic Success

z
Student Respondents’ Perceived Academic Success
Trans-spectrum Undergraduate Student respondents had less Perceived Academic Success than Women
Undergraduate Student respondents.
Trans-spectrum Graduate/Law Student respondents had less Perceived Academic Success than Women or Men
Graduate/Law Student respondents.
Note: Analyses were run by Gender Identity, Racial Identity, Sexual Identity, First-Generation Status, and Income Status.

z
Student Respondents’ Perceived Academic Success
People of Color and Multiracial Undergraduate Student respondents had less Perceived Academic Success
than White/European American Undergraduate Student respondents.
Undergraduate Student respondents with a Disability had less Perceived Academic Success than
Undergraduate Student respondents with No Disability.
Note: Analyses were run by Gender Identity, Racial Identity, Sexual Identity, First-Generation Status, and Income Status.
z
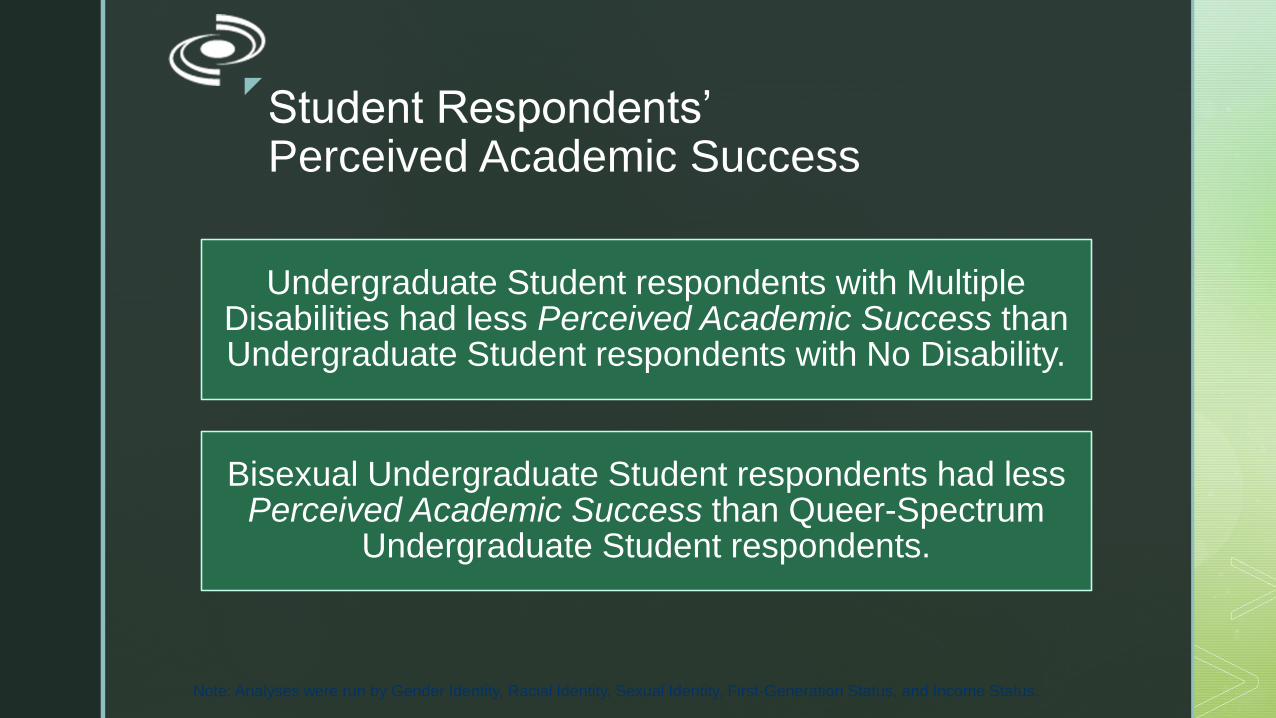
Student Respondents’ Perceived Academic Success
Undergraduate Student respondents with Multiple Disabilities had less Perceived Academic Success than Undergraduate Student respondents with No Disability.
Bisexual Undergraduate Student respondents had less Perceived Academic Success than Queer-Spectrum
Undergraduate Student respondents.
Note: Analyses were run by Gender Identity, Racial Identity, Sexual Identity, First-Generation Status, and Income Status.

z
Student Respondents’ Perceived Academic Success
First-Generation/Low-Income Undergraduate Student respondents had less Perceived Academic Success
than Not-First-Generation/Low-Income Undergraduate Student respondents.
First-Generation/Low-Income Graduate/Law Student respondents had less Perceived Academic Success
than Not-First-Generation/Low-Income Graduate/Law Student respondents.
Note: Analyses were run by Gender Identity, Racial Identity, Sexual Identity, First-Generation Status, and Income Status.
Institutional Actions ▪

z
Available Campus Initiatives that Positively Influenced Climate for Faculty Respondents
Mentorship for new faculty
Access to counseling for people who have
experienced harassment
Fair process to resolve conflicts
Clear process to resolve conflicts
Affordable childcare

z
Unavailable Campus Initiatives that Would Positively Influence Climate for Faculty Respondents
Affordable childcare
Fair process to resolve conflicts
Mentorship for new faculty
Clear process to resolve conflicts
Access to counseling for people who have
experienced harassment

z
Qualitative Themes for Faculty
Respondents – Campus Initiatives
Ways to increase focus on diversity
Childcare concerns
Broad comments about initiatives

z
Available Campus Initiatives that Positively
Influenced Climate for Staff Respondents
Access to counseling for people who have
experienced harassment
Career development opportunities for staff
Mentorship for new staff
Fair process to resolve conflicts
A common first-year/transfer
experience for students (e.g., Paul College
FIRE)

z
Unavailable Campus Initiatives that Would
Positively Influence Climate for Staff
RespondentsCareer development opportunities for staff
Mentorship for new staff
Affordable childcareFair process to resolve conflicts
Clear process to resolve conflicts

z
Qualitative Themes for Staff Respondents
– Campus Initiatives
Diversity workshops
Common student experience
Leadership training
Child-care availability
Conflict resolution process

z
Available Campus Initiatives that Positively
Influenced Climate for Student
RespondentsEffective academic
advising
Effective faculty mentorship of students
Effective staff mentorship of students
A person to address student complaints of bias by faculty/staff in learning environments
A person to address student complaints of
bias by other students in learning environments

z
Unavailable Campus Initiatives that Would
Positively Influence Climate for Student
RespondentsEffective academic
advising
Effective faculty mentorship of students
Opportunities for cross-cultural dialogue
among faculty, staff, and students
Effective staff mentorship of students
A person to address student complaints of bias by faculty/staff in learning environments

z
Qualitative Themes for Student
Respondents – Campus Initiatives
Opinions on diversity workshops
Student support
Increasing diversity focus

Summary
Strengths and Successes
Opportunities for
Improvement

z
Context - Interpreting the Summary
Although colleges and universities attempt to foster welcoming and inclusive environments, they are not immune to negative societal
attitudes and discriminatory behaviors.
As a microcosm of the larger social environment, college and university campuses
reflect the pervasive prejudices of society.
Classism, Racism, Sexism,
Genderism, Heterosexism, etc.
(Eliason, 1996; Hall & Sandler, 1984; Harper & Hurtado, 2007; Hart & Fellabaum, 2008; Malaney, Williams, & Gellar, 1997; Rankin,
2003; Rankin & Reason, 2008; Rankin, Weber, Blumenfeld, & Frazer, 2010; Smoth, 2009; Worthington, Navarro, Loewy & Hart, 2008)
z
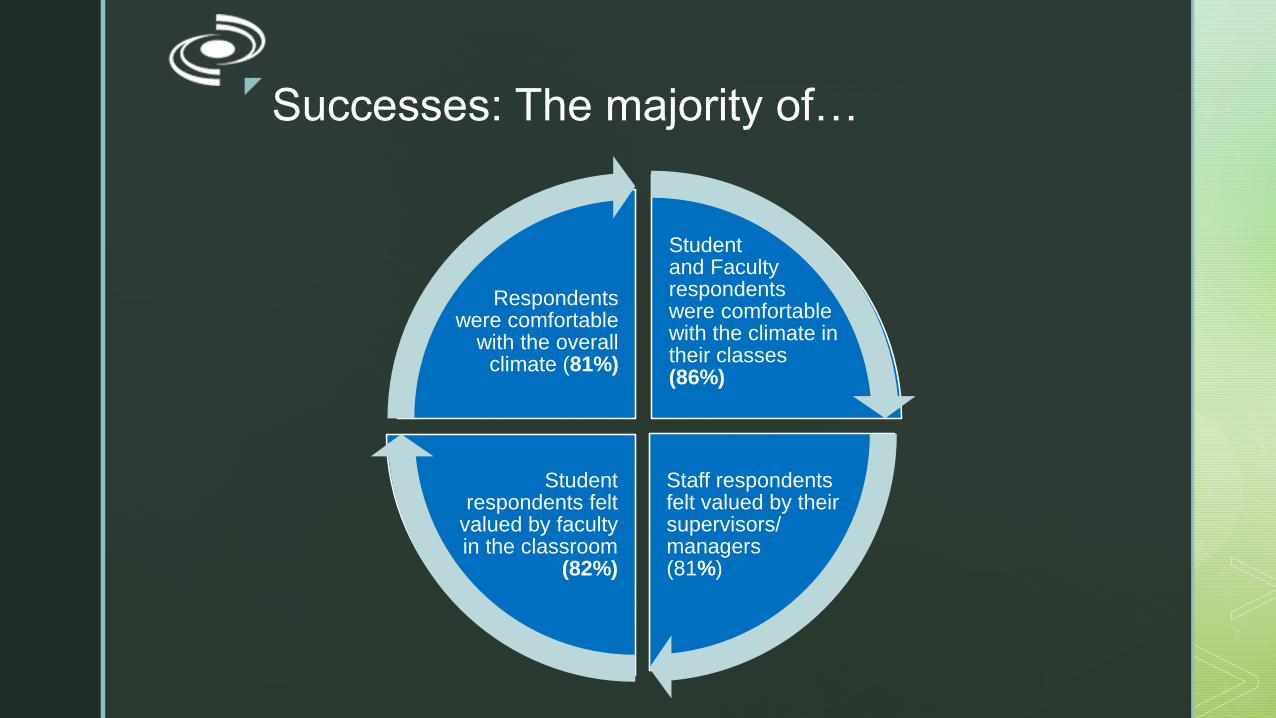
Successes: The majority of…
Student and Faculty respondents were comfortable with the climate in their classes (86%)
Staff respondents felt valued by their supervisors/ managers (81%)
Student respondents felt
valued by faculty in the classroom
(82%)
Respondents were comfortable
with the overall climate (81%)

z
Challenges and Opportunities for Improvement
16% personally experienced exclusionary
conduct within the last year at UNH
54% of Staff felt a hierarchy existed
within staff positions that allowed some voices to be valued more than others
11% experienced unwanted sexual contact/conduct
while at UNH
57% of Faculty and 56% of Staff
seriously considered leaving
UNH

z
Next Steps
The full report, executive summary, and R&A’s presentation will be available on the climate survey website.
https://www.unh.edu/president/campus-climate
A hard copy of the report will be available in the Library.
z
Data Request PolicyAdministrative Units & Colleges
Standard Unit Level Reports
• Colleges and larger administrative units (e.g. VPAA, VPFA, Student Affairs) may request college/unit level reports.
• Reports will offer college/unit results compared with those of UNH as a whole.
• Reports will be delivered via secure Box folder beginning January 2, 2020.

z
Data Request PolicyAdministrative Units & Colleges
Additional Reporting
• Additional data requests by colleges/administrative units and individuals will be considered.

z
Data Request Policy
Request Process
• Requests for reports should be made to Dr. Anne Shattuck, Institutional Research & Assessment.
• All requests will be reviewed and approved by a subcommittee of the Climate Survey Working Group to ensure protection of respondent identities and compliance with the IRB approval for this project.

z
Data Request Policy
Request Process
• Reports can be provided only in cases where the unit under analysis had at least a 30% response rate.
• The sample n must be large enough to both conduct the analysis and protect respondents’ confidentiality.
• Cell sizes of less than 10 will be suppressed or combined with other groups to protect respondents’ identities.
• No raw data will be released

z
Next StepsDevelopment of Actions

z
Work since 2018
• The campus climate survey
• Diversity and Inclusion workshop for leadership
• Two fall sessions on inclusive teaching, advertised through CEITL; one spring session on faculty of color and promotion and tenure
Recommendations already addressed
from the Task Force Report of
2018 and related work:

z
Work since 2018
Formation of the Inclusion Council, composed of chairs from colleges and other units’ diversity & inclusion committees
Dive In and Deliver call for proposals, due Oct. 15, 2019: to seed innovative approaches to institutionalizing diversity, inclusion, and equity at UNH
Master calendar on Canvas indicates a fairly comprehensive showing of faith-based holidays or other related significant dates
Academic Technology will roll out a digital inclusive teaching module

z
Work since 2018
ENGL 401: diversity and inclusion woven into the curriculum; tools to assist faculty and grad students in teaching the material; and an assessment
Postdoctoral Diversity and Innovation Scholars Program
Provost’s Office: retention issues first- to senior years
Reinstituted the All Department Chairs and Academic Leaders Meeting
Ongoing discussions with Undergraduate and Graduate Student Senates
Ongoing discussions with PAT, Operating Staff, Research, and Clinical Councils
z
Key Priorities
Enhance Student Success and Well-Being
Expand Academic Excellence

z
• Constituents and drivers of campus climate survey
• Will determine overall success in addressing areas in need of improvement
UNH Community
• Performs one of many analyses of the Campus Climate Survey
• Identifies key points and communicates hem across the university
President's Advisory Council on Campus Climate
• Makes recommendations for programming, policies, and procedures.
• Identifies appropriate channels to carry out work
Commission for Community, Equity and Diversity
• Uses key points and recommendations as a guide for its work within all colleges and key campus units
Inclusion Council

z
Questions and Discussion