Yum! Brands, Inc. - Climate Change 2020
49
Yum! Brands, Inc. - Climate Change 2020 C0. Introduction C0.1 (C0.1) Give a general description and introduction to your organization. Yum! Brands, Inc., based in Louisville, Kentucky, has over 50,000 restaurants in more than 150 countries and territories primarily operating the Company’s brands – KFC, Pizza Hut, and Taco Bell – global leaders of the chicken, pizza, and Mexican-style food categories. Starting at end of the first quarter of 2020 the Company’s family of brands includes The Habit Burger Grill, a fast-casual restaurant concept specializing in made-to-order chargrilled burgers, sandwiches and more. In 2019, Yum! Brands was named to the Dow Jones Sustainability North America Index and ranked among the top 100 Best Corporate Citizens by Corporate Responsibility Magazine. C0.2 (C0.2) State the start and end date of the year for which you are reporting data. Start date End date Indicate if you are providing emissions data for past reporting years Select the number of past reporting years you will be providing emissions data for Reporting year January 1 2019 December 31 2019 No <Not Applicable> C0.3 (C0.3) Select the countries/areas for which you will be supplying data. Australia Canada France Germany India Italy Netherlands Russian Federation Singapore South Africa Spain United Arab Emirates United Kingdom of Great Britain and Northern Ireland United States of America C0.4 (C0.4) Select the currency used for all financial information disclosed throughout your response. USD C0.5 (C0.5) Select the option that describes the reporting boundary for which climate-related impacts on your business are being reported. Note that this option should align with your chosen approach for consolidating your GHG inventory. Operational control C1. Governance C1.1 (C1.1) Is there board-level oversight of climate-related issues within your organization? Yes CDP Page of 46 1
Transcript of Yum! Brands, Inc. - Climate Change 2020
Yum! Brands, Inc. - Climate Change 2020
C0. Introduction
C0.1
(C0.1) Give a general description and introduction to your organization.
Yum! Brands, Inc., based in Louisville, Kentucky, has over 50,000 restaurants in more than 150 countries and territories primarily operating the Company’s brands – KFC,Pizza Hut, and Taco Bell – global leaders of the chicken, pizza, and Mexican-style food categories. Starting at end of the first quarter of 2020 the Company’s family of brandsincludes The Habit Burger Grill, a fast-casual restaurant concept specializing in made-to-order chargrilled burgers, sandwiches and more. In 2019, Yum! Brands was namedto the Dow Jones Sustainability North America Index and ranked among the top 100 Best Corporate Citizens by Corporate Responsibility Magazine.
C0.2
(C0.2) State the start and end date of the year for which you are reporting data.
Start date End date Indicate if you are providing emissions data for past reportingyears
Select the number of past reporting years you will be providing emissions datafor
Reportingyear
January 12019
December 312019
No <Not Applicable>
C0.3
(C0.3) Select the countries/areas for which you will be supplying data.AustraliaCanadaFranceGermanyIndiaItalyNetherlandsRussian FederationSingaporeSouth AfricaSpainUnited Arab EmiratesUnited Kingdom of Great Britain and Northern IrelandUnited States of America
C0.4
(C0.4) Select the currency used for all financial information disclosed throughout your response.USD
C0.5
(C0.5) Select the option that describes the reporting boundary for which climate-related impacts on your business are being reported. Note that this option shouldalign with your chosen approach for consolidating your GHG inventory.Operational control
C1. Governance
C1.1
(C1.1) Is there board-level oversight of climate-related issues within your organization?Yes
CDP Page of 461
C1.1a
(C1.1a) Identify the position(s) (do not include any names) of the individual(s) on the board with responsibility for climate-related issues.
Position ofindividual(s)
Please explain
ChiefExecutiveOfficer(CEO)
As the top operational decision-maker and member of the Board of Directors, the CEO has ultimate responsibility for climate-related issues. This reflects the importance that the company gives to thetopic as part of our citizenship and sustainability strategy called the Recipe for Good. A climate related decision that the CEO would be involved is the setting of a strategy such as science-basedtargets. The Audit Committee of the Board of Directors is also updated annually on the Company’s environmental commitments and progress. Within the management structure, the CEO entruststhe Vice President of Global Government Affairs and Sustainability (Chief Sustainability Officer) to drive company strategy relating to climate change. Together they are responsible for: • Leveragingsustainability to promote business growth, drive brand equity and minimize business, social and financial risks of Yum! Brands’ global business enterprise including climate change; • Focusing on thescope of the business model for the entire business enterprise globally (Franchisee and Corporate); • Ensuring Yum! Brands operates efficiently and sustainably to drive shareholder value and brandpositioning. • Updating of the Audit Committee on an annual basis regarding the Company’s environmental commitments and progress on our climate commitments.
C1.1b
(C1.1b) Provide further details on the board’s oversight of climate-related issues.
Frequencywith whichclimate-relatedissues are ascheduledagenda item
Governancemechanismsinto whichclimate-relatedissues areintegrated
Scope ofboard-leveloversight
Please explain
Scheduled –somemeetings
Reviewing andguiding strategyReviewing andguiding majorplans of actionReviewing andguiding riskmanagementpoliciesReviewing andguiding annualbudgetsReviewing andguidingbusiness plansSettingperformanceobjectivesMonitoringimplementationandperformance ofobjectivesOverseeingmajor capitalexpenditures,acquisitions anddivestituresMonitoring andoverseeingprogress againstgoals andtargets foraddressingclimate-relatedissues
<NotApplicable>
Yum! Brands believes that good corporate governance is a critical factor in achieving business success and embraces practices that align with management andshareholder interests. Oversight for environmental, social and governance (ESG) issues ultimately resides with the Yum! Brands Board of Directors, which is briefedthrough its Audit Committee on an annual basis. Issues related to climate change are brought to their attention as warranted and elevated by governance andmanagement mechanisms within the company. Not all climate-related issues are elevated nor do all business actions have material climate-related impact. Historically,the brief has been conducted by our Vice President of Global Government Affairs and Sustainability (Chief Sustainability Officer) and/or General Counsel. Key topics forthe reporting year included setting of our updated sustainability strategy, and reporting progress against goals including our energy and climate targets.
C1.2
(C1.2) Provide the highest management-level position(s) or committee(s) with responsibility for climate-related issues.
Name of the position(s) and/orcommittee(s)
Reporting line Responsibility Coverage ofresponsibility
Frequency of reporting to the board on climate-relatedissues
Chief Sustainability Officer (CSO) <NotApplicable>
Both assessing and managing climate-related risks andopportunities
<Not Applicable> Annually
C1.2a
CDP Page of 462
(C1.2a) Describe where in the organizational structure this/these position(s) and/or committees lie, what their associated responsibilities are, and how climate-related issues are monitored (do not include the names of individuals).
The Vice President of Global Government Affairs and Sustainability (Chief Sustainability Officer) is responsible for leading the execution of the ESG strategy, includingclimate-related issues. Oversight of climate-related issues falls within this individual’s responsibilities to ensure centralized alignment and execution of our strategy, includingcollaboration with other position(s) and/or committees, as appropriate. This position reports to the Global Chief Communications and Public Affairs Officer and ultimately to theChief Executive Officer and chairs our ESG Council which consists of senior leaders across the company including:
• Vice President, Supply Chain
• Chief Food Safety Officer
• Chief Food Innovation Officer
• Chief Transformation & People Officer
• General Counsel/Associate General Counsel
• Chief Equity & Inclusion Officer
• Chief Development Office
Oversight for environmental, social and governance (ESG) issues ultimately resides with the Yum! Brands Board of Directors, which is briefed through its Audit Committee onan annual basis. The brief, on behalf of the ESG Council, typically is performed by our Vice President of Global Government Affairs and Sustainability (Chief SustainabilityOfficer) and/or General Counsel. In support of climate-related issues the team of the Vice President of Global Government Affairs and Sustainability (Chief SustainabilityOfficer) conducts an annual survey of the company to assess progress made. Climate related risks, opportunities, trends are monitored, and if appropriate issues areelevated for further discussion.
Additional duties of the Vice President of Global Government Affairs and Sustainability (Chief Sustainability Officer) include the representation of sustainability issues, such asclimate change, on the Yum! Risk Committee. This senior level committee is responsible for the evaluation and reporting (as appropriate) of possible corporate risk to theAudit Committee of the Board of Directors for inclusion in our public filings. This committee, which looks at short, medium- and long-term risks, prioritizes risks based on anumber of factors that impact the business including, but not limited to, financial, operational and reputational factors. More specifically, the size and scope of the potentialimpact are considered as are the possible duration, and whether the impact is likely to be a one-time occurrence or recurring in nature. The effect of the risk on businessstrategy given the risks and opportunities in both the short and long term is then considered.
Our global citizenship and sustainability strategy reflects Yum! Brands’ priorities for socially responsible growth, risk management and sustainable stewardship of our food,planet and people. We call it our Recipe for Good.
C1.3
(C1.3) Do you provide incentives for the management of climate-related issues, including the attainment of targets?
Provide incentives for themanagement of climate-relatedissues
Comment
Row1
Yes Incentives for management of climate-related issues are incorporated into the renumeration structure at different levels of the organization to promote performance andachievement of our Recipe for Good. These include the Vice President of Global Government Affairs and Sustainability (Chief Sustainability Officer) and the environmentalmanagers.
C1.3a
CDP Page of 463
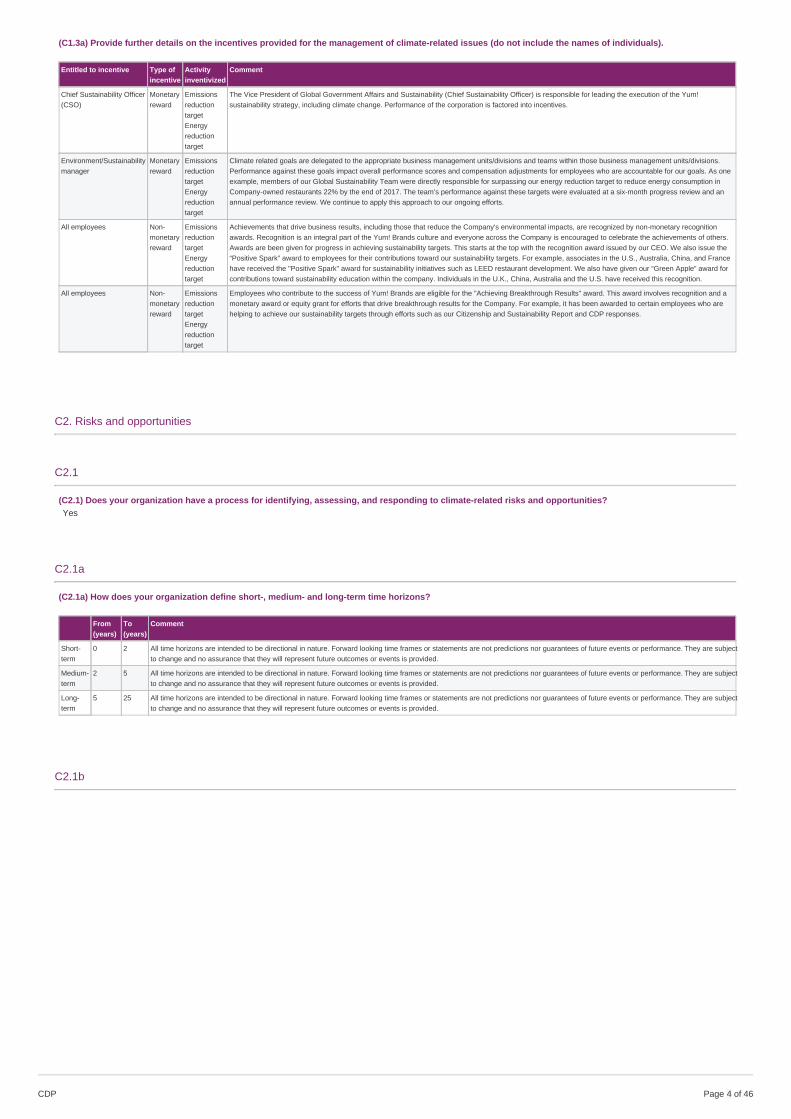
(C1.3a) Provide further details on the incentives provided for the management of climate-related issues (do not include the names of individuals).
Entitled to incentive Type ofincentive
Activityinventivized
Comment
Chief Sustainability Officer(CSO)
Monetaryreward
EmissionsreductiontargetEnergyreductiontarget
The Vice President of Global Government Affairs and Sustainability (Chief Sustainability Officer) is responsible for leading the execution of the Yum!sustainability strategy, including climate change. Performance of the corporation is factored into incentives.
Environment/Sustainabilitymanager
Monetaryreward
EmissionsreductiontargetEnergyreductiontarget
Climate related goals are delegated to the appropriate business management units/divisions and teams within those business management units/divisions.Performance against these goals impact overall performance scores and compensation adjustments for employees who are accountable for our goals. As oneexample, members of our Global Sustainability Team were directly responsible for surpassing our energy reduction target to reduce energy consumption inCompany-owned restaurants 22% by the end of 2017. The team’s performance against these targets were evaluated at a six-month progress review and anannual performance review. We continue to apply this approach to our ongoing efforts.
All employees Non-monetaryreward
EmissionsreductiontargetEnergyreductiontarget
Achievements that drive business results, including those that reduce the Company's environmental impacts, are recognized by non-monetary recognitionawards. Recognition is an integral part of the Yum! Brands culture and everyone across the Company is encouraged to celebrate the achievements of others.Awards are been given for progress in achieving sustainability targets. This starts at the top with the recognition award issued by our CEO. We also issue the“Positive Spark” award to employees for their contributions toward our sustainability targets. For example, associates in the U.S., Australia, China, and Francehave received the "Positive Spark" award for sustainability initiatives such as LEED restaurant development. We also have given our “Green Apple” award forcontributions toward sustainability education within the company. Individuals in the U.K., China, Australia and the U.S. have received this recognition.
All employees Non-monetaryreward
EmissionsreductiontargetEnergyreductiontarget
Employees who contribute to the success of Yum! Brands are eligible for the "Achieving Breakthrough Results" award. This award involves recognition and amonetary award or equity grant for efforts that drive breakthrough results for the Company. For example, it has been awarded to certain employees who arehelping to achieve our sustainability targets through efforts such as our Citizenship and Sustainability Report and CDP responses.
C2. Risks and opportunities
C2.1
(C2.1) Does your organization have a process for identifying, assessing, and responding to climate-related risks and opportunities?Yes
C2.1a
(C2.1a) How does your organization define short-, medium- and long-term time horizons?
From(years)
To(years)
Comment
Short-term
0 2 All time horizons are intended to be directional in nature. Forward looking time frames or statements are not predictions nor guarantees of future events or performance. They are subjectto change and no assurance that they will represent future outcomes or events is provided.
Medium-term
2 5 All time horizons are intended to be directional in nature. Forward looking time frames or statements are not predictions nor guarantees of future events or performance. They are subjectto change and no assurance that they will represent future outcomes or events is provided.
Long-term
5 25 All time horizons are intended to be directional in nature. Forward looking time frames or statements are not predictions nor guarantees of future events or performance. They are subjectto change and no assurance that they will represent future outcomes or events is provided.
C2.1b
CDP Page of 464
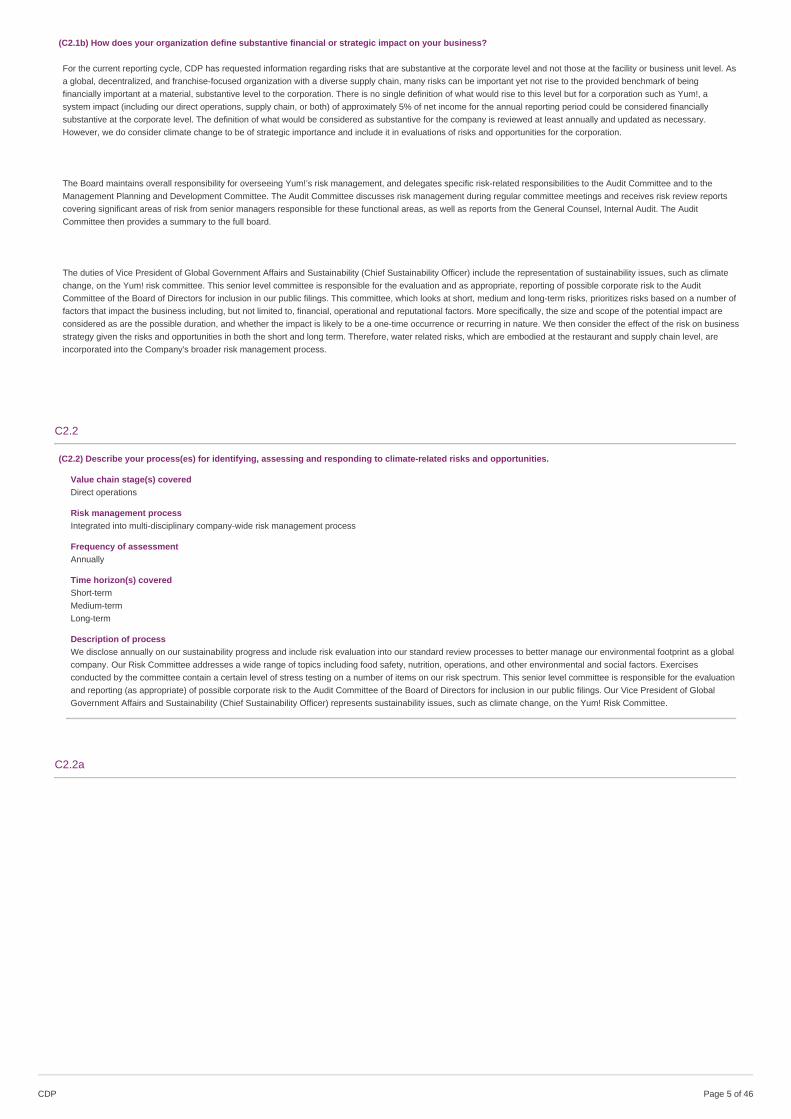
(C2.1b) How does your organization define substantive financial or strategic impact on your business?
For the current reporting cycle, CDP has requested information regarding risks that are substantive at the corporate level and not those at the facility or business unit level. Asa global, decentralized, and franchise-focused organization with a diverse supply chain, many risks can be important yet not rise to the provided benchmark of beingfinancially important at a material, substantive level to the corporation. There is no single definition of what would rise to this level but for a corporation such as Yum!, asystem impact (including our direct operations, supply chain, or both) of approximately 5% of net income for the annual reporting period could be considered financiallysubstantive at the corporate level. The definition of what would be considered as substantive for the company is reviewed at least annually and updated as necessary.However, we do consider climate change to be of strategic importance and include it in evaluations of risks and opportunities for the corporation.
The Board maintains overall responsibility for overseeing Yum!’s risk management, and delegates specific risk-related responsibilities to the Audit Committee and to theManagement Planning and Development Committee. The Audit Committee discusses risk management during regular committee meetings and receives risk review reportscovering significant areas of risk from senior managers responsible for these functional areas, as well as reports from the General Counsel, Internal Audit. The AuditCommittee then provides a summary to the full board.
The duties of Vice President of Global Government Affairs and Sustainability (Chief Sustainability Officer) include the representation of sustainability issues, such as climatechange, on the Yum! risk committee. This senior level committee is responsible for the evaluation and as appropriate, reporting of possible corporate risk to the AuditCommittee of the Board of Directors for inclusion in our public filings. This committee, which looks at short, medium and long-term risks, prioritizes risks based on a number offactors that impact the business including, but not limited to, financial, operational and reputational factors. More specifically, the size and scope of the potential impact areconsidered as are the possible duration, and whether the impact is likely to be a one-time occurrence or recurring in nature. We then consider the effect of the risk on businessstrategy given the risks and opportunities in both the short and long term. Therefore, water related risks, which are embodied at the restaurant and supply chain level, areincorporated into the Company's broader risk management process.
C2.2
(C2.2) Describe your process(es) for identifying, assessing and responding to climate-related risks and opportunities.
Value chain stage(s) coveredDirect operations
Risk management processIntegrated into multi-disciplinary company-wide risk management process
Frequency of assessmentAnnually
Time horizon(s) coveredShort-termMedium-termLong-term
Description of processWe disclose annually on our sustainability progress and include risk evaluation into our standard review processes to better manage our environmental footprint as a globalcompany. Our Risk Committee addresses a wide range of topics including food safety, nutrition, operations, and other environmental and social factors. Exercisesconducted by the committee contain a certain level of stress testing on a number of items on our risk spectrum. This senior level committee is responsible for the evaluationand reporting (as appropriate) of possible corporate risk to the Audit Committee of the Board of Directors for inclusion in our public filings. Our Vice President of GlobalGovernment Affairs and Sustainability (Chief Sustainability Officer) represents sustainability issues, such as climate change, on the Yum! Risk Committee.
C2.2a
CDP Page of 465
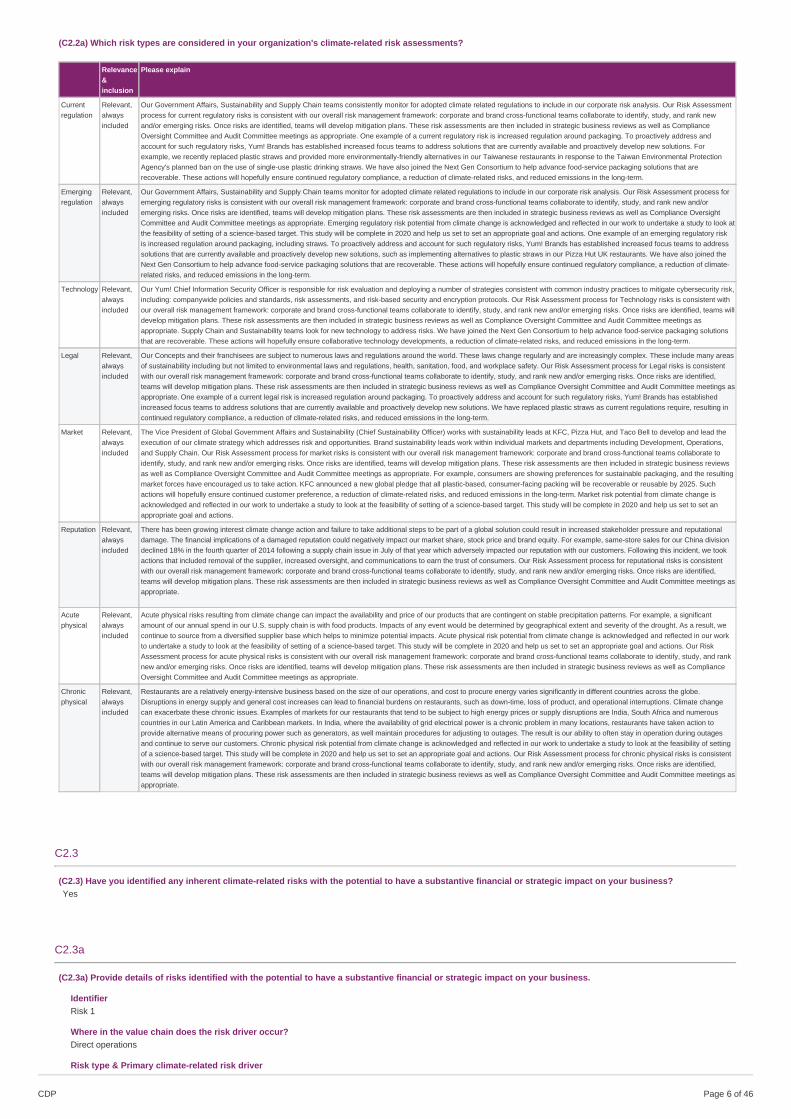
(C2.2a) Which risk types are considered in your organization's climate-related risk assessments?
Relevance&inclusion
Please explain
Currentregulation
Relevant,alwaysincluded
Our Government Affairs, Sustainability and Supply Chain teams consistently monitor for adopted climate related regulations to include in our corporate risk analysis. Our Risk Assessmentprocess for current regulatory risks is consistent with our overall risk management framework: corporate and brand cross-functional teams collaborate to identify, study, and rank newand/or emerging risks. Once risks are identified, teams will develop mitigation plans. These risk assessments are then included in strategic business reviews as well as ComplianceOversight Committee and Audit Committee meetings as appropriate. One example of a current regulatory risk is increased regulation around packaging. To proactively address andaccount for such regulatory risks, Yum! Brands has established increased focus teams to address solutions that are currently available and proactively develop new solutions. Forexample, we recently replaced plastic straws and provided more environmentally-friendly alternatives in our Taiwanese restaurants in response to the Taiwan Environmental ProtectionAgency's planned ban on the use of single-use plastic drinking straws. We have also joined the Next Gen Consortium to help advance food-service packaging solutions that arerecoverable. These actions will hopefully ensure continued regulatory compliance, a reduction of climate-related risks, and reduced emissions in the long-term.
Emergingregulation
Relevant,alwaysincluded
Our Government Affairs, Sustainability and Supply Chain teams monitor for adopted climate related regulations to include in our corporate risk analysis. Our Risk Assessment process foremerging regulatory risks is consistent with our overall risk management framework: corporate and brand cross-functional teams collaborate to identify, study, and rank new and/oremerging risks. Once risks are identified, teams will develop mitigation plans. These risk assessments are then included in strategic business reviews as well as Compliance OversightCommittee and Audit Committee meetings as appropriate. Emerging regulatory risk potential from climate change is acknowledged and reflected in our work to undertake a study to look atthe feasibility of setting of a science-based target. This study will be complete in 2020 and help us set to set an appropriate goal and actions. One example of an emerging regulatory riskis increased regulation around packaging, including straws. To proactively address and account for such regulatory risks, Yum! Brands has established increased focus teams to addresssolutions that are currently available and proactively develop new solutions, such as implementing alternatives to plastic straws in our Pizza Hut UK restaurants. We have also joined theNext Gen Consortium to help advance food-service packaging solutions that are recoverable. These actions will hopefully ensure continued regulatory compliance, a reduction of climate-related risks, and reduced emissions in the long-term.
Technology Relevant,alwaysincluded
Our Yum! Chief Information Security Officer is responsible for risk evaluation and deploying a number of strategies consistent with common industry practices to mitigate cybersecurity risk,including: companywide policies and standards, risk assessments, and risk-based security and encryption protocols. Our Risk Assessment process for Technology risks is consistent withour overall risk management framework: corporate and brand cross-functional teams collaborate to identify, study, and rank new and/or emerging risks. Once risks are identified, teams willdevelop mitigation plans. These risk assessments are then included in strategic business reviews as well as Compliance Oversight Committee and Audit Committee meetings asappropriate. Supply Chain and Sustainability teams look for new technology to address risks. We have joined the Next Gen Consortium to help advance food-service packaging solutionsthat are recoverable. These actions will hopefully ensure collaborative technology developments, a reduction of climate-related risks, and reduced emissions in the long-term.
Legal Relevant,alwaysincluded
Our Concepts and their franchisees are subject to numerous laws and regulations around the world. These laws change regularly and are increasingly complex. These include many areasof sustainability including but not limited to environmental laws and regulations, health, sanitation, food, and workplace safety. Our Risk Assessment process for Legal risks is consistentwith our overall risk management framework: corporate and brand cross-functional teams collaborate to identify, study, and rank new and/or emerging risks. Once risks are identified,teams will develop mitigation plans. These risk assessments are then included in strategic business reviews as well as Compliance Oversight Committee and Audit Committee meetings asappropriate. One example of a current legal risk is increased regulation around packaging. To proactively address and account for such regulatory risks, Yum! Brands has establishedincreased focus teams to address solutions that are currently available and proactively develop new solutions. We have replaced plastic straws as current regulations require, resulting incontinued regulatory compliance, a reduction of climate-related risks, and reduced emissions in the long-term.
Market Relevant,alwaysincluded
The Vice President of Global Government Affairs and Sustainability (Chief Sustainability Officer) works with sustainability leads at KFC, Pizza Hut, and Taco Bell to develop and lead theexecution of our climate strategy which addresses risk and opportunities. Brand sustainability leads work within individual markets and departments including Development, Operations,and Supply Chain. Our Risk Assessment process for market risks is consistent with our overall risk management framework: corporate and brand cross-functional teams collaborate toidentify, study, and rank new and/or emerging risks. Once risks are identified, teams will develop mitigation plans. These risk assessments are then included in strategic business reviewsas well as Compliance Oversight Committee and Audit Committee meetings as appropriate. For example, consumers are showing preferences for sustainable packaging, and the resultingmarket forces have encouraged us to take action. KFC announced a new global pledge that all plastic-based, consumer-facing packing will be recoverable or reusable by 2025. Suchactions will hopefully ensure continued customer preference, a reduction of climate-related risks, and reduced emissions in the long-term. Market risk potential from climate change isacknowledged and reflected in our work to undertake a study to look at the feasibility of setting of a science-based target. This study will be complete in 2020 and help us set to set anappropriate goal and actions.
Reputation Relevant,alwaysincluded
There has been growing interest climate change action and failure to take additional steps to be part of a global solution could result in increased stakeholder pressure and reputationaldamage. The financial implications of a damaged reputation could negatively impact our market share, stock price and brand equity. For example, same-store sales for our China divisiondeclined 18% in the fourth quarter of 2014 following a supply chain issue in July of that year which adversely impacted our reputation with our customers. Following this incident, we tookactions that included removal of the supplier, increased oversight, and communications to earn the trust of consumers. Our Risk Assessment process for reputational risks is consistentwith our overall risk management framework: corporate and brand cross-functional teams collaborate to identify, study, and rank new and/or emerging risks. Once risks are identified,teams will develop mitigation plans. These risk assessments are then included in strategic business reviews as well as Compliance Oversight Committee and Audit Committee meetings asappropriate.
Acutephysical
Relevant,alwaysincluded
Acute physical risks resulting from climate change can impact the availability and price of our products that are contingent on stable precipitation patterns. For example, a significantamount of our annual spend in our U.S. supply chain is with food products. Impacts of any event would be determined by geographical extent and severity of the drought. As a result, wecontinue to source from a diversified supplier base which helps to minimize potential impacts. Acute physical risk potential from climate change is acknowledged and reflected in our workto undertake a study to look at the feasibility of setting of a science-based target. This study will be complete in 2020 and help us set to set an appropriate goal and actions. Our RiskAssessment process for acute physical risks is consistent with our overall risk management framework: corporate and brand cross-functional teams collaborate to identify, study, and ranknew and/or emerging risks. Once risks are identified, teams will develop mitigation plans. These risk assessments are then included in strategic business reviews as well as ComplianceOversight Committee and Audit Committee meetings as appropriate.
Chronicphysical
Relevant,alwaysincluded
Restaurants are a relatively energy-intensive business based on the size of our operations, and cost to procure energy varies significantly in different countries across the globe.Disruptions in energy supply and general cost increases can lead to financial burdens on restaurants, such as down-time, loss of product, and operational interruptions. Climate changecan exacerbate these chronic issues. Examples of markets for our restaurants that tend to be subject to high energy prices or supply disruptions are India, South Africa and numerouscountries in our Latin America and Caribbean markets. In India, where the availability of grid electrical power is a chronic problem in many locations, restaurants have taken action toprovide alternative means of procuring power such as generators, as well maintain procedures for adjusting to outages. The result is our ability to often stay in operation during outagesand continue to serve our customers. Chronic physical risk potential from climate change is acknowledged and reflected in our work to undertake a study to look at the feasibility of settingof a science-based target. This study will be complete in 2020 and help us set to set an appropriate goal and actions. Our Risk Assessment process for chronic physical risks is consistentwith our overall risk management framework: corporate and brand cross-functional teams collaborate to identify, study, and rank new and/or emerging risks. Once risks are identified,teams will develop mitigation plans. These risk assessments are then included in strategic business reviews as well as Compliance Oversight Committee and Audit Committee meetings asappropriate.
C2.3
(C2.3) Have you identified any inherent climate-related risks with the potential to have a substantive financial or strategic impact on your business?Yes
C2.3a
(C2.3a) Provide details of risks identified with the potential to have a substantive financial or strategic impact on your business.
IdentifierRisk 1
Where in the value chain does the risk driver occur?Direct operations
Risk type & Primary climate-related risk driver
CDP Page of 466
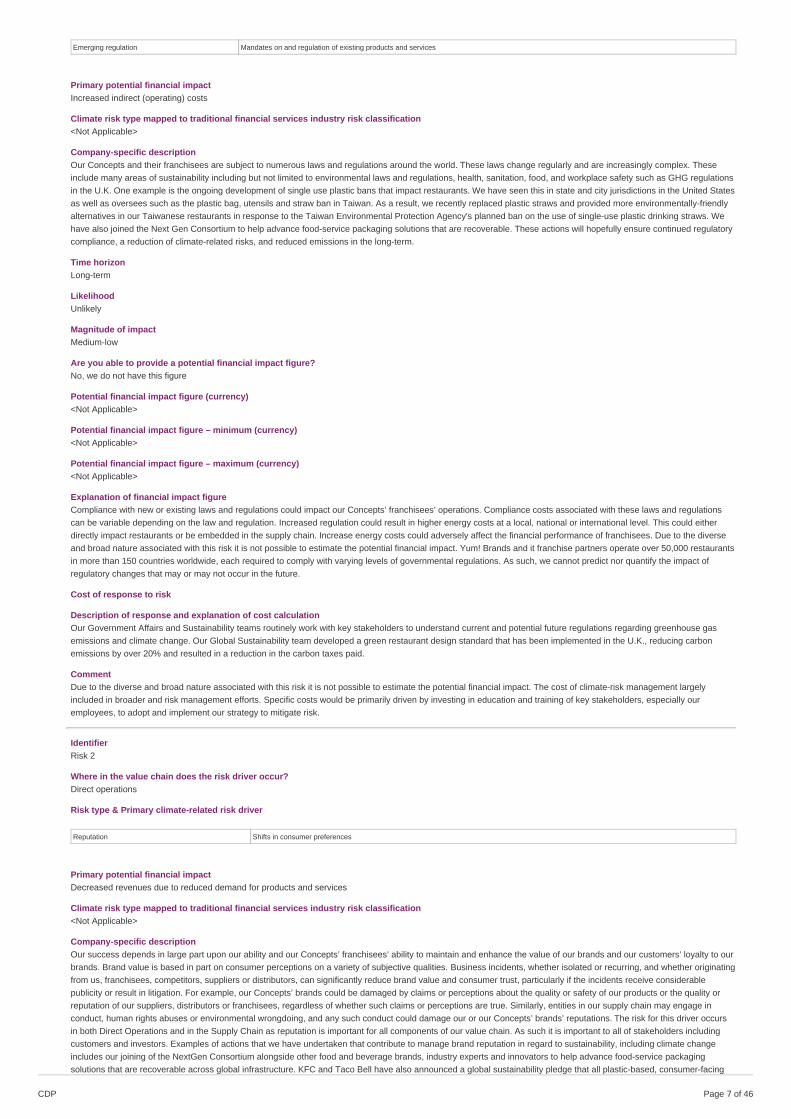
Emerging regulation Mandates on and regulation of existing products and services
Primary potential financial impactIncreased indirect (operating) costs
Climate risk type mapped to traditional financial services industry risk classification<Not Applicable>
Company-specific descriptionOur Concepts and their franchisees are subject to numerous laws and regulations around the world. These laws change regularly and are increasingly complex. Theseinclude many areas of sustainability including but not limited to environmental laws and regulations, health, sanitation, food, and workplace safety such as GHG regulationsin the U.K. One example is the ongoing development of single use plastic bans that impact restaurants. We have seen this in state and city jurisdictions in the United Statesas well as oversees such as the plastic bag, utensils and straw ban in Taiwan. As a result, we recently replaced plastic straws and provided more environmentally-friendlyalternatives in our Taiwanese restaurants in response to the Taiwan Environmental Protection Agency's planned ban on the use of single-use plastic drinking straws. Wehave also joined the Next Gen Consortium to help advance food-service packaging solutions that are recoverable. These actions will hopefully ensure continued regulatorycompliance, a reduction of climate-related risks, and reduced emissions in the long-term.
Time horizonLong-term
LikelihoodUnlikely
Magnitude of impactMedium-low
Are you able to provide a potential financial impact figure?No, we do not have this figure
Potential financial impact figure (currency)<Not Applicable>
Potential financial impact figure – minimum (currency)<Not Applicable>
Potential financial impact figure – maximum (currency)<Not Applicable>
Explanation of financial impact figureCompliance with new or existing laws and regulations could impact our Concepts’ franchisees’ operations. Compliance costs associated with these laws and regulationscan be variable depending on the law and regulation. Increased regulation could result in higher energy costs at a local, national or international level. This could eitherdirectly impact restaurants or be embedded in the supply chain. Increase energy costs could adversely affect the financial performance of franchisees. Due to the diverseand broad nature associated with this risk it is not possible to estimate the potential financial impact. Yum! Brands and it franchise partners operate over 50,000 restaurantsin more than 150 countries worldwide, each required to comply with varying levels of governmental regulations. As such, we cannot predict nor quantify the impact ofregulatory changes that may or may not occur in the future.
Cost of response to risk
Description of response and explanation of cost calculationOur Government Affairs and Sustainability teams routinely work with key stakeholders to understand current and potential future regulations regarding greenhouse gasemissions and climate change. Our Global Sustainability team developed a green restaurant design standard that has been implemented in the U.K., reducing carbonemissions by over 20% and resulted in a reduction in the carbon taxes paid.
CommentDue to the diverse and broad nature associated with this risk it is not possible to estimate the potential financial impact. The cost of climate-risk management largelyincluded in broader and risk management efforts. Specific costs would be primarily driven by investing in education and training of key stakeholders, especially ouremployees, to adopt and implement our strategy to mitigate risk.
IdentifierRisk 2
Where in the value chain does the risk driver occur?Direct operations
Risk type & Primary climate-related risk driver
Reputation Shifts in consumer preferences
Primary potential financial impactDecreased revenues due to reduced demand for products and services
Climate risk type mapped to traditional financial services industry risk classification<Not Applicable>
Company-specific descriptionOur success depends in large part upon our ability and our Concepts’ franchisees’ ability to maintain and enhance the value of our brands and our customers’ loyalty to ourbrands. Brand value is based in part on consumer perceptions on a variety of subjective qualities. Business incidents, whether isolated or recurring, and whether originatingfrom us, franchisees, competitors, suppliers or distributors, can significantly reduce brand value and consumer trust, particularly if the incidents receive considerablepublicity or result in litigation. For example, our Concepts’ brands could be damaged by claims or perceptions about the quality or safety of our products or the quality orreputation of our suppliers, distributors or franchisees, regardless of whether such claims or perceptions are true. Similarly, entities in our supply chain may engage inconduct, human rights abuses or environmental wrongdoing, and any such conduct could damage our or our Concepts’ brands’ reputations. The risk for this driver occursin both Direct Operations and in the Supply Chain as reputation is important for all components of our value chain. As such it is important to all of stakeholders includingcustomers and investors. Examples of actions that we have undertaken that contribute to manage brand reputation in regard to sustainability, including climate changeincludes our joining of the NextGen Consortium alongside other food and beverage brands, industry experts and innovators to help advance food-service packagingsolutions that are recoverable across global infrastructure. KFC and Taco Bell have also announced a global sustainability pledge that all plastic-based, consumer-facing
CDP Page of 467
packaging will be recoverable or reusable by 2025.
Time horizonLong-term
LikelihoodUnlikely
Magnitude of impactMedium-low
Are you able to provide a potential financial impact figure?No, we do not have this figure
Potential financial impact figure (currency)<Not Applicable>
Potential financial impact figure – minimum (currency)<Not Applicable>
Potential financial impact figure – maximum (currency)<Not Applicable>
Explanation of financial impact figureThe financial implications of a damaged reputation could negatively impact our market share, stock price and brand equity. For example, same-store sales for our Chinadivision declined 18% in the fourth quarter of 2014 following a supply chain issue in July of that year which adversely impacted our reputation with our customers. Due tothe diverse and broad nature associated with this risk it is not possible to estimate the potential financial impact. Yum! Brands and it franchise partners operate over 50,000restaurants in more than 150 countries worldwide, each required to comply with varying levels of governmental regulations. As such, we cannot predict nor quantify theimpact of regulatory changes that may or may not occur in the future.
Cost of response to risk
Description of response and explanation of cost calculationOur brands put choice and consumer preferences at the forefront of their work. Taco Bell has a robust offering on non-beef-based menu items, including vegetarian, thatprovides consumer options. They are making vegetarian options easier to access with “Veggie Mode”, a single-swipe feature that instantly transforms the menu on self-service kiosks in the U.S. to show only vegetation items. Our brands also continue to explore sustainable test meat substitutes. Taco Bell, our leader in beef volume, is alsoour leader in beef substitutes with menu items such as the “Oatrageous Taco” which is sold in Europe. We have resources including our Vice President of GlobalGovernment Affairs and Sustainability (Chief Sustainability Officer), Chief Communications and Public Affairs Officer as well as General Counsel to actively monitor andengage in this area. Brand teams are focused on building three iconic brands people trust and champion. To deliver this commitment to our consumers, our teams focus ondeveloping great-tasting product options at affordable prices built on our rigorous quality and safety standards. Oversight for environmental, social and governance (ESG)issues ultimately resides with the Yum! Brands Board of Directors, which is briefed through its Audit Committee on an annual basis. The brief typically is performed by ourGeneral Counsel and/or our Vice President of Global Government Affairs and Sustainability (Chief Sustainability Officer). We proactively communicate the Companyposition on being good corporate stewards through our Citizenship and Sustainability Report and other public disclosures such as CDP. For example, when launching wehave held multiple Twitter Chats through a third-party media company called Triple Pundit to share our progress against key environmental goals to engaged stakeholdersto demonstrate our commitment to transparency and maintaining a positive brand position.
CommentDue to the diverse and broad nature associated with this risk it is not possible to estimate the potential financial impact. The cost of climate-risk management largelyincluded in broader and risk management efforts. Specific costs are primarily driven by investing in education and training of key stakeholders, especially our employees, toadopt and implement our strategy to mitigate risk.
IdentifierRisk 3
Where in the value chain does the risk driver occur?Upstream
Risk type & Primary climate-related risk driver
Acute physical Increased severity and frequency of extreme weather events such as cyclones and floods
Primary potential financial impactIncreased indirect (operating) costs
Climate risk type mapped to traditional financial services industry risk classification<Not Applicable>
Company-specific descriptionThe products sold by our Concepts and their franchisees are sourced from a wide variety of domestic and international suppliers. We, along with our Concepts’ franchisees,are also dependent upon third parties to make frequent deliveries of food products and supplies that meet our specifications at competitive prices. A shortage or interruptionin the availability of certain food products or supplies could increase costs and limit the availability of products critical to restaurant operations, which in turn could lead torestaurant closures and/or a decrease in sales. This risk can impact the availability and price of our products that are contingent on stable precipitation patterns. Our abilityto source from a diversified supplier base helps to minimize potential impacts. Shortages or interruptions in the supply of food items and other supplies to our Concepts’restaurants could adversely affect the availability, quality and cost of items we use and the operations of our restaurants. Such shortages or disruptions could be caused byinclement weather, natural disasters, other a variety of other issues. An example, although not related to an extreme weather event was when in 2018 our KFC UKrestaurants temporarily experienced shortages of chicken due to issues with a delivery partner. As a result, our supply chain group monitors potential shortages and/orinterruptions so that alternative supply sources can be obtained if needed. An advantage of our global supply chain is the ability to adapt to localized shortages and/orinterruptions.
Time horizonLong-term
LikelihoodUnlikely
Magnitude of impact
CDP Page of 468
Medium-low
Are you able to provide a potential financial impact figure?No, we do not have this figure
Potential financial impact figure (currency)<Not Applicable>
Potential financial impact figure – minimum (currency)<Not Applicable>
Potential financial impact figure – maximum (currency)<Not Applicable>
Explanation of financial impact figureA shortage or interruption in the availability of certain food products or supplies could increase costs and limit the availability of products critical to restaurant operations,which in turn could lead to restaurant closures and/or a decrease in sales. This risk can impact the availability and price of our products that are contingent on stableprecipitation patterns. Our ability to source from a diversified supplier base helps to minimize potential impacts. Due to the diverse and broad nature associated with this riskit is not possible to estimate the potential financial impact. Yum! Brands and its franchise partners operate over 50,000 restaurants in more than 150 countries worldwide,each required to comply with varying levels of governmental regulations. As such, we cannot predict nor quantify the impact of regulatory changes that may or may notoccur in the future.
Cost of response to risk
Description of response and explanation of cost calculationWe continually work to maintain a diverse supply chain and positive relationships with supply chain partners by proactively establishing mitigation practices that includemenu management and portfolio diversification. This minimizes the impacts on any one part of a country or distribution system due to changes in physical climateparameters. We continually evaluate the impact climate change has on our business and understand that as a large food retailer, changes in precipitation extremes havethe potential to influence the price, quality and supply of materials in targeted regions.
CommentDue to the diverse and broad nature associated with this risk it is not possible to estimate the potential financial impact. The cost of climate-risk management largelyincluded in broader and risk management efforts. Specific costs are primarily driven by investing in education and training of key stakeholders, especially our employees, toadopt and implement our strategy to mitigate risk.
IdentifierRisk 4
Where in the value chain does the risk driver occur?Upstream
Risk type & Primary climate-related risk driver
Chronic physical Changes in precipitation patterns and extreme variability in weather patterns
Primary potential financial impactIncreased indirect (operating) costs
Climate risk type mapped to traditional financial services industry risk classification<Not Applicable>
Company-specific descriptionOur and our Concepts’ franchisees’ businesses depend on reliable sources of large quantities of raw materials such as proteins (including poultry, pork, beef and seafood),cheese, oil, flour and vegetables (including potatoes and lettuce). Raw materials purchased for use in our Concepts’ restaurants are subject to price volatility caused by anyfluctuation in aggregate supply and demand, or other external conditions. Our supply chain group monitors potential adverse cost factors so that alternative supply sourcescan be obtained if needed. An advantage of our global supply chain is the ability to adapt to better adapt to localized fluctuations.
Time horizonLong-term
LikelihoodUnlikely
Magnitude of impactMedium-low
Are you able to provide a potential financial impact figure?No, we do not have this figure
Potential financial impact figure (currency)<Not Applicable>
Potential financial impact figure – minimum (currency)<Not Applicable>
Potential financial impact figure – maximum (currency)<Not Applicable>
Explanation of financial impact figureHistorical prices of raw materials used in the operations of our Concepts’ restaurants have fluctuated for a variety of reasons. We cannot provide assurance that ourConcepts’ franchisees will continue to be able to purchase raw materials at reasonable prices, or that the cost of raw materials will remain stable in the future. If we and ourConcepts’ franchisees are unable to manage the cost of raw materials or to increase the prices of products proportionately, our and our franchisees’ profit margins may beadversely impacted. Due to the diverse and broad nature associated with this risk, it is not possible to estimate the potential financial impact. Yum! Brands and its franchisepartners operate over 50,000 restaurants in more than 150 countries worldwide, each required to comply with varying levels of governmental regulations. As such, wecannot predict nor quantify the impact of regulatory changes that may or may not occur in the future.
Cost of response to risk
CDP Page of 469
Description of response and explanation of cost calculationWe work continually to maintain a diverse supply chain and positive relationships with supply chain partners by proactively establishing mitigation practices that includemenu management and portfolio diversification. This minimizes the impacts on any one part of a country or distribution system due to changes in physical climateparameters. We continually evaluate the impact climate change has on our business and understand that as a large food retailer, changes in precipitation extremes havethe potential to influence the price, quality and supply of materials in targeted regions.
CommentDue to the diverse and broad nature associated with this risk it is not possible to estimate the potential financial impact. The cost of climate-risk management largelyincluded in broader and risk management efforts. Specific costs are primarily driven by investing in education and training of key stakeholders, especially our employees, toadopt and implement our strategy to mitigate risk.
IdentifierRisk 5
Where in the value chain does the risk driver occur?Direct operations
Risk type & Primary climate-related risk driver
Market Increased cost of raw materials
Primary potential financial impactIncreased indirect (operating) costs
Climate risk type mapped to traditional financial services industry risk classification<Not Applicable>
Company-specific descriptionRestaurants are a relatively energy intensive business based on the size of our operations. Cost to procure energy vary significantly in different countries across the globe.Disruptions in supply and general cost increases can lead to financial burdens on restaurants. Examples of markets for our restaurants that tend to be subject to high pricesor supply disruptions are India, South Africa and numerous counties in our Latin America and Caribbean market. Although these impacts are acute at one scale they tend tobe widespread and persistent.
Time horizonLong-term
LikelihoodUnlikely
Magnitude of impactLow
Are you able to provide a potential financial impact figure?No, we do not have this figure
Potential financial impact figure (currency)<Not Applicable>
Potential financial impact figure – minimum (currency)<Not Applicable>
Potential financial impact figure – maximum (currency)<Not Applicable>
Explanation of financial impact figureAn increase in operational costs from a variety of factors (including energy) could adversely affect our operating results. Given the franchise nature of our business,increased costs would more directly impact franchisees and therefore remains a risk for our organization. Increased energy costs for the supply chain could also adverselyaffect operation results. For example, a significant increase in gasoline prices could result in the imposition of fuel surcharges by our distributors. Due to the diverse andbroad nature associated with this risk it is not possible to estimate the potential financial impact. Yum! Brands and its franchise partners operate over 50000 restaurants inmore than 150 countries worldwide, each required to comply with varying levels of governmental regulations. As such, we cannot predict nor quantify the impact ofregulatory changes that may or may not occur in the future.
Cost of response to risk
Description of response and explanation of cost calculationContinue to monitor policy closely and its impact on our business, while continuing to manage sustainability impacts that are most material to our supply chain. Oneexample is that our purchasing co-op in the U.S. actively manages electricity contracts in deregulated markets to secure competitively priced sources of power.
CommentDue to the diverse and broad nature associated with this risk it is not possible to estimate the potential financial impact. The cost of climate-risk management largelyincluded in broader and risk management efforts. Specific costs are primarily driven by investing in education and training of key stakeholders, especially our employees, toadopt and implement our strategy to mitigate risk.
IdentifierRisk 6
Where in the value chain does the risk driver occur?Direct operations
Risk type & Primary climate-related risk driver
Market Other, please specify (Health concerns arising from outbreaks of viruses or other diseases)
Primary potential financial impactDecreased revenues due to reduced demand for products and services
CDP Page of 4610
Climate risk type mapped to traditional financial services industry risk classification<Not Applicable>
Company-specific descriptionWhile many factors contribute to disease outbreaks, it has been reported that changes in global climate can bring about the spread of diseases into new, previouslyimpacted areas. Our business could be materially and adversely affected by the outbreak of a widespread health epidemic, including various strains of avian flu or swine flu,such as H1N1. The occurrence of such an outbreak of an epidemic, illness or other adverse public health developments could materially disrupt our business andoperations. Such events could also significantly impact our industry and cause a temporary closure of restaurants, which would severely disrupt our operations and have amaterial adverse effect on our business, financial condition and results of operations.
Time horizonLong-term
LikelihoodVery likely
Magnitude of impactHigh
Are you able to provide a potential financial impact figure?No, we do not have this figure
Potential financial impact figure (currency)<Not Applicable>
Potential financial impact figure – minimum (currency)<Not Applicable>
Potential financial impact figure – maximum (currency)<Not Applicable>
Explanation of financial impact figureAlthough not currently proven to be linked to climate-change, the COIVD-19 pandemic provides case study. As a result of the ongoing pandemic at the end of Q2 2020experienced a quarterly decline of system sales of 12%. At the peak in mid-April, Yum! experienced temporary closures of 11,000 restaurants. This reflects past statementsthat operations and supply chains can be disrupted as the result of human and animal illnesses. Outbreaks of avian flu occur sporadically around the world, includingconfirmed human cases. Public concern over avian flu may cause fear about the consumption of chicken, eggs and other products derived from poultry, which could causecustomers to consume less of our products. Outbreaks could also adversely affect the price and availability of poultry, which could negatively impact our profit margins andrevenues. We could also be adversely affected if governments impose mandatory closures, seek voluntary closures or impose restrictions on operations of restaurants. Dueto the diverse and broad nature associated with this risk, it is not possible to estimate the potential financial impact.
Cost of response to risk
Description of response and explanation of cost calculationOur brands have adapted to the COVID-19 pandemic with remarkable agility to promote employee and customer safety as well as to leverage digitally enabled off-sitecapabilities to adjust operations and provide food. As we continue to reopen our restaurants across the globe, we remain focused on our Recipe for Growth and Goodstrategy and on ensuring customers can access our delicious food in a safe, low-contact manner with outstanding value. Leveraging our scale and capabilities as theworld’s largest restaurant company, our four iconic brands are optimally positioned to drive profitable system sales growth in the new customer environment. Food safetystarts with our leadership and cascades to our franchise partners and restaurant employees. Our approach is a holistic one, ensuring that food safety is considered at everystep along the value chain. The Yum! Brands Crisis Management Program is dedicated to anticipating, identifying and managing potential emerging food safety issues atthe local, regional and global levels to protect the health and safety of our consumers and employees. We have global Crisis Core Teams (CCTs) and a communityoutbreak detection system in place that constantly monitors foodborne illnesses, contamination and other food safety issues worldwide. CCTs monitor potential risks forappropriate mitigation and response coordination.
CommentDue to the diverse and broad nature associated with this risk it is not possible to estimate the potential financial impact. The cost of climate-risk management largelyincluded in broader and risk management efforts. Specific costs are primarily driven by investing in education and training of key stakeholders, especially our employees, toadopt and implement our strategy to mitigate risk.
C2.4
(C2.4) Have you identified any climate-related opportunities with the potential to have a substantive financial or strategic impact on your business?Yes
C2.4a
(C2.4a) Provide details of opportunities identified with the potential to have a substantive financial or strategic impact on your business.
IdentifierOpp1
Where in the value chain does the opportunity occur?Direct operations
Opportunity typeResource efficiency
Primary climate-related opportunity driverMove to more efficient buildings
Primary potential financial impactReduced indirect (operating) costs
CDP Page of 4611
Company-specific descriptionAs a growth company who opened over five restaurants a day in 2019 with our franchisees, we understand the built environment has a climate change impact. Ourfundamental approaches to designing and building more efficient new buildings is contained in our global green building standard called Blueline. Our brands use thisplaybook as a framework for our system to build restaurants with reduced environmental impact.
Time horizonShort-term
LikelihoodVirtually certain
Magnitude of impactMedium-low
Are you able to provide a potential financial impact figure?Yes, a single figure estimate
Potential financial impact figure (currency)18100000
Potential financial impact figure – minimum (currency)<Not Applicable>
Potential financial impact figure – maximum (currency)<Not Applicable>
Explanation of financial impact figureNew building financial savings are dependent on current market design, green approaches selected and local utility costs. Savings come from either full implementation ofthe Blueline standard or partial as reported by the marked. For full implementation, it is expected, based on detailed study and test projects that between 10% and 30%utility savings will be realized per restaurant. In 2019, it is estimated that we and our franchise partners implemented technologies in new buildings that are expected tosave $18.1 MM over the first year of their use. This number is an approximation based on market reports and included both Blueline implementation and approachesreported through our annual conservation survey.
Cost to realize opportunity26700000
Strategy to realize opportunity and explanation of cost calculationImplementation is conducted by local development teams in conjunction with corporate brand oversight. Yum! global sustainability maintains the Blueline standard using awebsite. Brands may also incorporate standards into their Development guidelines. Brands conduct periodic market reviews to access compliance and provide feedback.Brands and markets are responsible for execution of the standards. The foundation of this whole-building solution for new restaurants are third party systems such as LEEDas well as detailed in-restaurant testing and sub-metering conducted throughout the world. The cost to realize this opportunity has been calculated based on implementationcosts for each technology type as reported in our annual Blueline analysis and Conservation survey. The costs associated with the implementation of these methodsprimarily represent the initial capital costs. In 2019, it is estimated that we and our franchise partners invested approximately $26.7 MM in new green building developmentthroughout our global system. The cost to realize this opportunity has been calculated based on implementation costs for each technology type as reported in our annualBlueline analysis and conservation survey which include a global survey of Development teams.
Comment
IdentifierOpp2
Where in the value chain does the opportunity occur?Direct operations
Opportunity typeResource efficiency
Primary climate-related opportunity driverMove to more efficient buildings
Primary potential financial impactReduced indirect (operating) costs
Company-specific descriptionMore energy efficient approaches implemented in our existing restaurants enable Yum! Brands and its franchisees to take advantage of energy savings and opportunitiesthereby endeavor to reduce greenhouse gas output. The establishment of product efficiency standards for equipment and products has incentivized the market to developmore efficient products. We and our franchisees have invested in these technologies and look for additional opportunities. Examples of our approaches include moreefficient hoods and walk-in refrigeration equipment.
Time horizonShort-term
LikelihoodVirtually certain
Magnitude of impactMedium-low
Are you able to provide a potential financial impact figure?Yes, a single figure estimate
Potential financial impact figure (currency)6800000
Potential financial impact figure – minimum (currency)<Not Applicable>
Potential financial impact figure – maximum (currency)<Not Applicable>
CDP Page of 4612
Explanation of financial impact figureSince 2006, Yum! Brands has been actively implementing energy conservation projects in existing buildings. Savings vary according to market and technology used. In2019 it is estimated that we and our franchise partners implemented technologies that are expected to save $6.8 MM over the first year of their use. This number is anapproximation based on market reports and included both Blueline implementation and approaches reported through our annual conservation survey.
Cost to realize opportunity11100000
Strategy to realize opportunity and explanation of cost calculationYum! Brands employs sub-metering to identify the largest areas of opportunity in our restaurants. Once the areas of opportunity are identified, energy conservationmeasures are thoroughly researched and tested. Once these measures are validated, they are retrofitted into existing restaurants throughout the system by our marketswhere feasible. The cost to realize this opportunity has been calculated based on implementation costs for each technology type as reported in our annual Blueline analysisand Conservation survey. The costs associated with the implementation of these methods are the initial capital costs. In 2019, it is estimated that we and our franchisepartners implemented technologies that cost an estimated $11.1 MM for existing and or remodeled buildings. The cost to realize this opportunity has been calculated basedon implementation costs for each technology type as reported in our annual Blueline analysis and conservation survey. In addition to these projects, we also complete otherapproaches that do not include added capital expense. An example of this was the energy management program that has been implemented in 92 restaurants throughoutIndia.
Comment
IdentifierOpp3
Where in the value chain does the opportunity occur?Direct operations
Opportunity typeEnergy source
Primary climate-related opportunity driverUse of lower-emission sources of energy
Primary potential financial impactIncreased revenues resulting from increased demand for products and services
Company-specific descriptionRenewable energy projects, enabled by renewable energy regulations, may create opportunities that result in lower electricity costs over time for restaurants and increasedgoodwill.
Time horizonMedium-term
LikelihoodAbout as likely as not
Magnitude of impactMedium-low
Are you able to provide a potential financial impact figure?Yes, a single figure estimate
Potential financial impact figure (currency)6000
Potential financial impact figure – minimum (currency)<Not Applicable>
Potential financial impact figure – maximum (currency)<Not Applicable>
Explanation of financial impact figureThe exact financial implications vary according to market and the scope of the installation. The financial estimate provided is based on the average savings from testbuildings in Australia and may or may not be indicative of future results. Reduced operational costs as well increased resilience in some markets may be opportunities inthe upcoming years.
Cost to realize opportunity29000
Strategy to realize opportunity and explanation of cost calculationThe ability to source energy from renewable sources may result in a positive financial return for Yum and its franchisees. However, there are inherit limitations for ourapplication of on-site solar due to the small size of our buildings. We are currently testing on-site solar energy at KFC Australia. The cost to realize this opportunity has beencalculated as the average cost based on test buildings in Australia and may or may not be indicative of future results. The costs associated with the implementation of thesemethods are primarily the initial capital costs although maintenance costs may be expected. The financial estimates provided are based on cost and savings averages fromtest buildings in Australia and may or may not be indicative of future results.
CommentIncreasing the use of renewable energy can help reduce our emissions. We have made a goal to shift to 100% renewable energy in our U.S. corporate offices by the end of2020.
C3. Business Strategy
C3.1
CDP Page of 4613
(C3.1) Have climate-related risks and opportunities influenced your organization’s strategy and/or financial planning?Yes
C3.1a
(C3.1a) Does your organization use climate-related scenario analysis to inform its strategy?No, but we anticipate using qualitative and/or quantitative analysis in the next two years
C3.1c
(C3.1c) Why does your organization not use climate-related scenario analysis to inform its strategy?
At the time of questionnaire submittal, Yum! Brands has not yet incorporated climate-related scenario analysis into business strategy planning, however, we plan to do sowithin the next two years. We have been focused on a study to look at the feasibility of setting of setting targets in accordance with the Science-Based Target Initiative. Thiswill yield the largest impact toward our overall progress and commitment to reducing our environmental impact. This project should be complete in 2020. At which time we willlook at climate-related scenario analysis. The results of this process will be used as an input for developing strategic plans to enhance plan flexibility and resiliency to a rangeof possible future states.
C3.1d
(C3.1d) Describe where and how climate-related risks and opportunities have influenced your strategy.
Have climate-related risksandopportunitiesinfluencedyour strategyin this area?
Description of influence
Productsandservices
Yes Our brands put choice and consumer preferences at the forefront of their work. Taco Bell has a robust offering on non-beef-based menu items, including vegetarian, that providesconsumer options. They are making vegetarian options easier to access with “Veggie Mode”, a single-swipe feature that instantly transforms the menu on self-service kiosks in the U.S.to show only vegetation items. Our brands also continue to explore sustainable test meat substitutes. Taco Bell, our leader in beef volume, is also our leader in beef substitutes withmenu items such as the “Oatrageous Taco” which is sold in Europe. One of the benefits us using non-beef products is reduced greenhouse gas emissions. The timeframe for this isdependent on consumer preferences and varies in markets around the world.
Supplychainand/orvaluechain
Yes Climate related risks and opportunities in the supply chain have led us to focus on efforts to eliminate deforestation. We have set goals, such as to purchase 100% of our paper-basedpackaging from with fiber from responsibility managed forests and recycled sources. Our timeframe to complete this is the end of 2020. We also met our goal of sourcing RSPO certifiedpalm oil for cooking. To show our support Yum! Brands endorsed the New York Declaration on Forests (NYDF) and the provide sector goal of eliminating deforestation from theproduction of agricultural commodities such as palm oil, soy, paper and beef products no later than 2020, and striving to end natural forest loss by 2030. We continually evaluate theimpact climate change has on our supply chain. Increases in food and packaging pricing resulting from climate change directly or indirectly impact the supply chain through commodityprices that impacts our concepts’ franchisees’ profit margins. These can include impacts from events such as drought or impact through infectious diseases. We work continually tomaintain a diverse supply chain and positive relationships with supply chain partners by proactively establishing mitigation practices that include menu management and portfoliodiversification. This minimizes the impacts on any one part of a country or distribution system due to changes in physical climate parameters.
Investmentin R&D
Yes Recognizing the opportunity for energy conserving, GHG reducing technologies and approaches resulted in increased R&D. During the preparation of our green building standard,Blueline Yum! our brands and selected franchisees invested in building R&D. This included extensive sub-metering of utilities and green and not green buildings to gather and study themost effective approach. Together we built a series of 35 LEED certified to test our approaches. The result of this work was the creation of our green building standard, Blueline, and theinclusion of sustainably measures into thousands of our restaurants. We are currently evaluating our greenhouse gas mitigation efforts and their impact on climate-related risks byconducting a review of the feasibility of setting targets in accordance with the Science-Based Target Initiative (timeframe for feasibility study completion is 2020) and are planning tocomplete future senecio analysis (timeframe is to be completed within the next two years). In partnership with industry peers, we have joined the NextGen Consortium to help advancefood-service packaging solutions that are recoverable thereby contributing to greenhouse gas mitigation efforts.
Operations Yes GHG and energy reducing technologies and approaches as identified as opportunities are being implemented in thousands of our restaurants. These include more efficient hoods,refrigeration equipment, HVAC and lighting. Higher efficiency equipment increases our resiliency to adapt to specific events including challenges with local utility supplies. Our efforts torealize this opportunity are an ongoing focus our development teams and efforts are measured, including GHG avoidance, energy savings and investment, on an annual basis.
C3.1e
CDP Page of 4614
(C3.1e) Describe where and how climate-related risks and opportunities have influenced your financial planning.
Financialplanningelementsthat havebeeninfluenced
Description of influence
Row1
RevenuesIndirectcostsCapitalexpendituresCapitalallocationAcquisitionsanddivestmentsAccess tocapitalAssetsLiabilities
Revenues: One identified risk was health concerns arising from outbreaks of viruses or other diseases. While many factors contribute to disease outbreaks, it has been reported that changes inglobal climate and bring about the spread of diseases into new, previously unimpacted areas. Our business could be materially and adversely affected by the outbreak of a widespread healthepidemic. The occurrence of such an outbreak of an epidemic, illness or other adverse public health developments can materially disrupt our business and operations as has been the case withCOVID 19. Although not currently proven to be linked to climate-change, the COIVD-19 pandemic provides case study. As a result of the ongoing pandemic at the end of Q2 2020 experienceda quarterly decline of system sales of 12%. At the peak in mid-April, Yum! experienced temporary closures of 11,000 restaurants. This is a case study of the impact of a pandemic. This reflectspast statements that operations and supply chains can be disrupted as the result of human and animal illnesses. Outbreaks of avian flu occur sporadically around the world, including confirmedhuman cases. Public concern over avian flu may cause fear about the consumption of chicken, eggs and other products derived from poultry, which could cause customers to consume less ofour products. Outbreaks could also adversely affect the price and availability of poultry, which could negatively impact our profit margins and revenues. We could also be adversely affected ifgovernments impose mandatory closures, seek voluntary closures or impose restrictions on operations of restaurants. Due to the diverse and broad nature associated with this risk, it is notpossible to estimate the potential financial impact. Operating Costs: Energy conserving, GHG reducing technologies and approaches as identified as opportunities are being implemented inthousands of our restaurants. These include more efficient hoods, refrigeration equipment, HVAC and lighting. Higher efficiency equipment increases our resiliency to adapt to specific eventsincluding challenges with local utility supplies. In 2019, we estimate that we and our franchise partners implemented green building technologies and approaches that saved an estimated $24.9MM. The risk of changes in operating costs due to energy our factored into our standard planning proses as energy is a component of the restaurant profit and loss statement. Restaurants are arelatively energy intensive business based on the size of our operations. Cost to procure energy vary significantly in different countries across the globe. Disruptions in supply and general costincreases can lead to financial burdens on restaurants. Examples of markets for our restaurants that tend to be subject to high prices or supply disruptions are India, South Africa and numerouscounties in our Latin America and Caribbean market. Although these impacts are acute at one scale they tend to widespread and persistent. We have also identified risks or shortage orinterruptions in the availability and delivery of food and other supplies as well as increased food prices. We work continually to maintain a diverse supply chain and positive relationships withsupply chain partners by proactively establishing mitigation practices that include menu management and portfolio diversification. During the COIVID-19 pandemic our system was able toprovide products in the restaurants despite supply change challenges. This minimizes the impacts on any one part of a country or distribution system due to changes in physical climateparameters. We continually evaluate the impact climate change has on our business and understand that as a large food retailer, changes in precipitation. Capital expenditures / capitalallocation: Taking advantage of more efficient new buildings and incorporating energy savings approaches into existing buildings is factored into capital expenditures during the annual planningprocess. The costs associated with the implementation of these methods are primarily the initial capital costs. These are planned for on an annual basis. In 2019, an estimated 36.6MM dollarswere invested in new green building development as well as existing building renovations in our system throughout the world by the company and franchisees. This number is an approximationbased on market reports. Acquisitions and divestments: The risks and opportunities that have been identified are not typically impacting acquisition and divestment. Access to capital: The risksand opportunities that have been identified have not historically impacted our access to capital. Assets: Energy conserving, GHG reducing technologies and approaches as identified asopportunities are being implemented in thousands of our restaurants. These include more efficient hoods, refrigeration equipment, HVAC and lighting. Higher efficiency equipment increases ourresiliency to adapt to specific events including challenges with local utility supplies. Liabilities: The risks and opportunities that have been identified have not had a material impact on ourliabilities.
C3.1f
CDP Page of 4615
(C3.1f) Provide any additional information on how climate-related risks and opportunities have influenced your strategy and financial planning (optional).
i. Yum! Brands’ business strategy is focused on building three global iconic brands that people trust and champion. In 2010, our business made the strategic decision toestablish the Yum! Global Sustainability team with alignment from our then CEO and Chairman of the Board. In 2016, the importance of sustainability was further recognizedwithin the Company. As part of our transformational reorganization designed to focus efforts enabling delivery of ongoing, long-term results, each of our three brands nowhave dedicated resources to further drive sustainability, including climate change, within the Company and with our franchise partners. We have started an evaluation of ourgreenhouse gas mitigation efforts and their impact on climate-related risks as part of a review of the feasibility of setting targets in accordance with the Science-Based TargetInitiative.
ii. Our sustainability strategy is fundamentally linked our corporate strategy that is designed to unlock our potential. It is called our “Recipe for Growth and Good” and beginssets our shared values. Our values challenge and inspire us to elevate our brands, our culture, our performance and our impact on customers and the communities that weserve. This is our sustainability strategy and can be found online. This strategy focuses uses the strength of our brands and franchisees to make a powerful impact on theworld. We have achieved multiple energy and emissions reduction targets over the last decade with our most recent being to reduce 22% of our Scope 1 and 2 emissions bythe end of 2017 as compared to our 2005 base year. We will continue to work on energy conservation and GHG emission reduction by striving to reduce average restaurantenergy and GHG emissions by 10% from our 2017 levels by the end of 2025. In addition, we are currently evaluating our greenhouse has mitigation efforts and their impacton climate-related risks by starting a review of the feasibility of setting targets in accordance with the Science-Based Target Initiative. Working to reduce greenhouse gasemissions is part of our mission to build the world’s most loved, trusted & fastest growing restaurant brands.
iii. The most substantial business decision made has been influenced by climate change starting of an evaluation of our greenhouse gas mitigation efforts and their impact onclimate-related risks as part of a review of the feasibility of setting targets in accordance with the Science-Based Target Initiative. This is in support of our long-termsustainability strategy. Working to reduce greenhouse gas emissions is part of our mission to build the world’s most loved, trusted & fastest growing restaurant brands. Thisbusiness decision was directly influenced by stakeholder feedback that was incorporated into our materiality assessment, which identified our three priority ESG topics toaddress: Food Safety, Nutrition and Energy-Emissions and Climate Change.
iv. Our sustainability strategy is influenced by our overarching belief that we have a responsibility to reduce our environmental impact and the resulting greenhouse gasemissions that contribute to climate change. We do so in order to build and maintain trust with our stakeholders, comply with the law, and realize cost savings accompaniedwith environmental efficiency projects. The resulting strategy includes several climate-related aspects, including energy reductions, GHG emissions, and sustainablesourcing. Working to reduce greenhouse gas emissions is part of our mission to build the world’s most loved, trusted & fastest growing restaurant brands.
v. Our fundamental, long term strategy is twofold: First, it is to design, build and operate restaurants to be measurably more sustainable using green building standards todrive reductions in energy, GHG emissions, waste and water use and to report progress annually through CDP disclosures. To demonstrate our commitment to reducinggreenhouses gases, we have undertaken a feasibility study for setting science-based targets. This is in alignment with our long-term strategy of building the world’s mostloved, trusted & fasted growing restaurant brands.
vi. Second is to work elevate the supply chain to reduce deforestation though objectives including the sourcing 100% of palm oil used for cooking and paper-based packagingfrom responsible and sustainable sources. To demonstrate our commitment to minimizing deforestation risk, we endorsed the New York Declaration on Forests (NYDF).
Vii. Our commitment to a process of continual improvement in all that we do, including efforts to reduce our impact on the environment, gives us a strategic advantage overour competitors. We continually seek means of addressing margin improvement and the wishes of customers who desire to enjoy our products while minimizing our impact onthe climate. Being responsive to shareholder, customer and NGO interests contribute to our achieving our mission to build the world’s most loved, trusted & fasted growingrestaurant brands which a strategic advantage.
viii. We acknowledge the global trend as demonstrated by the Paris Agreement, and growing expectations from investors and consumers for businesses to address globalclimate change. Our Company is monitoring global efforts and will continue to work toward reducing energy consumption and study additional appropriate measures toincorporate into future goals. The Paris Agreement and subsequent discussions has influenced our business strategy as we have started an evaluation of the feasibility ofsetting targets in accordance with the Science-Based Target Initiative.
C4. Targets and performance
C4.1
(C4.1) Did you have an emissions target that was active in the reporting year?Both absolute and intensity targets
C4.1a
CDP Page of 4616
(C4.1a) Provide details of your absolute emissions target(s) and progress made against those targets.
Target reference numberAbs 1
Year target was set2018
Target coverageCompany-wide
Scope(s) (or Scope 3 category)Scope 1+2 (location-based)
Base year2018
Covered emissions in base year (metric tons CO2e)203486
Covered emissions in base year as % of total base year emissions in selected Scope(s) (or Scope 3 category)100
Target year2025
Targeted reduction from base year (%)10
Covered emissions in target year (metric tons CO2e) [auto-calculated]183137.4
Covered emissions in reporting year (metric tons CO2e)163886
% of target achieved [auto-calculated]194.607982858772
Target status in reporting yearAchieved
Is this a science-based target?No, but we anticipate setting one in the next 2 years
Please explain (including target coverage)Since 2005 we have demonstrated a steady track record of progress of reducing energy consumption and emissions. Our 2017 goal which we achieved was to achieve a22% reduction by the end of 2017 as compared to our base year. We are committed to continuing our progress in this area and will be looking to further reduce our averagerestaurant energy and Scope 1 and 2 GHG emissions by 10%, using a 2018 baseline, by the end of 2025. In light of significant transformational changes in our business,including but not limited to refranchising of restaurants, we made the decision to reset our Base Year to 2018 during our last reporting cycle. The achieved reduction hasbeen heavily influenced by refranchising efforts. We have started an evaluation of our energy reduction efforts, assessing whether and how science-based targets wouldwork with our business strategy. The results of this work may lead to future adjustments in this target in 2020.
C4.1b
CDP Page of 4617
(C4.1b) Provide details of your emissions intensity target(s) and progress made against those target(s).
Target reference numberInt 1
Year target was set2018
Target coverageCompany-wide
Scope(s) (or Scope 3 category)Scope 1+2 (location-based)
Intensity metricOther, please specify (Metric tons of CO2e per Restaurant)
Base year2018
Intensity figure in base year (metric tons CO2e per unit of activity)174
% of total base year emissions in selected Scope(s) (or Scope 3 category) covered by this intensity figure100
Target year2025
Targeted reduction from base year (%)10
Intensity figure in target year (metric tons CO2e per unit of activity) [auto-calculated]156.6
% change anticipated in absolute Scope 1+2 emissions-10
% change anticipated in absolute Scope 3 emissions0
Intensity figure in reporting year (metric tons CO2e per unit of activity)159
% of target achieved [auto-calculated]86.2068965517241
Target status in reporting yearUnderway
Is this a science-based target?No, but we anticipate setting one in the next 2 years
Please explain (including target coverage)Since 2005 we have demonstrated a steady track record of progress of reducing energy consumption and emissions. Our 2017 goal which we achieved was to achieve a22% reduction by the end of 2017 as compared to our base year. We are committed to continuing our progress in this area and will be looking to further reduce our averagerestaurant energy and Scope 1 and 2 GHG emissions by 10%, using a 2018 baseline, by the end of 2025. In light of significant transformational changes in our business,including but not limited to refranchising of restaurants, we made the decision to reset our Base Year to 2018 during our last reporting cycle. We have made substantialprogress toward our goal in 2019. We have started an evaluation of our energy reduction efforts, assessing whether and how science-based targets would work with ourbusiness strategy. The results of this work may lead to future adjustments in this target in 2020.
C4.2
(C4.2) Did you have any other climate-related targets that were active in the reporting year?Target(s) to increase low-carbon energy consumption or productionOther climate-related target(s)
C4.2a
CDP Page of 4618
(C4.2a) Provide details of your target(s) to increase low-carbon energy consumption or production.
Target reference numberLow 1
Year target was set2019
Target coverageSite/facility
Target type: absolute or intensityAbsolute
Target type: energy carrierElectricity
Target type: activityConsumption
Target type: energy sourceRenewable energy source(s) only
Metric (target numerator if reporting an intensity target)Percentage
Target denominator (intensity targets only)<Not Applicable>
Base year2020
Figure or percentage in base year0
Target year2020
Figure or percentage in target year100
Figure or percentage in reporting year0
% of target achieved [auto-calculated]0
Target status in reporting yearNew
Is this target part of an emissions target?Renewable energy is an important tool in reducing greenhouse gas emissions. As we work on studying the feasibility of a science-based target, we are also studying thepossibility of increasing our renewable energy. The first step is to meet our goal of 100% renewable energy for our U.S. corporate offices.
Is this target part of an overarching initiative?Science-based targets initiative
Please explain (including target coverage)Renewable energy is an important tool in reducing greenhouse gas emissions. As we work on studying the feasibility of a science-based target, we are also studying thepossibility of increasing our renewable energy. The first step is to meet our goal of 100% renewable energy for our U.S. corporate offices.
C4.2b
(C4.2b) Provide details of any other climate-related targets, including methane reduction targets.
Target reference numberOth 1
Year target was set2018
Target coverageBusiness division
Target type: absolute or intensityAbsolute
Target type: category & Metric (target numerator if reporting an intensity target)
Waste management metric tons of waste diverted from landfill
Target denominator (intensity targets only)<Not Applicable>
Base year2018
CDP Page of 4619
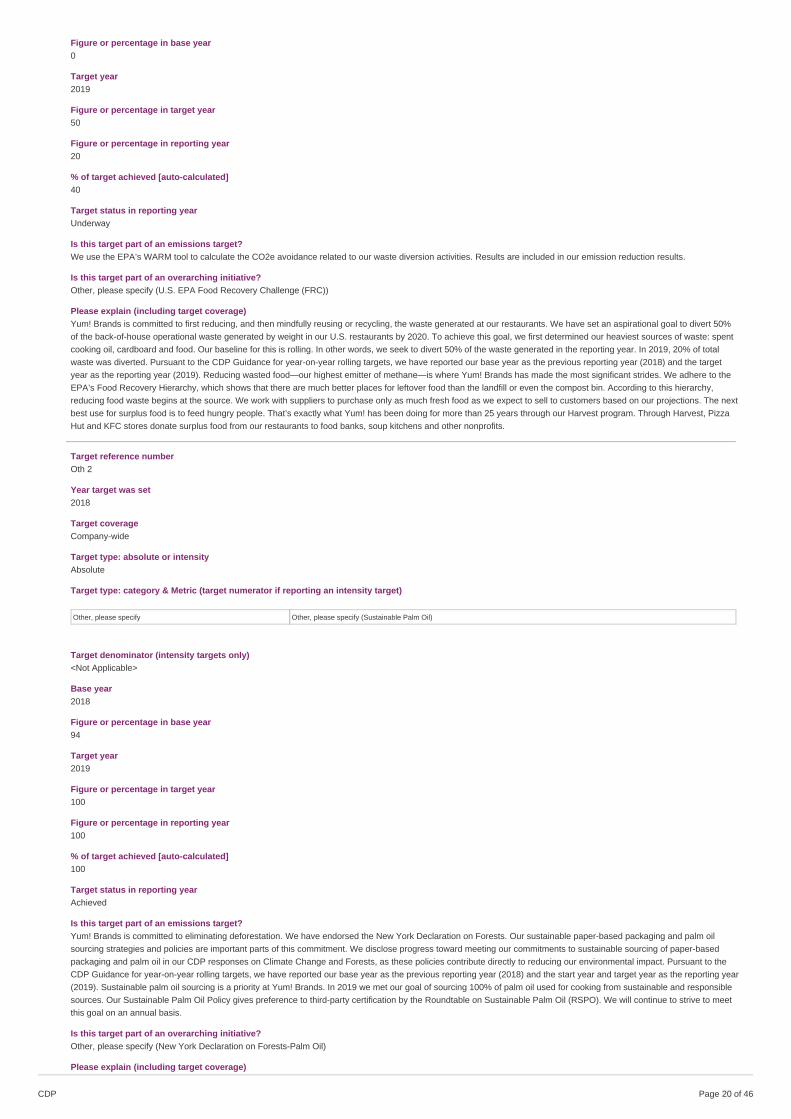
Figure or percentage in base year0
Target year2019
Figure or percentage in target year50
Figure or percentage in reporting year20
% of target achieved [auto-calculated]40
Target status in reporting yearUnderway
Is this target part of an emissions target?We use the EPA’s WARM tool to calculate the CO2e avoidance related to our waste diversion activities. Results are included in our emission reduction results.
Is this target part of an overarching initiative?Other, please specify (U.S. EPA Food Recovery Challenge (FRC))
Please explain (including target coverage)Yum! Brands is committed to first reducing, and then mindfully reusing or recycling, the waste generated at our restaurants. We have set an aspirational goal to divert 50%of the back-of-house operational waste generated by weight in our U.S. restaurants by 2020. To achieve this goal, we first determined our heaviest sources of waste: spentcooking oil, cardboard and food. Our baseline for this is rolling. In other words, we seek to divert 50% of the waste generated in the reporting year. In 2019, 20% of totalwaste was diverted. Pursuant to the CDP Guidance for year-on-year rolling targets, we have reported our base year as the previous reporting year (2018) and the targetyear as the reporting year (2019). Reducing wasted food—our highest emitter of methane—is where Yum! Brands has made the most significant strides. We adhere to theEPA’s Food Recovery Hierarchy, which shows that there are much better places for leftover food than the landfill or even the compost bin. According to this hierarchy,reducing food waste begins at the source. We work with suppliers to purchase only as much fresh food as we expect to sell to customers based on our projections. The nextbest use for surplus food is to feed hungry people. That’s exactly what Yum! has been doing for more than 25 years through our Harvest program. Through Harvest, PizzaHut and KFC stores donate surplus food from our restaurants to food banks, soup kitchens and other nonprofits.
Target reference numberOth 2
Year target was set2018
Target coverageCompany-wide
Target type: absolute or intensityAbsolute
Target type: category & Metric (target numerator if reporting an intensity target)
Other, please specify Other, please specify (Sustainable Palm Oil)
Target denominator (intensity targets only)<Not Applicable>
Base year2018
Figure or percentage in base year94
Target year2019
Figure or percentage in target year100
Figure or percentage in reporting year100
% of target achieved [auto-calculated]100
Target status in reporting yearAchieved
Is this target part of an emissions target?Yum! Brands is committed to eliminating deforestation. We have endorsed the New York Declaration on Forests. Our sustainable paper-based packaging and palm oilsourcing strategies and policies are important parts of this commitment. We disclose progress toward meeting our commitments to sustainable sourcing of paper-basedpackaging and palm oil in our CDP responses on Climate Change and Forests, as these policies contribute directly to reducing our environmental impact. Pursuant to theCDP Guidance for year-on-year rolling targets, we have reported our base year as the previous reporting year (2018) and the start year and target year as the reporting year(2019). Sustainable palm oil sourcing is a priority at Yum! Brands. In 2019 we met our goal of sourcing 100% of palm oil used for cooking from sustainable and responsiblesources. Our Sustainable Palm Oil Policy gives preference to third-party certification by the Roundtable on Sustainable Palm Oil (RSPO). We will continue to strive to meetthis goal on an annual basis.
Is this target part of an overarching initiative?Other, please specify (New York Declaration on Forests-Palm Oil)
Please explain (including target coverage)
CDP Page of 4620
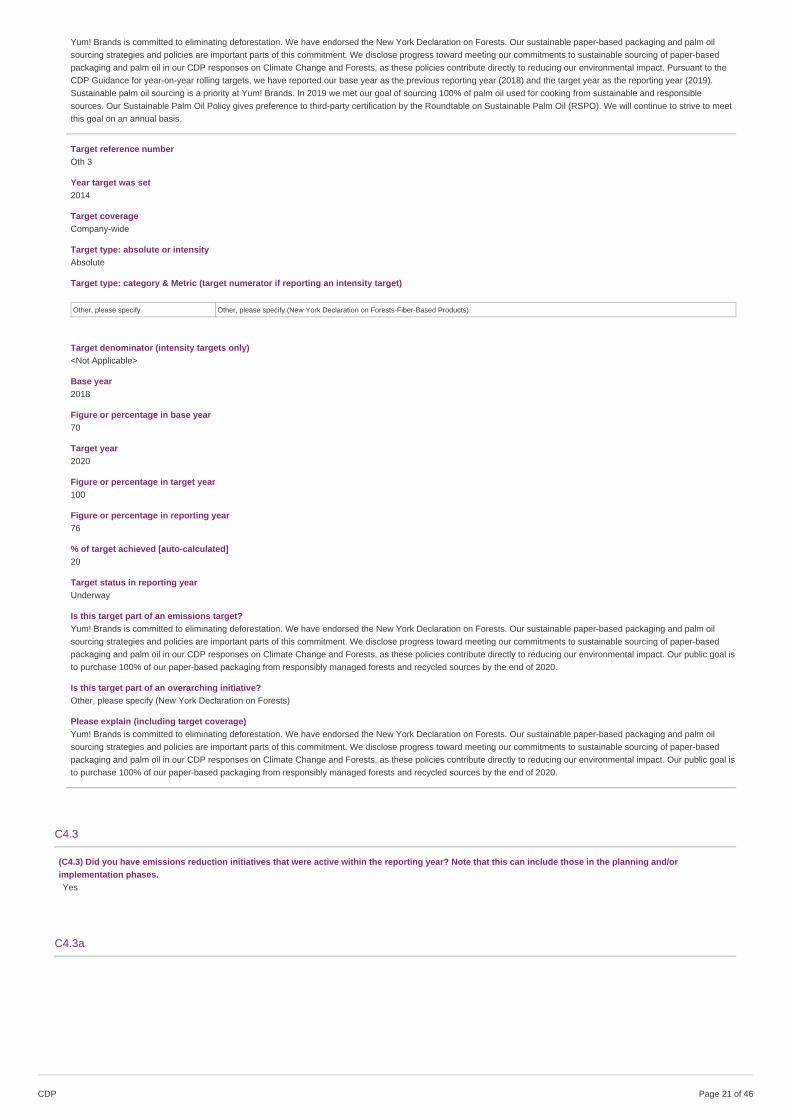
Yum! Brands is committed to eliminating deforestation. We have endorsed the New York Declaration on Forests. Our sustainable paper-based packaging and palm oilsourcing strategies and policies are important parts of this commitment. We disclose progress toward meeting our commitments to sustainable sourcing of paper-basedpackaging and palm oil in our CDP responses on Climate Change and Forests, as these policies contribute directly to reducing our environmental impact. Pursuant to theCDP Guidance for year-on-year rolling targets, we have reported our base year as the previous reporting year (2018) and the target year as the reporting year (2019).Sustainable palm oil sourcing is a priority at Yum! Brands. In 2019 we met our goal of sourcing 100% of palm oil used for cooking from sustainable and responsiblesources. Our Sustainable Palm Oil Policy gives preference to third-party certification by the Roundtable on Sustainable Palm Oil (RSPO). We will continue to strive to meetthis goal on an annual basis.
Target reference numberOth 3
Year target was set2014
Target coverageCompany-wide
Target type: absolute or intensityAbsolute
Target type: category & Metric (target numerator if reporting an intensity target)
Other, please specify Other, please specify (New York Declaration on Forests-Fiber-Based Products)
Target denominator (intensity targets only)<Not Applicable>
Base year2018
Figure or percentage in base year70
Target year2020
Figure or percentage in target year100
Figure or percentage in reporting year76
% of target achieved [auto-calculated]20
Target status in reporting yearUnderway
Is this target part of an emissions target?Yum! Brands is committed to eliminating deforestation. We have endorsed the New York Declaration on Forests. Our sustainable paper-based packaging and palm oilsourcing strategies and policies are important parts of this commitment. We disclose progress toward meeting our commitments to sustainable sourcing of paper-basedpackaging and palm oil in our CDP responses on Climate Change and Forests, as these policies contribute directly to reducing our environmental impact. Our public goal isto purchase 100% of our paper-based packaging from responsibly managed forests and recycled sources by the end of 2020.
Is this target part of an overarching initiative?Other, please specify (New York Declaration on Forests)
Please explain (including target coverage)Yum! Brands is committed to eliminating deforestation. We have endorsed the New York Declaration on Forests. Our sustainable paper-based packaging and palm oilsourcing strategies and policies are important parts of this commitment. We disclose progress toward meeting our commitments to sustainable sourcing of paper-basedpackaging and palm oil in our CDP responses on Climate Change and Forests, as these policies contribute directly to reducing our environmental impact. Our public goal isto purchase 100% of our paper-based packaging from responsibly managed forests and recycled sources by the end of 2020.
C4.3
(C4.3) Did you have emissions reduction initiatives that were active within the reporting year? Note that this can include those in the planning and/orimplementation phases.Yes
C4.3a
CDP Page of 4621
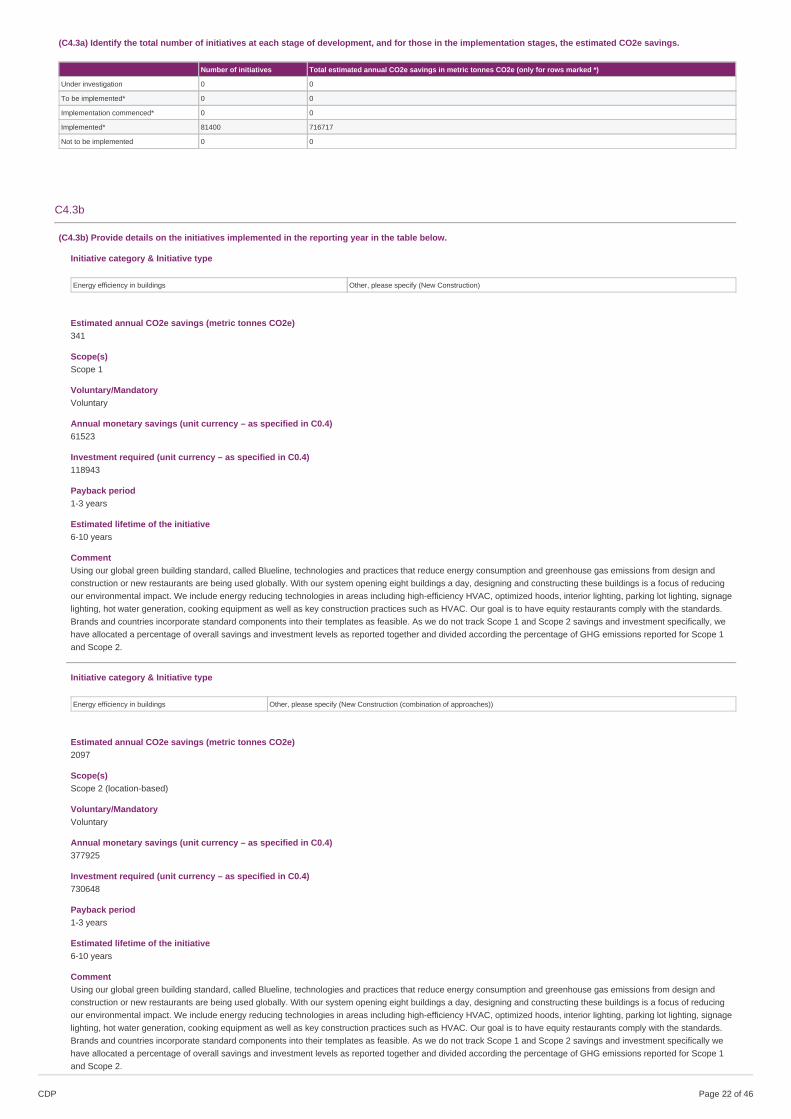
(C4.3a) Identify the total number of initiatives at each stage of development, and for those in the implementation stages, the estimated CO2e savings.
Number of initiatives Total estimated annual CO2e savings in metric tonnes CO2e (only for rows marked *)
Under investigation 0 0
To be implemented* 0 0
Implementation commenced* 0 0
Implemented* 81400 716717
Not to be implemented 0 0
C4.3b
(C4.3b) Provide details on the initiatives implemented in the reporting year in the table below.
Initiative category & Initiative type
Energy efficiency in buildings Other, please specify (New Construction)
Estimated annual CO2e savings (metric tonnes CO2e)341
Scope(s)Scope 1
Voluntary/MandatoryVoluntary
Annual monetary savings (unit currency – as specified in C0.4)61523
Investment required (unit currency – as specified in C0.4)118943
Payback period1-3 years
Estimated lifetime of the initiative6-10 years
CommentUsing our global green building standard, called Blueline, technologies and practices that reduce energy consumption and greenhouse gas emissions from design andconstruction or new restaurants are being used globally. With our system opening eight buildings a day, designing and constructing these buildings is a focus of reducingour environmental impact. We include energy reducing technologies in areas including high-efficiency HVAC, optimized hoods, interior lighting, parking lot lighting, signagelighting, hot water generation, cooking equipment as well as key construction practices such as HVAC. Our goal is to have equity restaurants comply with the standards.Brands and countries incorporate standard components into their templates as feasible. As we do not track Scope 1 and Scope 2 savings and investment specifically, wehave allocated a percentage of overall savings and investment levels as reported together and divided according the percentage of GHG emissions reported for Scope 1and Scope 2.
Initiative category & Initiative type
Energy efficiency in buildings Other, please specify (New Construction (combination of approaches))
Estimated annual CO2e savings (metric tonnes CO2e)2097
Scope(s)Scope 2 (location-based)
Voluntary/MandatoryVoluntary
Annual monetary savings (unit currency – as specified in C0.4)377925
Investment required (unit currency – as specified in C0.4)730648
Payback period1-3 years
Estimated lifetime of the initiative6-10 years
CommentUsing our global green building standard, called Blueline, technologies and practices that reduce energy consumption and greenhouse gas emissions from design andconstruction or new restaurants are being used globally. With our system opening eight buildings a day, designing and constructing these buildings is a focus of reducingour environmental impact. We include energy reducing technologies in areas including high-efficiency HVAC, optimized hoods, interior lighting, parking lot lighting, signagelighting, hot water generation, cooking equipment as well as key construction practices such as HVAC. Our goal is to have equity restaurants comply with the standards.Brands and countries incorporate standard components into their templates as feasible. As we do not track Scope 1 and Scope 2 savings and investment specifically wehave allocated a percentage of overall savings and investment levels as reported together and divided according the percentage of GHG emissions reported for Scope 1and Scope 2.
CDP Page of 4622
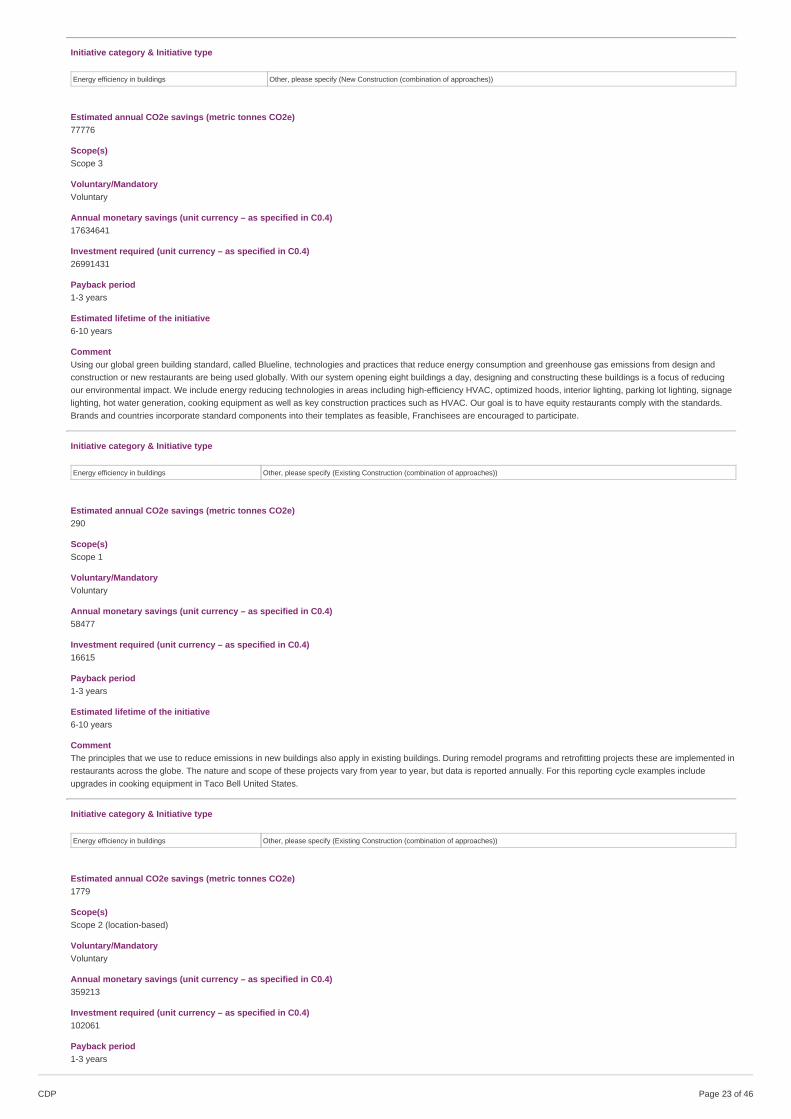
Initiative category & Initiative type
Energy efficiency in buildings Other, please specify (New Construction (combination of approaches))
Estimated annual CO2e savings (metric tonnes CO2e)77776
Scope(s)Scope 3
Voluntary/MandatoryVoluntary
Annual monetary savings (unit currency – as specified in C0.4)17634641
Investment required (unit currency – as specified in C0.4)26991431
Payback period1-3 years
Estimated lifetime of the initiative6-10 years
CommentUsing our global green building standard, called Blueline, technologies and practices that reduce energy consumption and greenhouse gas emissions from design andconstruction or new restaurants are being used globally. With our system opening eight buildings a day, designing and constructing these buildings is a focus of reducingour environmental impact. We include energy reducing technologies in areas including high-efficiency HVAC, optimized hoods, interior lighting, parking lot lighting, signagelighting, hot water generation, cooking equipment as well as key construction practices such as HVAC. Our goal is to have equity restaurants comply with the standards.Brands and countries incorporate standard components into their templates as feasible, Franchisees are encouraged to participate.
Initiative category & Initiative type
Energy efficiency in buildings Other, please specify (Existing Construction (combination of approaches))
Estimated annual CO2e savings (metric tonnes CO2e)290
Scope(s)Scope 1
Voluntary/MandatoryVoluntary
Annual monetary savings (unit currency – as specified in C0.4)58477
Investment required (unit currency – as specified in C0.4)16615
Payback period1-3 years
Estimated lifetime of the initiative6-10 years
CommentThe principles that we use to reduce emissions in new buildings also apply in existing buildings. During remodel programs and retrofitting projects these are implemented inrestaurants across the globe. The nature and scope of these projects vary from year to year, but data is reported annually. For this reporting cycle examples includeupgrades in cooking equipment in Taco Bell United States.
Initiative category & Initiative type
Energy efficiency in buildings Other, please specify (Existing Construction (combination of approaches))
Estimated annual CO2e savings (metric tonnes CO2e)1779
Scope(s)Scope 2 (location-based)
Voluntary/MandatoryVoluntary
Annual monetary savings (unit currency – as specified in C0.4)359213
Investment required (unit currency – as specified in C0.4)102061
Payback period1-3 years
CDP Page of 4623
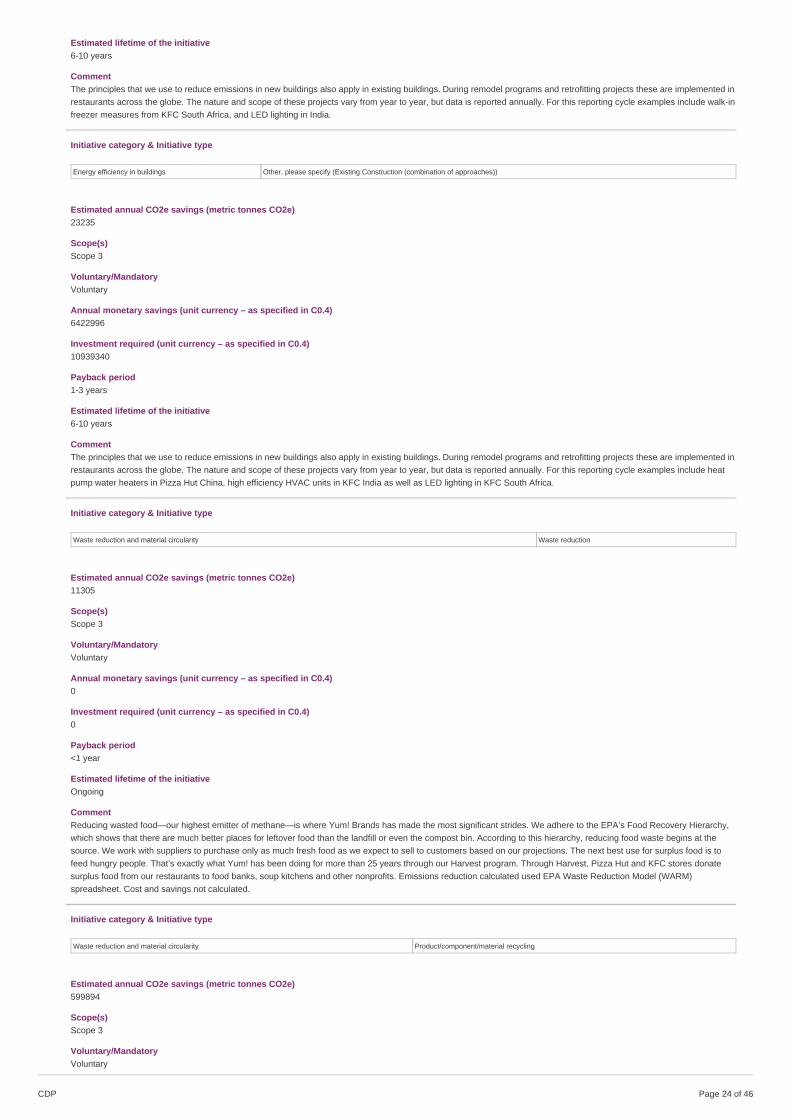
Estimated lifetime of the initiative6-10 years
CommentThe principles that we use to reduce emissions in new buildings also apply in existing buildings. During remodel programs and retrofitting projects these are implemented inrestaurants across the globe. The nature and scope of these projects vary from year to year, but data is reported annually. For this reporting cycle examples include walk-infreezer measures from KFC South Africa, and LED lighting in India.
Initiative category & Initiative type
Energy efficiency in buildings Other, please specify (Existing Construction (combination of approaches))
Estimated annual CO2e savings (metric tonnes CO2e)23235
Scope(s)Scope 3
Voluntary/MandatoryVoluntary
Annual monetary savings (unit currency – as specified in C0.4)6422996
Investment required (unit currency – as specified in C0.4)10939340
Payback period1-3 years
Estimated lifetime of the initiative6-10 years
CommentThe principles that we use to reduce emissions in new buildings also apply in existing buildings. During remodel programs and retrofitting projects these are implemented inrestaurants across the globe. The nature and scope of these projects vary from year to year, but data is reported annually. For this reporting cycle examples include heatpump water heaters in Pizza Hut China, high efficiency HVAC units in KFC India as well as LED lighting in KFC South Africa.
Initiative category & Initiative type
Waste reduction and material circularity Waste reduction
Estimated annual CO2e savings (metric tonnes CO2e)11305
Scope(s)Scope 3
Voluntary/MandatoryVoluntary
Annual monetary savings (unit currency – as specified in C0.4)0
Investment required (unit currency – as specified in C0.4)0
Payback period<1 year
Estimated lifetime of the initiativeOngoing
CommentReducing wasted food—our highest emitter of methane—is where Yum! Brands has made the most significant strides. We adhere to the EPA’s Food Recovery Hierarchy,which shows that there are much better places for leftover food than the landfill or even the compost bin. According to this hierarchy, reducing food waste begins at thesource. We work with suppliers to purchase only as much fresh food as we expect to sell to customers based on our projections. The next best use for surplus food is tofeed hungry people. That’s exactly what Yum! has been doing for more than 25 years through our Harvest program. Through Harvest, Pizza Hut and KFC stores donatesurplus food from our restaurants to food banks, soup kitchens and other nonprofits. Emissions reduction calculated used EPA Waste Reduction Model (WARM)spreadsheet. Cost and savings not calculated.
Initiative category & Initiative type
Waste reduction and material circularity Product/component/material recycling
Estimated annual CO2e savings (metric tonnes CO2e)599894
Scope(s)Scope 3
Voluntary/MandatoryVoluntary
CDP Page of 4624
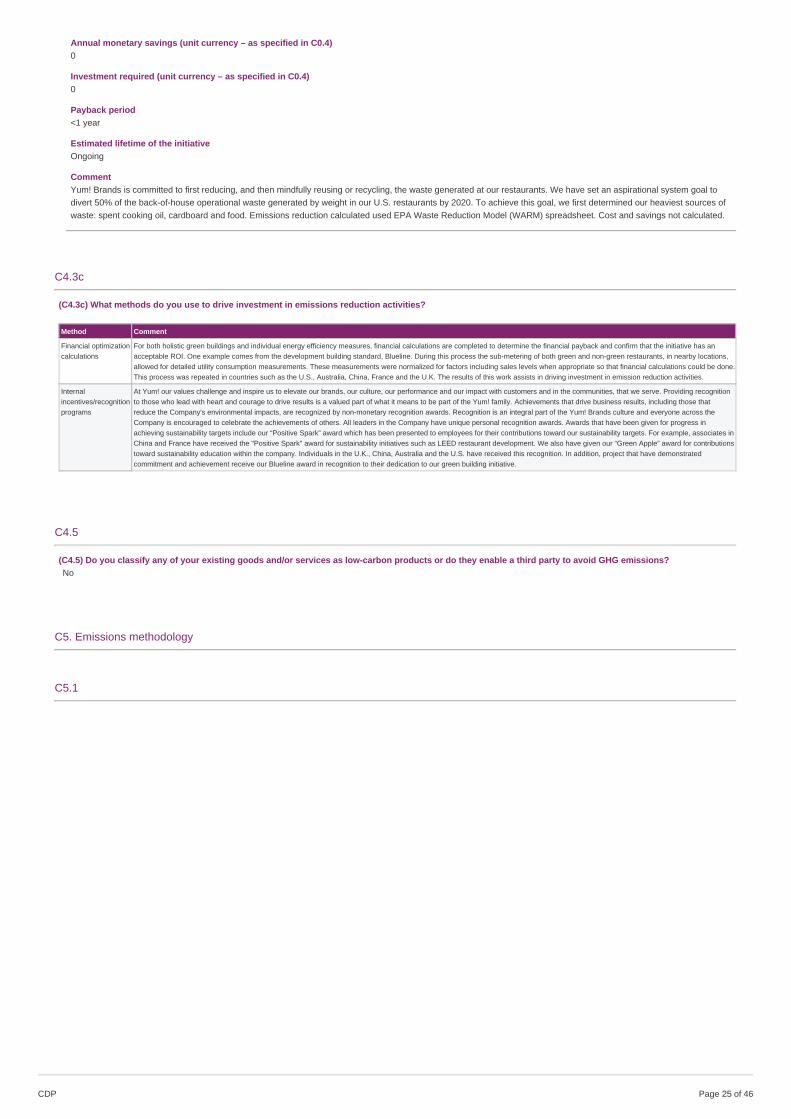
Annual monetary savings (unit currency – as specified in C0.4)0
Investment required (unit currency – as specified in C0.4)0
Payback period<1 year
Estimated lifetime of the initiativeOngoing
CommentYum! Brands is committed to first reducing, and then mindfully reusing or recycling, the waste generated at our restaurants. We have set an aspirational system goal todivert 50% of the back-of-house operational waste generated by weight in our U.S. restaurants by 2020. To achieve this goal, we first determined our heaviest sources ofwaste: spent cooking oil, cardboard and food. Emissions reduction calculated used EPA Waste Reduction Model (WARM) spreadsheet. Cost and savings not calculated.
C4.3c
(C4.3c) What methods do you use to drive investment in emissions reduction activities?
Method Comment
Financial optimizationcalculations
For both holistic green buildings and individual energy efficiency measures, financial calculations are completed to determine the financial payback and confirm that the initiative has anacceptable ROI. One example comes from the development building standard, Blueline. During this process the sub-metering of both green and non-green restaurants, in nearby locations,allowed for detailed utility consumption measurements. These measurements were normalized for factors including sales levels when appropriate so that financial calculations could be done.This process was repeated in countries such as the U.S., Australia, China, France and the U.K. The results of this work assists in driving investment in emission reduction activities.
Internalincentives/recognitionprograms
At Yum! our values challenge and inspire us to elevate our brands, our culture, our performance and our impact with customers and in the communities, that we serve. Providing recognitionto those who lead with heart and courage to drive results is a valued part of what it means to be part of the Yum! family. Achievements that drive business results, including those thatreduce the Company's environmental impacts, are recognized by non-monetary recognition awards. Recognition is an integral part of the Yum! Brands culture and everyone across theCompany is encouraged to celebrate the achievements of others. All leaders in the Company have unique personal recognition awards. Awards that have been given for progress inachieving sustainability targets include our “Positive Spark” award which has been presented to employees for their contributions toward our sustainability targets. For example, associates inChina and France have received the "Positive Spark" award for sustainability initiatives such as LEED restaurant development. We also have given our “Green Apple” award for contributionstoward sustainability education within the company. Individuals in the U.K., China, Australia and the U.S. have received this recognition. In addition, project that have demonstratedcommitment and achievement receive our Blueline award in recognition to their dedication to our green building initiative.
C4.5
(C4.5) Do you classify any of your existing goods and/or services as low-carbon products or do they enable a third party to avoid GHG emissions?No
C5. Emissions methodology
C5.1
CDP Page of 4625
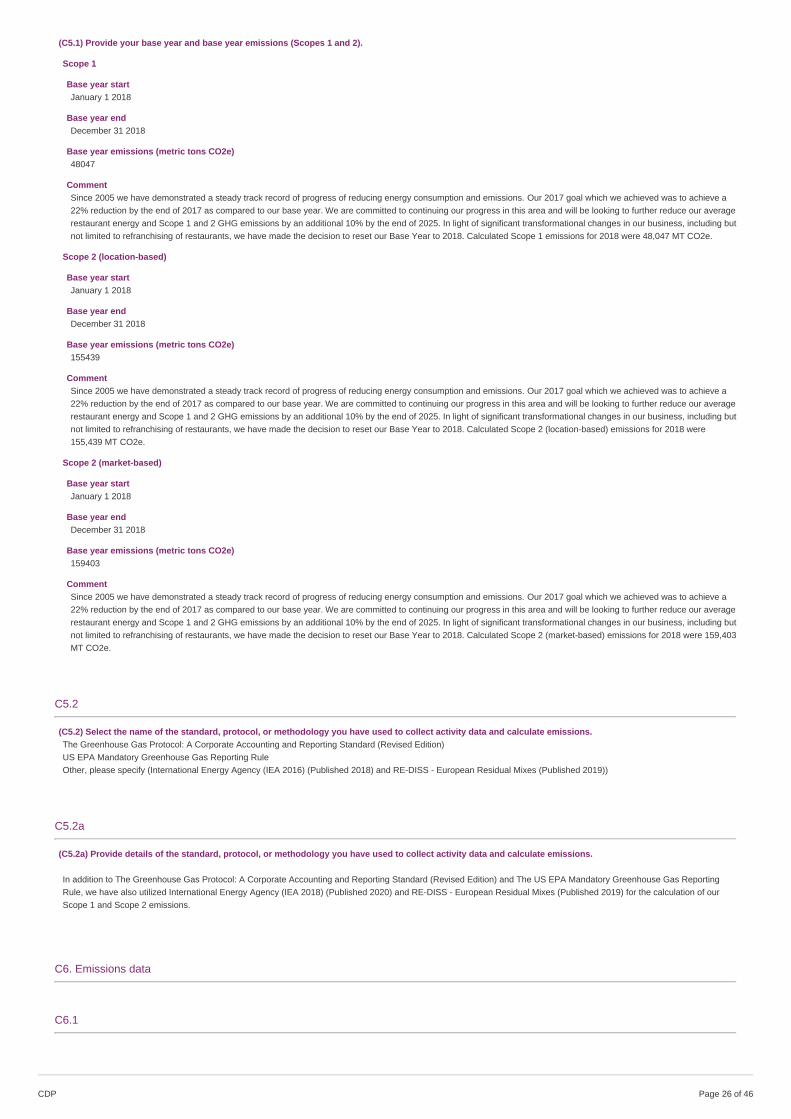
(C5.1) Provide your base year and base year emissions (Scopes 1 and 2).
Scope 1
Base year startJanuary 1 2018
Base year endDecember 31 2018
Base year emissions (metric tons CO2e)48047
CommentSince 2005 we have demonstrated a steady track record of progress of reducing energy consumption and emissions. Our 2017 goal which we achieved was to achieve a22% reduction by the end of 2017 as compared to our base year. We are committed to continuing our progress in this area and will be looking to further reduce our averagerestaurant energy and Scope 1 and 2 GHG emissions by an additional 10% by the end of 2025. In light of significant transformational changes in our business, including butnot limited to refranchising of restaurants, we have made the decision to reset our Base Year to 2018. Calculated Scope 1 emissions for 2018 were 48,047 MT CO2e.
Scope 2 (location-based)
Base year startJanuary 1 2018
Base year endDecember 31 2018
Base year emissions (metric tons CO2e)155439
CommentSince 2005 we have demonstrated a steady track record of progress of reducing energy consumption and emissions. Our 2017 goal which we achieved was to achieve a22% reduction by the end of 2017 as compared to our base year. We are committed to continuing our progress in this area and will be looking to further reduce our averagerestaurant energy and Scope 1 and 2 GHG emissions by an additional 10% by the end of 2025. In light of significant transformational changes in our business, including butnot limited to refranchising of restaurants, we have made the decision to reset our Base Year to 2018. Calculated Scope 2 (location-based) emissions for 2018 were155,439 MT CO2e.
Scope 2 (market-based)
Base year startJanuary 1 2018
Base year endDecember 31 2018
Base year emissions (metric tons CO2e)159403
CommentSince 2005 we have demonstrated a steady track record of progress of reducing energy consumption and emissions. Our 2017 goal which we achieved was to achieve a22% reduction by the end of 2017 as compared to our base year. We are committed to continuing our progress in this area and will be looking to further reduce our averagerestaurant energy and Scope 1 and 2 GHG emissions by an additional 10% by the end of 2025. In light of significant transformational changes in our business, including butnot limited to refranchising of restaurants, we have made the decision to reset our Base Year to 2018. Calculated Scope 2 (market-based) emissions for 2018 were 159,403MT CO2e.
C5.2
(C5.2) Select the name of the standard, protocol, or methodology you have used to collect activity data and calculate emissions.The Greenhouse Gas Protocol: A Corporate Accounting and Reporting Standard (Revised Edition)US EPA Mandatory Greenhouse Gas Reporting RuleOther, please specify (International Energy Agency (IEA 2016) (Published 2018) and RE-DISS - European Residual Mixes (Published 2019))
C5.2a
(C5.2a) Provide details of the standard, protocol, or methodology you have used to collect activity data and calculate emissions.
In addition to The Greenhouse Gas Protocol: A Corporate Accounting and Reporting Standard (Revised Edition) and The US EPA Mandatory Greenhouse Gas ReportingRule, we have also utilized International Energy Agency (IEA 2018) (Published 2020) and RE-DISS - European Residual Mixes (Published 2019) for the calculation of ourScope 1 and Scope 2 emissions.
C6. Emissions data
C6.1
CDP Page of 4626
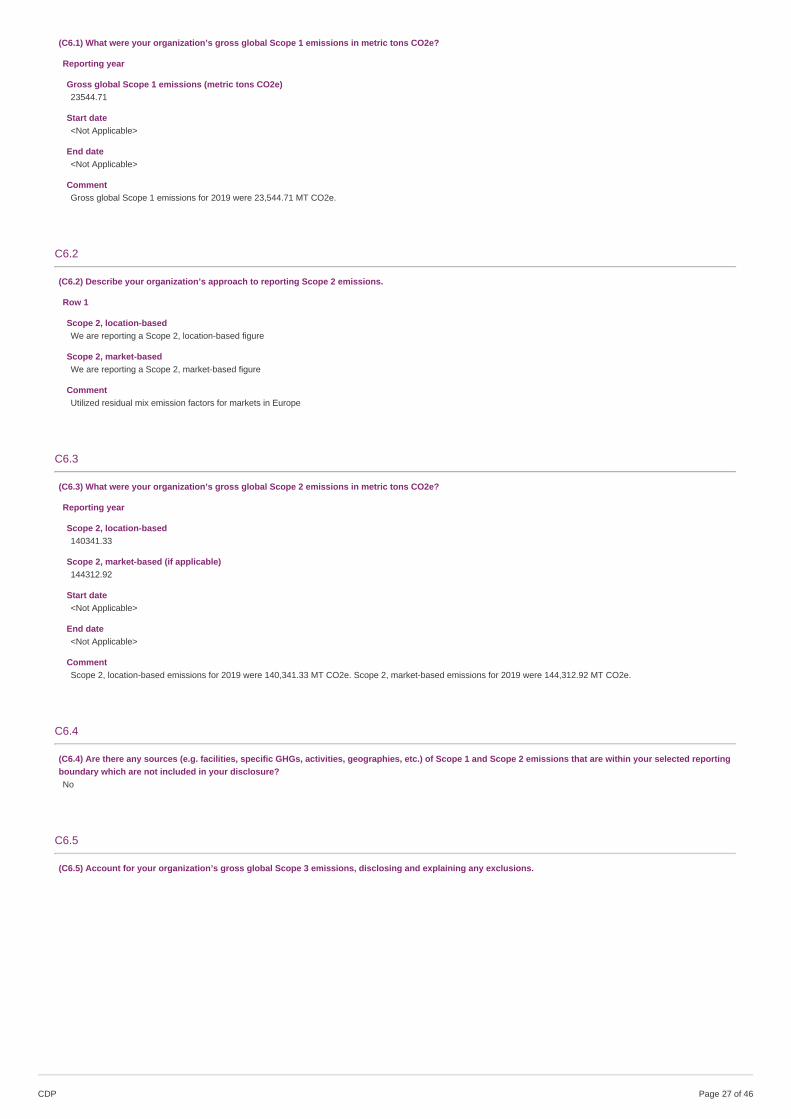
(C6.1) What were your organization’s gross global Scope 1 emissions in metric tons CO2e?
Reporting year
Gross global Scope 1 emissions (metric tons CO2e)23544.71
Start date<Not Applicable>
End date<Not Applicable>
CommentGross global Scope 1 emissions for 2019 were 23,544.71 MT CO2e.
C6.2
(C6.2) Describe your organization’s approach to reporting Scope 2 emissions.
Row 1
Scope 2, location-based We are reporting a Scope 2, location-based figure
Scope 2, market-basedWe are reporting a Scope 2, market-based figure
CommentUtilized residual mix emission factors for markets in Europe
C6.3
(C6.3) What were your organization’s gross global Scope 2 emissions in metric tons CO2e?
Reporting year
Scope 2, location-based140341.33
Scope 2, market-based (if applicable)144312.92
Start date<Not Applicable>
End date<Not Applicable>
CommentScope 2, location-based emissions for 2019 were 140,341.33 MT CO2e. Scope 2, market-based emissions for 2019 were 144,312.92 MT CO2e.
C6.4
(C6.4) Are there any sources (e.g. facilities, specific GHGs, activities, geographies, etc.) of Scope 1 and Scope 2 emissions that are within your selected reportingboundary which are not included in your disclosure?No
C6.5
(C6.5) Account for your organization’s gross global Scope 3 emissions, disclosing and explaining any exclusions.
CDP Page of 4627
Purchased goods and services
Evaluation statusRelevant, calculated
Metric tonnes CO2e25929374
Emissions calculation methodologyIn 2019, for the first time, we estimated GHG emissions for purchased goods and services based on direct data from global markets. Extensive global data was available forplastic, services wared, cooking oil and fiber packaging. Although more data was available for food purchased in the reporting year, more extensive extrapolation wasrequired. Extrapolation in all areas are done by calculating a per restaurant average, by brand and if possible, by region and/or country and applied global store count forcompany owned and franchise restaurants. We anticipate refining our process in upcoming years.
Percentage of emissions calculated using data obtained from suppliers or value chain partners49
Please explainWe recognize that purchased goods and services are a source of Scope 3 emissions for Yum! Brands. Our large and decentralized supply chain presents challenges in thecollection of this data. We focus on the significant and core areas of food, cooking oil plastic packaging and service wares, and fiber packaging in this in our data collectionand estimates. It should be anticipated that reported emissions from purchased good and services will vary as we continue refining our process in upcoming years.
Capital goods
Evaluation statusNot relevant, explanation provided
Metric tonnes CO2e<Not Applicable>
Emissions calculation methodology<Not Applicable>
Percentage of emissions calculated using data obtained from suppliers or value chain partners<Not Applicable>
Please explainWe are not a manufacturer of products. Our organization is 98% franchise-based organization and as such, capital goods are largely procured by franchisees.
Fuel-and-energy-related activities (not included in Scope 1 or 2)
Evaluation statusNot relevant, explanation provided
Metric tonnes CO2e<Not Applicable>
Emissions calculation methodology<Not Applicable>
Percentage of emissions calculated using data obtained from suppliers or value chain partners<Not Applicable>
Please explainEnergy related activities are included in Scope 1 and 2.
Upstream transportation and distribution
Evaluation statusRelevant, calculated
Metric tonnes CO2e1058626
Emissions calculation methodologyIn 2019 we estimated upstream transportation by including transportation from the manufacturer to distribution warehouses, when transportation provided by the distributor,as well as transportation from the warehouses to the restaurants. Due to data availability, U.S. data has served as the basis of the estimate. A per restaurant average, bybrand, was calculated based on fuel per store and applied to our global store count for company owned and franchise restaurants. All calculations were completed utilizingemission factors presented in EPA Federal Register; Revisions to the Greenhouse Gas Reporting Rule, 2013.
Percentage of emissions calculated using data obtained from suppliers or value chain partners31
Please explainWe recognize that transportation is a source of Scope 3 emissions for Yum! Brands. Our large and decentralized system presents challenges in the collection of this data.This is our first attempt at making such an estimate. It should be anticipated that reported emissions from transportation will vary as we continue refining our process inupcoming years.
CDP Page of 4628
Waste generated in operations
Evaluation statusRelevant, calculated
Metric tonnes CO2e778577
Emissions calculation methodologyIn 2019 we estimated waste generated in operations. Due to data availability, U.S. data has served as the basis of the estimate. A per restaurant average, by brand, wascalculated based on waste generated per store in our sample and applied to our global store count for company owned and franchise restaurants. Please note that thisvalue represents operational waste disposed, operational waste recycled, food donated, and products and packaging removed by customers. GHG emissions have beenestimated using the EPA’s WARM tool using the best available categories. We anticipate refining our process in upcoming years.
Percentage of emissions calculated using data obtained from suppliers or value chain partners83
Please explainWe recognize that waste generated in operations is a source of Scope 3 emissions for Yum! Brands. Our large and decentralized system presents challenges in thecollection of this data. This is our first attempt at making such an estimate. It should be anticipated that reported emissions from transportation will vary as we continuerefining our process in upcoming years.
Business travel
Evaluation statusRelevant, calculated
Metric tonnes CO2e22919
Emissions calculation methodologyEmissions include air and ground travel for all corporate employees as reported in our 2018 Global Surveys. For non-reporting markets, an estimate of emissions wascalculated using U.S. data. All calculations were completed utilizing emission factors presented in EPA Federal Register; Revisions to the Greenhouse Gas Reporting Rule,2013 and DEFRA UK Government Greenhouse gas reporting: conversion factors 2017.
Percentage of emissions calculated using data obtained from suppliers or value chain partners100
Please explain
Employee commuting
Evaluation statusRelevant, not yet calculated
Metric tonnes CO2e<Not Applicable>
Emissions calculation methodology<Not Applicable>
Percentage of emissions calculated using data obtained from suppliers or value chain partners<Not Applicable>
Please explain
Upstream leased assets
Evaluation statusNot relevant, explanation provided
Metric tonnes CO2e<Not Applicable>
Emissions calculation methodology<Not Applicable>
Percentage of emissions calculated using data obtained from suppliers or value chain partners<Not Applicable>
Please explainEmissions from leased assets for offices, warehouses and other uses are reflected in our scope 1 and 2 values.
Downstream transportation and distribution
Evaluation statusRelevant, calculated
Metric tonnes CO2e394335
Emissions calculation methodologyIn 2019 we estimated downstream transportation, otherwise known as delivery from the restaurant to consumers. Due to data availability, U.S. data has served as the basisof the estimate. A per restaurant average, by brand, was calculated based on fuel per store and applied to our global store count for company owned and franchiserestaurants. All calculations were completed utilizing emission factors presented in EPA Federal Register; Revisions to the Greenhouse Gas Reporting Rule, 2013.
Percentage of emissions calculated using data obtained from suppliers or value chain partners39
Please explain
CDP Page of 4629
Processing of sold products
Evaluation statusNot relevant, explanation provided
Metric tonnes CO2e<Not Applicable>
Emissions calculation methodology<Not Applicable>
Percentage of emissions calculated using data obtained from suppliers or value chain partners<Not Applicable>
Please explainAll the products sold by our restaurants are consumed immediately without any further processing.
Use of sold products
Evaluation statusNot relevant, explanation provided
Metric tonnes CO2e<Not Applicable>
Emissions calculation methodology<Not Applicable>
Percentage of emissions calculated using data obtained from suppliers or value chain partners<Not Applicable>
Please explainAll the products sold by our restaurants are consumed immediately.
End of life treatment of sold products
Evaluation statusRelevant, calculated
Metric tonnes CO2e92815
Emissions calculation methodologyIn 2019 emissions resulting from the end of life treatment of packaging. Due to data availability, U.S. data has served as the basis of the estimate. A per restaurant average,by brand, was calculated based on waste generated per store in our sample and applied to our global store count for company owned and franchise restaurants. GHGemissions have been estimated using the EPA’s WARM tool using the best available categories. We anticipate refining our process in upcoming years.
Percentage of emissions calculated using data obtained from suppliers or value chain partners40
Please explainWe recognize that waste generated as a result of end of life treatment of packaging waste is a source of Scope 3 emissions for Yum! Brands. Our large and decentralizedsystem presents challenges in the collection of this data. This is our first attempt at making such an estimate. It should be anticipated that reported emissions fromtransportation will vary as we continue refining our process in upcoming years.
Downstream leased assets
Evaluation statusNot relevant, explanation provided
Metric tonnes CO2e<Not Applicable>
Emissions calculation methodology<Not Applicable>
Percentage of emissions calculated using data obtained from suppliers or value chain partners<Not Applicable>
Please explainYum! Brands does not lease any material downstream assets.
Franchises
Evaluation statusRelevant, calculated
Metric tonnes CO2e7883091
Emissions calculation methodologyWe have estimated franchise restaurant GHG emissions for all countries. These estimates were calculated on a per restaurant average for energy use and GHG emissionsaccording to data provided from our global survey. The survey included equity restaurants and a sampling of franchise units and included emissions data for electricity,fuels, heating/cooling, HFC, and distribution. We anticipate refining our process in upcoming years.
Percentage of emissions calculated using data obtained from suppliers or value chain partners22
Please explainWe recognize that franchise restaurants is a source of Scope 3 emissions for Yum! Brands. Our large and decentralized system presents challenges in the collection of thisdata. It should be anticipated that reported emissions from transportation will vary as we continue refining our process in upcoming years.
CDP Page of 4630
Investments
Evaluation statusNot evaluated
Metric tonnes CO2e<Not Applicable>
Emissions calculation methodology<Not Applicable>
Percentage of emissions calculated using data obtained from suppliers or value chain partners<Not Applicable>
Please explain
Other (upstream)
Evaluation statusNot evaluated
Metric tonnes CO2e<Not Applicable>
Emissions calculation methodology<Not Applicable>
Percentage of emissions calculated using data obtained from suppliers or value chain partners<Not Applicable>
Please explain
Other (downstream)
Evaluation statusNot evaluated
Metric tonnes CO2e<Not Applicable>
Emissions calculation methodology<Not Applicable>
Percentage of emissions calculated using data obtained from suppliers or value chain partners<Not Applicable>
Please explain
C6.7
(C6.7) Are carbon dioxide emissions from biogenic carbon relevant to your organization?No
C6.10
CDP Page of 4631
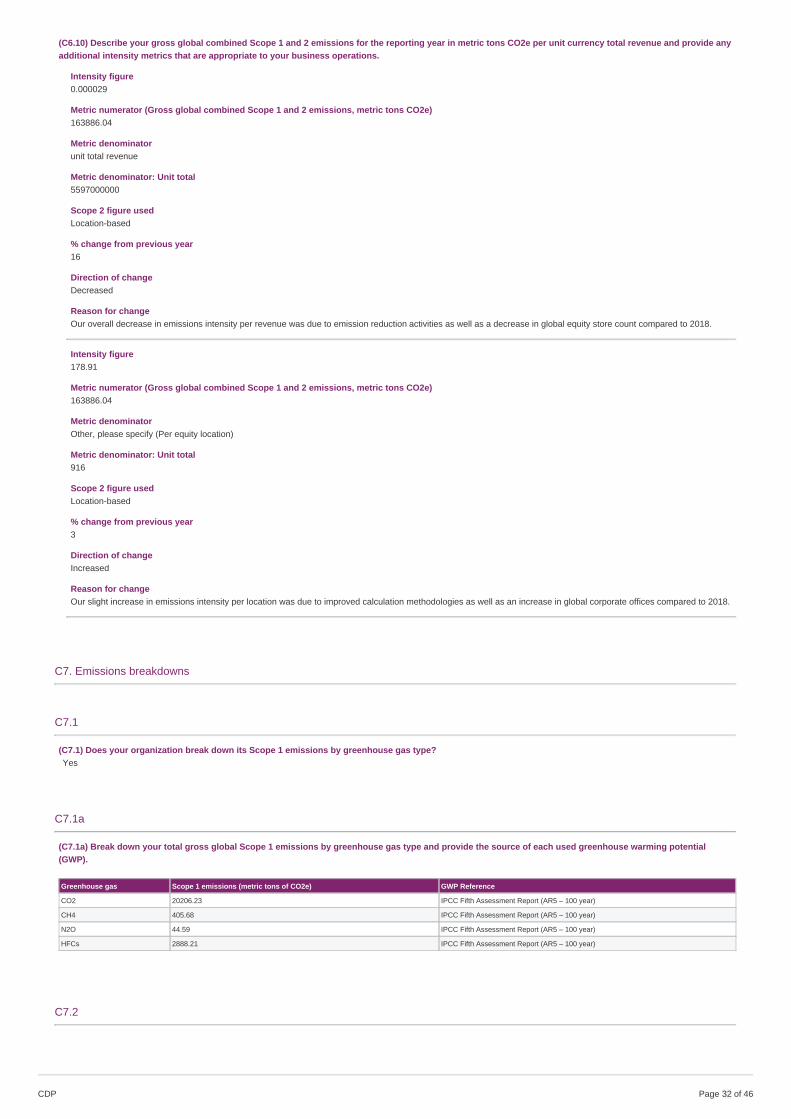
(C6.10) Describe your gross global combined Scope 1 and 2 emissions for the reporting year in metric tons CO2e per unit currency total revenue and provide anyadditional intensity metrics that are appropriate to your business operations.
Intensity figure0.000029
Metric numerator (Gross global combined Scope 1 and 2 emissions, metric tons CO2e)163886.04
Metric denominatorunit total revenue
Metric denominator: Unit total5597000000
Scope 2 figure usedLocation-based
% change from previous year16
Direction of changeDecreased
Reason for changeOur overall decrease in emissions intensity per revenue was due to emission reduction activities as well as a decrease in global equity store count compared to 2018.
Intensity figure178.91
Metric numerator (Gross global combined Scope 1 and 2 emissions, metric tons CO2e)163886.04
Metric denominatorOther, please specify (Per equity location)
Metric denominator: Unit total916
Scope 2 figure usedLocation-based
% change from previous year3
Direction of changeIncreased
Reason for changeOur slight increase in emissions intensity per location was due to improved calculation methodologies as well as an increase in global corporate offices compared to 2018.
C7. Emissions breakdowns
C7.1
(C7.1) Does your organization break down its Scope 1 emissions by greenhouse gas type?Yes
C7.1a
(C7.1a) Break down your total gross global Scope 1 emissions by greenhouse gas type and provide the source of each used greenhouse warming potential(GWP).
Greenhouse gas Scope 1 emissions (metric tons of CO2e) GWP Reference
CO2 20206.23 IPCC Fifth Assessment Report (AR5 – 100 year)
CH4 405.68 IPCC Fifth Assessment Report (AR5 – 100 year)
N2O 44.59 IPCC Fifth Assessment Report (AR5 – 100 year)
HFCs 2888.21 IPCC Fifth Assessment Report (AR5 – 100 year)
C7.2
CDP Page of 4632
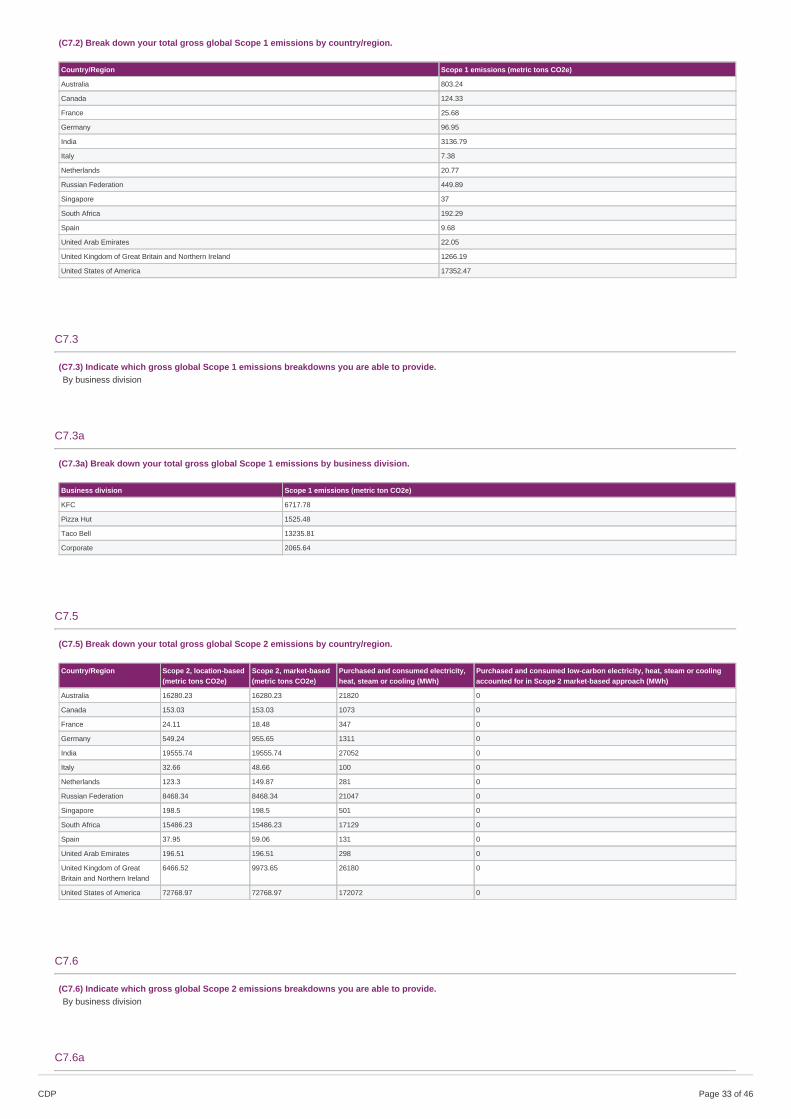
(C7.2) Break down your total gross global Scope 1 emissions by country/region.
Country/Region Scope 1 emissions (metric tons CO2e)
Australia 803.24
Canada 124.33
France 25.68
Germany 96.95
India 3136.79
Italy 7.38
Netherlands 20.77
Russian Federation 449.89
Singapore 37
South Africa 192.29
Spain 9.68
United Arab Emirates 22.05
United Kingdom of Great Britain and Northern Ireland 1266.19
United States of America 17352.47
C7.3
(C7.3) Indicate which gross global Scope 1 emissions breakdowns you are able to provide.By business division
C7.3a
(C7.3a) Break down your total gross global Scope 1 emissions by business division.
Business division Scope 1 emissions (metric ton CO2e)
KFC 6717.78
Pizza Hut 1525.48
Taco Bell 13235.81
Corporate 2065.64
C7.5
(C7.5) Break down your total gross global Scope 2 emissions by country/region.
Country/Region Scope 2, location-based(metric tons CO2e)
Scope 2, market-based(metric tons CO2e)
Purchased and consumed electricity,heat, steam or cooling (MWh)
Purchased and consumed low-carbon electricity, heat, steam or coolingaccounted for in Scope 2 market-based approach (MWh)
Australia 16280.23 16280.23 21820 0
Canada 153.03 153.03 1073 0
France 24.11 18.48 347 0
Germany 549.24 955.65 1311 0
India 19555.74 19555.74 27052 0
Italy 32.66 48.66 100 0
Netherlands 123.3 149.87 281 0
Russian Federation 8468.34 8468.34 21047 0
Singapore 198.5 198.5 501 0
South Africa 15486.23 15486.23 17129 0
Spain 37.95 59.06 131 0
United Arab Emirates 196.51 196.51 298 0
United Kingdom of GreatBritain and Northern Ireland
6466.52 9973.65 26180 0
United States of America 72768.97 72768.97 172072 0
C7.6
(C7.6) Indicate which gross global Scope 2 emissions breakdowns you are able to provide.By business division
C7.6a
CDP Page of 4633
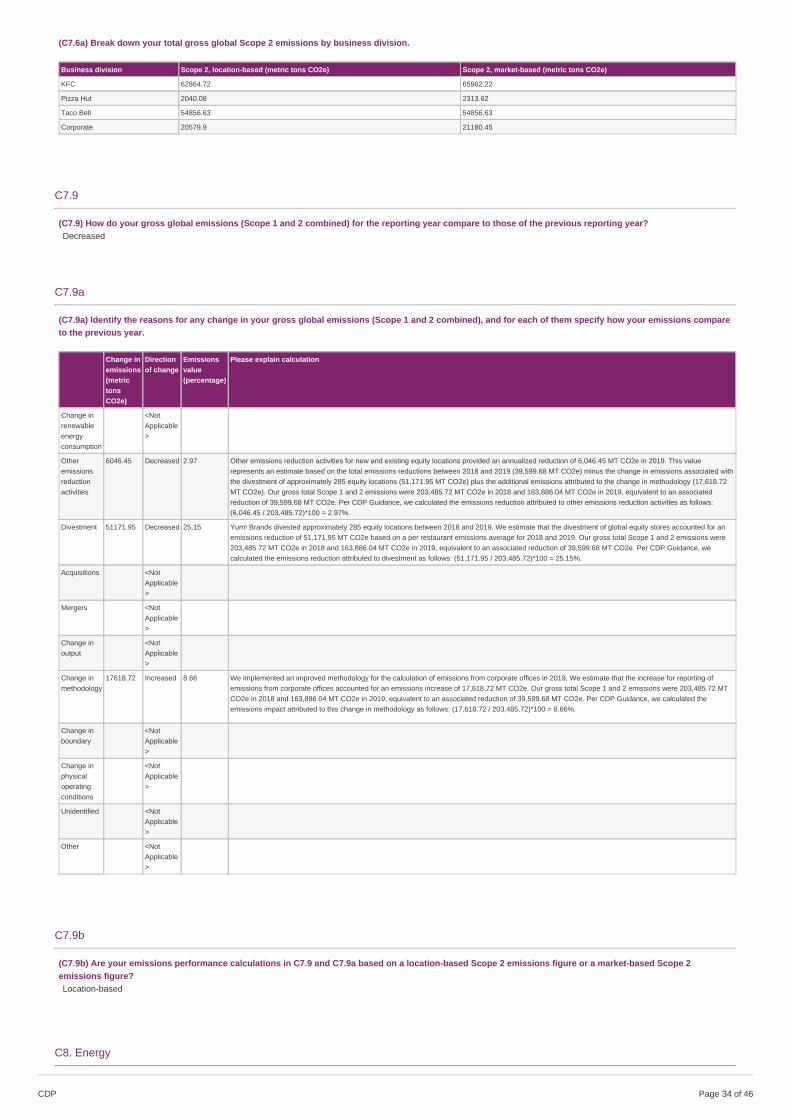
(C7.6a) Break down your total gross global Scope 2 emissions by business division.
Business division Scope 2, location-based (metric tons CO2e) Scope 2, market-based (metric tons CO2e)
KFC 62864.72 65962.22
Pizza Hut 2040.08 2313.62
Taco Bell 54856.63 54856.63
Corporate 20579.9 21180.45
C7.9
(C7.9) How do your gross global emissions (Scope 1 and 2 combined) for the reporting year compare to those of the previous reporting year?Decreased
C7.9a
(C7.9a) Identify the reasons for any change in your gross global emissions (Scope 1 and 2 combined), and for each of them specify how your emissions compareto the previous year.
Change inemissions(metrictonsCO2e)
Directionof change
Emissionsvalue(percentage)
Please explain calculation
Change inrenewableenergyconsumption
<NotApplicable>
Otheremissionsreductionactivities
6046.45 Decreased 2.97 Other emissions reduction activities for new and existing equity locations provided an annualized reduction of 6,046.45 MT CO2e in 2019. This valuerepresents an estimate based on the total emissions reductions between 2018 and 2019 (39,599.68 MT CO2e) minus the change in emissions associated withthe divestment of approximately 285 equity locations (51,171.95 MT CO2e) plus the additional emissions attributed to the change in methodology (17,618.72MT CO2e). Our gross total Scope 1 and 2 emissions were 203,485.72 MT CO2e in 2018 and 163,886.04 MT CO2e in 2019, equivalent to an associatedreduction of 39,599.68 MT CO2e. Per CDP Guidance, we calculated the emissions reduction attributed to other emissions reduction activities as follows:(6,046.45 / 203,485.72)*100 = 2.97%.
Divestment 51171.95 Decreased 25.15 Yum! Brands divested approximately 285 equity locations between 2018 and 2019. We estimate that the divestment of global equity stores accounted for anemissions reduction of 51,171.95 MT CO2e based on a per restaurant emissions average for 2018 and 2019. Our gross total Scope 1 and 2 emissions were203,485.72 MT CO2e in 2018 and 163,886.04 MT CO2e in 2019, equivalent to an associated reduction of 39,599.68 MT CO2e. Per CDP Guidance, wecalculated the emissions reduction attributed to divestment as follows: (51,171.95 / 203,485.72)*100 = 25.15%.
Acquisitions <NotApplicable>
Mergers <NotApplicable>
Change inoutput
<NotApplicable>
Change inmethodology
17618.72 Increased 8.66 We implemented an improved methodology for the calculation of emissions from corporate offices in 2019. We estimate that the increase for reporting ofemissions from corporate offices accounted for an emissions increase of 17,618.72 MT CO2e. Our gross total Scope 1 and 2 emissions were 203,485.72 MTCO2e in 2018 and 163,886.04 MT CO2e in 2019, equivalent to an associated reduction of 39,599.68 MT CO2e. Per CDP Guidance, we calculated theemissions impact attributed to this change in methodology as follows: (17,618.72 / 203,485.72)*100 = 8.66%.
Change inboundary
<NotApplicable>
Change inphysicaloperatingconditions
<NotApplicable>
Unidentified <NotApplicable>
Other <NotApplicable>
C7.9b
(C7.9b) Are your emissions performance calculations in C7.9 and C7.9a based on a location-based Scope 2 emissions figure or a market-based Scope 2emissions figure?Location-based
C8. Energy
CDP Page of 4634
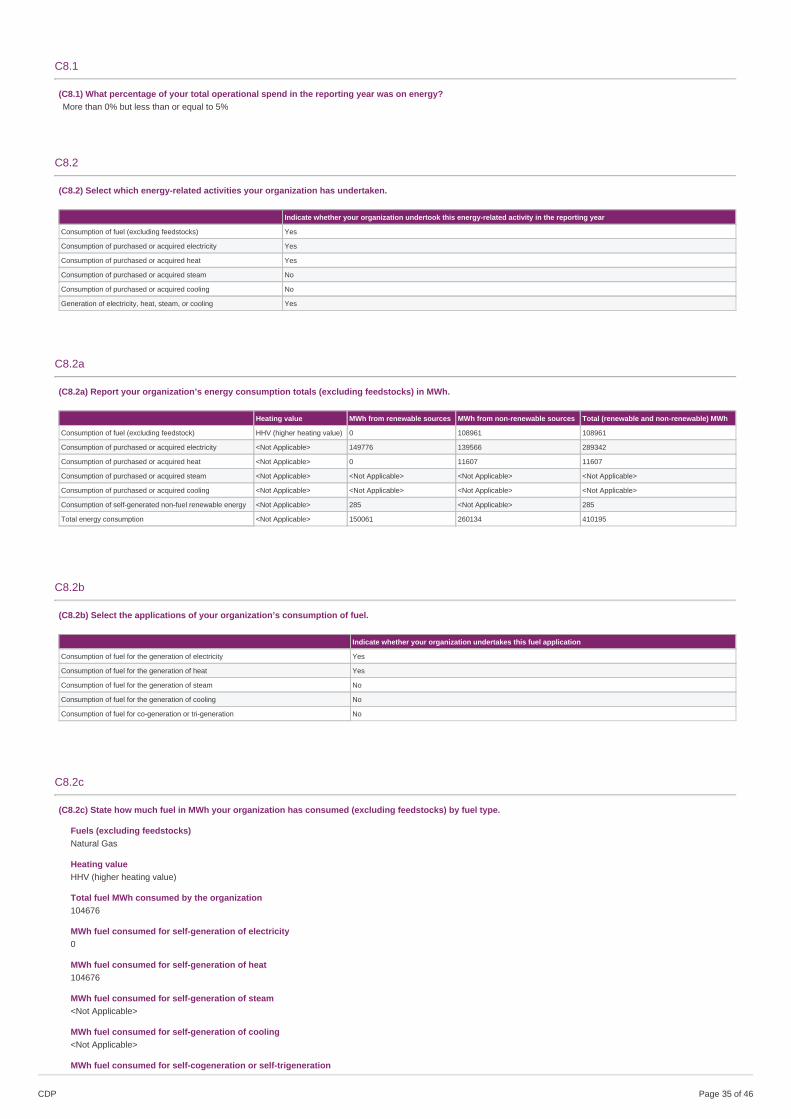
C8.1
(C8.1) What percentage of your total operational spend in the reporting year was on energy?More than 0% but less than or equal to 5%
C8.2
(C8.2) Select which energy-related activities your organization has undertaken.
Indicate whether your organization undertook this energy-related activity in the reporting year
Consumption of fuel (excluding feedstocks) Yes
Consumption of purchased or acquired electricity Yes
Consumption of purchased or acquired heat Yes
Consumption of purchased or acquired steam No
Consumption of purchased or acquired cooling No
Generation of electricity, heat, steam, or cooling Yes
C8.2a
(C8.2a) Report your organization’s energy consumption totals (excluding feedstocks) in MWh.
Heating value MWh from renewable sources MWh from non-renewable sources Total (renewable and non-renewable) MWh
Consumption of fuel (excluding feedstock) HHV (higher heating value) 0 108961 108961
Consumption of purchased or acquired electricity <Not Applicable> 149776 139566 289342
Consumption of purchased or acquired heat <Not Applicable> 0 11607 11607
Consumption of purchased or acquired steam <Not Applicable> <Not Applicable> <Not Applicable> <Not Applicable>
Consumption of purchased or acquired cooling <Not Applicable> <Not Applicable> <Not Applicable> <Not Applicable>
Consumption of self-generated non-fuel renewable energy <Not Applicable> 285 <Not Applicable> 285
Total energy consumption <Not Applicable> 150061 260134 410195
C8.2b
(C8.2b) Select the applications of your organization’s consumption of fuel.
Indicate whether your organization undertakes this fuel application
Consumption of fuel for the generation of electricity Yes
Consumption of fuel for the generation of heat Yes
Consumption of fuel for the generation of steam No
Consumption of fuel for the generation of cooling No
Consumption of fuel for co-generation or tri-generation No
C8.2c
(C8.2c) State how much fuel in MWh your organization has consumed (excluding feedstocks) by fuel type.
Fuels (excluding feedstocks)Natural Gas
Heating valueHHV (higher heating value)
Total fuel MWh consumed by the organization104676
MWh fuel consumed for self-generation of electricity0
MWh fuel consumed for self-generation of heat104676
MWh fuel consumed for self-generation of steam<Not Applicable>
MWh fuel consumed for self-generation of cooling<Not Applicable>
MWh fuel consumed for self-cogeneration or self-trigeneration
CDP Page of 4635
<Not Applicable>
Emission factor0.1848
Unitmetric tons CO2e per MWh
Emissions factor sourceFederal Register EPA; 40 CFR Part 98; e-CFR, March 9, 2018. Table C-1, Table C-2, Table AA-1.
CommentNatural gas represents 22,232 MT CO2e of emissions
Fuels (excluding feedstocks)Diesel
Heating valueHHV (higher heating value)
Total fuel MWh consumed by the organization1395
MWh fuel consumed for self-generation of electricity1395
MWh fuel consumed for self-generation of heat0
MWh fuel consumed for self-generation of steam<Not Applicable>
MWh fuel consumed for self-generation of cooling<Not Applicable>
MWh fuel consumed for self-cogeneration or self-trigeneration<Not Applicable>
Emission factor0.31612
Unitmetric tons CO2e per MWh
Emissions factor sourceFederal Register EPA; 40 CFR Part 98; e-CFR, March 9, 2018. Table C-1, Table C-2, Table AA-1.
CommentDiesel represents 662 MT CO2e of emissions
Fuels (excluding feedstocks)Liquefied Petroleum Gas (LPG)
Heating valueHHV (higher heating value)
Total fuel MWh consumed by the organization2890
MWh fuel consumed for self-generation of electricity0
MWh fuel consumed for self-generation of heat2890
MWh fuel consumed for self-generation of steam<Not Applicable>
MWh fuel consumed for self-generation of cooling<Not Applicable>
MWh fuel consumed for self-cogeneration or self-trigeneration<Not Applicable>
Emission factor0.22498
Unitmetric tons CO2e per MWh
Emissions factor sourceFederal Register EPA; 40 CFR Part 98; e-CFR, March 9, 2018. Table C-1, Table C-2, Table AA-1.
CommentLPG Represents 650 MT CO2e of emissions
C8.2d
CDP Page of 4636
(C8.2d) Provide details on the electricity, heat, steam, and cooling your organization has generated and consumed in the reporting year.
Total Gross generation(MWh)
Generation that is consumed by theorganization (MWh)
Gross generation from renewable sources(MWh)
Generation from renewable sources that is consumed by theorganization (MWh)
Electricity 1680 1680 285 285
Heat 107566 107566 0 0
Steam 0 0 0 0
Cooling 0 0 0 0
C8.2e
(C8.2e) Provide details on the electricity, heat, steam, and/or cooling amounts that were accounted for at a zero emission factor in the market-based Scope 2figure reported in C6.3.
Sourcing methodNone (no purchases of low-carbon electricity, heat, steam or cooling)
Low-carbon technology type<Not Applicable>
Country/region of consumption of low-carbon electricity, heat, steam or cooling<Not Applicable>
MWh consumed accounted for at a zero emission factor<Not Applicable>
CommentThere are no electricity, heat, steam, and/or cooling amounts that were accounted for at a zero emission factor in the market-based Scope 2 figure reported in C6.3. Pleasenote that our gross generation from onsite renewable resources (solar) has been accounted for in C8.2a and C8.2d.
C9. Additional metrics
C9.1
(C9.1) Provide any additional climate-related metrics relevant to your business.
C10. Verification
C10.1
(C10.1) Indicate the verification/assurance status that applies to your reported emissions.
Verification/assurance status
Scope 1 Third-party verification or assurance process in place
Scope 2 (location-based or market-based) Third-party verification or assurance process in place
Scope 3 Third-party verification or assurance process in place
C10.1a
CDP Page of 4637
(C10.1a) Provide further details of the verification/assurance undertaken for your Scope 1 emissions, and attach the relevant statements.
Verification or assurance cycle in placeAnnual process
Status in the current reporting yearComplete
Type of verification or assuranceLimited assurance
Attach the statementYUMBrandsInc GHG Report.pdf
Page/ section referenceEntire Document
Relevant standardAttestation standards established by AICPA (AT105)
Proportion of reported emissions verified (%)100
C10.1b
(C10.1b) Provide further details of the verification/assurance undertaken for your Scope 2 emissions and attach the relevant statements.
Scope 2 approachScope 2 location-based
Verification or assurance cycle in placeAnnual process
Status in the current reporting yearComplete
Type of verification or assuranceLimited assurance
Attach the statementYUMBrandsInc GHG Report.pdf
Page/ section referenceEntire Document
Relevant standardAttestation standards established by AICPA (AT105)
Proportion of reported emissions verified (%)100
Scope 2 approachScope 2 market-based
Verification or assurance cycle in placeAnnual process
Status in the current reporting yearComplete
Type of verification or assuranceLimited assurance
Attach the statementYUMBrandsInc GHG Report.pdf
Page/ section referenceEntire Document
Relevant standardAttestation standards established by AICPA (AT105)
Proportion of reported emissions verified (%)100
C10.1c
(C10.1c) Provide further details of the verification/assurance undertaken for your Scope 3 emissions and attach the relevant statements.
Scope 3 categoryScope 3: Purchased goods and services
Verification or assurance cycle in placeAnnual process
CDP Page of 4638
Status in the current reporting yearComplete
Type of verification or assuranceLimited assurance
Attach the statementYUMBrandsInc GHG Report.pdf
Page/section referenceEntire Document
Relevant standardAttestation standards established by AICPA (AT105)
Proportion of reported emissions verified (%)100
Scope 3 categoryScope 3: Upstream transportation and distribution
Verification or assurance cycle in placeAnnual process
Status in the current reporting yearComplete
Type of verification or assuranceLimited assurance
Attach the statementYUMBrandsInc GHG Report.pdf
Page/section referenceEntire Document
Relevant standardAttestation standards established by AICPA (AT105)
Proportion of reported emissions verified (%)100
Scope 3 categoryScope 3: Waste generated in operations
Verification or assurance cycle in placeAnnual process
Status in the current reporting yearComplete
Type of verification or assuranceLimited assurance
Attach the statementYUMBrandsInc GHG Report.pdf
Page/section referenceEntire Document
Relevant standardAttestation standards established by AICPA (AT105)
Proportion of reported emissions verified (%)100
Scope 3 categoryScope 3: Business travel
Verification or assurance cycle in placeAnnual process
Status in the current reporting yearComplete
Type of verification or assuranceLimited assurance
Attach the statementYUMBrandsInc GHG Report.pdf
Page/section referenceEntire Document
Relevant standardAttestation standards established by AICPA (AT105)
Proportion of reported emissions verified (%)100
CDP Page of 4639
Scope 3 categoryScope 3: Downstream transportation and distribution
Verification or assurance cycle in placeAnnual process
Status in the current reporting yearComplete
Type of verification or assuranceLimited assurance
Attach the statementYUMBrandsInc GHG Report.pdf
Page/section referenceEntire Document
Relevant standardAttestation standards established by AICPA (AT105)
Proportion of reported emissions verified (%)100
Scope 3 categoryScope 3: End-of-life treatment of sold products
Verification or assurance cycle in placeAnnual process
Status in the current reporting yearComplete
Type of verification or assuranceLimited assurance
Attach the statementYUMBrandsInc GHG Report.pdf
Page/section referenceEntire Document
Relevant standardAttestation standards established by AICPA (AT105)
Proportion of reported emissions verified (%)100
Scope 3 categoryScope 3: Franchises
Verification or assurance cycle in placeAnnual process
Status in the current reporting yearComplete
Type of verification or assuranceLimited assurance
Attach the statementYUMBrandsInc GHG Report.pdf
Page/section referenceEntire Document
Relevant standardAttestation standards established by AICPA (AT105)
Proportion of reported emissions verified (%)100
C10.2
(C10.2) Do you verify any climate-related information reported in your CDP disclosure other than the emissions figures reported in C6.1, C6.3, and C6.5?No, we do not verify any other climate-related information reported in our CDP disclosure
C11. Carbon pricing
CDP Page of 4640
C11.1
(C11.1) Are any of your operations or activities regulated by a carbon pricing system (i.e. ETS, Cap & Trade or Carbon Tax)?Yes
C11.1a
(C11.1a) Select the carbon pricing regulation(s) which impacts your operations.UK carbon price floor
C11.1c
(C11.1c) Complete the following table for each of the tax systems you are regulated by.
UK carbon price floor
Period start dateApril 20 2019
Period end dateMarch 20 2020
% of total Scope 1 emissions covered by tax4.7
Total cost of tax paid307006
CommentOur U.K. Market participates in The CLC, as regulated by the United Kingdom Carbon Price Floor. Submissions under this Scheme do not align directly with the reportingperiod of this disclosure. We have estimated the tax paid (in USD) based on energy consumption for equity operations. The percentage of emissions covered by the taxrepresents the proportion of total global Scope 1 and 2 (location-based) emissions reported for 2019.
C11.1d
(C11.1d) What is your strategy for complying with the systems you are regulated by or anticipate being regulated by?
The Yum! Government Affairs team actively monitors developing climate regulations. Any developments are brought to the attention of the Yum! and brand sustainabilityteams. At warranted, pending developments are reviewed and if deemed necessary included in our corporate risk analysis process. As done with other risks they areevaluated by the Yum! Risk Committee and elevated as necessary to the Audit Committee. For regulations already enacted, our market financial, tax and legal team work toensure our compliance with all laws. The U.K. Carbon Price Floor is a good example of how this has worked and we have integrated fulfilment of our obligations into ourstandard procedures.
C11.2
(C11.2) Has your organization originated or purchased any project-based carbon credits within the reporting period?No
C11.3
(C11.3) Does your organization use an internal price on carbon?No, and we do not currently anticipate doing so in the next two years
C12. Engagement
C12.1
(C12.1) Do you engage with your value chain on climate-related issues?Yes, our suppliersYes, other partners in the value chain
CDP Page of 4641
C12.1a
(C12.1a) Provide details of your climate-related supplier engagement strategy.
Type of engagementEngagement & incentivization (changing supplier behavior)
Details of engagementOther, please specify (Included climate change in supplier selection / management mechanism; Code of conduct featuring climate change KPIs; Collect climate change andcarbon information at least annually from suppliers; Suppliers follow our policy to remain suppliers)
% of suppliers by number28
% total procurement spend (direct and indirect)56
% of supplier-related Scope 3 emissions as reported in C6.572
Rationale for the coverage of your engagementOur Global Supplier Code of Conduct requires suppliers to ensure compliance with Yum’s sustainability policies and positions in our Global Citizenship and SustainabilityReport. Suppliers are also expected to develop appropriate environmental management systems that recognize the environmental impacts of their specific businessprocesses and monitor and report performance against improvement targets. Suppliers are expected to be leaders in meeting or exceeding environmental standards anddemonstrating year-over-year progress towards reducing the relative environmental footprint of their operations. We engage with suppliers where we feel that we have themost potential to have impact. Our engagement, through our sustainability survey is to drive progress. Palm oil and timber are two key supplier groups for Yum! that havethe potential to impact deforestation and impact climate change. Therefore we have prioritized these suppliers. We have long standing and clear policies and goalsassociated for each of these areas and have a clear definition of success. Success is defined by meeting our goals. We believe that working with our peers, suppliers,NGOs, and other internal and external stakeholders is essential to achieving our goal. That’s why we give preference to suppliers who are certified by the Roundtable onSustainable Palm Oil (RSPO) field. Yum! Brands will not knowingly buy paper-based packaging products that were made with fiber that comes from illegal or the followingunwanted sources: a. Wood harvested from forests that have been converted to plantations or non-forest use b. Wood from high conservation value forests, unless thoseforests are credibly certified c. Wood where the source forest and species are unknown d. Wood harvested in a manner that violates human rights e. Wood harvested thatviolates local or international laws
Impact of engagement, including measures of successWe are engaging with markets and suppliers on compliance with our policy to transition to sustainable palm oil and paper-based packaging. This policy contributes toreducing our environmental impact from undesirable palm in agricultural processes that have a negative impact on climate change. We conduct an annual survey ofsuppliers to measure progress, identify issue and create corrective actions. Results are reported in CDP-Forests. As a result of this process we have removed suppliersfrom our value chain and encouraged others to act more sustainability. Increasing procurement of certified fiber sources as well as recycled content is one of our climatechange strategies. Success of this engagement is measured via our annual surveys which inform our progress against our fiber and palm oil goals. This is a verymeasurable outcome driven effort.
CommentScope 3 emissions are estimated for corporate restaurants only. It is an approximation and subject to refinement as methods of estimation improve.
C12.1d
(C12.1d) Give details of your climate-related engagement strategy with other partners in the value chain.
In addition to engaging with our suppliers on climate-related issues, Yum! Brands will also engage other partners in the value chain, such as customer, shareholders andNGOs. Shareholder engagement occurs during the annual Proxy Vote as proposals are received and also occurs on an as-needed basis as groups bring relevant areas ofinterest to our attention. Our engagement strategy typically includes a comprehensive review of shareholder and NGO positions, often completed through conversations andwritten correspondence.
For example, in November 2018 Yum! Brands received a shareholder proposal from The Sisters of Charity of the Blessed Virgin Mary, with a request for Yum! Brands toissue a report on climate change mitigation strategies, assessing the feasibility of adopting quantitative, company-wide goals for increasing Yum! Brands' use of renewableenergy and any other measures to substantially reduce the company's greenhouse gas emissions. We reviewed, discussed and explored the proposal with the shareholderand associated groups. In recognition of our past progress and a new commitment to further study our greenhouse gas footprint and the feasibility of setting science-basedtargets, the shareholder withdrew the proposal. We are currently undertaking this work and maintain our commitment to our publicly-stated goal of reducing averagerestaurant energy use and greenhouse gas emissions by an additional 10 percent by the end of 2025. As part of this engaging we have kept the shareholder informed duringthe reporting year. This includes NGOs that they work with as well other NGOs who are active in the climate change space. For example, we worked with WWF on a Brazillandscape analysis. We also keep our customers informed though our Citizenship and Sustainability report which is posted online. It contains a summary of goals andprogress.
C12.3
(C12.3) Do you engage in activities that could either directly or indirectly influence public policy on climate-related issues through any of the following?Direct engagement with policy makersTrade associationsOther
C12.3a
CDP Page of 4642
(C12.3a) On what issues have you been engaging directly with policy makers?
Focus oflegislation
Corporateposition
Details of engagement Proposed legislative solution
Climatefinance
Support Petitioning Congress with other large corporate consumers of energy Enact legislation to support the creation of a direct pay option for theproduction tax credit (PTC)/investment tax credit (ITC) value to addressliquidity and tax equity availability issues for those same projects. Inaddition, it included request that Congress delay the PTC and ITCphasedowns to account for COVID-19 related economic and workforceimpacts.
Other,pleasespecify(FoodDonationenergyefficiencyand GHGReduction)
Support Our food donation program, Harvest, is focused on donating wholesome, surplus food from our restaurants tolocal food agencies, which diverts food waste from our restaurants and landfills. To encourage food donationprograms like Harvest, we engage with policy makers at the local, state and federal level, in addition to tradeassociations and other industry partners to enact policy that not only addresses food insecurity, but alsosupports a sustainable environment. Prepared food donation programs are EPA-verified as reducingGreenhouse Gas Emissions (GHG) from landfills and waste combustion. For every 5,100 pounds of preparedfood product donated, 5 tonnes of GHG emissions are saved from the atmosphere, equal to one passengervehicle. The program is currently most advanced in the US, however, we are working to expand itinternationally. In 2019, we were also able to donate food in countries including Argentina, Australia, Bahamas,Canada, Cost Rica, Dominican Republic, Ecuador, Guyana, Hong Kong, Italy, Malaysia, Malta, Mexico,Panama, Poland, Romania, Serbia, South Africa, Spain, Suriname, Thailand, Turkey and the United Kingdom.In the past, our Vice President of Global Government Affairs and Sustainability (Chief Sustainability Officer)attended the food waste meeting at the G7 in Bologna to advocate for food donation and its positive implicationsfor feeding the hungry and GHG avoidance.
In 2015, legislation providing a permanent food donation tax deductionwas passed at the federal level and similar legislation has been proposedin Kentucky, Massachusetts, Minnesota, New Jersey, New York, Ohio andPennsylvania. The enactment of a restaurant charitable food donation taxcredit helps address food insecurity, assists in moving towards a moresustainable environment and streamlines small business restaurantoperations. Yum! Brands is also seeking ways to expand the Harvestprogram overseas. For example, in 2017 our Government Affairs team, inconjunction with our global consultants and trade association partners,undertook education efforts in Italy to raise awareness for the Harvestprogram. The efforts highlighted both the economic and environmentalopportunities the program provides and potential legislative changesrequired for wide-scale implementation. Our hope is to broaden the workout across the EU in upcoming years.
C12.3b
(C12.3b) Are you on the board of any trade associations or do you provide funding beyond membership?Yes
C12.3c
CDP Page of 4643
(C12.3c) Enter the details of those trade associations that are likely to take a position on climate change legislation.
Trade associationU.S. Green Building Council
Is your position on climate change consistent with theirs?Consistent
Please explain the trade association’s positionThe USGBC is committed to the development of green buildings with one of the goals being to combat global climate change. The promotion of the LEED rating systemhelps to mitigate the contribution of buildings to climate change by promoting reductions through building operations energy use, transportation energy use, embodiedenergy and materials, water use, use of clean energy supplies, and promoting non-energy related drivers such as reforestation and refrigerant purchases.
How have you influenced, or are you attempting to influence their position?We have met with the USGBC in support of the development of the LEED rating system and sat on the Retail User Group-Retail and the LEED Pilot Credit Committee in thepast.
Trade associationNational Restaurant Association (NRA)
Is your position on climate change consistent with theirs?Consistent
Please explain the trade association’s positionThe NRA is committed to educating their members about environmental sustainability in the restaurant business and including how to minimize food waste. That’s why theyhave taken a leadership role, in partnership with the Food Waste Reduction Alliance, Grocery Manufacturers Association and the Food Marketing Institute, to reduce foodwaste in our industry. One of the main objectives of the group is to recycle unused food waste by diverting it from landfills.
How have you influenced, or are you attempting to influence their position?We partner closely with the NRA to encourage more food donation. Specifically, the NRA succeeded in getting Congress and the White House to encourage more fooddonation by permanently extending the enhanced tax deduction for food donations to smaller corporations. We currently serve on a number of committees includingSustainability Education, Supply Chain and Federal Affairs. Additionally, we partner with state and local restaurant associations to explore how the federal tax credit canapply at the state level.
Trade associationRoundtable for Sustainable Palm Oil (RSPO)
Is your position on climate change consistent with theirs?Consistent
Please explain the trade association’s positionThe Roundtable for Sustainable Palm Oil pursues the use of sustainable palm oil products across the globe. They maintain environmental and social criteria whichcompanies must comply to produce sustainable palm oil. RSPO looks to prevent tropical rainforest deforestation and peatland conversion which are contributors to globalclimate change
How have you influenced, or are you attempting to influence their position?Yum! Brands promotes the use of RSPO certified sustainable palm oil by continuing to report progress toward meeting our goal and discussing the importance ofsustainable palm oil in combatting deforestation and GHG emissions. We also continue to engage with the RSPO, including through participation in the JurisdictionalWorking Group, in support of market transformation.
Trade associationUS Chamber of Commerce
Is your position on climate change consistent with theirs?Consistent
Please explain the trade association’s positionThe Chamber believes that the climate is changing and humans are contributing to the changes. They also would like to see policymakers “seize on an approach that risesto the challenge of climate change, leveraging business leadership and expertise”
How have you influenced, or are you attempting to influence their position?We look for every opportunity to engage with stakeholders to educate and elaborate on our sustainability vision, strategy, and goals to make a positive impact.
C12.3e
(C12.3e) Provide details of the other engagement activities that you undertake.
We communicate with the United States Department of Energy through the Better Building Alliance via conferences and seminars on ways to measure energy consumptionand reduce the use of energy by retail businesses. In particular, among other topics we discuss are issues related to sustainable, recyclable or decreased takeout foodpackaging. Overall, we advocate for public policy that addresses climate change in a way that recognizes the real economic and operational challenges faced by ourbusiness.
Yum! Brands has been a member of the U.S. Green Building Council since 2008 and supports their mission to transform the design and construction industry to provide for agreener future. Our support includes participation in ongoing continuous improvement efforts in support of the LEED rating system through participation in the LEED UserGroup-Retail and LEED Pilot Committee where we advocate for clarity of process and the inclusion of sustainability issues relevant to the restaurant industry. We are alsoengaged in creating connecting and convening businesses, non-profits, government agencies and individuals in support of sustainability in our corporate hometown ofLouisville, Kentucky where actively support the efforts of the Louisville Sustainability Council. The efforts of this organization along with Metro Louisville, enabled the city to berecognized for its four-star sustainability efforts, including on climate change action, by Star Communities, now LEED for Cities. We support the community’s goal of reducinggreenhouse gas emissions by 80% by 2050.
CDP Page of 4644
C12.3f
(C12.3f) What processes do you have in place to ensure that all of your direct and indirect activities that influence policy are consistent with your overall climatechange strategy?
Our sustainability governance structure helps to ensure that any activities which may influence policy (direct or indirect) are consistent with our overall environmentalsustainability strategy. The Yum! Brands Government Affairs and Global Sustainability teams are closely linked and managed by our Vice President of Global GovernmentAffairs and Sustainability (Chief Sustainability Officer). In addition, our Yum! Communications team manages communications to coordinate consistent communicationsregarding ESG issues such as climate change. All three groups are part of our broader ESG Council that involves representatives of our brands. This group works oncollective strategy and KPI execution and is responsible for communications up and down their portion of the business, regardless of geographic location, so that sustainabilitydiscussions and decisions can be communicated across the organization. Our strategy is influenced by our belief that we have a responsibility to reduce our environmentalimpact and the resulting greenhouse gas emissions that contribute to climate change, and we recognize that direct engagement with policy makers has the potential to drivechanges in legislation that will support our efforts along this journey.
C12.4
(C12.4) Have you published information about your organization’s response to climate change and GHG emissions performance for this reporting year in placesother than in your CDP response? If so, please attach the publication(s).
PublicationIn mainstream reports
StatusComplete
Attach the document2019 Definitive Proxy Statement.pdf
Page/Section reference2019 Proxy Statement, Matters Requiring Shareholder Action Section
Content elementsGovernanceStrategyRisks & opportunities
CommentYum! Brands takes our role as a global citizen and our impact on society and the environment seriously. In addition to our CDP disclosures, we report in mainstream reportssuch as our Annual Report. Our 2019 Annual Report included the risks from Climate change in our 10K, Item 1A as well as in Proxy Statement where deforestation isdiscussed.
PublicationIn voluntary sustainability report
StatusComplete
Attach the document2018 Recipe for Good Progress Update Peformance Summary.pdf
Page/Section referencePlanet and Citizenship Sections
Content elementsGovernanceStrategyRisks & opportunitiesEmissions figuresEmission targetsOther metrics
CommentYum! Brands takes our role as a global citizen and our impact on society and the environment seriously. In addition to our CDP disclosures, we report our progress andperformance in voluntary communications such as our biennial Global Citizenship & Sustainability Report. As such, we have attached our 2018 Progress Update. The 2019report is anticipated to be released in September.
PublicationIn voluntary communications
StatusComplete
Attach the document2018 Recipe for Good Progress Update Peformance Summary.pdf
Page/Section referenceEntire Article
Content elementsStrategy
CommentWe announced our commitment to pursue a study to evaluate the feasibility science-based target to reduce greenhouse gas emissions from our operations, franchises and
CDP Page of 4645
supply chain, as well as to explore purchasing renewable energy.
PublicationIn voluntary communications
StatusComplete
Attach the documentTACO BELL® 2020 NEW COMMITMENTS.pdf
Page/Section referenceEntire article
Content elementsStrategy
CommentTaco Bell announced that it will make all consumer-facing packaging recyclable, compostable or reusable by 2025 as well as add recycling/composing bins in restaurants,where infrastructure permits, by the same year.
PublicationIn voluntary communications
StatusComplete
Attach the document100 Best Corporate Citizens of 2020.pdf
Page/Section referenceEntire article
Content elementsOther, please specify (Recognition)
CommentYum! Brands has been named to the 100 Best Corporate Citizens list by Corporate Responsibility Magazine for our continued commitment to being a good corporatesteward.
C15. Signoff
C-FI
(C-FI) Use this field to provide any additional information or context that you feel is relevant to your organization's response. Please note that this field is optionaland is not scored.
C15.1
(C15.1) Provide details for the person that has signed off (approved) your CDP climate change response.
Job title Corresponding job category
Row 1 Chief Executive Officer Chief Executive Officer (CEO)
Submit your response
In which language are you submitting your response?English
Please confirm how your response should be handled by CDP
I am submitting to Public or Non-Public Submission
I am submitting my response Investors Public
Please confirm belowI have read and accept the applicable Terms
CDP Page of 4646
CDP Corporate Amendment Request Form Climate change 2020/Forests 2020/Water Security 2020 How to use this document This amendment form should be used in conjunction with CDP’s Response Amendment Policy. Completed forms should be returned to
[email protected]. Once your response is amended, you will receive confirmation by email.
This amendment form can be used for CDP’s climate change, forests, and water security questionnaires including all sector specific and supply chain questions.
A new form must be used per questionnaire and year. For example, if you wish to make changes to a 2020 forests submission and a 2020 water security submission you will need two forms. Specify this information in the first table below.
Amendments to certain questions will be made free of charge where there is a significant difference. Please note, this is limited to correcting errors in the data provided. CDP reserves the right to make amendments only where there is a significant difference. Typing errors in text fields and other questions may be amended, at our discretion, for a fee. Please be aware that in the case of an answer being in a table format, this therefore means that not all columns will be amended free of charge, only those columns containing key data points. For further information, please see our amendment policy.
Please complete your amendment details in the table below. Specify the question number including, where relevant, the row and column number (Question). Specify the information as it currently exists (Current), and as you would like it to be now (Amended). Please enter the entire revised answer text in this field, not just individual words. Specify the reason for each individual amendment (Reason for amendment), e.g. “typo in original submission” or “wrong units used in original submission”. If the required change is not clear, then we may need to return your form and the amendment will be delayed.
Please refer to the reporting guidance whilst completing this form to ensure your new value is possible in the ORS. Certain question types have restrictions in place such as text fields have character limits, numerical fields have ranges and decimal point limitations, and select (single or multi) questions can only be answered from a set list of values.
If your amendment includes adding new attachments, please list them below and attach them in the email alongside this document to [email protected]
CDP Corporate Amendment Request Form
Version 2.0, November 23, 2018 For amendment purposes only
2
Organization Yum! Brands
Questionnaire
(e.g. Climate change 2020, Water security 2020 etc) Climate Change 2020
If your amendment includes adding new attachments, please list them below and send by email with this document to [email protected]
Filename (Example: annual_report_2019.pdf)
Question (including row and/or column number where relevant)
N/A N/A
N/A N/A Please continue in further rows if required.
CDP Corporate Amendment Request Form
Version 2.0, November 23, 2018 For amendment purposes only
3
Please use the relevant guidance to check whether your answer is restricted, e.g. some questions offer a drop down list of options and do not allow free text. Please refer to the amendment policy for questions which can be amendment for free.
Question
(including row and/or column number where relevant)
Current response (or if new row to be added, write “ADD”)
Amended response (or if to be deleted, write “DELETE”)
Reason for amendment
Question: C8.2a Row: Consumption of purchased or acquired electricity Column: MWh from renewable sources
149,776 76,668 Incorrect percentage of renewables used in original submittal.
Question: C8.2a Row: Consumption of purchased or acquired electricity Column: MWh from non-renewable sources
139,566 212,674 Incorrect percentage of renewables used in original submittal.
Question: C8.2a Row: Total Energy Consumption Column: MWh from renewable sources
150,061 76,953 Incorrect percentage of renewables used in original submittal.
Question: C8.2a Row: Total Energy Consumption Column: MWh from non-renewable sources
260,134 333,242 Incorrect percentage of renewables used in original submittal.
Please continue in further rows if required.