Yuba Foothills Biomass Feasibility Study - Home … Foothills Biomass Feasibility Study TSS...
84
Yuba Foothills Biomass Feasibility Study Lake of the Springs, Yuba County prepared for: High Sierra Resource Conservation and Development Council & Yuba County Watershed Protection and Fire Safe Council prepared by TSS Consultants Rancho Cordova, CA December 2010
Transcript of Yuba Foothills Biomass Feasibility Study - Home … Foothills Biomass Feasibility Study TSS...
Yuba Foothills Biomass Feasibility Study
Lake of the Springs, Yuba County
prepared for:
High Sierra Resource Conservation and Development Council
&
Yuba County Watershed Protection and Fire Safe Council
prepared by
TSS Consultants Rancho Cordova, CA
December 2010
Yuba Foothills Biomass Feasibility Study TSS Consultants - December 2010
i
Yuba Foothills Biomass Feasibility Study
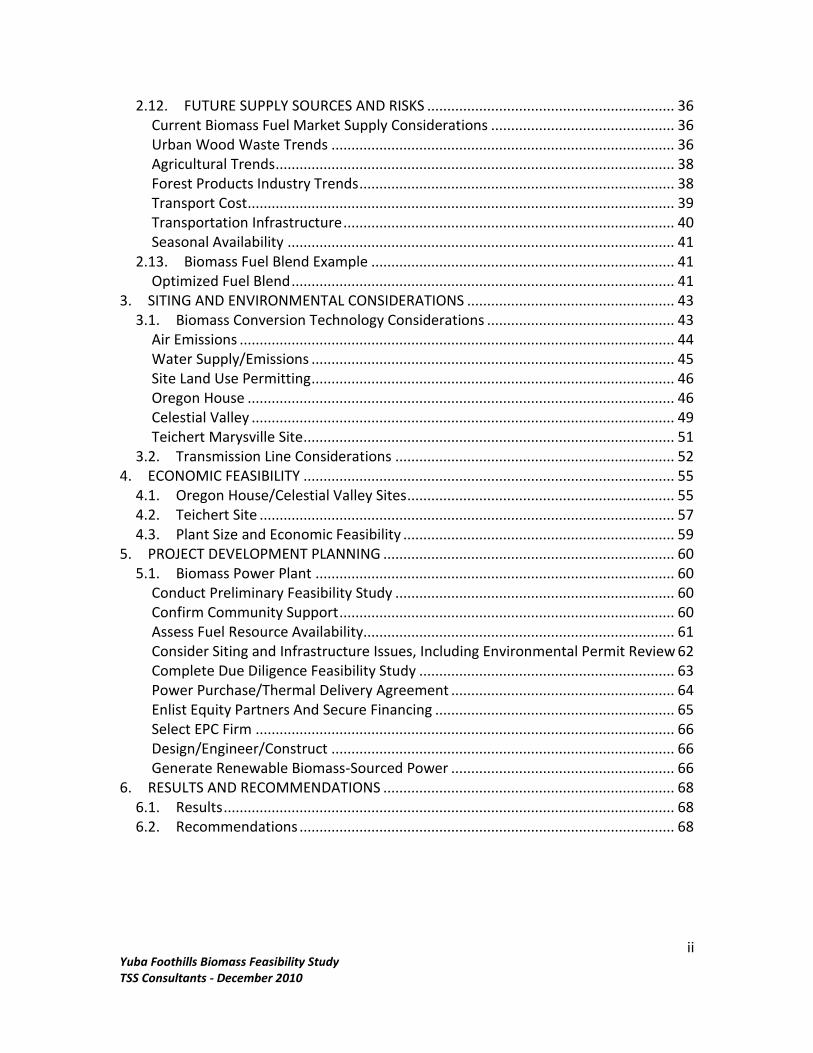
TABLE OF CONTENTS
1. INTRODUCTION ............................................................................................................ 1 1.1. Phase I Study ......................................................................................................... 1
Potential Sites ............................................................................................................. 1 Estimated Biomass Fuel in Study Area ........................................................................ 5 Estimated Range of Biomass Fuel Costs ..................................................................... 8 Potential Size of Biomass Facility ................................................................................ 9 Estimated Cost of Power Plant Equipment ................................................................. 9 Key Project Partners.................................................................................................. 10
1.2. Phase II Study ...................................................................................................... 11 2. BIOMASS RESOURCE ANALYSIS ................................................................................. 13
2.1. Biomass Fuel Supply Target Study Area ............................................................. 13 2.2. Biomass Fuel Types ............................................................................................. 14 2.3. Urban Fuel Sources ............................................................................................. 15
Urban Wood Waste .................................................................................................. 15 Tree Trimmings ......................................................................................................... 15
2.4. Agriculture Fuel Sources ..................................................................................... 17 Nut Crop Orchard Removals ..................................................................................... 17 Stone Fruit Orchard Removals .................................................................................. 17 Citrus Orchard Removals .......................................................................................... 18 Orchard Prunings ...................................................................................................... 18 Food Processing Residuals (Nut Shells, Olive Pits, Stone Fruit Processing Residuals)................................................................................................................................... 19 Leached Rice Straw ................................................................................................... 19
2.5. Forest Fuel Sources ............................................................................................. 22 Timber Harvest Residuals ......................................................................................... 22 Fuel Reduction/Forest Restoration Residuals .......................................................... 24 Sawmill Residuals ...................................................................................................... 25
2.6. Summary of Biomass Material Availability ......................................................... 27 2.7. Demand for Biomass Fuel ................................................................................... 28 2.8. Potential Biomass Fuel Competition .................................................................. 30 2.9. Supply and Demand Estimates ........................................................................... 32 2.10. Biomass Fuel Supply Availability Finding .......................................................... 33 2.11. Biomass Fuel Pricing ......................................................................................... 33
Current Fuel Supply Chain Infrastructure ................................................................. 33 Use of Collection Yards ............................................................................................. 34 Biomass Fuel Market Prices ...................................................................................... 34 Economics of Rice Straw Collection And Transportation ......................................... 35
Yuba Foothills Biomass Feasibility Study TSS Consultants - December 2010
ii
2.12. FUTURE SUPPLY SOURCES AND RISKS .............................................................. 36 Current Biomass Fuel Market Supply Considerations .............................................. 36 Urban Wood Waste Trends ...................................................................................... 36 Agricultural Trends .................................................................................................... 38 Forest Products Industry Trends ............................................................................... 38 Transport Cost ........................................................................................................... 39 Transportation Infrastructure ................................................................................... 40 Seasonal Availability ................................................................................................. 41
2.13. Biomass Fuel Blend Example ............................................................................ 41 Optimized Fuel Blend ................................................................................................ 41
3. SITING AND ENVIRONMENTAL CONSIDERATIONS .................................................... 43 3.1. Biomass Conversion Technology Considerations ............................................... 43
Air Emissions ............................................................................................................. 44 Water Supply/Emissions ........................................................................................... 45 Site Land Use Permitting ........................................................................................... 46 Oregon House ........................................................................................................... 46 Celestial Valley .......................................................................................................... 49 Teichert Marysville Site ............................................................................................. 51
3.2. Transmission Line Considerations ...................................................................... 52 4. ECONOMIC FEASIBILITY ............................................................................................. 55
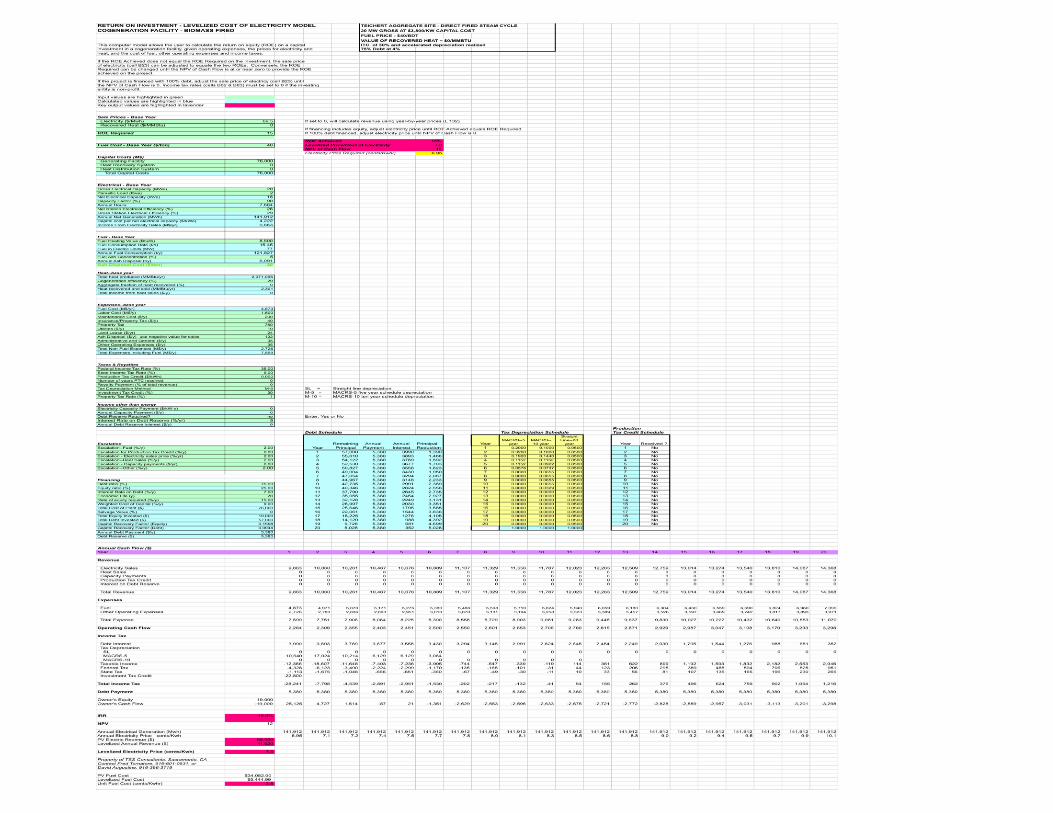
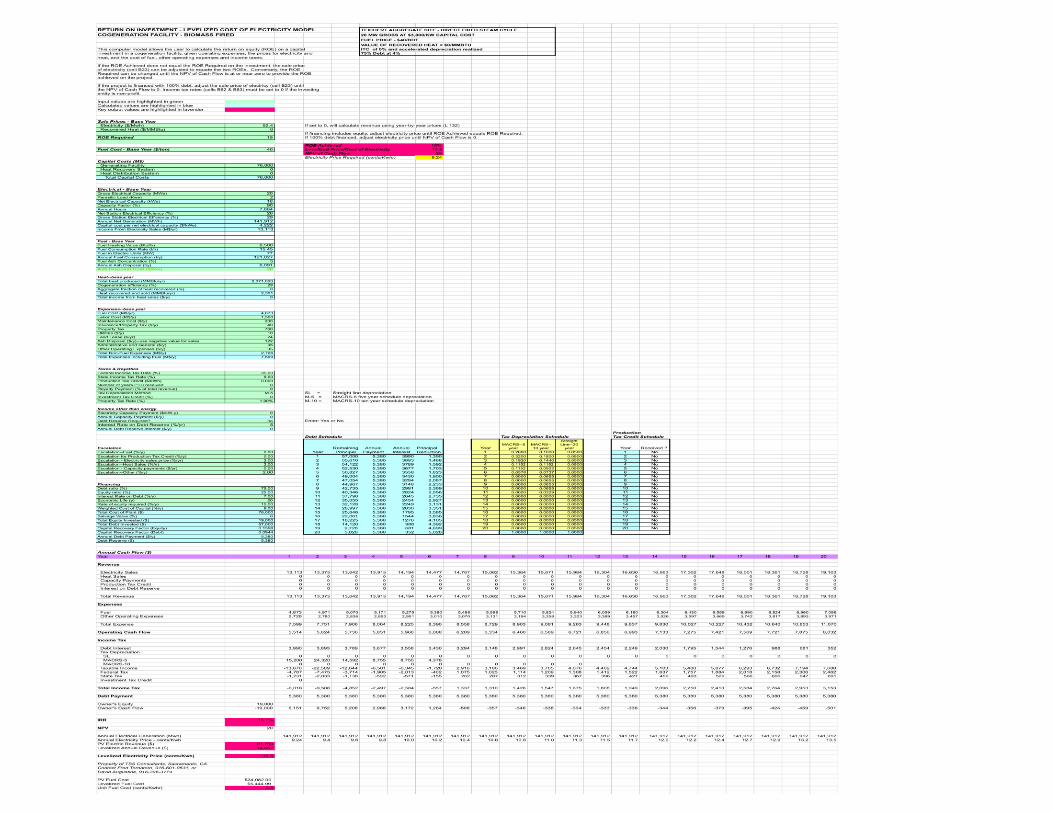
4.1. Oregon House/Celestial Valley Sites ................................................................... 55 4.2. Teichert Site ........................................................................................................ 57 4.3. Plant Size and Economic Feasibility .................................................................... 59
5. PROJECT DEVELOPMENT PLANNING ......................................................................... 60 5.1. Biomass Power Plant .......................................................................................... 60
Conduct Preliminary Feasibility Study ...................................................................... 60 Confirm Community Support .................................................................................... 60 Assess Fuel Resource Availability .............................................................................. 61 Consider Siting and Infrastructure Issues, Including Environmental Permit Review 62 Complete Due Diligence Feasibility Study ................................................................ 63 Power Purchase/Thermal Delivery Agreement ........................................................ 64 Enlist Equity Partners And Secure Financing ............................................................ 65 Select EPC Firm ......................................................................................................... 66 Design/Engineer/Construct ...................................................................................... 66 Generate Renewable Biomass-Sourced Power ........................................................ 66
6. RESULTS AND RECOMMENDATIONS ......................................................................... 68 6.1. Results ................................................................................................................. 68 6.2. Recommendations .............................................................................................. 68
Yuba Foothills Biomass Feasibility Study TSS Consultants - December 2010
iii
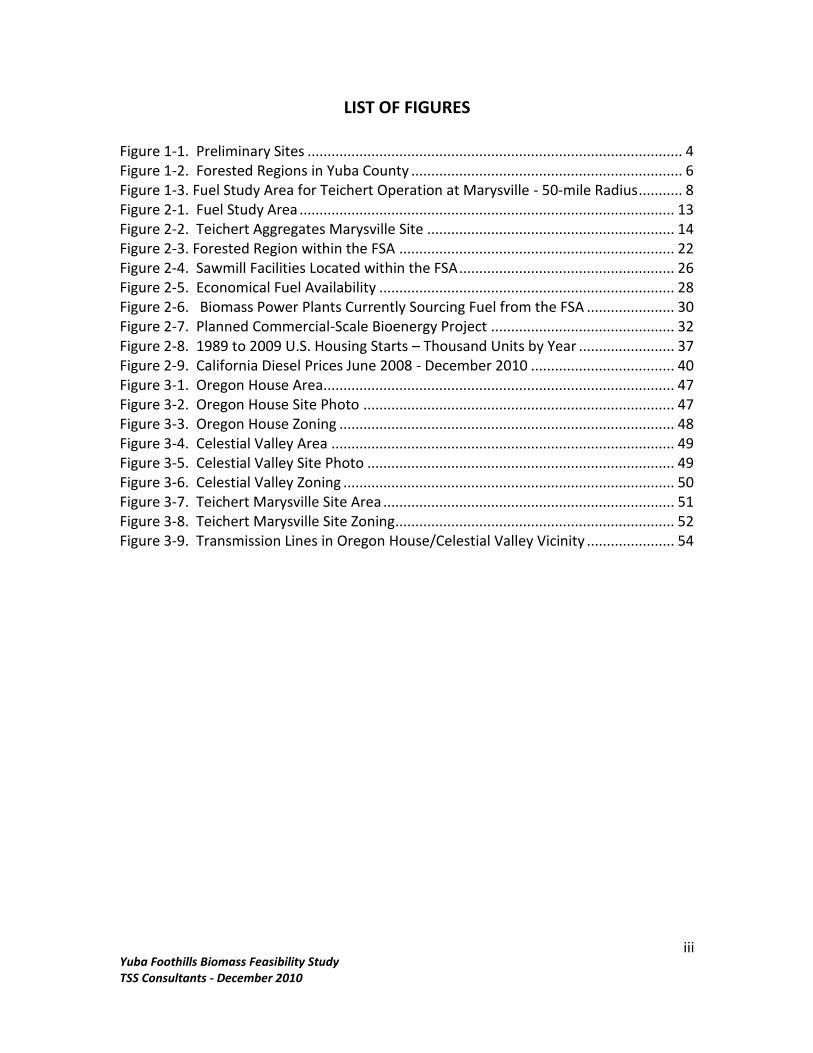
LIST OF FIGURES
Figure 1-1. Preliminary Sites .............................................................................................. 4 Figure 1-2. Forested Regions in Yuba County .................................................................... 6 Figure 1-3. Fuel Study Area for Teichert Operation at Marysville - 50-mile Radius ........... 8 Figure 2-1. Fuel Study Area .............................................................................................. 13 Figure 2-2. Teichert Aggregates Marysville Site .............................................................. 14 Figure 2-3. Forested Region within the FSA ..................................................................... 22 Figure 2-4. Sawmill Facilities Located within the FSA ...................................................... 26 Figure 2-5. Economical Fuel Availability .......................................................................... 28 Figure 2-6. Biomass Power Plants Currently Sourcing Fuel from the FSA ...................... 30 Figure 2-7. Planned Commercial-Scale Bioenergy Project .............................................. 32 Figure 2-8. 1989 to 2009 U.S. Housing Starts – Thousand Units by Year ........................ 37 Figure 2-9. California Diesel Prices June 2008 - December 2010 .................................... 40 Figure 3-1. Oregon House Area ........................................................................................ 47 Figure 3-2. Oregon House Site Photo .............................................................................. 47 Figure 3-3. Oregon House Zoning .................................................................................... 48 Figure 3-4. Celestial Valley Area ...................................................................................... 49 Figure 3-5. Celestial Valley Site Photo ............................................................................. 49 Figure 3-6. Celestial Valley Zoning ................................................................................... 50 Figure 3-7. Teichert Marysville Site Area ......................................................................... 51 Figure 3-8. Teichert Marysville Site Zoning ...................................................................... 52 Figure 3-9. Transmission Lines in Oregon House/Celestial Valley Vicinity ...................... 54
Yuba Foothills Biomass Feasibility Study TSS Consultants - December 2010
iv
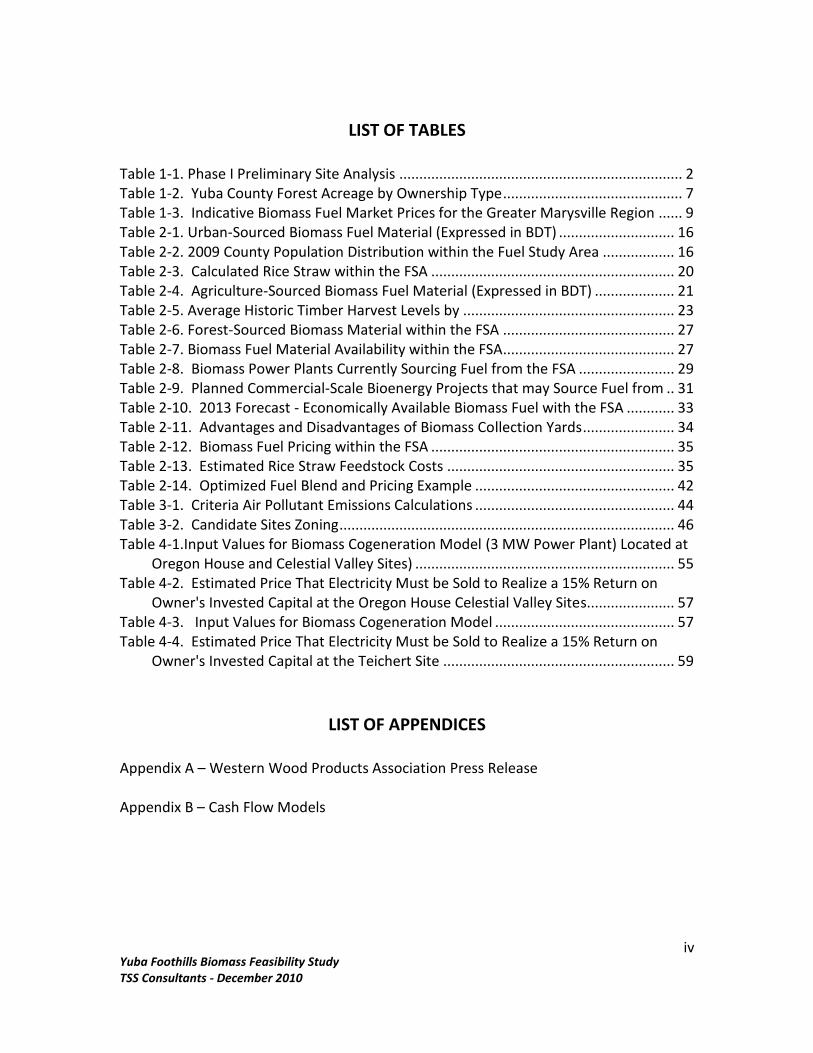
LIST OF TABLES
Table 1-1. Phase I Preliminary Site Analysis ....................................................................... 2 Table 1-2. Yuba County Forest Acreage by Ownership Type ............................................. 7 Table 1-3. Indicative Biomass Fuel Market Prices for the Greater Marysville Region ...... 9 Table 2-1. Urban-Sourced Biomass Fuel Material (Expressed in BDT) ............................. 16 Table 2-2. 2009 County Population Distribution within the Fuel Study Area .................. 16 Table 2-3. Calculated Rice Straw within the FSA ............................................................. 20 Table 2-4. Agriculture-Sourced Biomass Fuel Material (Expressed in BDT) .................... 21 Table 2-5. Average Historic Timber Harvest Levels by ..................................................... 23 Table 2-6. Forest-Sourced Biomass Material within the FSA ........................................... 27 Table 2-7. Biomass Fuel Material Availability within the FSA ........................................... 27 Table 2-8. Biomass Power Plants Currently Sourcing Fuel from the FSA ........................ 29 Table 2-9. Planned Commercial-Scale Bioenergy Projects that may Source Fuel from .. 31 Table 2-10. 2013 Forecast - Economically Available Biomass Fuel with the FSA ............ 33 Table 2-11. Advantages and Disadvantages of Biomass Collection Yards ....................... 34 Table 2-12. Biomass Fuel Pricing within the FSA ............................................................. 35 Table 2-13. Estimated Rice Straw Feedstock Costs ......................................................... 35 Table 2-14. Optimized Fuel Blend and Pricing Example .................................................. 42 Table 3-1. Criteria Air Pollutant Emissions Calculations .................................................. 44 Table 3-2. Candidate Sites Zoning .................................................................................... 46 Table 4-1.Input Values for Biomass Cogeneration Model (3 MW Power Plant) Located at
Oregon House and Celestial Valley Sites) ................................................................. 55 Table 4-2. Estimated Price That Electricity Must be Sold to Realize a 15% Return on
Owner's Invested Capital at the Oregon House Celestial Valley Sites ...................... 57 Table 4-3. Input Values for Biomass Cogeneration Model ............................................. 57 Table 4-4. Estimated Price That Electricity Must be Sold to Realize a 15% Return on
Owner's Invested Capital at the Teichert Site .......................................................... 59
LIST OF APPENDICES
Appendix A – Western Wood Products Association Press Release Appendix B – Cash Flow Models
Yuba Foothills Biomass Feasibility Study TSS Consultants - December 2010
1
1. Introduction
1.1. Phase I Study
The Yuba County Water Protection and Fire Safe Council (the “Council”), via the High Sierra Resource Conservation and Development Council, originally retained TSS Consultants (TSS) to conduct a Phase I – Prefeasibility Analysis prior to a more complete feasibility analysis of the potential for siting a Yuba County biomass fired power generation facility. The Phase I analysis activities consisted of the following:
Reviewing potential sites for a biomass facility and preliminary evaluation;
Surveying industrial forest landowners and public land managers at the Tahoe National Forest and Plumas National Forest to estimate how much fuel tributary to a small biomass power generation facility located in the foothills of Yuba County, could potentially be available;
Estimating the cost of biomass fuel delivered to a biomass power generation facility;
Estimating potential size of a biomass facility, probably as a range of sizes;
Estimating cost of power plant system;
Identifying key partners;
Preparing a summary report summarizing results of above and recommendations for Phase II.
During Phase I it was also learned that there was potential for a biomass power plant at the Teichert Aggregate Marysville (Teichert) site, located 7 miles east of Marysville. Because of the direct effect such a plant might have on any small-scale plant siting in the Yuba County foothills, the potential siting and biomass resources available for a Teichert plant was incorporated into the Phase I study.
Potential Sites
The Council identified eight sites as possible sites for a small-scale biomass fired power plant. These sites are:
Camptonville - in town sawmill site
Camptonville – Celestial Valley sawmill site
Yuba Foothills Biomass Feasibility Study TSS Consultants - December 2010
2
Dobbins- Ingersol sawmill site
Oregon House - Siller sawmill site
Soper Ranch (Willow Glenn Road access)
Mollaly Meadow
Gellerman
Slapjack (La Porte Road access near Woodleaf)
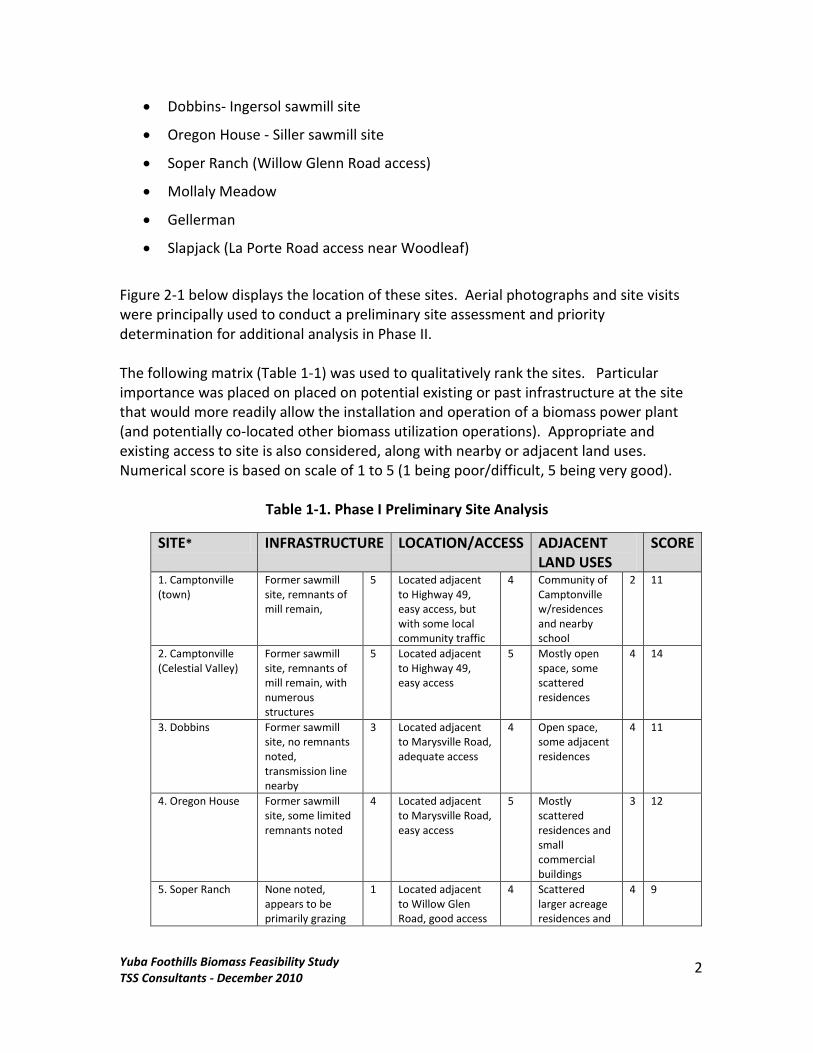
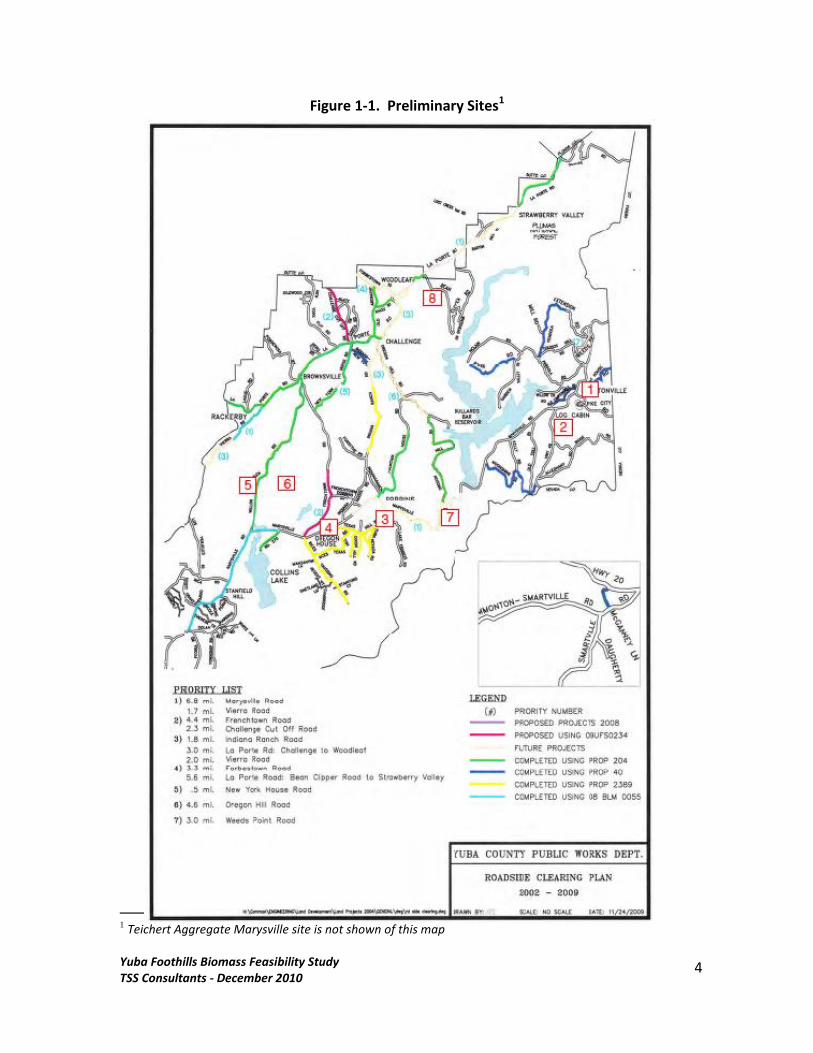
Figure 2-1 below displays the location of these sites. Aerial photographs and site visits were principally used to conduct a preliminary site assessment and priority determination for additional analysis in Phase II. The following matrix (Table 1-1) was used to qualitatively rank the sites. Particular importance was placed on placed on potential existing or past infrastructure at the site that would more readily allow the installation and operation of a biomass power plant (and potentially co-located other biomass utilization operations). Appropriate and existing access to site is also considered, along with nearby or adjacent land uses. Numerical score is based on scale of 1 to 5 (1 being poor/difficult, 5 being very good).
Table 1-1. Phase I Preliminary Site Analysis
SITE* INFRASTRUCTURE LOCATION/ACCESS ADJACENT LAND USES
SCORE
1. Camptonville (town)
Former sawmill site, remnants of mill remain,
5 Located adjacent to Highway 49, easy access, but with some local community traffic
4 Community of Camptonville w/residences and nearby school
2 11
2. Camptonville (Celestial Valley)
Former sawmill site, remnants of mill remain, with numerous structures
5 Located adjacent to Highway 49, easy access
5 Mostly open space, some scattered residences
4 14
3. Dobbins Former sawmill site, no remnants noted, transmission line nearby
3 Located adjacent to Marysville Road, adequate access
4 Open space, some adjacent residences
4 11
4. Oregon House Former sawmill site, some limited remnants noted
4 Located adjacent to Marysville Road, easy access
5 Mostly scattered residences and small commercial buildings
3 12
5. Soper Ranch None noted, appears to be primarily grazing
1 Located adjacent to Willow Glen Road, good access
4 Scattered larger acreage residences and
4 9
Yuba Foothills Biomass Feasibility Study TSS Consultants - December 2010
3
SITE* INFRASTRUCTURE LOCATION/ACCESS ADJACENT LAND USES
SCORE
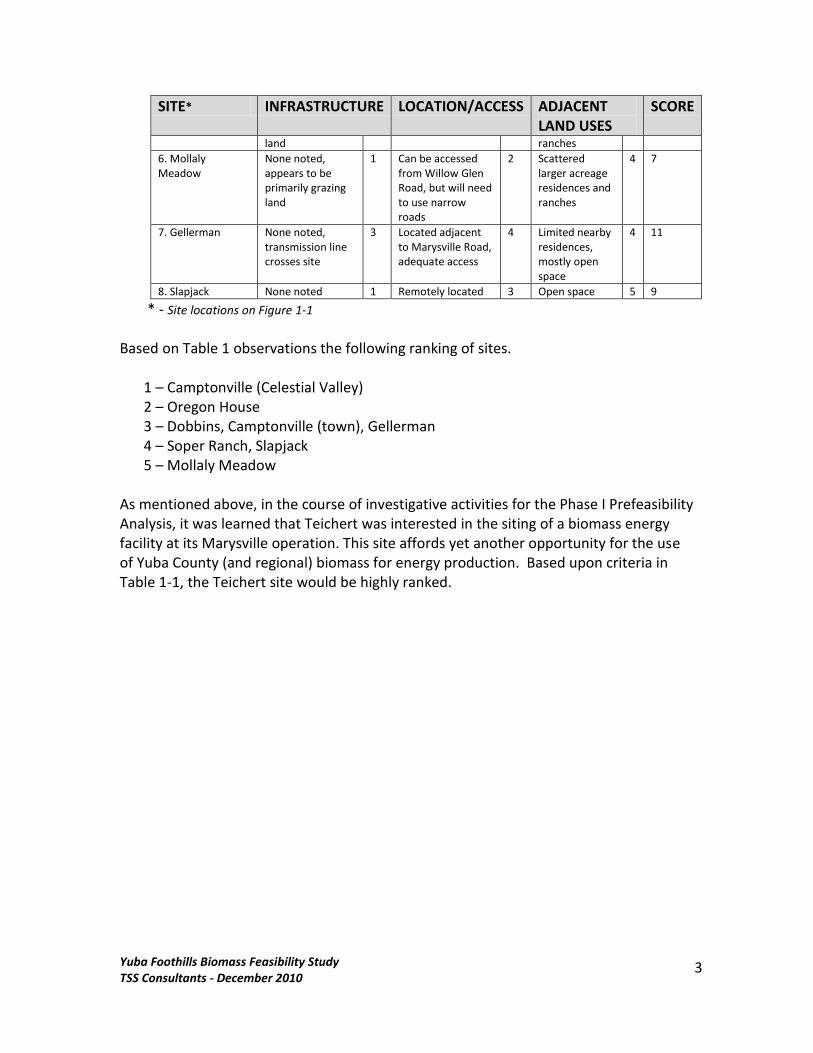
land ranches
6. Mollaly Meadow
None noted, appears to be primarily grazing land
1 Can be accessed from Willow Glen Road, but will need to use narrow roads
2 Scattered larger acreage residences and ranches
4 7
7. Gellerman None noted, transmission line crosses site
3 Located adjacent to Marysville Road, adequate access
4 Limited nearby residences, mostly open space
4 11
8. Slapjack None noted 1 Remotely located 3 Open space 5 9
* - Site locations on Figure 1-1
Based on Table 1 observations the following ranking of sites.
1 – Camptonville (Celestial Valley) 2 – Oregon House 3 – Dobbins, Camptonville (town), Gellerman 4 – Soper Ranch, Slapjack 5 – Mollaly Meadow
As mentioned above, in the course of investigative activities for the Phase I Prefeasibility Analysis, it was learned that Teichert was interested in the siting of a biomass energy facility at its Marysville operation. This site affords yet another opportunity for the use of Yuba County (and regional) biomass for energy production. Based upon criteria in Table 1-1, the Teichert site would be highly ranked.
Yuba Foothills Biomass Feasibility Study TSS Consultants - December 2010
4
Figure 1-1. Preliminary Sites1
1 Teichert Aggregate Marysville site is not shown of this map
Yuba Foothills Biomass Feasibility Study TSS Consultants - December 2010
5
Estimated Biomass Fuel in Study Area
TSS conducted a Phase I summary review of biomass fuel availability for both the Yuba County region and the region located within a 50-mile radius of the Teichert site. Summarized below are the findings.
Yuba County
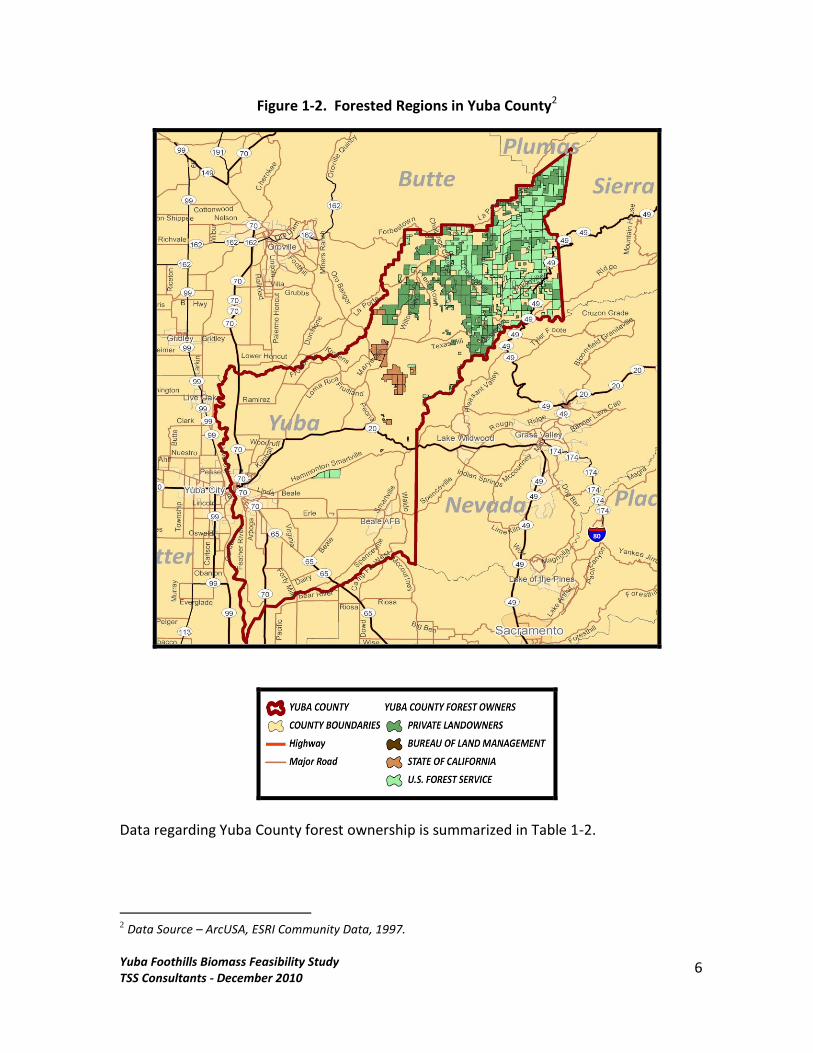
Using GIS analysis techniques TSS generated a map (see Figure 1-2 below) that highlights the location of private, state and federally managed forestlands within Yuba County. A primary driver in support of a biomass power generation facility in Yuba County is stakeholder interest for increased fuels treatment activities to mitigate wildfire behavior. In the Phase I review TSS focused primarily on the potential for collection, processing, and transport of biomass generated from forest operations.
Yuba Foothills Biomass Feasibility Study TSS Consultants - December 2010
6
Figure 1-2. Forested Regions in Yuba County2
Data regarding Yuba County forest ownership is summarized in Table 1-2.
2 Data Source – ArcUSA, ESRI Community Data, 1997.
Yuba Foothills Biomass Feasibility Study TSS Consultants - December 2010
7
Table 1-2. Yuba County Forest Acreage by Ownership Type
FOREST OWNERSHIP TYPE ACRES
Bureau of Land Management 50
Private 34,725
State of California 5,100
Plumas National Forest 23,000
Tahoe National Forest 20,900
TOTAL 83,775
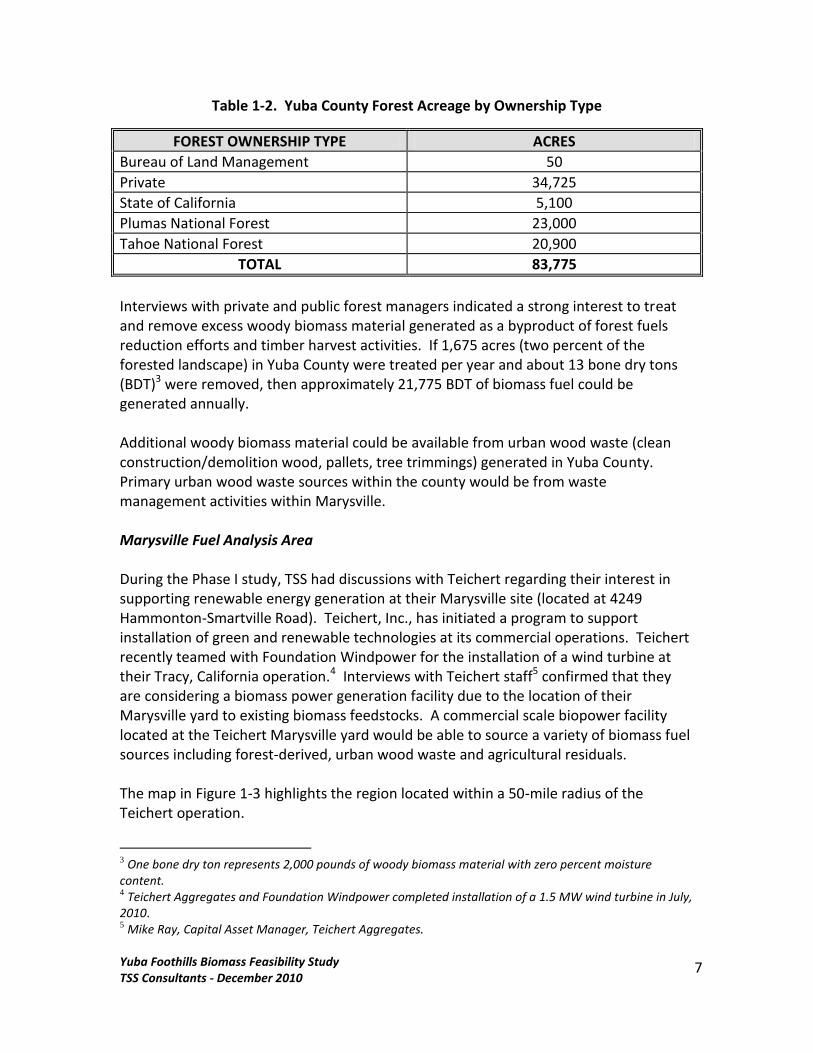
Interviews with private and public forest managers indicated a strong interest to treat and remove excess woody biomass material generated as a byproduct of forest fuels reduction efforts and timber harvest activities. If 1,675 acres (two percent of the forested landscape) in Yuba County were treated per year and about 13 bone dry tons (BDT)3 were removed, then approximately 21,775 BDT of biomass fuel could be generated annually. Additional woody biomass material could be available from urban wood waste (clean construction/demolition wood, pallets, tree trimmings) generated in Yuba County. Primary urban wood waste sources within the county would be from waste management activities within Marysville. Marysville Fuel Analysis Area During the Phase I study, TSS had discussions with Teichert regarding their interest in supporting renewable energy generation at their Marysville site (located at 4249 Hammonton-Smartville Road). Teichert, Inc., has initiated a program to support installation of green and renewable technologies at its commercial operations. Teichert recently teamed with Foundation Windpower for the installation of a wind turbine at their Tracy, California operation.4 Interviews with Teichert staff5 confirmed that they are considering a biomass power generation facility due to the location of their Marysville yard to existing biomass feedstocks. A commercial scale biopower facility located at the Teichert Marysville yard would be able to source a variety of biomass fuel sources including forest-derived, urban wood waste and agricultural residuals. The map in Figure 1-3 highlights the region located within a 50-mile radius of the Teichert operation.
3 One bone dry ton represents 2,000 pounds of woody biomass material with zero percent moisture
content. 4 Teichert Aggregates and Foundation Windpower completed installation of a 1.5 MW wind turbine in July,
2010. 5 Mike Ray, Capital Asset Manager, Teichert Aggregates.
Yuba Foothills Biomass Feasibility Study TSS Consultants - December 2010
8
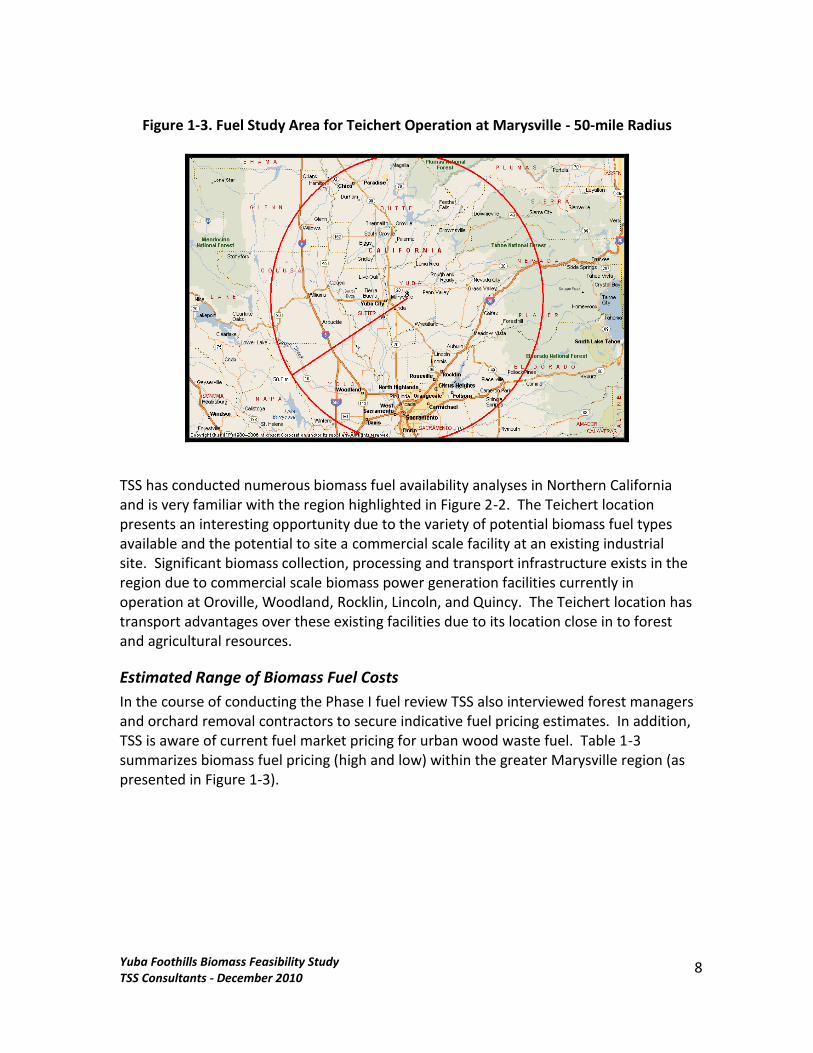
Figure 1-3. Fuel Study Area for Teichert Operation at Marysville - 50-mile Radius
TSS has conducted numerous biomass fuel availability analyses in Northern California and is very familiar with the region highlighted in Figure 2-2. The Teichert location presents an interesting opportunity due to the variety of potential biomass fuel types available and the potential to site a commercial scale facility at an existing industrial site. Significant biomass collection, processing and transport infrastructure exists in the region due to commercial scale biomass power generation facilities currently in operation at Oroville, Woodland, Rocklin, Lincoln, and Quincy. The Teichert location has transport advantages over these existing facilities due to its location close in to forest and agricultural resources.
Estimated Range of Biomass Fuel Costs
In the course of conducting the Phase I fuel review TSS also interviewed forest managers and orchard removal contractors to secure indicative fuel pricing estimates. In addition, TSS is aware of current fuel market pricing for urban wood waste fuel. Table 1-3 summarizes biomass fuel pricing (high and low) within the greater Marysville region (as presented in Figure 1-3).
Yuba Foothills Biomass Feasibility Study TSS Consultants - December 2010
9
Table 1-3. Indicative Biomass Fuel Market Prices for the Greater Marysville Region
BIOMASS FUEL TYPE LOW PRICE RANGE ($/BDT) HIGH PRICE RANGE ($/BDT)
Timber Harvest Residuals $30 $38
Forest Fuels Treatment $37 $54
Orchard Removals $29 $36
Urban Wood Waste $23 $32
As can be seen in the Table 1-3 above, forest sourced biomass fuel, particularly from forest fuels treatment, is the higher priced fuel for a biomass energy facility. It is TSS’ experience that forest sourced biomass fuel costs would be in the $45 to $50 per BDT range. A biomass project in the Yuba County forested area would likely have to expect this price range as lower cost urban wood waste and agricultural fuels (such as orchards removals) would likely go to other biomass facilities such as Oroville, Woodland, Lincoln, and Rocklin. For a biomass facility located at the Teichert site, the blended fuel cost would be in the $35 to $40 per BDT range, as it could source material from a wider range of fuel types at more attractive prices. Phase II of the this feasibility analysis conducted a more in-depth analysis of potential fuel costs and is presented in Section 2.0
Potential Size of Biomass Facility
Based on the Phase I review and consistent with interviews of resource managers in Yuba County, it was calculated above that approximately 21,775 BDT could potentially be available for biomass power generation on a sustainable, annual basis. Using the metric that 8,000 BDT will generate 1 MW of power, a biomass power plant sized up to 2.75 MW could potentially be operated in the forested area of Yuba County. As mentioned above a biomass-fired power plant located at the Teichert site could take further advantage of regionally available agricultural and urban derived woody biomass. It is believed that a 10 to 20 MW plant could be sustained at the Teichert site due to the availability of a broader, more diverse regional woody biomass fuel base.
Estimated Cost of Power Plant Equipment
Small-scale electric generation (less than 10 MW) using woody biomass fuel is an emerging field with technology vendors attempting to configure small systems so they are economically viable in the marketplace. Both direct combustion (steam cycle) and gasification (using internal combustion generators) are being proposed, or built, at various sites with a wide range of costs. Previous technology assessments by TSS
Yuba Foothills Biomass Feasibility Study TSS Consultants - December 2010
10
indicate a reported range of $4,000 to over $7,000 per kilowatt installed capital expense for small-scale biomass systems. Larger scale biomass fired electric generation systems due have an advantage of better economies of scale, and a long history of operation. The estimated range of costs per kilowatt are also better known for the larger systems. For a 20 MW system, the current range is around $3,750 to $4,250 per kilowatt installed. Some preliminary calculations, based in part on some ongoing biomass development projects in the Western United States, indicate that small-scale system economics are improving. There is a small biomass power plant that is nearly completed construction in the California Central Valley. The developer reported in July 2010 that the project is coming in at around $4,000 per kilowatt. Using this installed cost, plus $45/BDT, the forecast all-in cost to generate power could be in the 11 to 13 cents per kilowatt range. At the larger scale, and with potential lower cost biomass fuel – a blended cost of $35/BDT, a biomass power plant could be economic at 8 ½ to 10 cents a kilowatt hour. Phase II of this feasibility analysis conducted a more in-depth financial analysis and is presented in Section 5 below.
Key Project Partners
Key project partners for a biomass power plant development project will need to include a variety of entities, including project developer and owner; technology vendors; forest land owners as potential biomass suppliers (such as the ones contacted for the Phase I study as listed below); commercial biomass fuel suppliers; local, state, and federal agencies; and others. Project developers – To be determined. There are numerous biomass power plant developers currently seeking to develop projects that they will build, own and operate, with power sales agreements with utilities seeking renewable biomass power projects to meet their Renewable Portfolio Standards. Technology vendors – To be determined. These could be technology vendors chosen by the project developer, and/or the developer may also be a vendor of technology. Currently direct combustion steam cycle is considered commercially available, with a long track record of use for both power and thermal energy production. Forest landowners (and managers) as potential biomass suppliers – For the Phase I study, several of the major forest landowners in Yuba County were contacted, including:
Sierra Pacific Industries Soper Wheeler Timber Company
Yuba Foothills Biomass Feasibility Study TSS Consultants - December 2010
11
CHY Timber Company Siller Brothers, Inc. Tahoe National Forest Plumas National Forest
Commercial Biomass Suppliers – To be determined Local, State, and Federal Agencies – These include:
Yuba Watershed Protection & Fire Safe Council Yuba County region fire districts Yuba County Water Agency Sierra Nevada Conservancy Tahoe National Forest Plumas National Forest
Others (if Teichert site is considered)
Teichert Aggregates Marysville (host site)
1.2. Phase II Study
Based on the findings of Phase I it was recommended that the Phase II – Preliminary Feasibility Study be undertaken for the following reasons:
The economics of small-scale biomass power production in the upcountry portion of Yuba County is marginally favorable, and further investigation is warranted.
Although the very preliminary biomass fuel availability review in Phase I indicated that there is nearly 3 MW of sustainable biomass available for an upcountry biomass plant, further fuel availability investigation is needed to verify this number. Additional investigation may yield even higher volumes of economically available fuel.
The potential siting of a larger scale plant at the Teichert site requires further attention. Such a facility would adversely affect the fuel supply to an upcountry biomass plant, or it provides an opportunity to develop biomass collection sites in the upcountry area to supply a facility at the Teichert site.

Yuba Foothills Biomass Feasibility Study TSS Consultants - December 2010
12
Based upon discussions with the Council, it is recommended that the Phase II review the two highest ranking upcountry sites – Celestial Valley and Oregon House as potential biomass power plant sites, while at the same time further examining the potential for a power plant at Teichert site for which the two upcountry sites could potentially be utilized as regional biomass collection yards.
Yuba Foothills Biomass Feasibility Study TSS Consultants - December 2010
13
2. Biomass Resource Analysis
2.1. Biomass Fuel Supply Target Study Area
For the purpose of this biomass fuel supply analysis the fuel study area (FSA) is defined as the region located within a 50-mile radius of the Teichert facility (located east of Marysville on the Hammonton Smartville road). The 50-mile radius represents the most economical haul distance based on regional fuel collection, process, and transport trends. Figure 2-1 provides an overview of the 50-mile FSA which includes all or portions of the following California counties: Butte, Colusa, El Dorado, Glenn, Nevada, Placer, Plumas, Sacramento, Sierra, Solano, Sutter, Yolo, and Yuba.
Figure 2-1. Fuel Study Area
Figure 2-2 highlights the location of the Teichert facility.
Yuba Foothills Biomass Feasibility Study TSS Consultants - December 2010
14
Figure 2-2. Teichert Aggregates Marysville Site
2.2. Biomass Fuel Types
To assess the amount of woody biomass fuel potentially available to support a commercial biomass power generation facility at the Teichert site, TSS recommends that three distinct fuel types be considered.
Urban:
Urban wood waste – construction/demolition wood, pallets, miscellaneous residential and commercial wood waste.
Tree trimmings – plant material generated from residential and commercial landscape maintenance activities.
Agriculture:
Orchard removals – commercial crop trees removed as a result of crop replacement activities.
Orchard prunings – commercial crop trees are pruned annually to improve vigor and productivity.
Yuba Foothills Biomass Feasibility Study TSS Consultants - December 2010
15
Food Processing Residuals – annual processing of almond, walnut, olive, and stone fruit crops generates byproduct in the form of nutshells, fruit pits, and olive pits.
Leached rice straw generated as a result of rice harvest activities.
Forest:
Timber harvest residuals – limbs and tree tops generated during commercial timber harvest activities.
Fuels reduction and forest restoration residuals – small stems removed as a result of forest fuels reduction activities.
Sawmill residuals – woody biomass material generated as a byproduct of forest products manufacturing including bark, chips, sawdust, and shavings.
2.3. Urban Fuel Sources
Urban Wood Waste
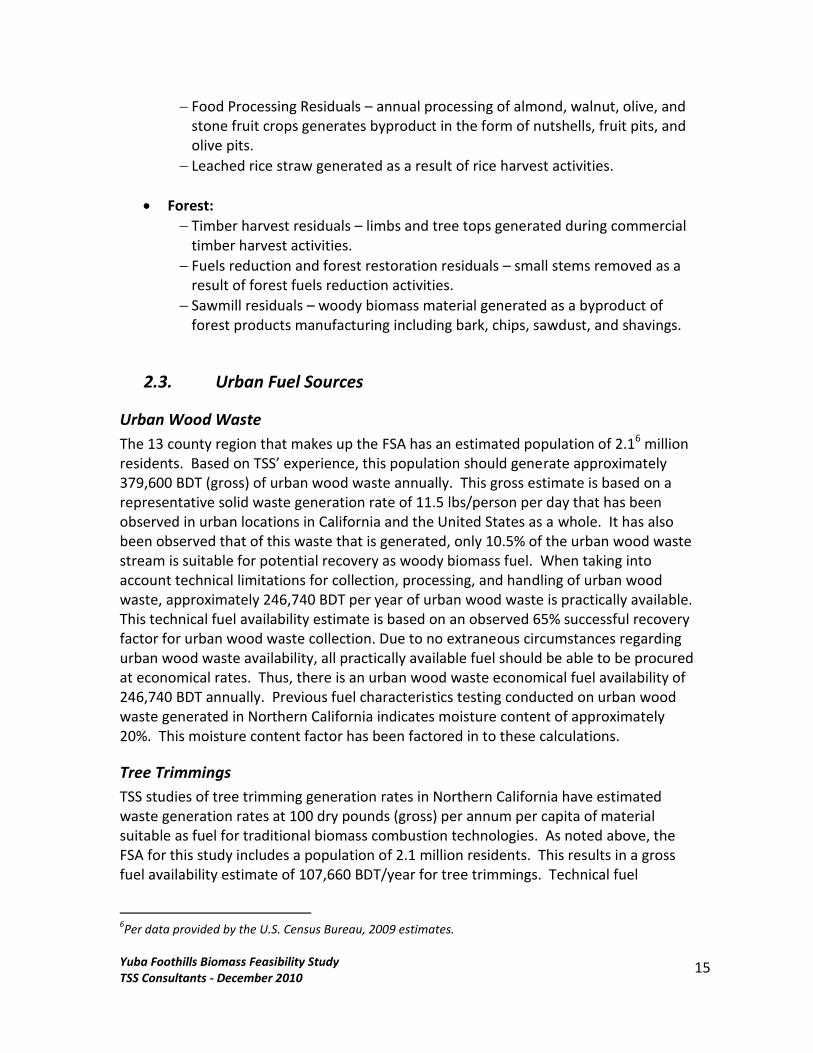
The 13 county region that makes up the FSA has an estimated population of 2.16 million residents. Based on TSS’ experience, this population should generate approximately 379,600 BDT (gross) of urban wood waste annually. This gross estimate is based on a representative solid waste generation rate of 11.5 lbs/person per day that has been observed in urban locations in California and the United States as a whole. It has also been observed that of this waste that is generated, only 10.5% of the urban wood waste stream is suitable for potential recovery as woody biomass fuel. When taking into account technical limitations for collection, processing, and handling of urban wood waste, approximately 246,740 BDT per year of urban wood waste is practically available. This technical fuel availability estimate is based on an observed 65% successful recovery factor for urban wood waste collection. Due to no extraneous circumstances regarding urban wood waste availability, all practically available fuel should be able to be procured at economical rates. Thus, there is an urban wood waste economical fuel availability of 246,740 BDT annually. Previous fuel characteristics testing conducted on urban wood waste generated in Northern California indicates moisture content of approximately 20%. This moisture content factor has been factored in to these calculations.
Tree Trimmings
TSS studies of tree trimming generation rates in Northern California have estimated waste generation rates at 100 dry pounds (gross) per annum per capita of material suitable as fuel for traditional biomass combustion technologies. As noted above, the FSA for this study includes a population of 2.1 million residents. This results in a gross fuel availability estimate of 107,660 BDT/year for tree trimmings. Technical fuel
6Per data provided by the U.S. Census Bureau, 2009 estimates.
Yuba Foothills Biomass Feasibility Study TSS Consultants - December 2010
16
availability is determined by applying a 65% recovery factor due to losses that occur during collection, processing, and handling. This results in a technical fuel availability of 69,980 BDT/year from tree trimming material. Similar to urban wood waste material, the FSA boundaries are a primary determination factor for economical fuel availability. Accordingly, all technically available fuel is economically available as well, resulting in 69,980 BDT/year as economical fuel availability from tree trimming material. Table 2-1 provides a summary of the urban-sourced biomass material potentially available within the FSA.
Table 2-1. Urban-Sourced Biomass Fuel Material (Expressed in BDT)
FUEL TYPE GROSS AVAILABLE TECHNICALLY
AVAILABLE ECONOMICALLY
AVAILABLE
Urban Wood Waste 379,600 246,740 246,740
Tree Trimmings 107,660 69,980 69,980
TOTALS 487,260 316,720 316,720
Table 2-2 provides a summary of the population estimates for counties included in the FSA. Note that because generation of urban wood waste and tree trimmings is driven by population, those counties with relatively high concentrations of residents (Sacramento, Placer, Butte, Yolo) will generate the most significant volumes of urban wood waste and tree trimmings.
Table 2-2. 2009 County Population Distribution within the Fuel Study Area
COUNTY 2009 POPULATION
WITHIN THE FSA
Butte 198,519
Colusa 12,793
El Dorado 115,991
Glenn 8,490
Nevada 68,426
Placer 278,842
Plumas 3,018
Sacramento 1,120,759
Sierra 952
Solano 20,362
Sutter 92,614
Yolo 159,526
Yuba 72,925
TOTAL 2,153,215
Yuba Foothills Biomass Feasibility Study TSS Consultants - December 2010
17
2.4. Agriculture Fuel Sources
Nut Crop Orchard Removals
The FSA contains approximately 154,534 acres of almond and walnut orchards that are cultivated as commercial crops.7 Almond and walnut orchards are regularly removed and replaced with new growing stock to maintain acceptable yields. Orchard removals and replacement are reported by nut orchard managers and orchard removal contractors to occur every 25-30 years. This results in an annual removal rate of approximately 4% or about 6,181 acres per year. Additionally, discussions with nut orchard removal contractors indicate a gross recovery of 25 BDT/acre. Due to homogeneity of orchard material, the gross recovery figure for orchard removal material within the FSA is also technically available as woody biomass fuel. The gross and technical fuel availability from nut crop orchard removals is 154,534 BDT/year. The Biomass Crop Assistance Program (BCAP), as administered by the USDA Farm Services Agency (FSA), is currently having a significant impact on agricultural and forest sourced woody biomass fuel prices within the FSA. Ag and forest fuel contractors that successfully apply to the FSA for fuel price support can receive up to $45/BDT in matching funds for fuel delivered to BCAP qualified facilities. For more information on BCAP, go to the agricultural trends section of this report. A direct result (and unintended consequence) of the BCAP is the accelerated removal of commercial orchards as orchard managers and owners take advantage of federal funding support to offset the cost of orchard removals. As a result, additional removals are occurring and a reduction of future orchard removals will be experienced for at least the next three to five years. To account for BCAP’s impact, a 5% reduction of technical availability is applied to determine economical fuel availability. Consequently, nut crop orchard removals are estimated to provide 146,807 BDT/year of economical fuel supply within the FSA.
Stone Fruit Orchard Removals
The FSA contains approximately 13,950 acres of stone fruit orchards (apricot, peaches and cherries) that are currently in commercial cultivation. Stone fruit orchards are generally removed on a shorter timescale than nut crop orchards; however, they are not as dense and result in lower yields of acceptable biomass fuel. Apricot, peach, and cherry orchards are removed and replaced with growing stock each 11-20 years as indicated by orchard managers and orchard removal contractors. Most of the stone
72009 Butte County Agricultural Crop Report, 2009 Colusa County Crop Report, 2009 El Dorado County
Crop and Livestock Report, 2008 Glenn County Agriculture Crop Report, 2007 Nevada County Crop and Livestock Report, 2006 Placer County Crop Report, 2009 Sacramento County Crop and Livestock Report, 2007 Sierra County Crop Report, 2009 Solano County Crop Report, 2009 Sutter County Crop Report, 2009 Yolo County Crop Report, 2009 Yuba County Crop Report.
Yuba Foothills Biomass Feasibility Study TSS Consultants - December 2010
18
fruit in cultivation within the FSA are peach orchards (93% of stone fruit orchards), which have about an 11-year rotation cycle. For the purposes of this analysis, TSS used a 12-year rotation cycle, which results in an 8% annual removal rate for all commercially cultivated stone fruit orchards, which equates to 1,116 acres per year removed. Previous TSS studies have shown that in Northern California, stone fruit orchard removals have yields of approximately 13 to 19 BDT/acre. Peach orchard removals average about 19 BDT/acre. For the purposes on of this analysis, TSS assumed a removal volume of 18 BDT/acre for stone fruit orchard removals. Similar to other orchard removals, material collection by contractors and homogeneity of material leads to all gross fuel within the FSA considered as technically available fuel. This yield and removal rate results in a gross and technical fuel availability of 20,088 BDT/year. All commercial orchards are impacted by BCAP, so a 20% adjustment is used to calculate economically available stone orchard removal fuel at 16,070 BDT/year.
Citrus Orchard Removals
There are very limited amounts, estimated at only 395 acres, of citrus orchards (lemon, orange, grapefruit) in commercial cultivation within the FSA. Discussions with citrus orchard removal contractors indicate that commercially cultivated citrus orchards in California are removed on a 15-20 year cycle. This results in a removal rate of approximately 6% annually or about 24 acres per year. Previous TSS studies and discussions with orchard removal contractors have indicated that removal yields approximately 20 BDT/acre of gross fuel. Gross and technical availability of woody biomass fuel from citrus orchard removals are the same, which is similar to other orchard removals. This results in a gross and technical availability of 480 BDT/year. BCAP’s impact on citrus orchard removals is similar to other orchard removals, and a 20% reduction factor is applied to determine economical fuel availability. Citrus orchards within the FSA are estimated to provide an economical fuel availability of 384 BDT/year. This amount is relatively negligible, and it is unlikely that a facility located at the Teichert site will realize significant benefit from securing citrus orchard removal material due to the low quantities available within the FSA. Citrus orchard removal material also tends to be stringy and challenging to handle. For these reasons, citrus orchard removals are not considered readily available and are not included in the fuel blend for this FSA.
Orchard Prunings
Commercial orchard operations require annual pruning of cultivated stock in order to optimize yields of fruits and nuts. County agriculture and livestock crop reports provide information that there is in excess of 168,880 acres of commercial orchards, which include stone fruit (apricots, peaches, cherries), nut (almond, walnut), and citrus (lemon, orange, grapefruit) orchards. Processed orchard pruning material is suitable as biomass fuel. Yields of prunings from each orchard will vary depending on pruning practice employed. In recent years nut orchard managers have modified pruning practices so
Yuba Foothills Biomass Feasibility Study TSS Consultants - December 2010
19
that very minimal volumes of prunings are produced. This limits pruning availability to citrus and stone fruit orchards. TSS estimates that on average, a yield of 0.5 BDT/acre of gross fuel (per discussions with pruning contractors and orchard owners). This average yield results in an estimate of 7,172 BDT/year of gross fuel availability. Currently there are a limited number of operators and contractors conducting orchard pruning collection and processing. Low recovery per acre, specialized processing equipment required, and stringy fuel composition make orchard prunings technically and economically prohibitive in some situations. Due to these recovery considerations, the technical and economical fuel availability is determined by reducing gross fuel availability by 50%. The technical and economical availability of orchard prunings are estimated at 3,586 BDT/year.
Food Processing Residuals (Nut Shells, Olive Pits, Stone Fruit Processing Residuals)
Commercial agricultural operations generate residual materials that are suitable as biomass fuel. Almond, walnut, and pistachio nutshells, stone fruit pits, and olive pits are commonly used as biomass fuel and are generated within the FSA. The primary reference for the study of food processing residuals within the FSA was the 2005 and 2007 California Energy Commission report conducted by the California Biomass Collaborative, An Assessment of Biomass Resources in California. Food processing residuals were evaluated on a county-by-county basis, and based on the California Energy Commission’s report and discussions with fuel supply contractors, TSS estimates there is a gross fuel availability of 57,959 BDT/year. Crop yields will vary over time due to variables such as weather, which reduces the gross availability of these residuals. A factor of 80% is applied to reduce gross fuel availability into technical fuel availability. TSS estimates that there is a technical fuel availability of 46,367 BDT/year from food processing residuals. Due to the selection of the FSA boundaries that account for economical fuel procurement, technical and economic fuel availability is estimated to be the same.
Leached Rice Straw
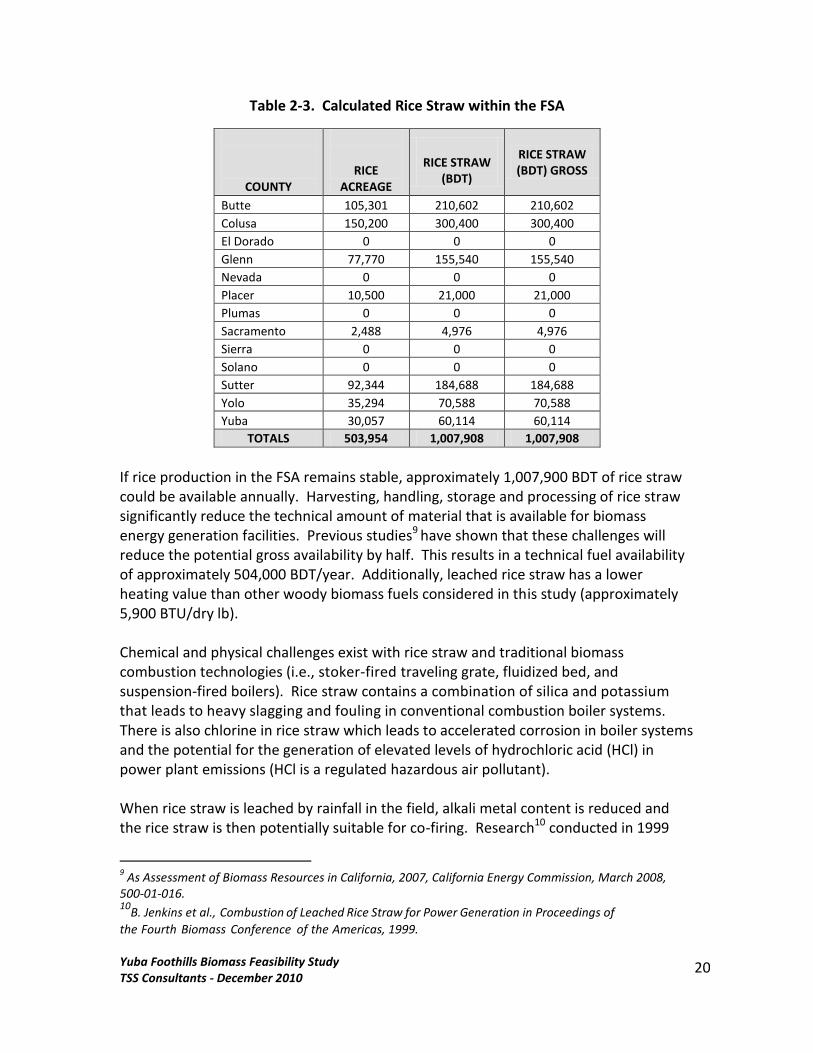
In excess of 500,000 acres of rice are harvested annually in California, resulting in about 1 million BDT of rice straw available annually.8 The Teichert facility is strategically located for rice straw resources, as nearly all of the state’s commercial rice growing region is located tributary to or within the FSA. Table 2-3 displays an estimate of the amount of rice straw calculated to be within the FSA in 2008.
8One acre of rice results in approximately 2 BDT of rice straw.
Yuba Foothills Biomass Feasibility Study TSS Consultants - December 2010
20
Table 2-3. Calculated Rice Straw within the FSA
COUNTY
RICE ACREAGE
RICE STRAW
(BDT)
RICE STRAW (BDT) GROSS
Butte 105,301 210,602 210,602
Colusa 150,200 300,400 300,400
El Dorado 0 0 0
Glenn 77,770 155,540 155,540
Nevada 0 0 0
Placer 10,500 21,000 21,000
Plumas 0 0 0
Sacramento 2,488 4,976 4,976
Sierra 0 0 0
Solano 0 0 0
Sutter 92,344 184,688 184,688
Yolo 35,294 70,588 70,588
Yuba 30,057 60,114 60,114
TOTALS 503,954 1,007,908 1,007,908
If rice production in the FSA remains stable, approximately 1,007,900 BDT of rice straw could be available annually. Harvesting, handling, storage and processing of rice straw significantly reduce the technical amount of material that is available for biomass energy generation facilities. Previous studies9 have shown that these challenges will reduce the potential gross availability by half. This results in a technical fuel availability of approximately 504,000 BDT/year. Additionally, leached rice straw has a lower heating value than other woody biomass fuels considered in this study (approximately 5,900 BTU/dry lb). Chemical and physical challenges exist with rice straw and traditional biomass combustion technologies (i.e., stoker-fired traveling grate, fluidized bed, and suspension-fired boilers). Rice straw contains a combination of silica and potassium that leads to heavy slagging and fouling in conventional combustion boiler systems. There is also chlorine in rice straw which leads to accelerated corrosion in boiler systems and the potential for the generation of elevated levels of hydrochloric acid (HCl) in power plant emissions (HCl is a regulated hazardous air pollutant). When rice straw is leached by rainfall in the field, alkali metal content is reduced and the rice straw is then potentially suitable for co-firing. Research10 conducted in 1999
9 As Assessment of Biomass Resources in California, 2007, California Energy Commission, March 2008,
500-01-016. 10
B. Jenkins et al., Combustion of Leached Rice Straw for Power Generation in Proceedings of
the Fourth Biomass Conference of the Americas, 1999.

Yuba Foothills Biomass Feasibility Study TSS Consultants - December 2010
21
indicates that rice straw that has been leached by rainfall after being harvested and left piled in the field could be utilized as fuel if blended with other biomass fuels. A test burn at three California biomass plants was arranged that added leached rice straw at 20 to 25% co-fire mixture with traditional biomass fuels. However, due to the potential high land cost (for storage of rice straw bales), high collection, and processing cost of a fuel that requires months of leaching (if conducted in the open using rainfall as the leaching agent), economical fuel availability is less than the technical fuel availability. Accordingly, to account for these challenges, 50% of the technical availability is economically available. This results in an economical fuel availability of 251,977 BDT/year for rice straw. Additional challenges exist for leached rice straw including:
Leaching of rice straw to remove sufficient amounts of potassium and chlorine may need a considerable amount of rainwater. As 1 MW of rice straw capacity would require nearly 10,300 BDT of rice straw to be leached, it may be very problematic to have this much leached in the field by natural precipitation and maintain consistent leaching results. A mechanical system may need to be set up to assist in the leaching process.
Harvest, handling, storage, and processing infrastructure are not fully developed.
There is a significant ash generated from rice straw due primarily to the relatively high silica content. Test firing of rice straw indicates that ash generated in the combustion process exceeds 20%.
The nitrogen content in rice straw is also higher, which could result in higher NOx emissions levels in an already NOx emission-constrained airshed.
Table 2-4 summarizes agriculture sourced fuel availability within the FSA.
Table 2-4. Agriculture-Sourced Biomass Fuel Material (Expressed in BDT)
FUEL TYPE GROSS AVAILABLE TECHNICALLY
AVAILABLE ECONOMICALLY
AVAILABLE
Nut Orchard Removals 154,534 154,534 146,807
Stone Fruit Orchard Removals 20,088 20,088 16,070
Citrus Orchard Removals 480 0 0
Orchard Prunings 7,172 3,586 3,586
Food Processing Residuals 57,959 46,367 46,367
Leached Rice Straw 1,007,908 503,954 251,977
TOTALS 1,248,141 728,529 464,807
Yuba Foothills Biomass Feasibility Study TSS Consultants - December 2010
22
2.5. Forest Fuel Sources
Timber Harvest Residuals
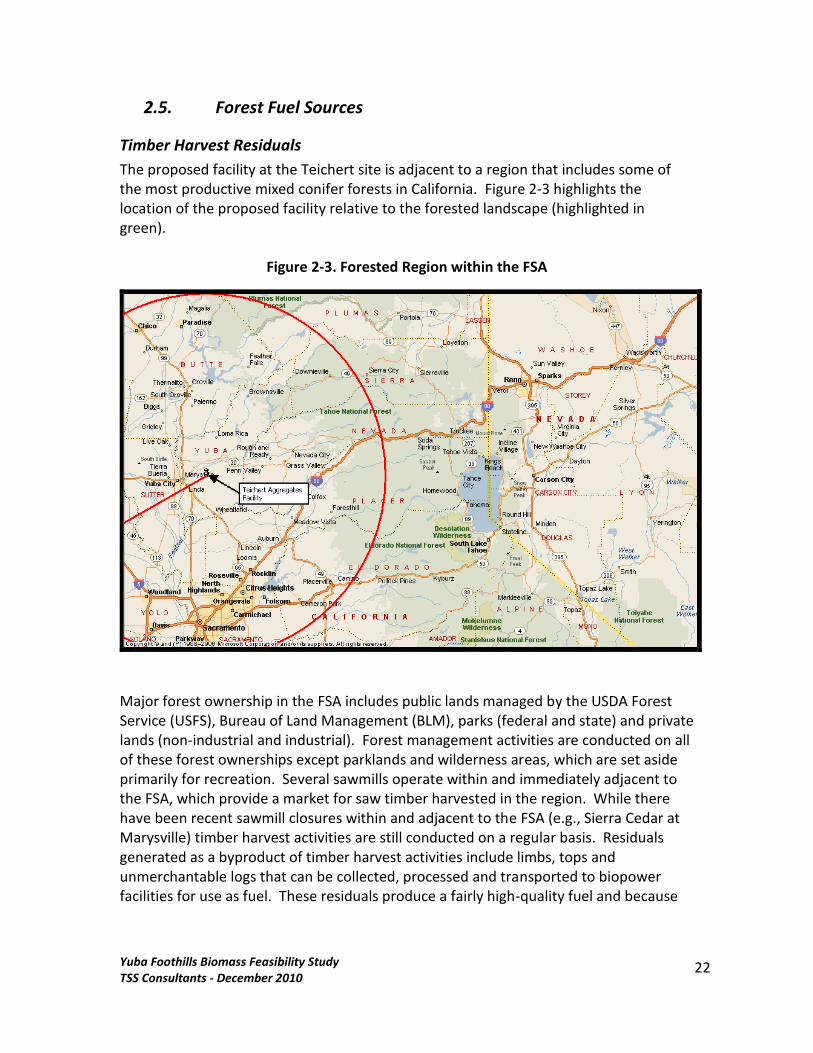
The proposed facility at the Teichert site is adjacent to a region that includes some of the most productive mixed conifer forests in California. Figure 2-3 highlights the location of the proposed facility relative to the forested landscape (highlighted in green).
Figure 2-3. Forested Region within the FSA
Major forest ownership in the FSA includes public lands managed by the USDA Forest Service (USFS), Bureau of Land Management (BLM), parks (federal and state) and private lands (non-industrial and industrial). Forest management activities are conducted on all of these forest ownerships except parklands and wilderness areas, which are set aside primarily for recreation. Several sawmills operate within and immediately adjacent to the FSA, which provide a market for saw timber harvested in the region. While there have been recent sawmill closures within and adjacent to the FSA (e.g., Sierra Cedar at Marysville) timber harvest activities are still conducted on a regular basis. Residuals generated as a byproduct of timber harvest activities include limbs, tops and unmerchantable logs that can be collected, processed and transported to biopower facilities for use as fuel. These residuals produce a fairly high-quality fuel and because
Yuba Foothills Biomass Feasibility Study TSS Consultants - December 2010
23
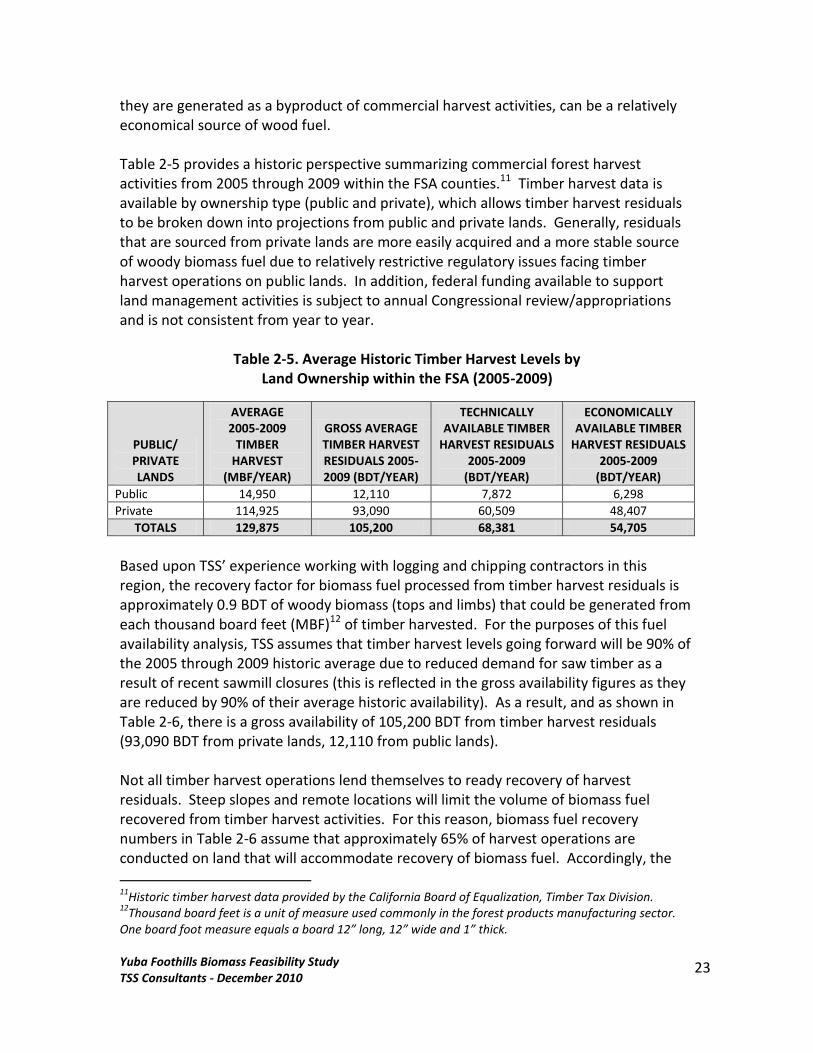
they are generated as a byproduct of commercial harvest activities, can be a relatively economical source of wood fuel. Table 2-5 provides a historic perspective summarizing commercial forest harvest activities from 2005 through 2009 within the FSA counties.11 Timber harvest data is available by ownership type (public and private), which allows timber harvest residuals to be broken down into projections from public and private lands. Generally, residuals that are sourced from private lands are more easily acquired and a more stable source of woody biomass fuel due to relatively restrictive regulatory issues facing timber harvest operations on public lands. In addition, federal funding available to support land management activities is subject to annual Congressional review/appropriations and is not consistent from year to year.
Table 2-5. Average Historic Timber Harvest Levels by Land Ownership within the FSA (2005-2009)
PUBLIC/ PRIVATE LANDS
AVERAGE 2005-2009
TIMBER HARVEST
(MBF/YEAR)
GROSS AVERAGE TIMBER HARVEST RESIDUALS 2005- 2009 (BDT/YEAR)
TECHNICALLY AVAILABLE TIMBER
HARVEST RESIDUALS 2005-2009
(BDT/YEAR)
ECONOMICALLY AVAILABLE TIMBER
HARVEST RESIDUALS 2005-2009
(BDT/YEAR)
Public 14,950 12,110 7,872 6,298
Private 114,925 93,090 60,509 48,407
TOTALS 129,875 105,200 68,381 54,705
Based upon TSS’ experience working with logging and chipping contractors in this region, the recovery factor for biomass fuel processed from timber harvest residuals is approximately 0.9 BDT of woody biomass (tops and limbs) that could be generated from each thousand board feet (MBF)12 of timber harvested. For the purposes of this fuel availability analysis, TSS assumes that timber harvest levels going forward will be 90% of the 2005 through 2009 historic average due to reduced demand for saw timber as a result of recent sawmill closures (this is reflected in the gross availability figures as they are reduced by 90% of their average historic availability). As a result, and as shown in Table 2-6, there is a gross availability of 105,200 BDT from timber harvest residuals (93,090 BDT from private lands, 12,110 from public lands). Not all timber harvest operations lend themselves to ready recovery of harvest residuals. Steep slopes and remote locations will limit the volume of biomass fuel recovered from timber harvest activities. For this reason, biomass fuel recovery numbers in Table 2-6 assume that approximately 65% of harvest operations are conducted on land that will accommodate recovery of biomass fuel. Accordingly, the
11
Historic timber harvest data provided by the California Board of Equalization, Timber Tax Division. 12
Thousand board feet is a unit of measure used commonly in the forest products manufacturing sector. One board foot measure equals a board 12” long, 12” wide and 1” thick.
Yuba Foothills Biomass Feasibility Study TSS Consultants - December 2010
24
technical fuel availability from timber harvest residuals is 68,381 BDT annually (60,509 BDT from private lands, 7,872 from public lands). Most forest roads were designed to accommodate log trucks that articulate and can readily transport logs on narrow road systems with tight radius turns. Many of these road systems can be economically modified to allow for passage of chip trucks (used to transport biomass fuel). For the purposes of this assessment, it is assumed that 80% of the technically available timber harvest residual material can be transported economically to the Teichert facility. Therefore, TSS estimates there is an economic availability of 54,705 BDT per year (48,407 BDT from private lands, 6,298 BDT from public lands).
Fuel Reduction/Forest Restoration Residuals
Forest managers responsible for land management activities on public and private forests are actively seeking alternatives to current pile and burn practices associated with the disposal of small stems removed as a byproduct of forest fuels reduction/forest restoration activities. Foresters managing public lands interviewed for this analysis indicated that approximately 1,700 acres of forest located within the FSA are scheduled for treatment annually. Forest fuels treatment and forest restoration efforts on non-industrial private lands are typically coordinated through the Fire Safe Councils (FSC). Founded in the late 1990’s as a result of public concern regarding the impacts of wildfires to communities, the FSC in California are focused on the creation and maintenance of defensible space near homes and communities. Today, over 140 separate FSC function in the state with over six active within the FSA. Interviews with various FSC coordinators indicate that about 300 acres per year are treated on non-industrial private lands within the FSA. In addition, other non-industrial forest landowners will likely wish to thin overstocked stands if a ready market existed for biomass material generated. Based on previous experience in this region TSS estimates that an additional (in excess to FSC projects) 500 acres of non-industrial lands could be available for thinning activities on an annual basis. Large industrial forestland ownerships, including Soper-Wheeler Company, CHY Company, Siller Brothers, and Sierra Pacific Industries, have significant forest holdings within the FSA. Historically, these ownerships may thin about 3,300 acres per year if there is a ready market for the biomass material generated. Many of these thinning projects would be focused on the numerous even-aged plantations that exist on the western slope of the Sierra Nevada. Re-planted following fires and even-aged harvest, many of these plantations are ready for first or second entry thinning. Typically saw timber is removed in conjunction with these thinning operations, which will help to offset the harvest and road maintenance costs associated with thinning and recovery of biomass from small non-merchantable stems (<8” DBH).
Yuba Foothills Biomass Feasibility Study TSS Consultants - December 2010
25
From both TSS’ experience in the region and interviews with forest managers, it can be assumed that an average of 15 BDT per acre are potentially available as biomass fuel from fuels reduction activities. Assuming fuels treatment/forest restoration activities average 5,800 acres of treatment across all forest landownership, then approximately 87,000 BDT are potentially available (gross estimate) per year. Due to operational limitations caused by steep topography, the technically available biomass fuel from fuels treatment/forest restoration is 75% of the gross available figure, amounting to about 65,250 BDT per year. Finally, due to limited road accessibility for chip trucks and the high cost to re-align roads (to accommodate chip trucks), the economically available fuel estimate is 90% of the technically available figure, resulting in about 58,725 BDT per year.
Sawmill Residuals
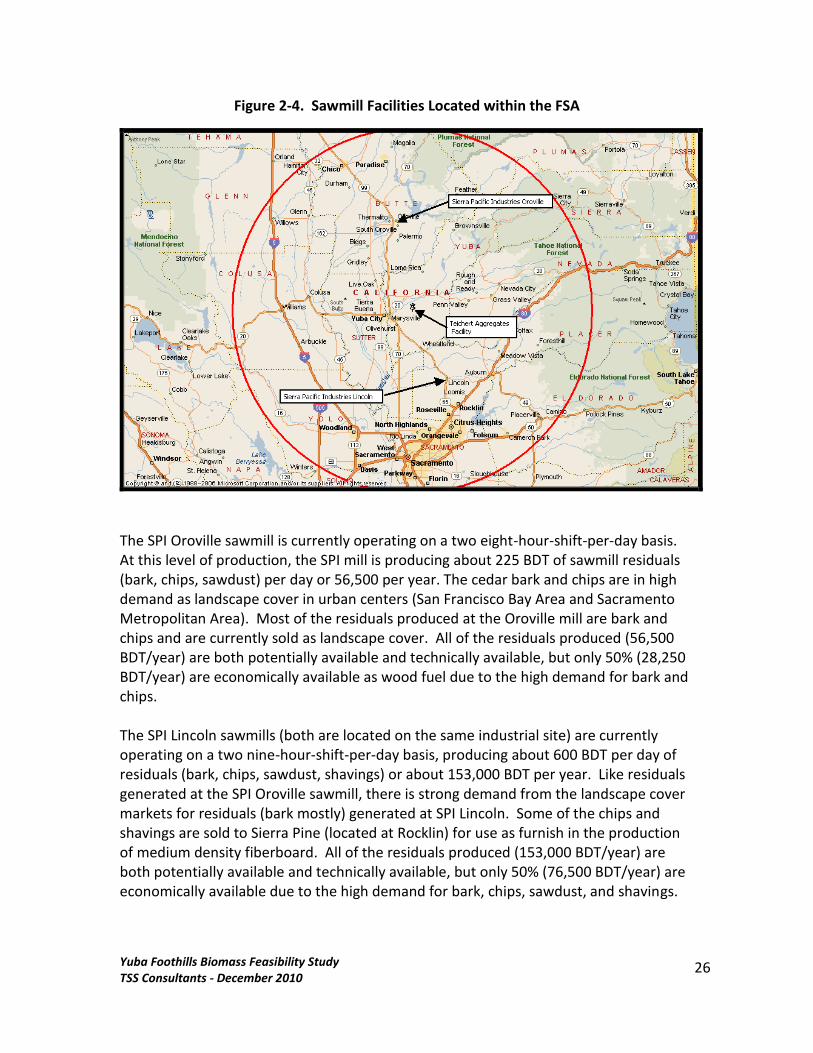
Many of the early biomass power facilities were developed as a method to dispose of sawmill residuals (bark, chips, sawdust, shavings) that were generated by the numerous sawmills in the state. For many years, these residuals were incinerated using very primitive technologies (e.g., teepee burners) with no emissions controls and no recovery of heat energy. However, concerns over air emissions and the demand for kiln-dried lumber products provided incentives for sawmill owners to re-think residual disposal practices. A ready market for renewable power (starting in the 1980’s) also provided significant economic incentives to add a steam cycle turbine/generator for cogeneration of power. Sawmill residuals represent a high-quality (relatively high BTU, low ash) fuel that historically was quite economical due to the fact that these residuals were considered a waste product of the forest products manufacturing process. Over the years, as land management objectives changed and relatively low cost lumber became available from Canada, sawmills in California began to close. Today, only 25 commercial-scale sawmills13 continue to operate in California, with only two remaining in the FSA. Both of these sawmills are owned and operated by Sierra Pacific Industries (SPI), with one located at Oroville (small log cedar fencing mill) and the other located at Lincoln (large log mill and small log mill). Figure 2-4 highlights the location of these sawmills.
13
Data provided by the California Forestry Association.
Yuba Foothills Biomass Feasibility Study TSS Consultants - December 2010
26
Figure 2-4. Sawmill Facilities Located within the FSA
The SPI Oroville sawmill is currently operating on a two eight-hour-shift-per-day basis. At this level of production, the SPI mill is producing about 225 BDT of sawmill residuals (bark, chips, sawdust) per day or 56,500 per year. The cedar bark and chips are in high demand as landscape cover in urban centers (San Francisco Bay Area and Sacramento Metropolitan Area). Most of the residuals produced at the Oroville mill are bark and chips and are currently sold as landscape cover. All of the residuals produced (56,500 BDT/year) are both potentially available and technically available, but only 50% (28,250 BDT/year) are economically available as wood fuel due to the high demand for bark and chips. The SPI Lincoln sawmills (both are located on the same industrial site) are currently operating on a two nine-hour-shift-per-day basis, producing about 600 BDT per day of residuals (bark, chips, sawdust, shavings) or about 153,000 BDT per year. Like residuals generated at the SPI Oroville sawmill, there is strong demand from the landscape cover markets for residuals (bark mostly) generated at SPI Lincoln. Some of the chips and shavings are sold to Sierra Pine (located at Rocklin) for use as furnish in the production of medium density fiberboard. All of the residuals produced (153,000 BDT/year) are both potentially available and technically available, but only 50% (76,500 BDT/year) are economically available due to the high demand for bark, chips, sawdust, and shavings.
Yuba Foothills Biomass Feasibility Study TSS Consultants - December 2010
27
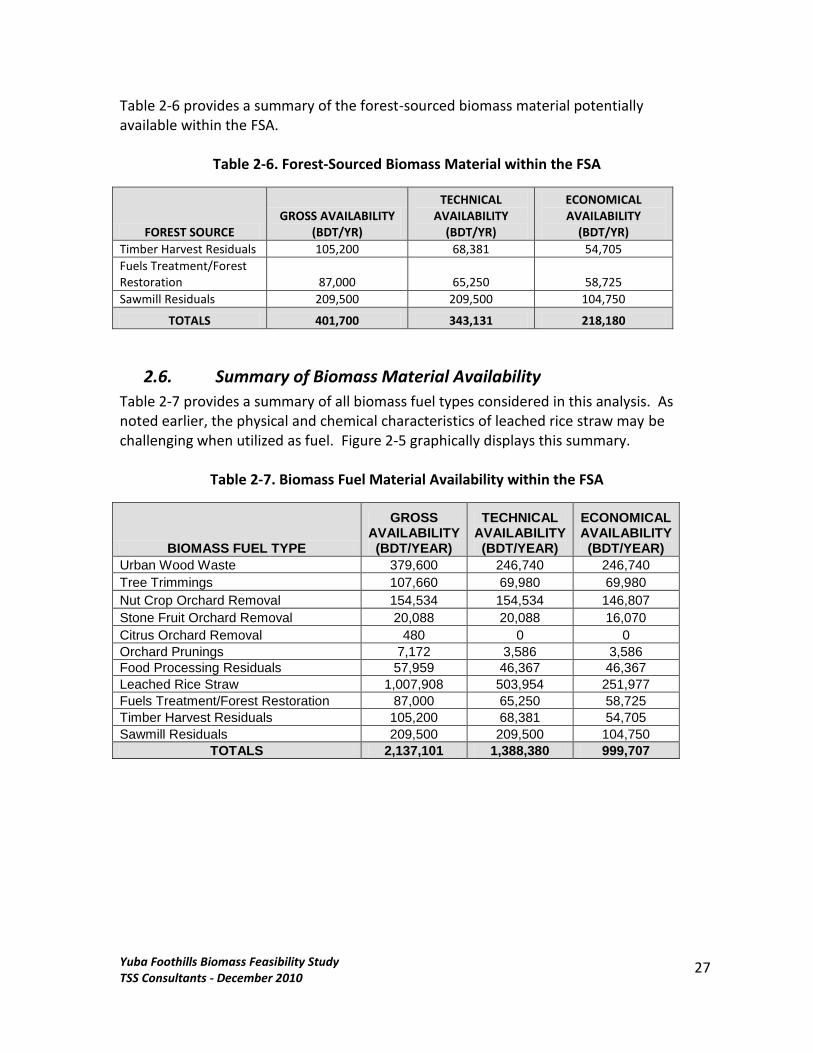
Table 2-6 provides a summary of the forest-sourced biomass material potentially available within the FSA.
Table 2-6. Forest-Sourced Biomass Material within the FSA
FOREST SOURCE GROSS AVAILABILITY
(BDT/YR)
TECHNICAL AVAILABILITY
(BDT/YR)
ECONOMICAL AVAILABILITY
(BDT/YR)
Timber Harvest Residuals 105,200 68,381 54,705
Fuels Treatment/Forest Restoration 87,000 65,250 58,725
Sawmill Residuals 209,500 209,500 104,750
TOTALS 401,700 343,131 218,180
2.6. Summary of Biomass Material Availability
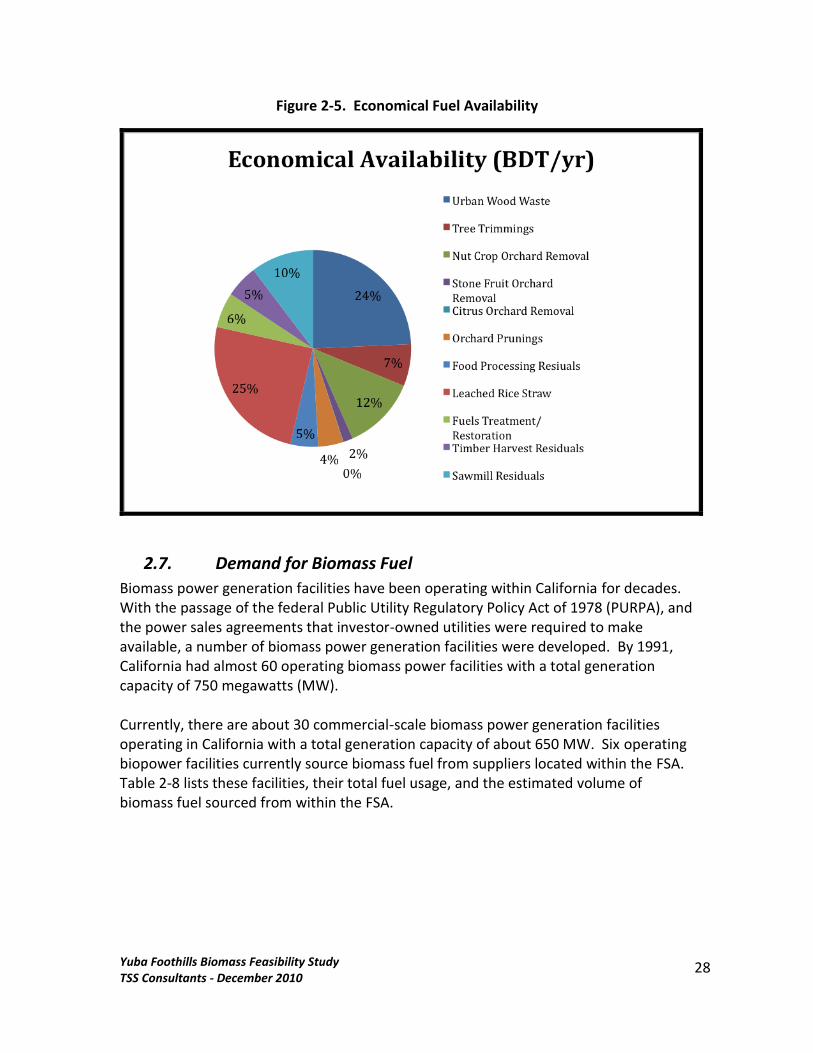
Table 2-7 provides a summary of all biomass fuel types considered in this analysis. As noted earlier, the physical and chemical characteristics of leached rice straw may be challenging when utilized as fuel. Figure 2-5 graphically displays this summary.
Table 2-7. Biomass Fuel Material Availability within the FSA
BIOMASS FUEL TYPE
GROSS AVAILABILITY (BDT/YEAR)
TECHNICAL AVAILABILITY (BDT/YEAR)
ECONOMICAL AVAILABILITY (BDT/YEAR)
Urban Wood Waste 379,600 246,740 246,740
Tree Trimmings 107,660 69,980 69,980
Nut Crop Orchard Removal 154,534 154,534 146,807
Stone Fruit Orchard Removal 20,088 20,088 16,070
Citrus Orchard Removal 480 0 0
Orchard Prunings 7,172 3,586 3,586
Food Processing Residuals 57,959 46,367 46,367
Leached Rice Straw 1,007,908 503,954 251,977
Fuels Treatment/Forest Restoration 87,000 65,250 58,725
Timber Harvest Residuals 105,200 68,381 54,705
Sawmill Residuals 209,500 209,500 104,750
TOTALS 2,137,101 1,388,380 999,707
Yuba Foothills Biomass Feasibility Study TSS Consultants - December 2010
28
Figure 2-5. Economical Fuel Availability
2.7. Demand for Biomass Fuel
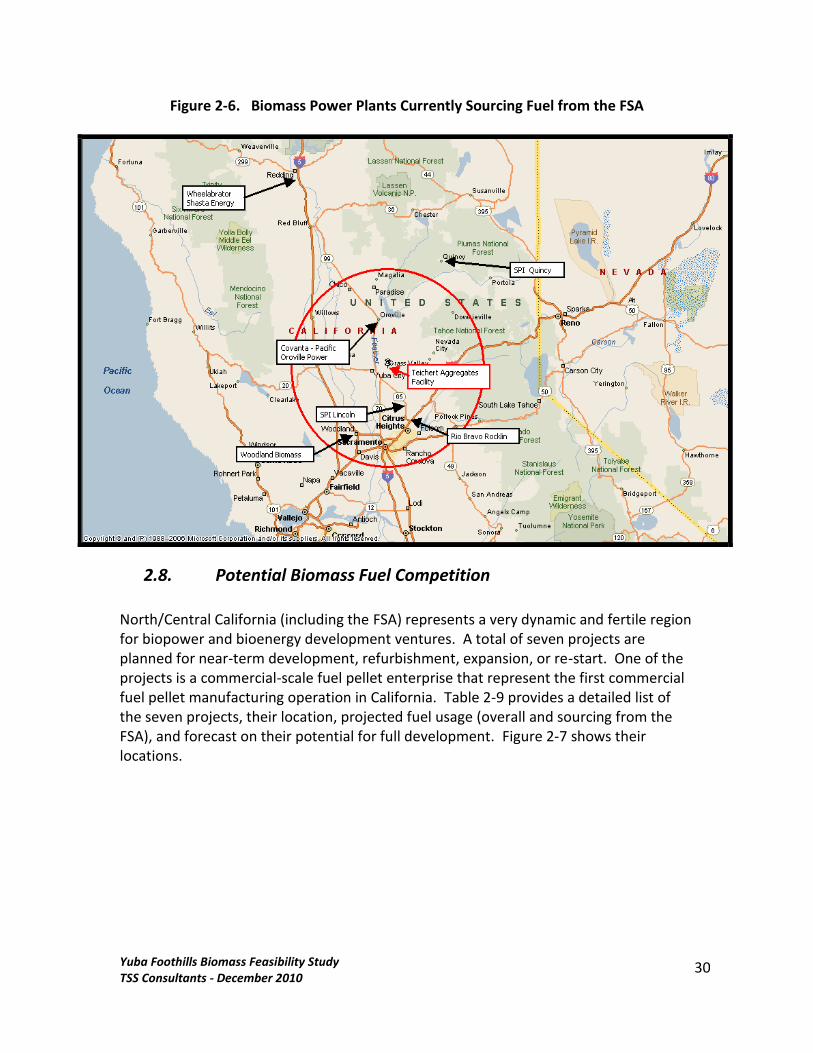
Biomass power generation facilities have been operating within California for decades. With the passage of the federal Public Utility Regulatory Policy Act of 1978 (PURPA), and the power sales agreements that investor-owned utilities were required to make available, a number of biomass power generation facilities were developed. By 1991, California had almost 60 operating biomass power facilities with a total generation capacity of 750 megawatts (MW). Currently, there are about 30 commercial-scale biomass power generation facilities operating in California with a total generation capacity of about 650 MW. Six operating biopower facilities currently source biomass fuel from suppliers located within the FSA. Table 2-8 lists these facilities, their total fuel usage, and the estimated volume of biomass fuel sourced from within the FSA.

Yuba Foothills Biomass Feasibility Study TSS Consultants - December 2010
29
Table 2-8. Biomass Power Plants Currently Sourcing Fuel from the FSA
FACILITY
TYPE
NET GENERATION
(MW)
TOTAL FUEL
UTILIZED (BDT/YR)
FUEL SOURCED FROM WITHIN FSA (BDT/YR)
COMMENTS
Wheelabrator Shasta Energy, Anderson
Stoker
50
400,000
60,000
Primarily ag fuel including orchard removals, almond and walnut shell.
Covanta Pacific Oroville Power
Stoker
18
154,000
105,000
Orchard removals and prunings, some urban wood and forest-sourced fuel.
Sierra Pacific Industries - Quincy
Stoker
28
247,000
55,000
Access sawmill residuals generated on site and some urban wood diverted away from SPI Loyalton. Also forest-sourced fuel.
Sierra Pacific Industries - Lincoln
Stoker
18
154,000
55,000
Recently updated air permit to allow urban wood. Also sources orchard removals.
Rio Bravo Rocklin
CFB
25
180,000
140,000
All urban wood predominantly from Sacramento metropolitan area.
Woodland Biomass
CFB
25
180,000
90,000
Orchard removals and urban wood. Occasionally source forest fuel.
TOTALS 164 1,315,000 505,000
Table 2-6 shows the location of the six currently operating biopower facilities that are sourcing fuel from the FSA.
Yuba Foothills Biomass Feasibility Study TSS Consultants - December 2010
30
Figure 2-6. Biomass Power Plants Currently Sourcing Fuel from the FSA
2.8. Potential Biomass Fuel Competition
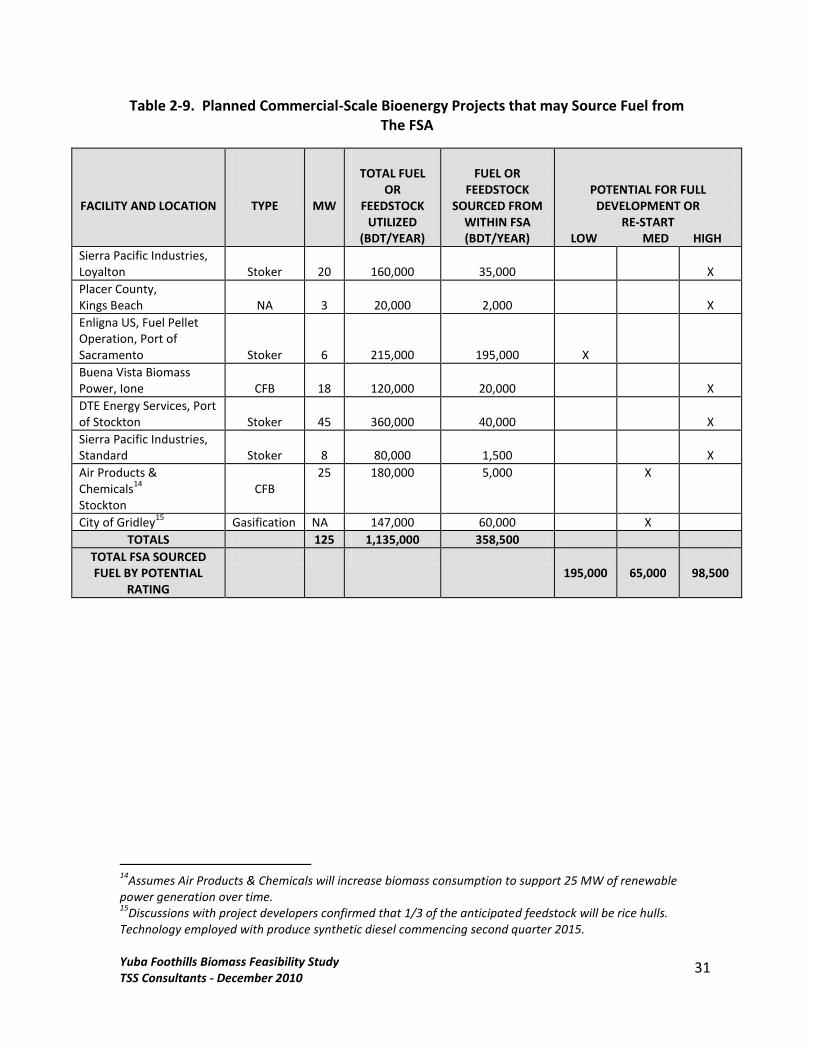
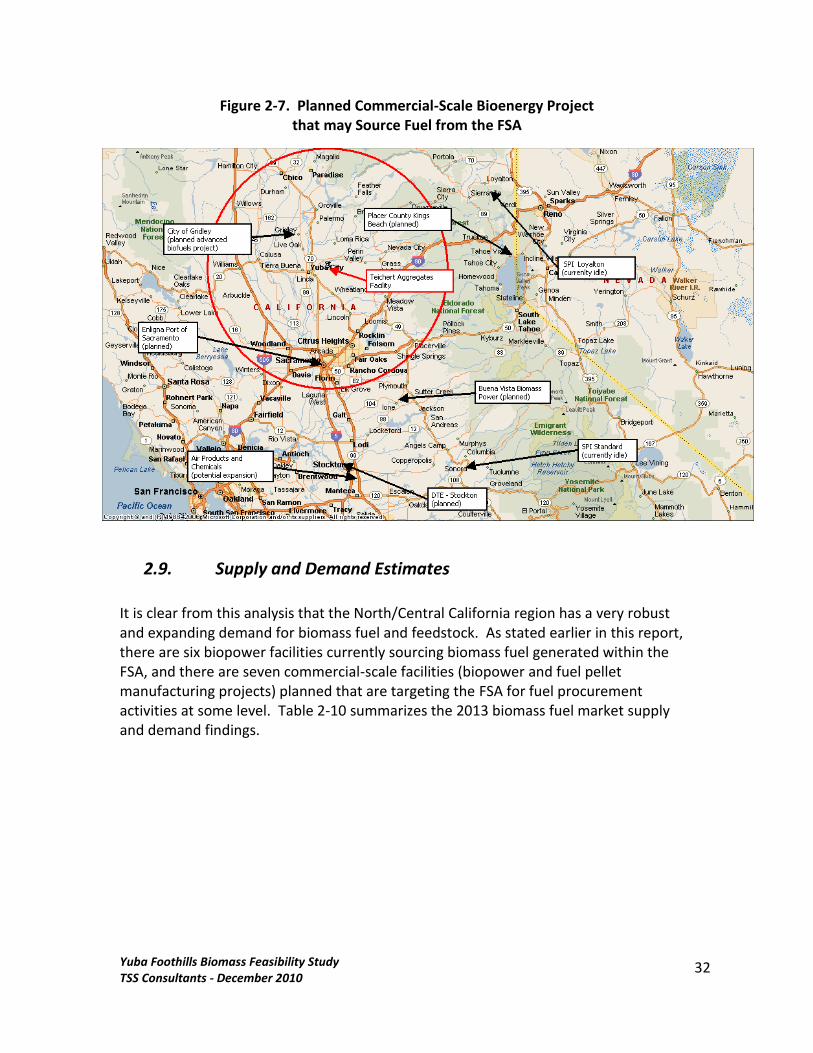
North/Central California (including the FSA) represents a very dynamic and fertile region for biopower and bioenergy development ventures. A total of seven projects are planned for near-term development, refurbishment, expansion, or re-start. One of the projects is a commercial-scale fuel pellet enterprise that represent the first commercial fuel pellet manufacturing operation in California. Table 2-9 provides a detailed list of the seven projects, their location, projected fuel usage (overall and sourcing from the FSA), and forecast on their potential for full development. Figure 2-7 shows their locations.
Yuba Foothills Biomass Feasibility Study TSS Consultants - December 2010
31
Table 2-9. Planned Commercial-Scale Bioenergy Projects that may Source Fuel from The FSA
FACILITY AND LOCATION
TYPE
MW
TOTAL FUEL
OR FEEDSTOCK
UTILIZED (BDT/YEAR)
FUEL OR
FEEDSTOCK SOURCED FROM
WITHIN FSA (BDT/YEAR)
POTENTIAL FOR FULL DEVELOPMENT OR
RE-START LOW MED HIGH
Sierra Pacific Industries, Loyalton
Stoker
20
160,000
35,000
X
Placer County, Kings Beach
NA
3
20,000
2,000
X
Enligna US, Fuel Pellet Operation, Port of Sacramento
Stoker
6
215,000
195,000
X
Buena Vista Biomass Power, Ione
CFB
18
120,000
20,000
X
DTE Energy Services, Port of Stockton
Stoker
45
360,000
40,000
X
Sierra Pacific Industries, Standard
Stoker
8
80,000
1,500
X
Air Products & Chemicals
14
Stockton
CFB
25 180,000 5,000 X
City of Gridley15
Gasification NA 147,000 60,000 X
TOTALS 125 1,135,000 358,500
TOTAL FSA SOURCED FUEL BY POTENTIAL
RATING
195,000
65,000
98,500
14
Assumes Air Products & Chemicals will increase biomass consumption to support 25 MW of renewable power generation over time. 15
Discussions with project developers confirmed that 1/3 of the anticipated feedstock will be rice hulls. Technology employed with produce synthetic diesel commencing second quarter 2015.
Yuba Foothills Biomass Feasibility Study TSS Consultants - December 2010
32
Figure 2-7. Planned Commercial-Scale Bioenergy Project that may Source Fuel from the FSA
2.9. Supply and Demand Estimates
It is clear from this analysis that the North/Central California region has a very robust and expanding demand for biomass fuel and feedstock. As stated earlier in this report, there are six biopower facilities currently sourcing biomass fuel generated within the FSA, and there are seven commercial-scale facilities (biopower and fuel pellet manufacturing projects) planned that are targeting the FSA for fuel procurement activities at some level. Table 2-10 summarizes the 2013 biomass fuel market supply and demand findings.
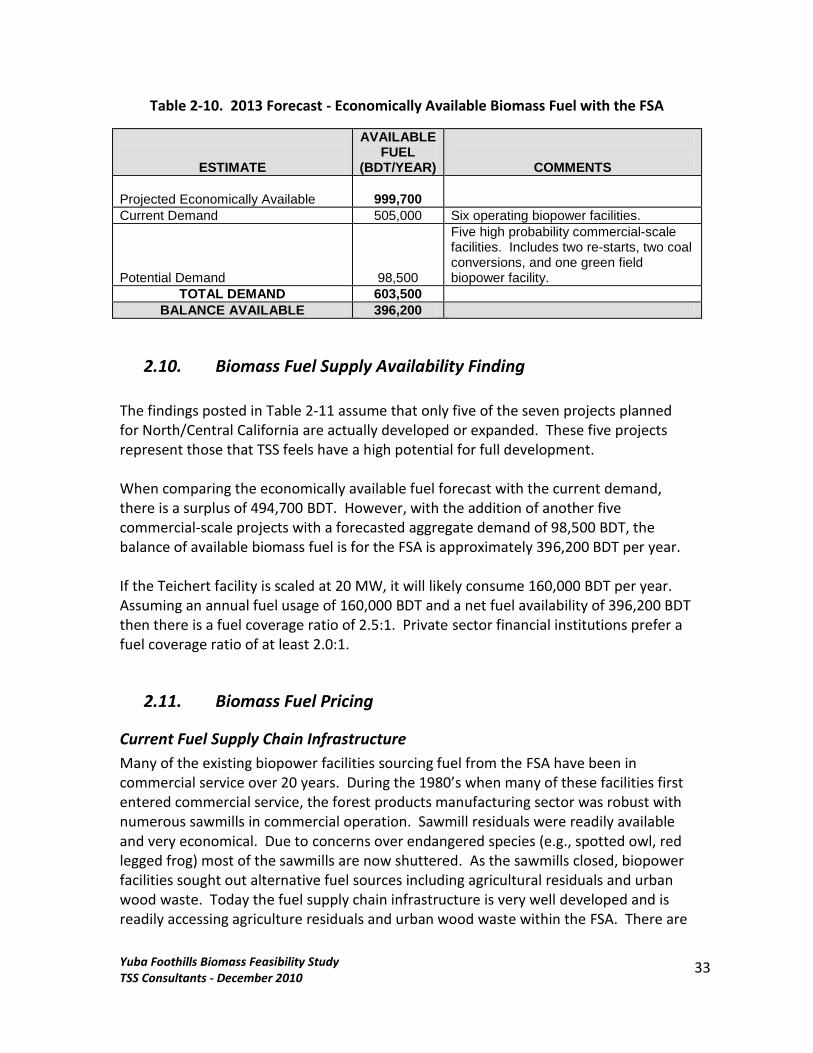
Yuba Foothills Biomass Feasibility Study TSS Consultants - December 2010
33
Table 2-10. 2013 Forecast - Economically Available Biomass Fuel with the FSA
ESTIMATE
AVAILABLE FUEL
(BDT/YEAR)
COMMENTS
Projected Economically Available
999,700
Current Demand 505,000 Six operating biopower facilities.
Potential Demand
98,500
Five high probability commercial-scale facilities. Includes two re-starts, two coal conversions, and one green field biopower facility.
TOTAL DEMAND 603,500
BALANCE AVAILABLE 396,200
2.10. Biomass Fuel Supply Availability Finding
The findings posted in Table 2-11 assume that only five of the seven projects planned for North/Central California are actually developed or expanded. These five projects represent those that TSS feels have a high potential for full development. When comparing the economically available fuel forecast with the current demand, there is a surplus of 494,700 BDT. However, with the addition of another five commercial-scale projects with a forecasted aggregate demand of 98,500 BDT, the balance of available biomass fuel is for the FSA is approximately 396,200 BDT per year. If the Teichert facility is scaled at 20 MW, it will likely consume 160,000 BDT per year. Assuming an annual fuel usage of 160,000 BDT and a net fuel availability of 396,200 BDT then there is a fuel coverage ratio of 2.5:1. Private sector financial institutions prefer a fuel coverage ratio of at least 2.0:1.
2.11. Biomass Fuel Pricing
Current Fuel Supply Chain Infrastructure
Many of the existing biopower facilities sourcing fuel from the FSA have been in commercial service over 20 years. During the 1980’s when many of these facilities first entered commercial service, the forest products manufacturing sector was robust with numerous sawmills in commercial operation. Sawmill residuals were readily available and very economical. Due to concerns over endangered species (e.g., spotted owl, red legged frog) most of the sawmills are now shuttered. As the sawmills closed, biopower facilities sought out alternative fuel sources including agricultural residuals and urban wood waste. Today the fuel supply chain infrastructure is very well developed and is readily accessing agriculture residuals and urban wood waste within the FSA. There are
Yuba Foothills Biomass Feasibility Study TSS Consultants - December 2010
34
a number of fuel suppliers currently offering the full range of services, from collection to processing to transport of biomass fuels.
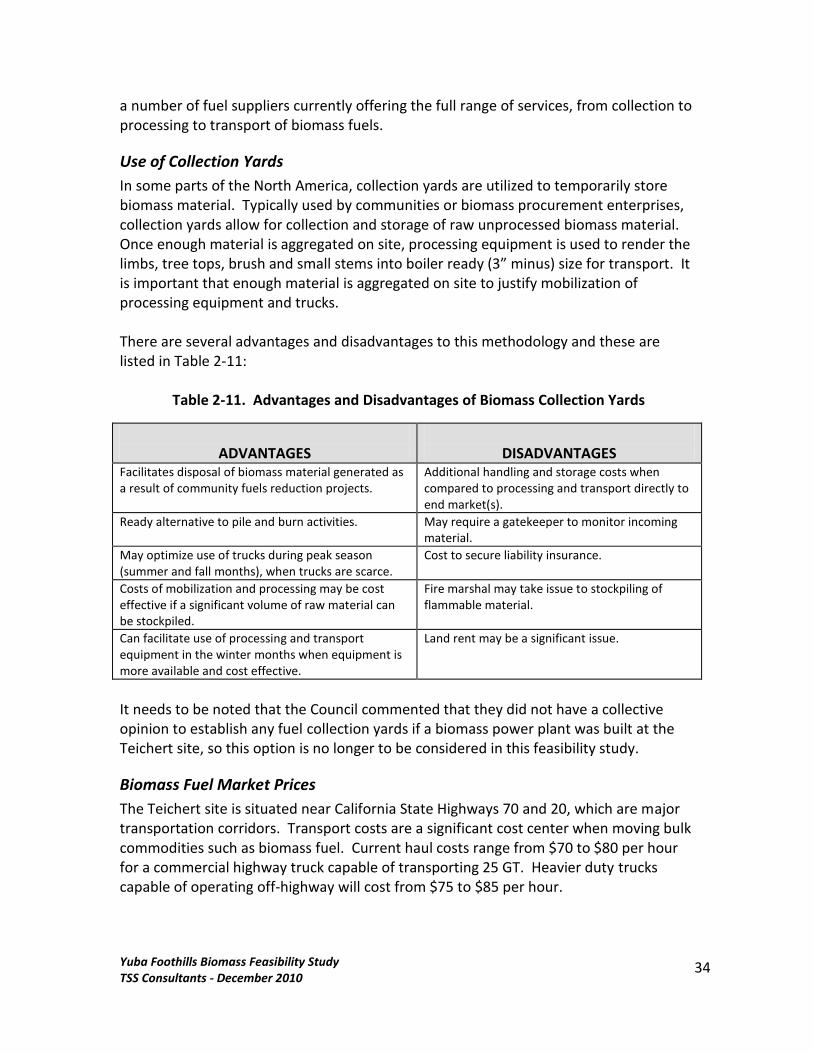
Use of Collection Yards
In some parts of the North America, collection yards are utilized to temporarily store biomass material. Typically used by communities or biomass procurement enterprises, collection yards allow for collection and storage of raw unprocessed biomass material. Once enough material is aggregated on site, processing equipment is used to render the limbs, tree tops, brush and small stems into boiler ready (3” minus) size for transport. It is important that enough material is aggregated on site to justify mobilization of processing equipment and trucks. There are several advantages and disadvantages to this methodology and these are listed in Table 2-11:
Table 2-11. Advantages and Disadvantages of Biomass Collection Yards
ADVANTAGES
DISADVANTAGES
Facilitates disposal of biomass material generated as a result of community fuels reduction projects.
Additional handling and storage costs when compared to processing and transport directly to end market(s).
Ready alternative to pile and burn activities. May require a gatekeeper to monitor incoming material.
May optimize use of trucks during peak season (summer and fall months), when trucks are scarce.
Cost to secure liability insurance.
Costs of mobilization and processing may be cost effective if a significant volume of raw material can be stockpiled.
Fire marshal may take issue to stockpiling of flammable material.
Can facilitate use of processing and transport equipment in the winter months when equipment is more available and cost effective.
Land rent may be a significant issue.
It needs to be noted that the Council commented that they did not have a collective opinion to establish any fuel collection yards if a biomass power plant was built at the Teichert site, so this option is no longer to be considered in this feasibility study.
Biomass Fuel Market Prices
The Teichert site is situated near California State Highways 70 and 20, which are major transportation corridors. Transport costs are a significant cost center when moving bulk commodities such as biomass fuel. Current haul costs range from $70 to $80 per hour for a commercial highway truck capable of transporting 25 GT. Heavier duty trucks capable of operating off-highway will cost from $75 to $85 per hour.
Yuba Foothills Biomass Feasibility Study TSS Consultants - December 2010
35
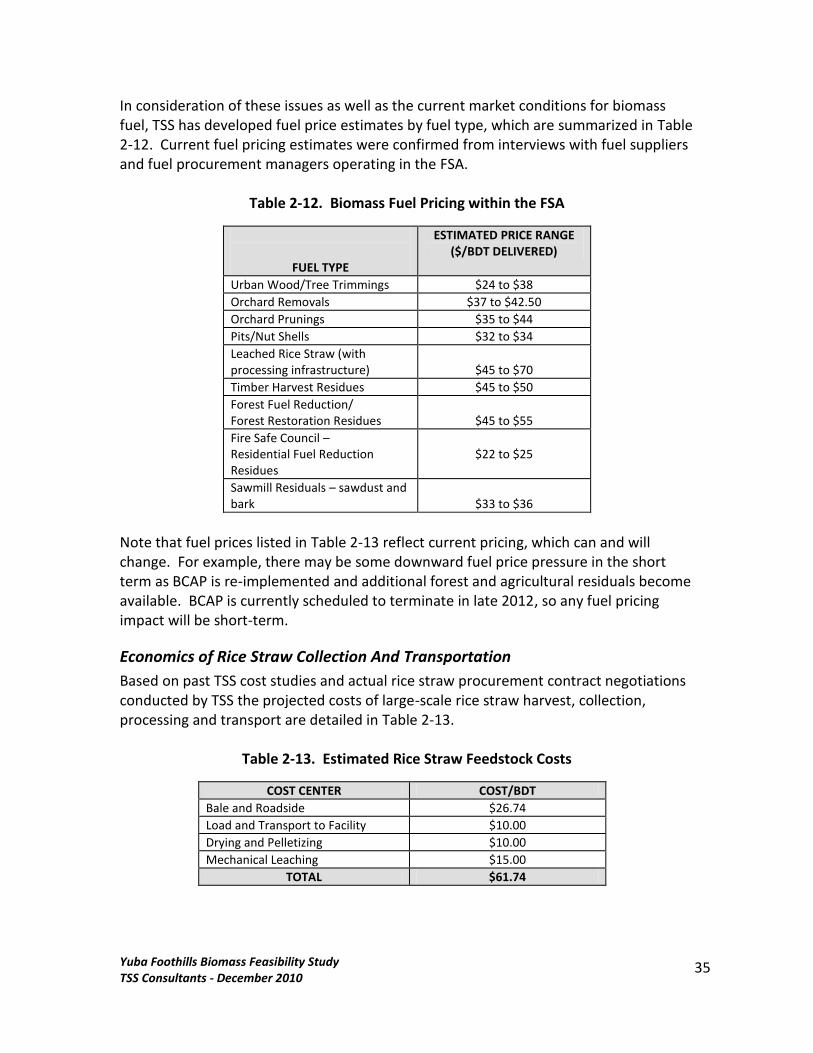
In consideration of these issues as well as the current market conditions for biomass fuel, TSS has developed fuel price estimates by fuel type, which are summarized in Table 2-12. Current fuel pricing estimates were confirmed from interviews with fuel suppliers and fuel procurement managers operating in the FSA.
Table 2-12. Biomass Fuel Pricing within the FSA
FUEL TYPE
ESTIMATED PRICE RANGE ($/BDT DELIVERED)
Urban Wood/Tree Trimmings $24 to $38
Orchard Removals $37 to $42.50
Orchard Prunings $35 to $44
Pits/Nut Shells $32 to $34
Leached Rice Straw (with processing infrastructure)
$45 to $70
Timber Harvest Residues $45 to $50
Forest Fuel Reduction/ Forest Restoration Residues
$45 to $55
Fire Safe Council – Residential Fuel Reduction Residues
$22 to $25
Sawmill Residuals – sawdust and bark
$33 to $36
Note that fuel prices listed in Table 2-13 reflect current pricing, which can and will change. For example, there may be some downward fuel price pressure in the short term as BCAP is re-implemented and additional forest and agricultural residuals become available. BCAP is currently scheduled to terminate in late 2012, so any fuel pricing impact will be short-term.
Economics of Rice Straw Collection And Transportation
Based on past TSS cost studies and actual rice straw procurement contract negotiations conducted by TSS the projected costs of large-scale rice straw harvest, collection, processing and transport are detailed in Table 2-13.
Table 2-13. Estimated Rice Straw Feedstock Costs
COST CENTER COST/BDT
Bale and Roadside $26.74
Load and Transport to Facility $10.00
Drying and Pelletizing $10.00
Mechanical Leaching $15.00
TOTAL $61.74
Yuba Foothills Biomass Feasibility Study TSS Consultants - December 2010
36
Transportation is a significant cost center in the movement of baled rice straw, second only to baling and forwarding to roadside. Loading and transportation costs can be double the cost shown above, as part or all of the rice straw may have to be loaded, unloaded and transported twice: first to a satellite storage site and then from the satellite storage site to the user facility. Using leached rice straw may have additional costs. Storage costs may be significant, as rice straw will need to be collected and baled so that re-planting activities in the Spring are not impacted. If there is a need for washing (mechanical leaching) of the rice straw to substitute for natural precipitation (preferred and most cost effective option), additional infrastructure needs to be established, and this could add approximately $15 per BDT.16 Drying of the washed and leached rice straw may add to the cost. Depending on the biomass combustion technology utilized, the leached rice straw may need to be densified into pellets. These drying and pelletizing operations could add an additional $10 per BDT.
2.12. FUTURE SUPPLY SOURCES AND RISKS
Current Biomass Fuel Market Supply Considerations
Woody biomass fuels are primarily a secondary product from commercial and industrial operations. As a result, external factors from other industries impact and affect the availability and sustainability of biomass fuel supplies within the region. These factors include and are not limited to the overall health and status of the regional economy, housing and forest products industries, agriculture product markets and influence from local, state, and federal regulatory and government agencies.
Urban Wood Waste Trends
Urban wood fuel availability is directly correlated with the health and robustness of the local and regional residential housing markets. On both a regional and national level, the U.S. real estate market (residential housing included) has been adversely impacted by the current economic climate. In 2005, housing starts peaked at 1.7 million single-family homes, and significant declines have been observed since then. Western Wood Products Association (WWPA) has tracked housing starts and has estimated that there were 554,000 housing starts reported in 2009 (see Appendix A). While this is a dramatic decrease over a four to five-year period, WWPA predicts a 21% increase in housing starts in 2010 (compared to 2009 estimates). Figure 2-8 shows observed U.S. single-family housing starts for 1989 through 2009 and forecasted housing starts for 2010.
16
Bakker, R.R. and B.M. Jenkins. 2003. Feasibility of collecting naturally leached rice straw for thermal conversion. Biomass and Bioenergy 25:597-61
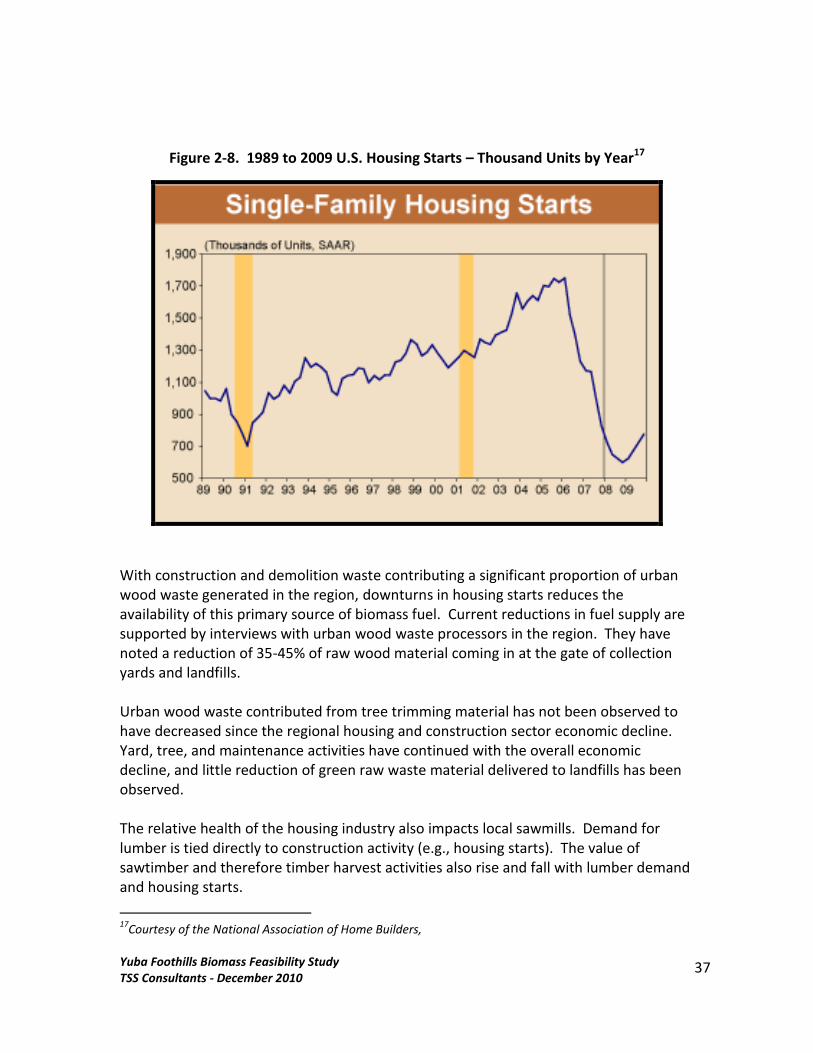
Yuba Foothills Biomass Feasibility Study TSS Consultants - December 2010
37
Figure 2-8. 1989 to 2009 U.S. Housing Starts – Thousand Units by Year17
With construction and demolition waste contributing a significant proportion of urban wood waste generated in the region, downturns in housing starts reduces the availability of this primary source of biomass fuel. Current reductions in fuel supply are supported by interviews with urban wood waste processors in the region. They have noted a reduction of 35-45% of raw wood material coming in at the gate of collection yards and landfills. Urban wood waste contributed from tree trimming material has not been observed to have decreased since the regional housing and construction sector economic decline. Yard, tree, and maintenance activities have continued with the overall economic decline, and little reduction of green raw waste material delivered to landfills has been observed. The relative health of the housing industry also impacts local sawmills. Demand for lumber is tied directly to construction activity (e.g., housing starts). The value of sawtimber and therefore timber harvest activities also rise and fall with lumber demand and housing starts.
17
Courtesy of the National Association of Home Builders,
Yuba Foothills Biomass Feasibility Study TSS Consultants - December 2010
38
Agricultural Trends
Agricultural byproducts comprise almost one half (47%) of the economically available fuel generated within the FSA. Like other biomass fuels agricultural byproducts are not immune to marketplace price fluctuations. In past years almond shells have seen recent price volatility due to feedstock disruptions in the corn-ethanol markets. Demand for grain ethanol feedstocks has caused grain prices to increase and grain users for livestock feed sought other options for lower cost alternatives. Almond shells have been utilized as animal feed additives in this situation, thereby increasing market value and reducing availability for use as fuel. This is a historical context example rather than the current situation as many grain ethanol facilities in California have closed and animal feed prices have returned to prior levels. The Teichert facility is located in a prime location in to utilize residuals from commercial rice crop production in California. The facility’s location is within 75 miles of nearly all of the rice producing acres in California. Overall, leached rice straw is an underutilized resource within the FSA. While this presents some significant benefits such as mitigation of fuel marketplace impacts, and the potential to divert material away from open field burning, there are significant technical challenges to the utilization of leached rice straw as fuel that will have to be addressed to determine if rice straw is a feasible fuel for the proposed facility. As other agricultural biomass fuels within the FSA are utilized by competing facilities, leached rice straw may become a more attractive opportunity fuel source if the technical challenges discussed in the leached rice straw section of the report can be overcome. Several currently operating biomass power generation facilities that operate and source fuel from the FSA are required in their air permits to provide emission offsets for their air emissions. These offsets are provided by sourcing some of their woody biomass fuel from orchard removals, instead of allowing orchard removals to be open burned. The Woodland Biomass facility is required to secure emission offsets by utilizing agricultural residuals. As this facility is required to source agricultural offset fuel, their willingness to pay “whatever it takes” to secure orchard removal fuel will likely set benchmark prices in the marketplace.
Forest Products Industry Trends
The WWPA recently reported (see Appendix A) that sawmills in the western United States are experiencing the most significant decline in lumber demand since the 1940’s. As a direct result of the recent downturn in the housing and construction markets, the forest products manufacturing sector has experienced a steep reduction in the demand for wood products. Sierra Cedar Products, LLC closed its sawmill at Marysville in 2008. Sierra Pacific Industries (SPI), the largest industrial timberland owner in California, has closed three of its sawmills in the last two years, and all (Camino, Quincy, and Standard)
Yuba Foothills Biomass Feasibility Study TSS Consultants - December 2010
39
are located adjacent to the FSA. The Quincy mill is now operational, Standard is being rebuilt, but the Camino mill remains closed. Mill closures have significantly impacted the demand for sawlogs in the region (as discussed in the timber harvest residuals section of this report). However, timber harvest levels should return to normal levels by 2013 or 2014 as housing starts and lumber demand rebound (hopefully).
Transport Cost
The cost of transporting biomass fuel represents the single most significant expense when procuring biomass. Variables such as diesel fuel cost (currently at $3.40+/gallon), workers compensation expense, and maintaining a workforce (locating qualified drivers) are all factors that significantly impact the cost to transport commodities such as biomass fuel. Interviews with commercial transport companies indicate the current cost to transport a bulk commodity such as biomass fuel is $70 to $80 per hour for on highway hauls. At this time, diesel fuel costs are the most significant variable impacting transport costs. Diesel fuel price escalation has had a major impact on biomass fuel prices throughout the U.S. in recent years. Based on TSS’ experience, the average forest-sourced and ag-sourced biomass fuel requires approximately 1.75 to 2 gallons of diesel to process and transport a green ton of forest-sourced fuel with an average roundtrip haul distance of 50 miles. Therefore, a $1.00/gallon increase in diesel fuel equates to a $1.75 to $2.00 per green ton increase in the cost to produce and transport forest or ag-sourced biomass fuel. Assuming that forest/ag-sourced fuels have moisture content of 50%, the $1.00/gallon increase in diesel fuel pricing equates to a $3.50 to $4.00 per BDT cost increase. Any significant increase in the price of diesel fuel presents a risk to the overall economics of producing forest-sourced biomass. Diesel fuel pricing volatility is primarily driven by the cost of crude oil. Figure 2-9 below shows the change in diesel prices from June 2008 to January 2010.18
18Energy Information Administration, http://tonto.eia.doe.gov/
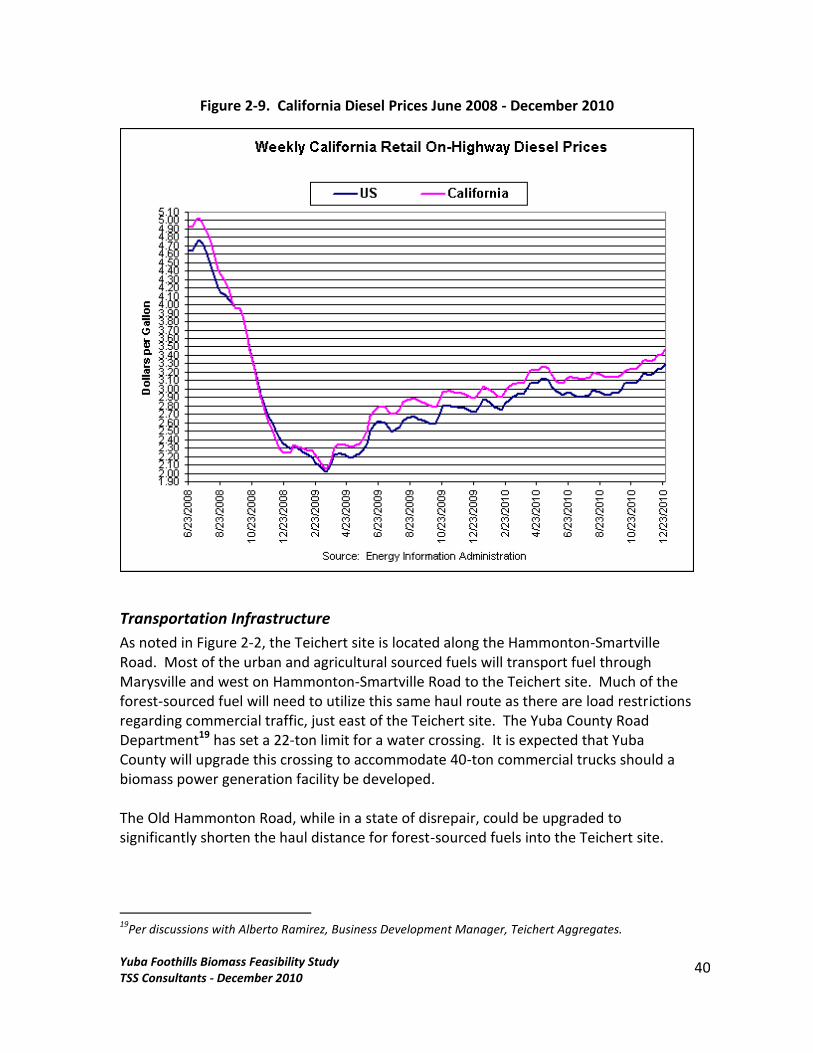
Yuba Foothills Biomass Feasibility Study TSS Consultants - December 2010
40
Figure 2-9. California Diesel Prices June 2008 - December 2010
Transportation Infrastructure
As noted in Figure 2-2, the Teichert site is located along the Hammonton-Smartville Road. Most of the urban and agricultural sourced fuels will transport fuel through Marysville and west on Hammonton-Smartville Road to the Teichert site. Much of the forest-sourced fuel will need to utilize this same haul route as there are load restrictions regarding commercial traffic, just east of the Teichert site. The Yuba County Road Department19 has set a 22-ton limit for a water crossing. It is expected that Yuba County will upgrade this crossing to accommodate 40-ton commercial trucks should a biomass power generation facility be developed. The Old Hammonton Road, while in a state of disrepair, could be upgraded to significantly shorten the haul distance for forest-sourced fuels into the Teichert site.
19
Per discussions with Alberto Ramirez, Business Development Manager, Teichert Aggregates.

Yuba Foothills Biomass Feasibility Study TSS Consultants - December 2010
41
Current estimates confirm that costs to upgrade this road would be approximately two million dollars.20
Seasonal Availability
Many forest operation contactors in the FSA are able to operate from May through October. Inclement weather (primarily precipitation) limits winter operations due to potential damage to soil resources (compaction, erosion). In addition, many of the road systems used to access forest operations are native soil surface and as such are easily damaged during wet weather. A similar situation occurs with agricultural operations in that wet weather can impact ability to operate in the orchards. Orchard removal operations typically occur during late fall through early spring following crop harvest and pruning activities. Urban wood waste is generated year round with a minor drop in availability in November and December due to the holiday season impact on construction and tree trimming activities.
2.13. Biomass Fuel Blend Example
Optimized Fuel Blend
Based upon TSS’ experience with biomass fuel procurement and knowledge of the current biomass fuel markets within the FSA, an optimized fuel blend forecast was developed. This fuel blend recommendation adjusts for the existing competitive fuel marketplace, which a proposed project east of Marysville could be entering. This fuel blend forecast also assumes a 20 MW project with annual fuel usage of 160,000 BDT. Fuels in the optimized fuel blend, which will require time to develop, include material sourced from orchard prunings, residential fuel reduction residues (from Fire Safe Council supported operations) and leached rice straw. In light of these considerations, TSS has prepared a diversified fuel blend which attempts to minimize the impact to existing biomass power plants already established and sourcing fuel from within the FSA (and thereby mitigate fuel pricing pressure). This analysis assumes no change or shift in existing uses from other biomass plants, which may occur if a project at the Teichert site is developed (and enters the fuel marketplace). As shown in Table 2-14, TSS forecasted volume and pricing of an optimized fuel blend. This fuel blend was selected to realize the most optimal long-term pricing while being
20
Per discussions with Alberto Ramirez, Business Development Manager, Teichert Aggregates.
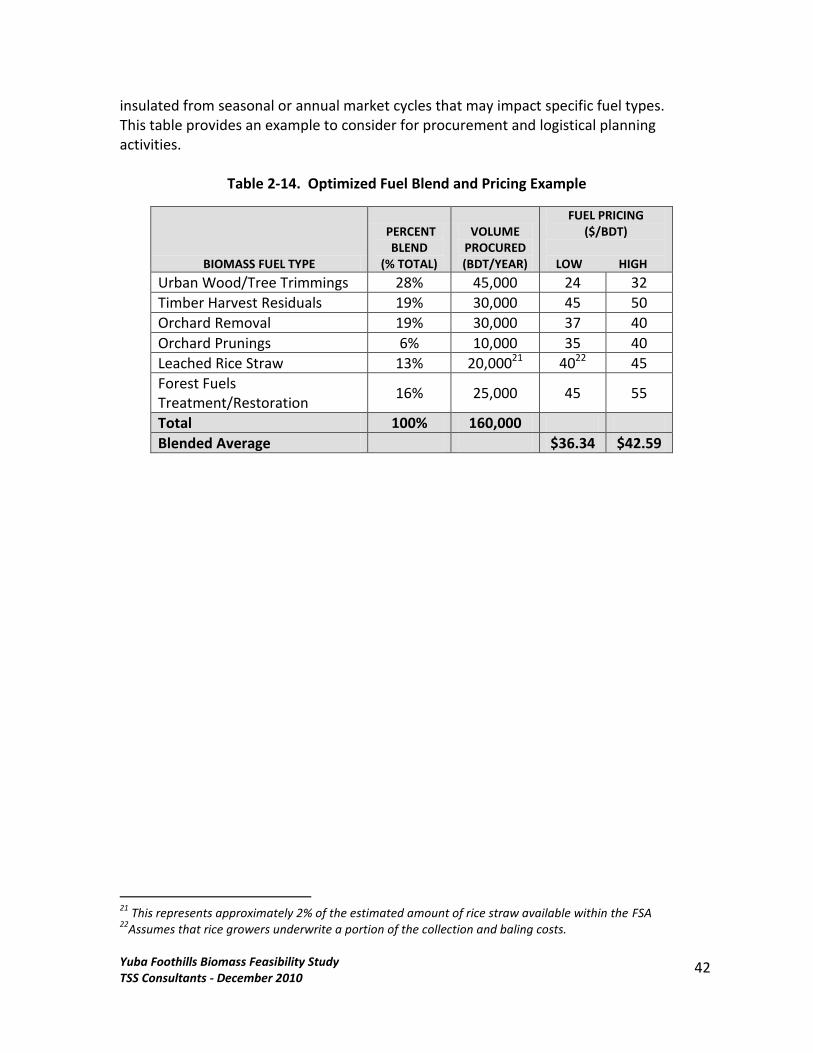
Yuba Foothills Biomass Feasibility Study TSS Consultants - December 2010
42
insulated from seasonal or annual market cycles that may impact specific fuel types. This table provides an example to consider for procurement and logistical planning activities.
Table 2-14. Optimized Fuel Blend and Pricing Example
BIOMASS FUEL TYPE
PERCENT BLEND
(% TOTAL)
VOLUME PROCURED (BDT/YEAR)
FUEL PRICING ($/BDT)
LOW HIGH
Urban Wood/Tree Trimmings 28% 45,000 24 32
Timber Harvest Residuals 19% 30,000 45 50
Orchard Removal 19% 30,000 37 40
Orchard Prunings 6% 10,000 35 40
Leached Rice Straw 13% 20,00021 4022 45
Forest Fuels Treatment/Restoration
16% 25,000 45 55
Total 100% 160,000
Blended Average $36.34 $42.59
21
This represents approximately 2% of the estimated amount of rice straw available within the FSA 22
Assumes that rice growers underwrite a portion of the collection and baling costs.
Yuba Foothills Biomass Feasibility Study TSS Consultants - December 2010
43
3. Siting and Environmental Considerations
Based upon preliminary examination in Phase I and direction from the Council, Phase II examined the siting and environmental considerations for the three top ranked sites:
Oregon House
Celestial Valley
Teichert Aggregates Marysville
These three sites were then further examined per the following parameters:
Suitable site physical attributes – This includes the ability of the site to physically accommodate a power plant.
Land Use permitting – Is the site properly zoned for a biomass power plant and if not what would be necessary to site a power plant at the site
Air Emissions (for power systems) – This is a function more of the size of the facility and the type of electrical generation to be employed. Oregon House and Celestial Valley are proposed as smaller power plant with less overall emissions, whereas the Teichert is proposed as a larger system.
Water/Wastewater (for power systems) – What are the estimated water consumption rates for the proposed systems as well as any wastewater discharge, and how does the site accommodate this or is affected by it?
Given the Phase I and Phase II biomass resource findings, the Oregon House and Celestial Valley are considered suitable for the siting of a 3 MW facility which would use essentially all forest sourced material from the surrounding Yuba County forestlands. A 20 MW power plant facility could be sited at the Teichert site, based on the biomass resource analysis presented in Section 2 above.
3.1. Biomass Conversion Technology Considerations
For the purposes of this Phase II Preliminary Feasibility Study, commercially available direct combustion steam cycle for electrical generation was the technology considered. Direct combustion systems are commercially available and currently appear to have the lowest cost of installation per kilowatt hour. The principal potential impacts of this technology use are air emissions, water use and wastewater discharge.
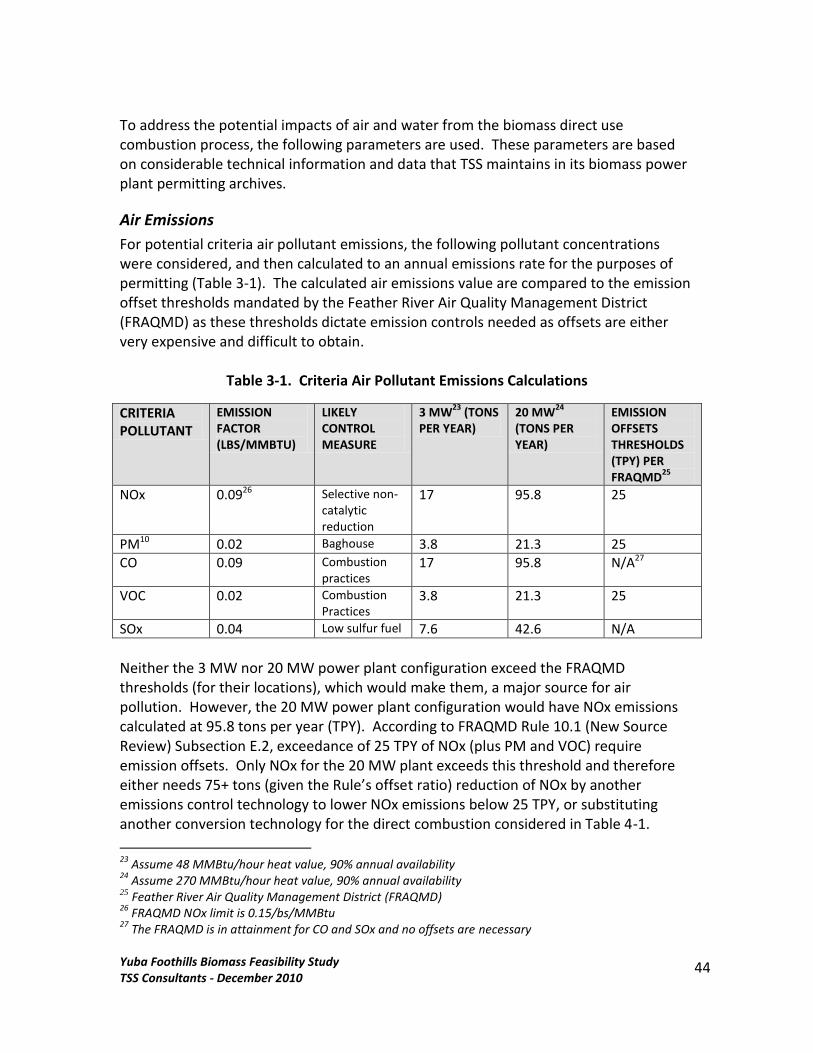
Yuba Foothills Biomass Feasibility Study TSS Consultants - December 2010
44
To address the potential impacts of air and water from the biomass direct use combustion process, the following parameters are used. These parameters are based on considerable technical information and data that TSS maintains in its biomass power plant permitting archives.
Air Emissions
For potential criteria air pollutant emissions, the following pollutant concentrations were considered, and then calculated to an annual emissions rate for the purposes of permitting (Table 3-1). The calculated air emissions value are compared to the emission offset thresholds mandated by the Feather River Air Quality Management District (FRAQMD) as these thresholds dictate emission controls needed as offsets are either very expensive and difficult to obtain.
Table 3-1. Criteria Air Pollutant Emissions Calculations
CRITERIA POLLUTANT
EMISSION FACTOR (LBS/MMBTU)
LIKELY CONTROL MEASURE
3 MW23
(TONS PER YEAR)
20 MW24
(TONS PER YEAR)
EMISSION OFFSETS THRESHOLDS (TPY) PER FRAQMD
25
NOx 0.0926 Selective non-catalytic reduction
17 95.8 25
PM10 0.02 Baghouse 3.8 21.3 25
CO 0.09 Combustion practices
17 95.8 N/A27
VOC 0.02 Combustion Practices
3.8 21.3 25
SOx 0.04 Low sulfur fuel 7.6 42.6 N/A
Neither the 3 MW nor 20 MW power plant configuration exceed the FRAQMD thresholds (for their locations), which would make them, a major source for air pollution. However, the 20 MW power plant configuration would have NOx emissions calculated at 95.8 tons per year (TPY). According to FRAQMD Rule 10.1 (New Source Review) Subsection E.2, exceedance of 25 TPY of NOx (plus PM and VOC) require emission offsets. Only NOx for the 20 MW plant exceeds this threshold and therefore either needs 75+ tons (given the Rule’s offset ratio) reduction of NOx by another emissions control technology to lower NOx emissions below 25 TPY, or substituting another conversion technology for the direct combustion considered in Table 4-1.
23
Assume 48 MMBtu/hour heat value, 90% annual availability 24
Assume 270 MMBtu/hour heat value, 90% annual availability 25
Feather River Air Quality Management District (FRAQMD) 26
FRAQMD NOx limit is 0.15/bs/MMBtu 27
The FRAQMD is in attainment for CO and SOx and no offsets are necessary
Yuba Foothills Biomass Feasibility Study TSS Consultants - December 2010
45
Water Supply/Emissions
Water supply and emissions (i.e., cooling water discharge) for this analysis take the conservative approach of considering a biomass direct combustion steam cycle system to be the conversion technology for the candidate sties. Water use and discharge can be approximated by the megawatts rating of the facility, which then result in how much water is needed to operate the facility (primarily for evaporative cooling of the steam cycle) and how much water (on an average basis) might be discharged from the system. Water consumption is estimated at 10 gallons per minute needed per megawatt. Therefore, a 3 MW facility would require approximately 30 gallons per minute (gpm). Assuming an annual average of 75% of this water will be lost in the evaporative process (via cooling towers), there will be an average discharge of approximately 7.5 gpm. A 20 MW facility will need about 200 gpm for water supply, with an average of 50 gpm discharge. It is assumed that the discharge water will necessarily be discharged to a pond system for further evaporation as the “disposal” method. At the small-scale system sites, Oregon House and Celestial Valley, it is believed that water supply could be afforded by groundwater wells to be installed, as 30 gpm is relatively low yield from an industrial sized well. Discharge evaporation impoundment would have to be sized between 2 and 3 acres to accommodate the flow and ambient evaporation rates of the region. At the Teichert site, water supply would have to be in the order of 200 gpm. Discharge evaporation impoundment(s) would need to be in the order of 15 to 20 acres in size. Teichert reports that the Marysville site has the necessary water supply. There is also an existing 53 acre impoundment on the property, which could be used for evaporation of discharged cooling water28. All three sites have adequate acreage to allow for discharge impoundments. And, available water supply appears to be adequate for the conservative case analysis.
28
Per discussions with Alberto Ramirez, Business Development Manager, Teichert Aggregates
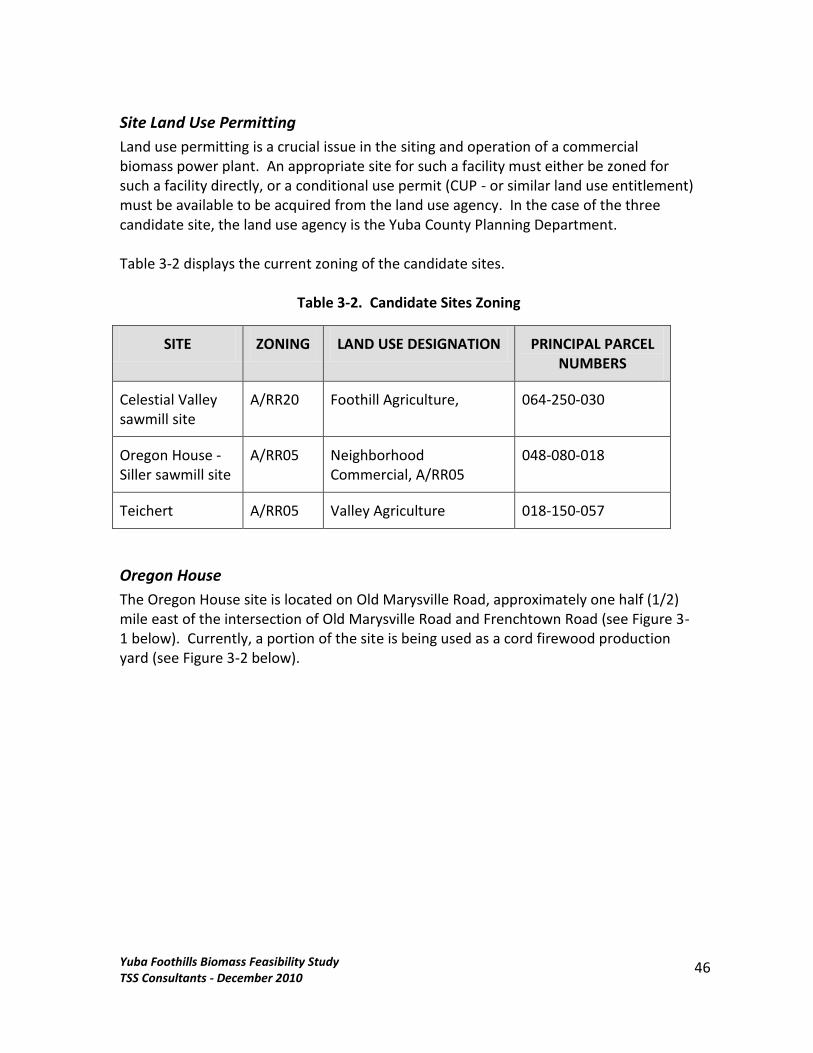
Yuba Foothills Biomass Feasibility Study TSS Consultants - December 2010
46
Site Land Use Permitting
Land use permitting is a crucial issue in the siting and operation of a commercial biomass power plant. An appropriate site for such a facility must either be zoned for such a facility directly, or a conditional use permit (CUP - or similar land use entitlement) must be available to be acquired from the land use agency. In the case of the three candidate site, the land use agency is the Yuba County Planning Department. Table 3-2 displays the current zoning of the candidate sites.
Table 3-2. Candidate Sites Zoning
SITE ZONING LAND USE DESIGNATION PRINCIPAL PARCEL NUMBERS
Celestial Valley sawmill site
A/RR20 Foothill Agriculture, 064-250-030
Oregon House - Siller sawmill site
A/RR05 Neighborhood Commercial, A/RR05
048-080-018
Teichert A/RR05 Valley Agriculture 018-150-057
Oregon House
The Oregon House site is located on Old Marysville Road, approximately one half (1/2) mile east of the intersection of Old Marysville Road and Frenchtown Road (see Figure 3-1 below). Currently, a portion of the site is being used as a cord firewood production yard (see Figure 3-2 below).
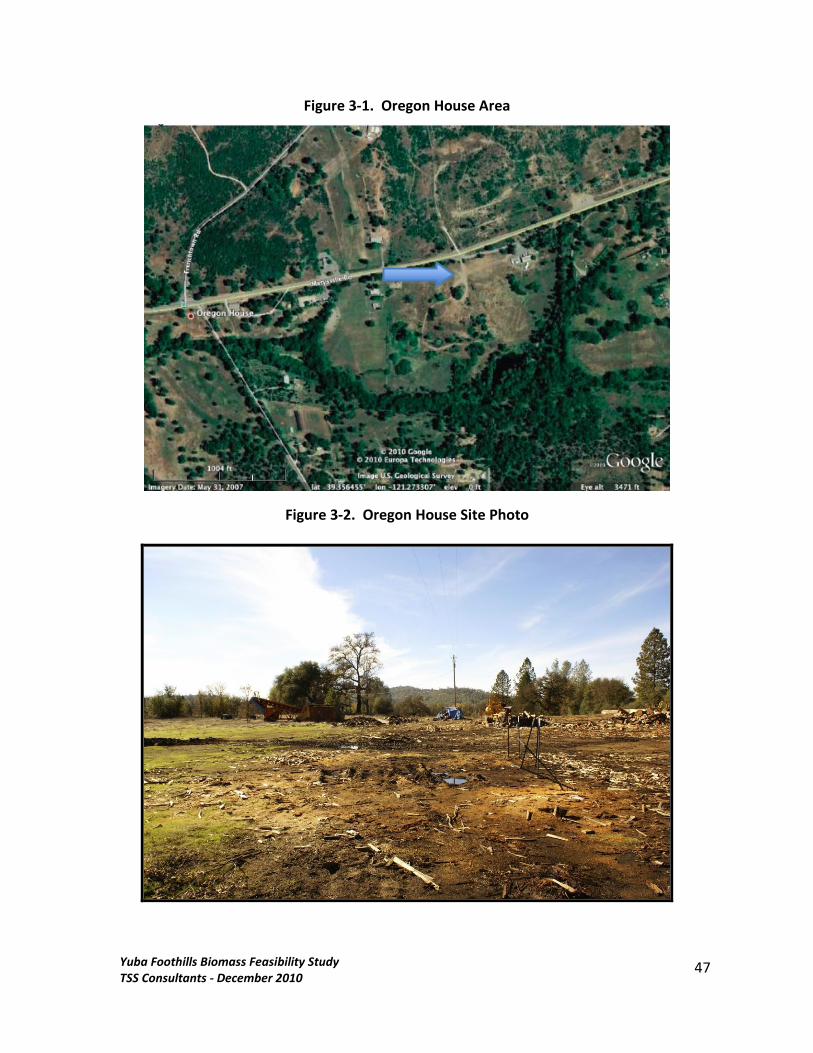
Yuba Foothills Biomass Feasibility Study TSS Consultants - December 2010
47
Figure 3-1. Oregon House Area
Figure 3-2. Oregon House Site Photo
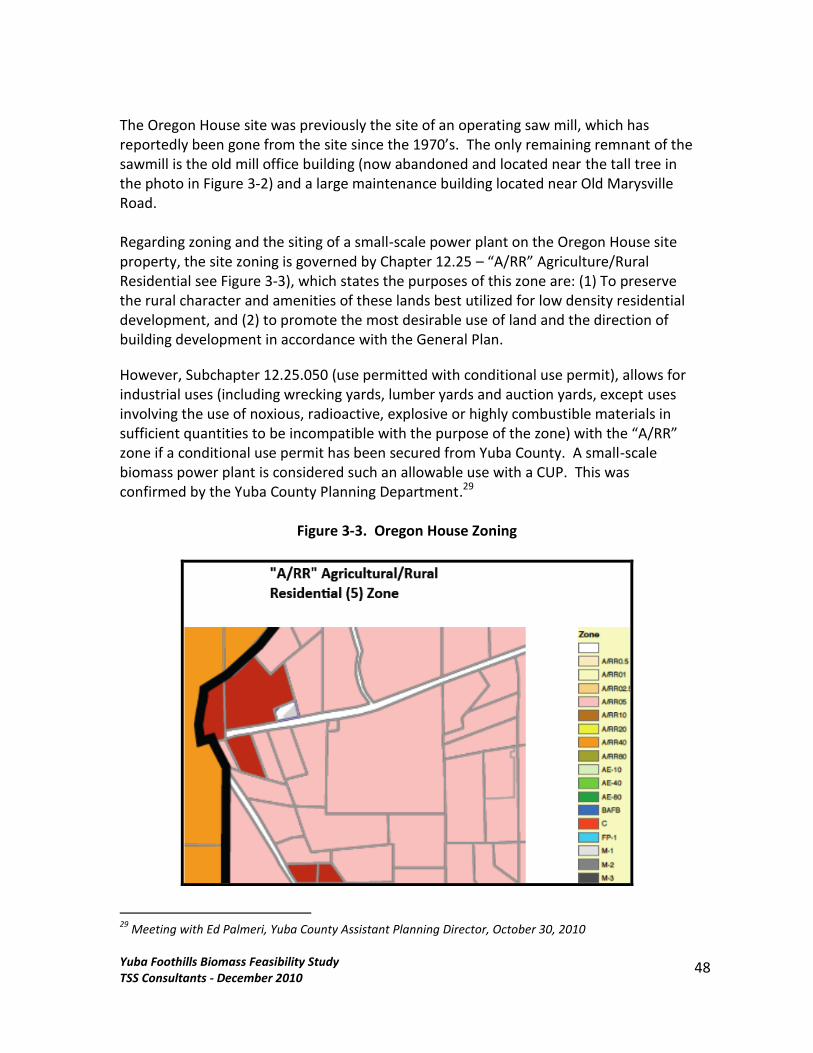
Yuba Foothills Biomass Feasibility Study TSS Consultants - December 2010
48
The Oregon House site was previously the site of an operating saw mill, which has reportedly been gone from the site since the 1970’s. The only remaining remnant of the sawmill is the old mill office building (now abandoned and located near the tall tree in the photo in Figure 3-2) and a large maintenance building located near Old Marysville Road. Regarding zoning and the siting of a small-scale power plant on the Oregon House site property, the site zoning is governed by Chapter 12.25 – “A/RR” Agriculture/Rural Residential see Figure 3-3), which states the purposes of this zone are: (1) To preserve the rural character and amenities of these lands best utilized for low density residential development, and (2) to promote the most desirable use of land and the direction of building development in accordance with the General Plan.
However, Subchapter 12.25.050 (use permitted with conditional use permit), allows for industrial uses (including wrecking yards, lumber yards and auction yards, except uses involving the use of noxious, radioactive, explosive or highly combustible materials in sufficient quantities to be incompatible with the purpose of the zone) with the “A/RR” zone if a conditional use permit has been secured from Yuba County. A small-scale biomass power plant is considered such an allowable use with a CUP. This was confirmed by the Yuba County Planning Department.29
Figure 3-3. Oregon House Zoning
29
Meeting with Ed Palmeri, Yuba County Assistant Planning Director, October 30, 2010
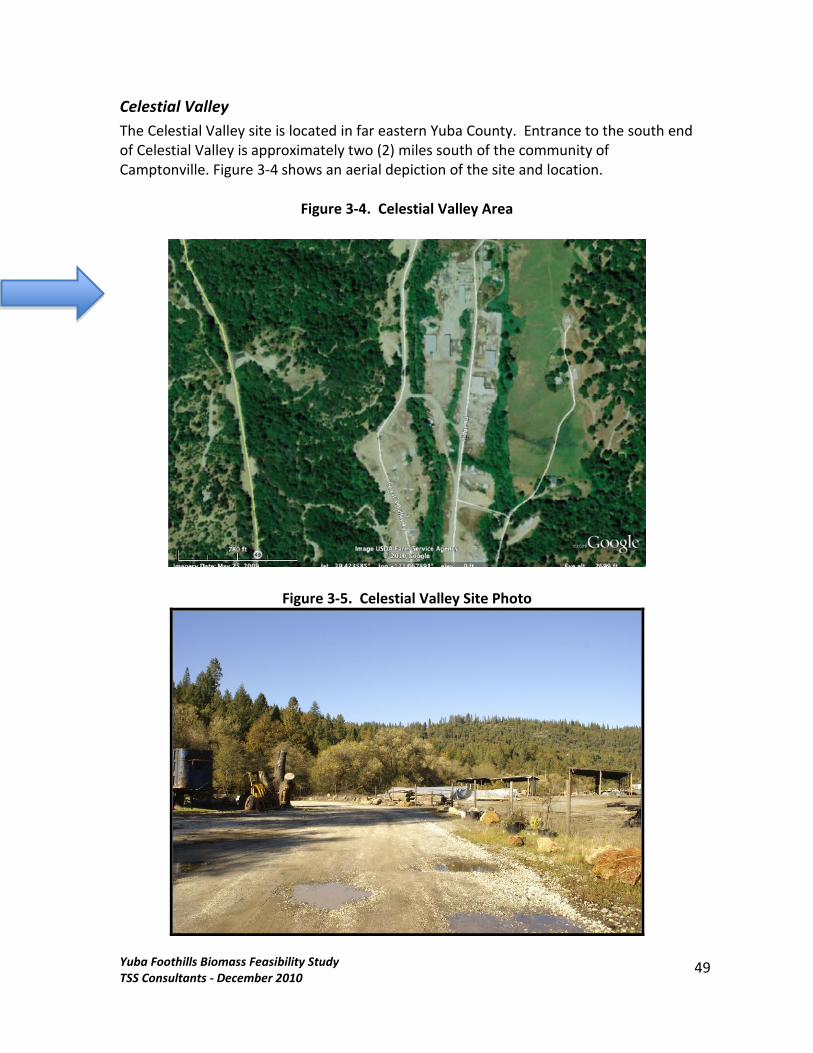
Yuba Foothills Biomass Feasibility Study TSS Consultants - December 2010
49
Celestial Valley
The Celestial Valley site is located in far eastern Yuba County. Entrance to the south end of Celestial Valley is approximately two (2) miles south of the community of Camptonville. Figure 3-4 shows an aerial depiction of the site and location.
Figure 3-4. Celestial Valley Area
Figure 3-5. Celestial Valley Site Photo
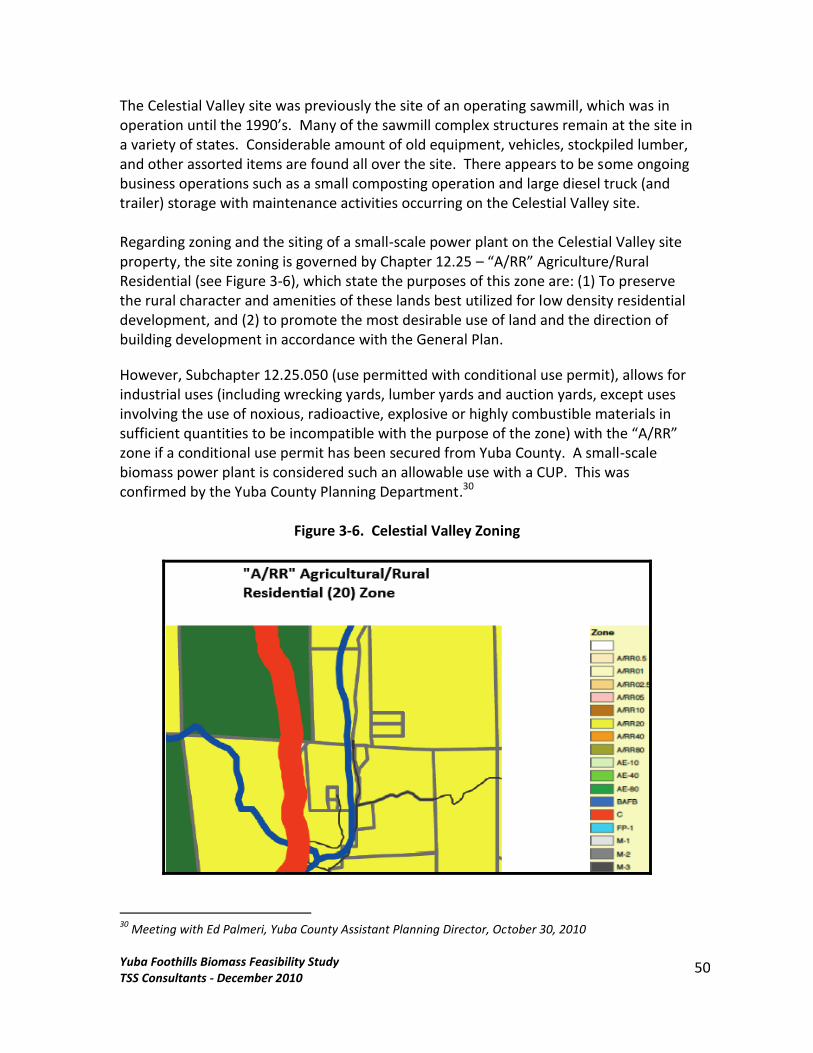
Yuba Foothills Biomass Feasibility Study TSS Consultants - December 2010
50
The Celestial Valley site was previously the site of an operating sawmill, which was in operation until the 1990’s. Many of the sawmill complex structures remain at the site in a variety of states. Considerable amount of old equipment, vehicles, stockpiled lumber, and other assorted items are found all over the site. There appears to be some ongoing business operations such as a small composting operation and large diesel truck (and trailer) storage with maintenance activities occurring on the Celestial Valley site. Regarding zoning and the siting of a small-scale power plant on the Celestial Valley site property, the site zoning is governed by Chapter 12.25 – “A/RR” Agriculture/Rural Residential (see Figure 3-6), which state the purposes of this zone are: (1) To preserve the rural character and amenities of these lands best utilized for low density residential development, and (2) to promote the most desirable use of land and the direction of building development in accordance with the General Plan.
However, Subchapter 12.25.050 (use permitted with conditional use permit), allows for industrial uses (including wrecking yards, lumber yards and auction yards, except uses involving the use of noxious, radioactive, explosive or highly combustible materials in sufficient quantities to be incompatible with the purpose of the zone) with the “A/RR” zone if a conditional use permit has been secured from Yuba County. A small-scale biomass power plant is considered such an allowable use with a CUP. This was confirmed by the Yuba County Planning Department.30
Figure 3-6. Celestial Valley Zoning
30
Meeting with Ed Palmeri, Yuba County Assistant Planning Director, October 30, 2010
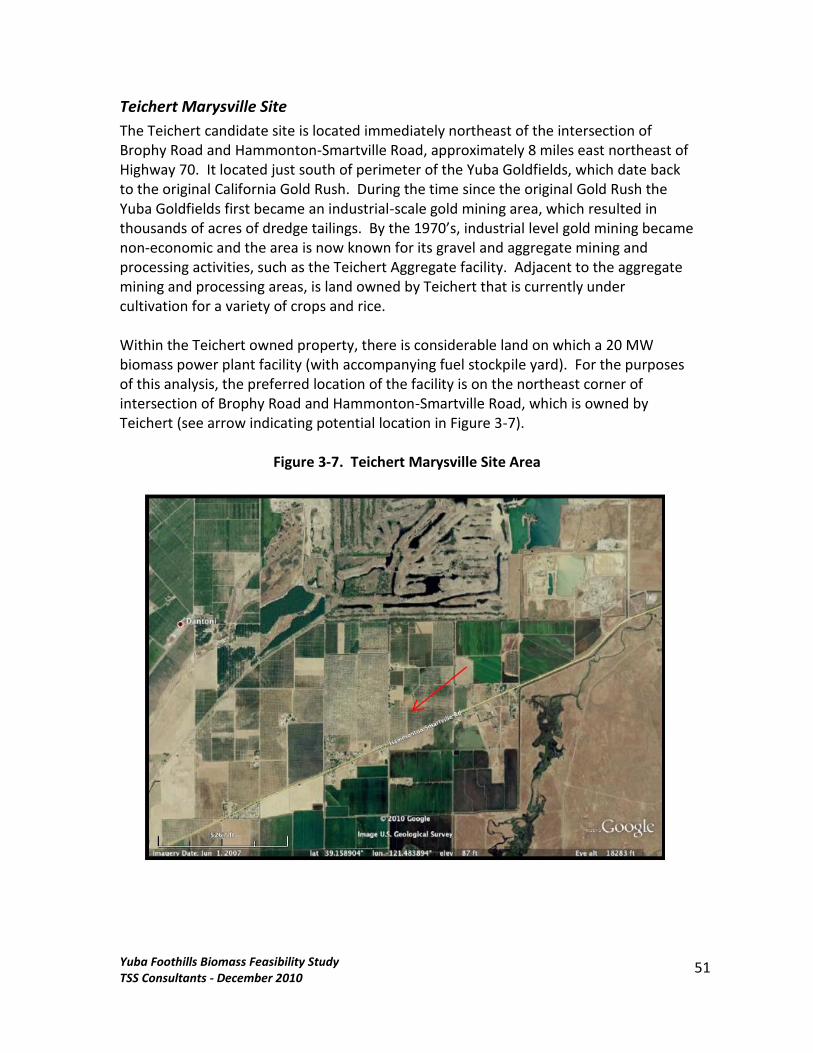
Yuba Foothills Biomass Feasibility Study TSS Consultants - December 2010
51
Teichert Marysville Site
The Teichert candidate site is located immediately northeast of the intersection of Brophy Road and Hammonton-Smartville Road, approximately 8 miles east northeast of Highway 70. It located just south of perimeter of the Yuba Goldfields, which date back to the original California Gold Rush. During the time since the original Gold Rush the Yuba Goldfields first became an industrial-scale gold mining area, which resulted in thousands of acres of dredge tailings. By the 1970’s, industrial level gold mining became non-economic and the area is now known for its gravel and aggregate mining and processing activities, such as the Teichert Aggregate facility. Adjacent to the aggregate mining and processing areas, is land owned by Teichert that is currently under cultivation for a variety of crops and rice. Within the Teichert owned property, there is considerable land on which a 20 MW biomass power plant facility (with accompanying fuel stockpile yard). For the purposes of this analysis, the preferred location of the facility is on the northeast corner of intersection of Brophy Road and Hammonton-Smartville Road, which is owned by Teichert (see arrow indicating potential location in Figure 3-7).
Figure 3-7. Teichert Marysville Site Area
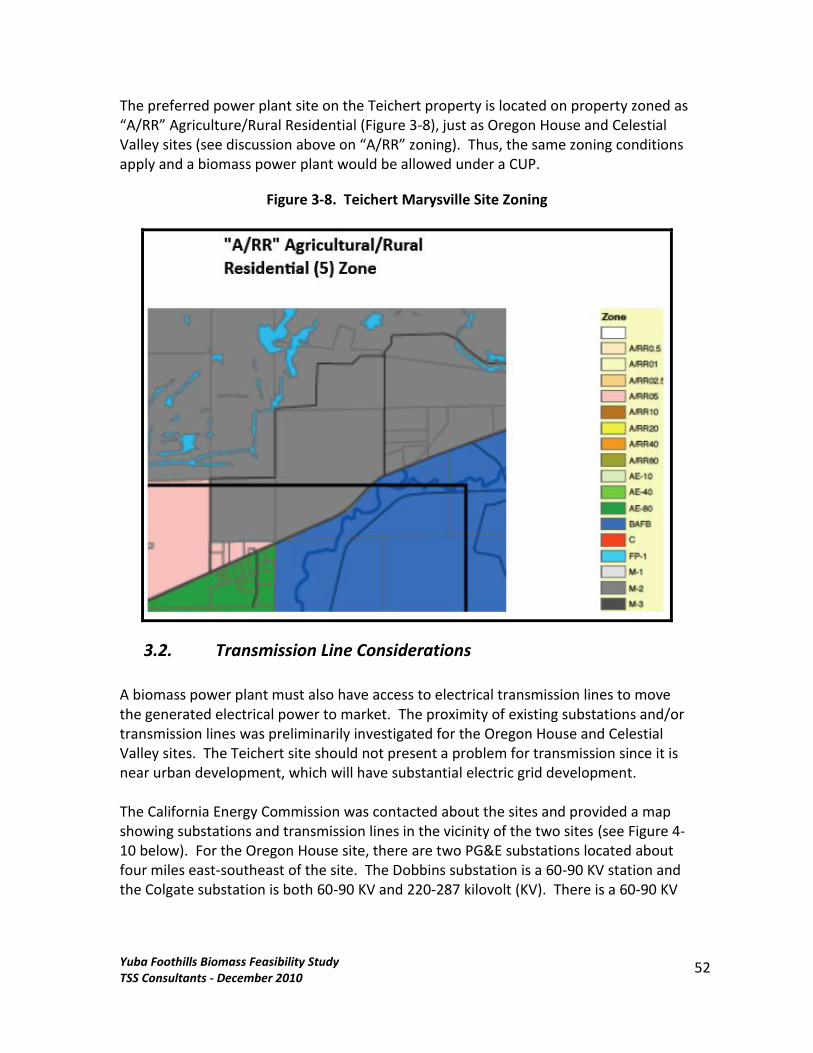
Yuba Foothills Biomass Feasibility Study TSS Consultants - December 2010
52
The preferred power plant site on the Teichert property is located on property zoned as “A/RR” Agriculture/Rural Residential (Figure 3-8), just as Oregon House and Celestial Valley sites (see discussion above on “A/RR” zoning). Thus, the same zoning conditions apply and a biomass power plant would be allowed under a CUP.
Figure 3-8. Teichert Marysville Site Zoning
3.2. Transmission Line Considerations
A biomass power plant must also have access to electrical transmission lines to move the generated electrical power to market. The proximity of existing substations and/or transmission lines was preliminarily investigated for the Oregon House and Celestial Valley sites. The Teichert site should not present a problem for transmission since it is near urban development, which will have substantial electric grid development. The California Energy Commission was contacted about the sites and provided a map showing substations and transmission lines in the vicinity of the two sites (see Figure 4-10 below). For the Oregon House site, there are two PG&E substations located about four miles east-southeast of the site. The Dobbins substation is a 60-90 KV station and the Colgate substation is both 60-90 KV and 220-287 kilovolt (KV). There is a 60-90 KV
Yuba Foothills Biomass Feasibility Study TSS Consultants - December 2010
53
transmission line coming out of the Colgate substation that passes about one mile south of the site. The Celestial Valley site is located between the Pike City substation located about five miles northeast and the Columbia Hill substation located about five miles south-southeast of the site. A 60-92 KV transmission line runs between the two substations and passes about two and one half miles southeast of the site. Figure 3-9 highlights the transmissions distribution systems tributary to the Oregon House and Celestial Valley sites.
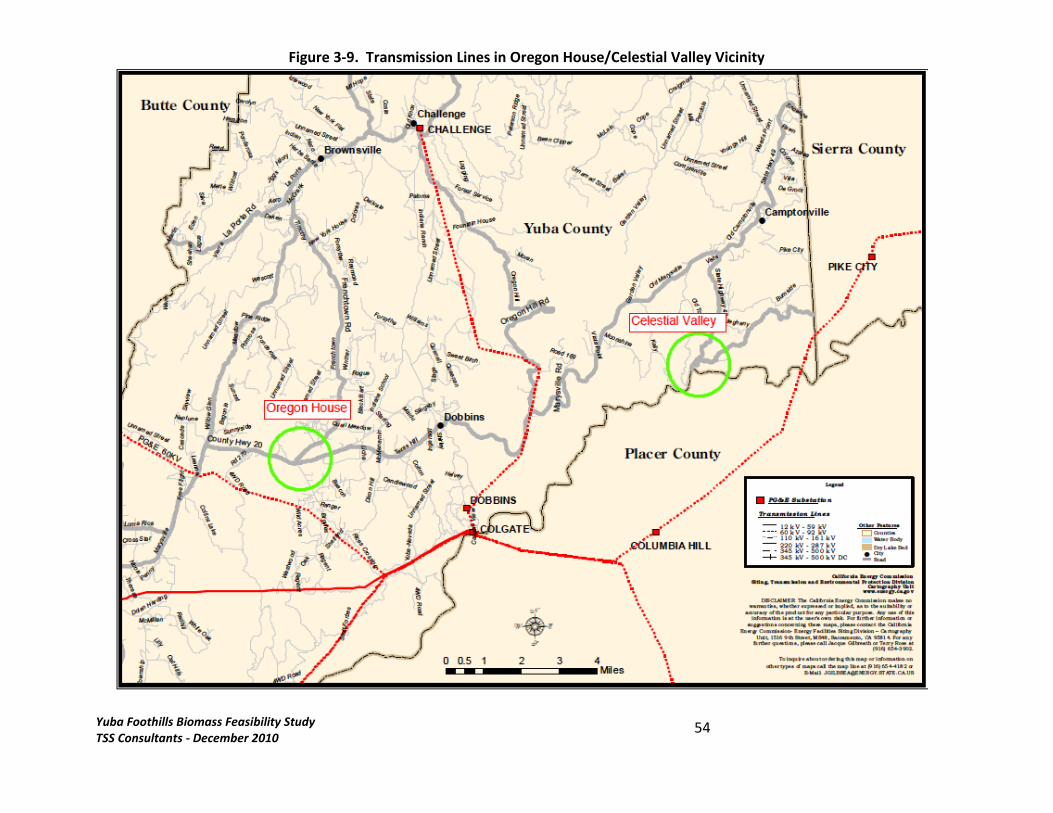
Yuba Foothills Biomass Feasibility Study TSS Consultants - December 2010
54
Figure 3-9. Transmission Lines in Oregon House/Celestial Valley Vicinity
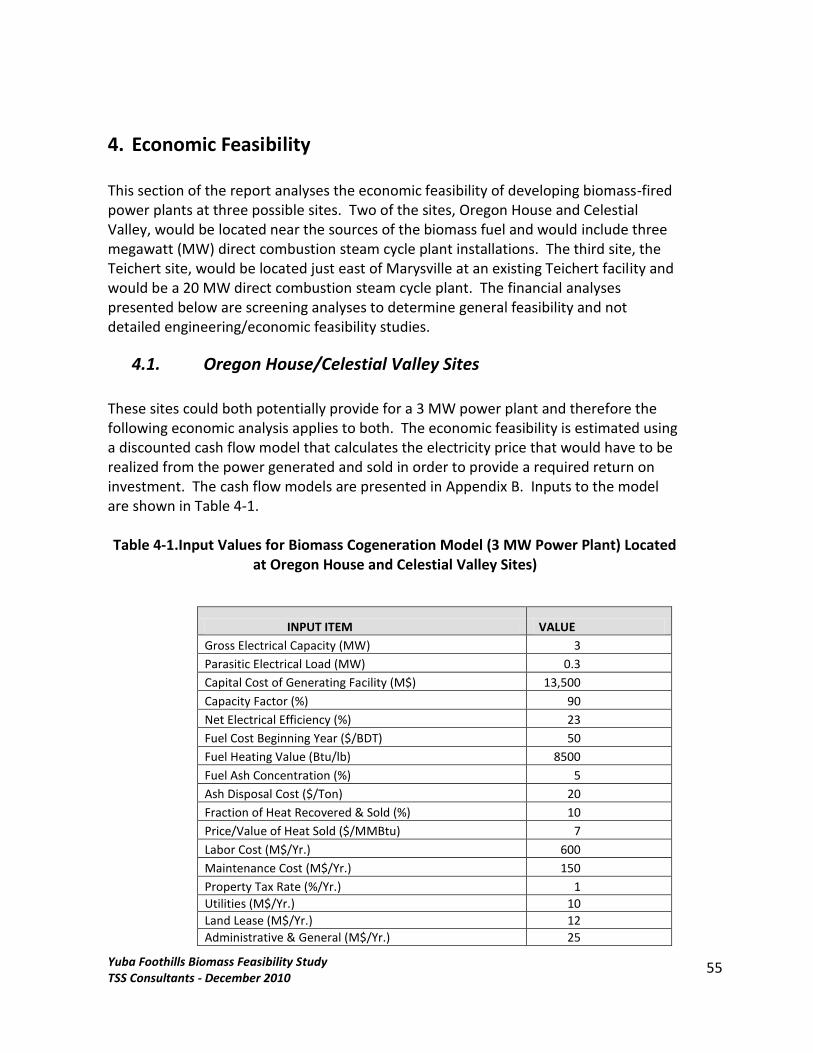
Yuba Foothills Biomass Feasibility Study TSS Consultants - December 2010
55
4. Economic Feasibility This section of the report analyses the economic feasibility of developing biomass-fired power plants at three possible sites. Two of the sites, Oregon House and Celestial Valley, would be located near the sources of the biomass fuel and would include three megawatt (MW) direct combustion steam cycle plant installations. The third site, the Teichert site, would be located just east of Marysville at an existing Teichert facility and would be a 20 MW direct combustion steam cycle plant. The financial analyses presented below are screening analyses to determine general feasibility and not detailed engineering/economic feasibility studies.
4.1. Oregon House/Celestial Valley Sites
These sites could both potentially provide for a 3 MW power plant and therefore the following economic analysis applies to both. The economic feasibility is estimated using a discounted cash flow model that calculates the electricity price that would have to be realized from the power generated and sold in order to provide a required return on investment. The cash flow models are presented in Appendix B. Inputs to the model are shown in Table 4-1. Table 4-1.Input Values for Biomass Cogeneration Model (3 MW Power Plant) Located
at Oregon House and Celestial Valley Sites)
INPUT ITEM VALUE
Gross Electrical Capacity (MW) 3
Parasitic Electrical Load (MW) 0.3
Capital Cost of Generating Facility (M$) 13,500
Capacity Factor (%) 90
Net Electrical Efficiency (%) 23
Fuel Cost Beginning Year ($/BDT) 50
Fuel Heating Value (Btu/lb) 8500
Fuel Ash Concentration (%) 5
Ash Disposal Cost ($/Ton) 20
Fraction of Heat Recovered & Sold (%) 10
Price/Value of Heat Sold ($/MMBtu) 7
Labor Cost (M$/Yr.) 600
Maintenance Cost (M$/Yr.) 150
Property Tax Rate (%/Yr.) 1
Utilities (M$/Yr.) 10
Land Lease (M$/Yr.) 12
Administrative & General (M$/Yr.) 25

Yuba Foothills Biomass Feasibility Study TSS Consultants - December 2010
56
INPUT ITEM VALUE
Other Operating Expenses (M$/Yr.) 20
Federal Income Tax Rate (%) 35
State Income Tax Rate (%) 9
Tax Depreciation Method MACRS-5
Investment Tax Credit Rate ($) 30
Escalation Rates-All Items (%/Yr.) 2
Debt Ratio (%) 75
Interest Rate on Debt (%) 7
Economic Life of Plant (Yrs.) 20
Return on Equity Required (%) 15
The analysis assumes that some of the heat (10%) can be used at either of the sites for space heating, drying, or other processes that require a heat source. This may or may not be true, depending on what processes or operations could be collocated at the sites. Of course, the more heat that can be recovered from the plant, the better the economics and the lower the price that must be realized from sale of electricity. Some cogeneration facilities can utilize as much as 70% of the heat discharged from the plant. Seventy five percent of the capital cost of the project is assumed to be financed with debt at an annual interest rate of 7%. If a higher interest rate is required, the required electricity price will be higher to achieve the required return on owner’s capital. The price at which electricity is sold is adjusted until the net present value (NPV) equals zero. At a NPV of zero, the owner of the plant will receive a return on his investment (25% of the total capital cost of the facility) of 15% per year. The calculated results from the model are very dependent on tax deductions and credits. These include accelerated depreciation and investment tax credit (ITC), which are heavily weighted in the early years of the project. Investment tax credit (ITC) allows the project’s owner to reduce federal income taxes in an amount equal to 30% of the capital cost of the project. For example, if the capital cost of the project was $1 million, then $300,000 could be deducted from the project’s owner’s federal tax liability. The 30% credit can be used for projects developed prior to January 1, 2012 expiration date. However, to realize the benefit of the ITC, the project’s owner must owe federal income tax that can be reduced or eliminated. As can be seen from the owner’s cash flow stream (Line entitled “Owner’s cash flow” of the spreadsheet model in Appendix B), the cash flow is heavily positive in the first three years of the project and then goes negative for the remaining years. Generally an individual biomass electric generating project cannot realize all of the tax benefits, and these deductions and credits, if they are to be realized (and make the project economically feasible) must be applied against other owner projects or income from
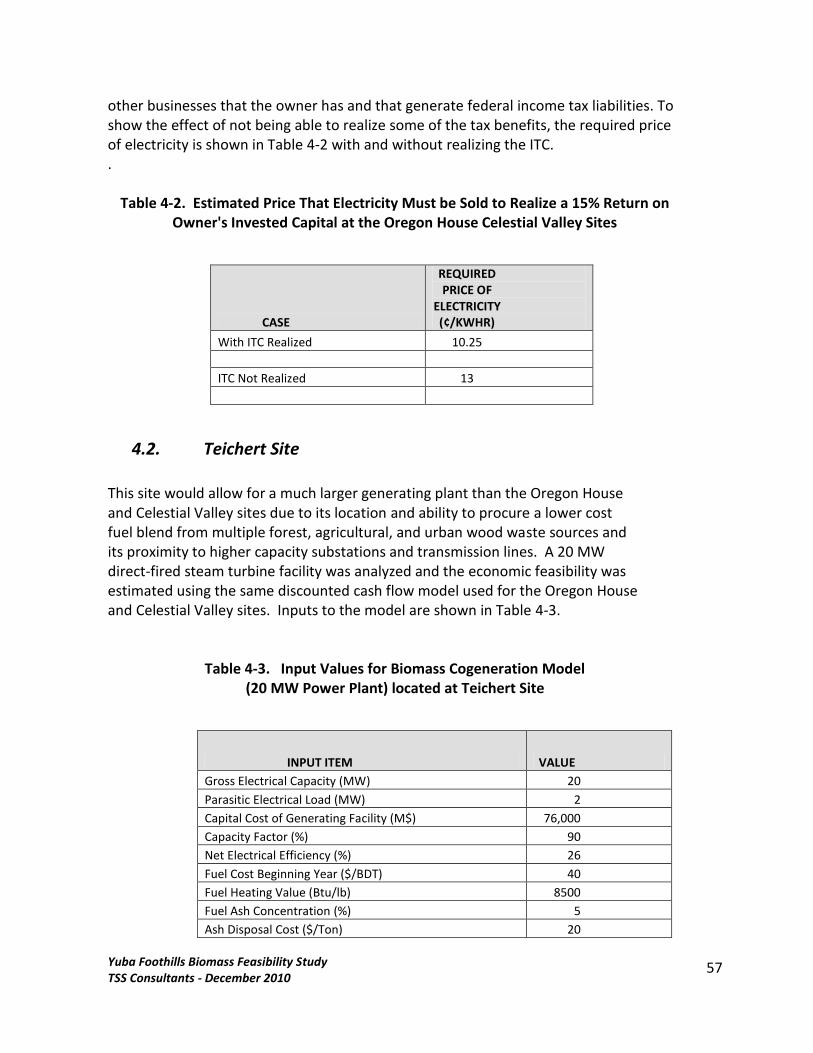
Yuba Foothills Biomass Feasibility Study TSS Consultants - December 2010
57
other businesses that the owner has and that generate federal income tax liabilities. To show the effect of not being able to realize some of the tax benefits, the required price of electricity is shown in Table 4-2 with and without realizing the ITC. .
Table 4-2. Estimated Price That Electricity Must be Sold to Realize a 15% Return on Owner's Invested Capital at the Oregon House Celestial Valley Sites
CASE
REQUIRED PRICE OF
ELECTRICITY (¢/KWHR)
With ITC Realized 10.25
ITC Not Realized 13
4.2. Teichert Site
This site would allow for a much larger generating plant than the Oregon House and Celestial Valley sites due to its location and ability to procure a lower cost fuel blend from multiple forest, agricultural, and urban wood waste sources and its proximity to higher capacity substations and transmission lines. A 20 MW direct-fired steam turbine facility was analyzed and the economic feasibility was estimated using the same discounted cash flow model used for the Oregon House and Celestial Valley sites. Inputs to the model are shown in Table 4-3.
Table 4-3. Input Values for Biomass Cogeneration Model (20 MW Power Plant) located at Teichert Site
INPUT ITEM VALUE
Gross Electrical Capacity (MW) 20
Parasitic Electrical Load (MW) 2
Capital Cost of Generating Facility (M$) 76,000
Capacity Factor (%) 90
Net Electrical Efficiency (%) 26
Fuel Cost Beginning Year ($/BDT) 40
Fuel Heating Value (Btu/lb) 8500
Fuel Ash Concentration (%) 5
Ash Disposal Cost ($/Ton) 20
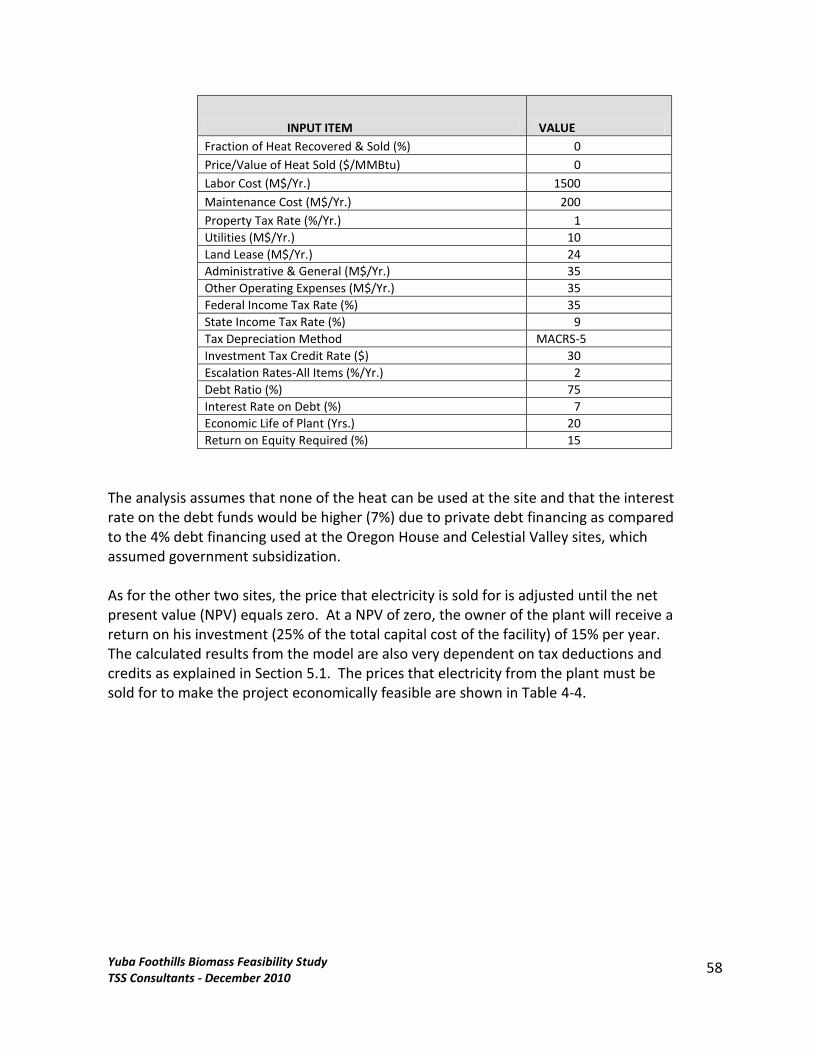
Yuba Foothills Biomass Feasibility Study TSS Consultants - December 2010
58
INPUT ITEM VALUE
Fraction of Heat Recovered & Sold (%) 0
Price/Value of Heat Sold ($/MMBtu) 0
Labor Cost (M$/Yr.) 1500
Maintenance Cost (M$/Yr.) 200
Property Tax Rate (%/Yr.) 1
Utilities (M$/Yr.) 10
Land Lease (M$/Yr.) 24
Administrative & General (M$/Yr.) 35
Other Operating Expenses (M$/Yr.) 35
Federal Income Tax Rate (%) 35
State Income Tax Rate (%) 9
Tax Depreciation Method MACRS-5
Investment Tax Credit Rate ($) 30
Escalation Rates-All Items (%/Yr.) 2
Debt Ratio (%) 75
Interest Rate on Debt (%) 7
Economic Life of Plant (Yrs.) 20
Return on Equity Required (%) 15
The analysis assumes that none of the heat can be used at the site and that the interest rate on the debt funds would be higher (7%) due to private debt financing as compared to the 4% debt financing used at the Oregon House and Celestial Valley sites, which assumed government subsidization. As for the other two sites, the price that electricity is sold for is adjusted until the net present value (NPV) equals zero. At a NPV of zero, the owner of the plant will receive a return on his investment (25% of the total capital cost of the facility) of 15% per year. The calculated results from the model are also very dependent on tax deductions and credits as explained in Section 5.1. The prices that electricity from the plant must be sold for to make the project economically feasible are shown in Table 4-4.
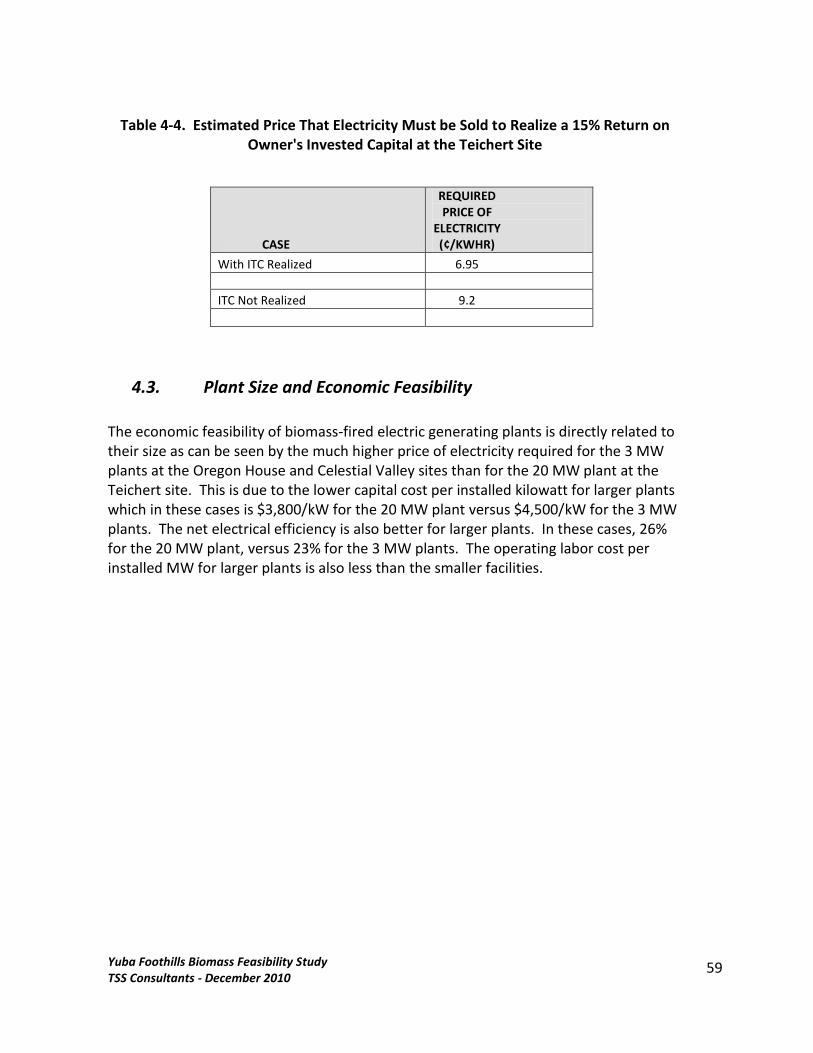
Yuba Foothills Biomass Feasibility Study TSS Consultants - December 2010
59
Table 4-4. Estimated Price That Electricity Must be Sold to Realize a 15% Return on
Owner's Invested Capital at the Teichert Site
CASE
REQUIRED PRICE OF
ELECTRICITY (¢/KWHR)
With ITC Realized 6.95
ITC Not Realized 9.2
4.3. Plant Size and Economic Feasibility
The economic feasibility of biomass-fired electric generating plants is directly related to their size as can be seen by the much higher price of electricity required for the 3 MW plants at the Oregon House and Celestial Valley sites than for the 20 MW plant at the Teichert site. This is due to the lower capital cost per installed kilowatt for larger plants which in these cases is $3,800/kW for the 20 MW plant versus $4,500/kW for the 3 MW plants. The net electrical efficiency is also better for larger plants. In these cases, 26% for the 20 MW plant, versus 23% for the 3 MW plants. The operating labor cost per installed MW for larger plants is also less than the smaller facilities.
Yuba Foothills Biomass Feasibility Study TSS Consultants - December 2010
60
5. Project Development Planning In developing a biomass power plant project, and ultimately operating it profitably, there are several steps that must be undertaken and successfully completed. Section 6.1 below outlines these steps.
5.1. Biomass Power Plant
Conduct Preliminary Feasibility Study
Because of the multiple risks involved in developing a new biomass power generation facility, it is critical that biomass power plant developers not commit what could be millions of dollars to develop a new proposed commercial facility without doing a Preliminary Feasibility Study (PFS). A PFS can identify and evaluate significant items, such as fuel supply, siting, and financial/economic considerations to ascertain if a project is viable at a particular scale or a particular site. Rather than conduct a Comprehensive Feasibility Study (CFS – also known a Due Diligence Level Feasibility Study) which is expensive and time consuming, for developing and implementing the information needed for completing development, along with financing of the proposed commercial biomass facility, it is more cost effective to do a PFS. A PFS can assist in determining if there are upfront, deal “killing issues’ or “fatal flaws”.
Confirm Community Support
Community support for the development of a biomass power plant is critical to its success. The community acceptance of a biomass utilization facility is of paramount importance. Community leaders, elected officials, local interest groups, and local/regional agency representative and regulators need to be informed about the biomass project at the beginning of the development process in order to develop community wide support for the project and acknowledgement of its potential societal and environmental benefits. To inform the various stakeholders a Communications Plan for the project should be developed. Such a plan will:
Provide a comprehensive framework of actions and information on biomass utilization for energy that will allow agency representatives, elected officials, the local communities, and others to become informed about and ultimately support the biomass project.
Provide best available information to federal, state, and county administrators, land managers and regulators of the project’s design and engineering process and progress, so that their participation and support (hopefully) can be assured.
Yuba Foothills Biomass Feasibility Study TSS Consultants - December 2010
61
Assess Fuel Resource Availability
The development, and ultimately the operation, of a biomass power plant is absolutely dependent on the cost of collection, processing, and transport of biomass feedstock to a user facility. Ultimately, to attract the equity and debt capital needed to develop, construct, and operate a new biopower facility, a very detailed biomass fuel availability study is needed. Such a study includes a detailed analysis of economically and environmentally available biomass inventory from all viable sources within an economically transportable distance (typically 25 to 75 mile radius), projected for several years after the facility is projected to be operational. This requires obtaining biomass data on such things as urban wood wastes currently generated and disposed of as part of the waste stream going to landfills; any forest products manufacturing facilities (such as sawmills) generating wood wastes; residues from wood products industries that use wood as a raw material to produce products (furniture manufacturers, etc.); residue from timber harvesting operations; wildfire fuel reduction projects; and, agricultural operations generating usable biomass residues (orchard prunings, nut shells, etc. Included in the fuel study should be an existing and projected competition analysis for the biomass. Is any biomass material being used by other types of user facilities, such as biomass power plants, biofuels production facilities, sawmills capable of utilizing small logs, or other wood products that would decrease the available biomass inventory for the proposed commercial biomass power plant? Similarly, gather intelligence from local public and private sources, as well as the biomass industry networks to determine if there are any proposed biomass facilities in the area that would create new demand for the available biomass inventory. Identify the existing owners or contractual owners of the biomass materials that could be used in the facility. Again, consider the longer term of facility operation. As referenced in the risk section above, since development of a biomass power plant facility usually will take from 2 ½ years – 3 years. Cost information for collecting, processing and delivering available biomass should be developed for each biomass source. These can be crosschecked with any existing vendors delivering biomass in the area, or in other regions that have similar biomass and biomass user facilities. Because there are wide variations in the characteristics of biomass raw material, there are similar variations in the equipment and related costs for collecting, processing, and transporting the biomass. It is important that these systems be identified, along with their production levels, and translated into hard biomass delivery costs that will be acceptable to financial due diligence experts who specialize in these systems. If there are biomass vendors in the areas, prepare a listing and contact them as potential contractors for delivering biomass to the proposed facility. There are three important functions of the biomass fuel study:
Yuba Foothills Biomass Feasibility Study TSS Consultants - December 2010
62
Assure there is an ample supply of biomass available to the proposed facility on a long-term basis. As stated earlier, a minimum rule of thumb for available biomass inventories to a proposed facility, is to have available 2 ½ to 3 times more biomass inventory than is needed. This available biomass inventory is the net amount after taking into account the competition from existing and potential future biomass facilities.
Identify the specific sources and vendors who own or control the biomass raw material on a long-term basis. These are potential contractors for obtaining assured supplies of biomass.
Determine the available infrastructure for collecting, processing, and transporting biomass to the proposed facility. Identify the related costs for delivering each of the multiple sources of biomass to the facility.
The biomass fuel study can be conducted in phases going from a preliminary biomass fuel analysis, through to a comprehensive due diligence level fuel assessment. Such analyses and assessment will provide the foundation for developing the necessary detailed biomass procurement plan in the CFS phase.
Consider Siting and Infrastructure Issues, Including Environmental Permit Review
Candidate sites should be considered at the very beginning of the project development process as several items key off the candidate sites, such as biomass fuel supply area, environmental impacts, permitting, and land entitlement, and transmission line capability. It is the experience of TSS that in most rural areas, there are only a few sites available for a new industrial facility. Shut down or existing industrial facilities are good alternatives to compiling a list. Checking with the planning and permitting agencies for zoning and land use criteria is a valuable source of information regarding alternative sites. The approach to consider for siting a facility includes the following steps:
Determine that the site is or can be zoned for commercial electrical generation facilities.
Conduct a preliminary environmental assessment to determine the likely environmental impacts particularly air emissions, water demand, and discharges, land use impacts on the community, other businesses, transportation systems, citizen support/opposition, etc.
Using this preliminary environmental analysis, confer with the regulatory agencies, public officials, and even potential opponents to the project, to determine likelihood of community acceptance and that permits can be obtained. This is a high risk analysis at this preliminary stage because much of the detailed environmental impact information, along with potential mitigation alternatives cannot be developed until the CFS phase, where vendors are identified along with the process guarantees, detailed engineering
Yuba Foothills Biomass Feasibility Study TSS Consultants - December 2010
63
drawings are completed along with the equipment lists and final decisions are made on the facility configuration, footprint and size that will be covered in the Engineering, Procurement and Construction (EPC) contracts. However, enough detail is needed to assure there is not an obvious “deal killing” environmental, permitting or community acceptance issue.
Complete Due Diligence Feasibility Study
Once a PFS is completed, the results can provide a go/no go decision point for the development team and at what site would development be optimal. A good test of the judgment of the development team in deciding whether or not to proceed with the proposed project is the response from equity investors, joint venture partners, and potential debt lenders. If the decision is made to proceed with project development, it is critical that the development capital be obtained that will cover the costs through the financing stage. For even a small-scale facility, completing the initial CFS and the rest of the development can be very expensive often requiring $1 million (or more). Prepare a Comprehensive Feasibility Study (CFS) - A primary product of the CFS is a business plan that expands on the information developed in the PFS. The CFS should include:
The project development schedule;
Alternative financial proformas showing best to worst case development and operational scenarios;
Preliminary environmental drawings, environmental assessment, mitigation requirements and permitting plan;
Project development and operating team;
Raw material procurement plan including procurement contracts or legally binding letters of intent, marketing assessment and commitments to purchase product;
Risk assessments of developing the project;
Financing plan including risk development capital, any construction bridge loans and operating capital, equity investors and debt lenders if determined, and;
Staffing plan for operating the facility, and other information that will be requested by potential equity investors, debt lenders, and potential joint venture partners in the project.
During this CFS development stage a number of other activities should be started and completed before the project can be financed:

Yuba Foothills Biomass Feasibility Study TSS Consultants - December 2010
64
Apply for and obtain permits to construct and operate the proposed biomass power plant facility. This could be a relatively simple process costing as little as $100,000 plus permitting fees, or a very sophisticated and expensive effort requiring extensive consulting studies, public hearings, infrastructure use fees, and extensive mitigation requirements. The more expensive process can run into the millions of dollars.
Prepare preliminary engineering drawings, including plot plans, equipment lists, specifications and costs, environmental emissions or discharges and control technology required to meet permitting and mitigation requirements. This information along with other data gathered will be used to develop the EPC contract(s) and request for proposals. Obtain proposals and award contract(s) subject to financing.
Finalize the biomass procurement plan. This requires obtaining legally binding letters of intent or more preferably consummating the final procurement contracts with biomass suppliers, with all the details of volumes, specifications of the biomass that meets the proposed facility’s raw material needs, penalties for non-delivery, delivery prices, and conducting due diligence on the biomass suppliers to assure they are likely to be delivering biomass feedstocks during the term period of the contracts. It helps to target credit worthy fuel suppliers, as the investment banks will prefer that key fuel suppliers be financially viable.
Other tasks and information required to be developed by the equity investors, debt lenders, or joint venture partners.
Power Purchase/Thermal Delivery Agreement
This phase of the project development process consists of obtaining the principal mechanism for selling the electrical power generated from a commercial biomass power plant. A Power Purchase Agreement (PPA) is a legal contract between an electricity generator (provider) and a power purchaser (buyer), generally an Investor Owned Utility (IOU) or a Municipal (or Public) Utility District. Contractual terms may last anywhere between 10 and 20 years, and during this time the power purchaser buys energy, and sometimes also capacity and/or ancillary services, from the electricity generator. Such agreements play a key role in the financing of independently owned (i.e. not owned by a utility) electricity generating assets. The basis for a PPA is agreed upon electricity purchase prices. Prices may be flat, escalate over time, or be negotiated in any other way as long as both parties agree to the negotiation. A PPA will often specify how much energy the supplier is expected to produce each year and any excess energy produced will have a negative impact on the sales rate of electricity that the buyer will be purchasing. This system is intended to
Yuba Foothills Biomass Feasibility Study TSS Consultants - December 2010
65
provide an incentive for the seller to properly estimate the amount of energy that will be produced in a given period of time.
Enlist Equity Partners And Secure Financing
Using the business plan developed during the CFS, identify potential equity and debt lenders. Debt lenders for the proposed project, joint partners and equity investors will individually assemble a risk assessment “due diligence” team of multi-discipline experts to review the business plan. The developer may be required to reimburse the debt lender for their costs in conducting the due diligence.
Following is a listing of categories of expenditures that are included in financial proformas:
Capital Investment: Typically included in this category are all the one time costs required to develop, finance, construct, and startup the proposed biomass power plant facility, including initial working capital, financing, legal and development fees, reserves and any capital required for one time environmental, community and infrastructure requirements beyond the commercial plant facilities. At the point of financing, all of this one time capital investment usually comes from the equity investors and the lenders. Development costs and fees are often recovered from the final project financing. Depending on the project financial viability and its margins for return on investment, inclusion of all the development costs are negotiable between the developers, other equity investors and debt lenders. Project financing can range from 50 –100% debt, but in the current market are usually in the 70 –90% debt range.
Operating Expenses: These are the annual operating expenses, including biomass fuel procurement, labor, debt repayment with interest, depreciation, insurance, utility, maintenance, supplies, annual permitting, government, waste discharge or infrastructure fees, taxes and other annually occurring expenses. Operating expenses are usually divided into fixed (costs that are incurred whether or not the facility is operating such as insurance, taxes, debt payments) and variable (costs that are incurred when the facility is operating such as biomass fuel and process chemicals). These costs are projected based on the data generated by the PFS and CFS tasks described above.
As the project is developed, more detailed cost information and harder assumptions are required to eventually satisfy the financing entities and developer. Thus, the financial proformas are continually being updated with more and better information as a result of the development team efforts.
Yuba Foothills Biomass Feasibility Study TSS Consultants - December 2010
66
Select EPC Firm
The equipment procurement, final engineering designs, and construction contracts are usually prepared prior to financing. The contracts may be let prior to financing, subject to financing occurring to save some time after financing and to expedite project construction. An alternative, due to the uncertainty in financing, is to release the Request for Proposals before financing, and negotiate the EPC contracts, but not sign the contracts contingent upon financing. Significant issues in securing biomass power plant EPC contracts are:
The costs of each contract falls within the financial proforma parameters for maintaining a financially viable facility. The final contract costs cannot be so excessive that they are a financial “deal killer” making the project financially unviable.
Particularly important to equity investors and debt lenders are vendor equipment and operations guarantees. This is a major factor in spreading the financial risk. The process engineering has to work as reflected in the technology specifications; the equipment has to perform to the vendor’s specifications as installed in this facility, and when the facility is constructed, the facility has to operate to the standards reflected in the construction contract. Particularly in the case of emerging technologies, intensive negotiations will occur among the developer, equity investors, debt lender and the process engineering company, equipment vendors and construction company as to how much of each company’s assets will back the guarantee to perform in each respective contract. Even at this late stage, this can cause project development failure. It is recommended to bring vendors into the project development process as early as possible before these final stages of negotiations.
Design/Engineer/Construct
With project financing in place the final design and engineering can be completed by the EPC contractor and the biomass power plant facility can be constructed. The project developer must work very closely with the EPC contractor to avoid, or minimize, any potential or actual cost overruns.
Generate Renewable Biomass-Sourced Power
Project development challenges can continue even after facility startup. Significant issues can surface during the startup and operating phases. Problems in the process engineering, mechanical engineering, civil and electrical engineering designs, equipment flaws, and actual construction errors will eventually surface during the startup and operational phases. Six months is not an uncommon start up period before the facility is operating at full commercial production. During the start up period, the lower levels of production should be taken into account in the comprehensive due diligence financial proformas with reduced revenue, additional working capital needs, lower raw material

Yuba Foothills Biomass Feasibility Study TSS Consultants - December 2010
67
usage and the delivery schedules in the biomass procurement contracts. A new business has to survive through at least one business cycle, usually five to seven years of successful and profitable operation to be considered viable.
Yuba Foothills Biomass Feasibility Study TSS Consultants - December 2010
68
6. Results and Recommendations Based on the information and data collected and analyzed for this preliminary feasibility study, TSS offers the following results and recommendations.
6.1. Results
The results of this preliminary feasibility study are as follows:
TSS assessed the availability of biomass fuel/feedstock within the Fuel Study Area (FSA) and found that 396,2000 BDT of biomass are potentially available on an annual basis.
Using a fuel coverage ratio of 2.5:1, the approximately 160,000 BDT available could sustainably support up to a 20 MW power plant.
TSS determined that a blended fuel could be sourced from within the FSA at a fuel price ranging from $36.34 to $42.59 BDT. Using only forest-sourced biomass would range in price from $45 to $55 per BDT
A small-scale facility sited at either Oregon House and Celestial Valley would not be currently economically viable. The calculated price of electricity needed to support a commercial project using primarily forest-sourced biomass is 13.5 cents per kilowatt-hour. Current top-end prices being paid by utilities does not exceed 10.5 to 11 cents per kilowatt-hour.
A larger scale facility sited at the Teichert Marysville site could be economically viable at a calculated price per kilowatt-hour of 9.2 cents.
As a larger scale facility appears to be economically viable and if development moves forward and is expedited, it may qualify for U.S. Treasury Department 1603 Grant, thus further improving economic viability.
6.2. Recommendations
It is recommended that the Teichert site seek out federal or state support for next steps in the development process. Potential funding source includes:
Woody Biomass Utilization Grant – The U.S. Forest Service, through its Forest Products Laboratory, has released its annual Woody Biomass Utilization Grant (WOODYBUG) program solicitation. This year’s grant program is aimed at helping applicants complete the necessary design and engineering work needed to secure public and/or private investment for construction of biopower facilities. Given that the Teichert 20 MW site appears economically viable for a biopower facility, it is recommended that Teichert apply for grant funds.
Yuba Foothills Biomass Feasibility Study TSS Consultants - December 2010
69
Other recommendations to consider:
Power Off-Take Agreement - Contact utilities to secure indicative power pricing – Currently California utilities are offering up to 10 to 12 cents per kilowatt-hour for renewable energy. Biopower has the added feature of being baseload, dispatchable, 24/7 electric power, unlike solar or wind. Utilities, both investor owned and municipal are seeking such renewable power.
Equity partner(s) - Seek an experienced project developer as an equity partner. There are numerous renewable and biomass energy developers currently looking for appropriate sites for industrial scale biopower facilities (15 MW-plus).
Permitting plan – Permitting of a biopower facility is many times one of the principal critical paths in project development, construction, and operation. Permits will be needed for air and water emissions and such permits will take many months to acquire. As confirmed by the Yuba County Planning Department, any of the biomass power plant sites in Yuba County will require a Conditional Use Permit (CUP). Such a permit will trigger the California Environmental Quality Act, and possibly an Environmental Impact Report will be required. The CEQA process, with an EIR, could take 12 months to complete. Given these timelines, and their critical nature to the development of a biopower facility, a comprehensive permitting plan should be developed very early in the process.
Communications plan – In order to ensure community acceptance, and even embrace, of a biopower facility in Yuba County, communications plan should be drafted in order to facilitate outreach and education efforts for the local community. The communications plan should be prepared to reflect information generated from this preliminary feasibility study. The target audience should include potential project stakeholders, applicable regulatory and land management agencies, elected officials, and key legislative staff.
APPENDIX A Western Wood Products Association Press Release
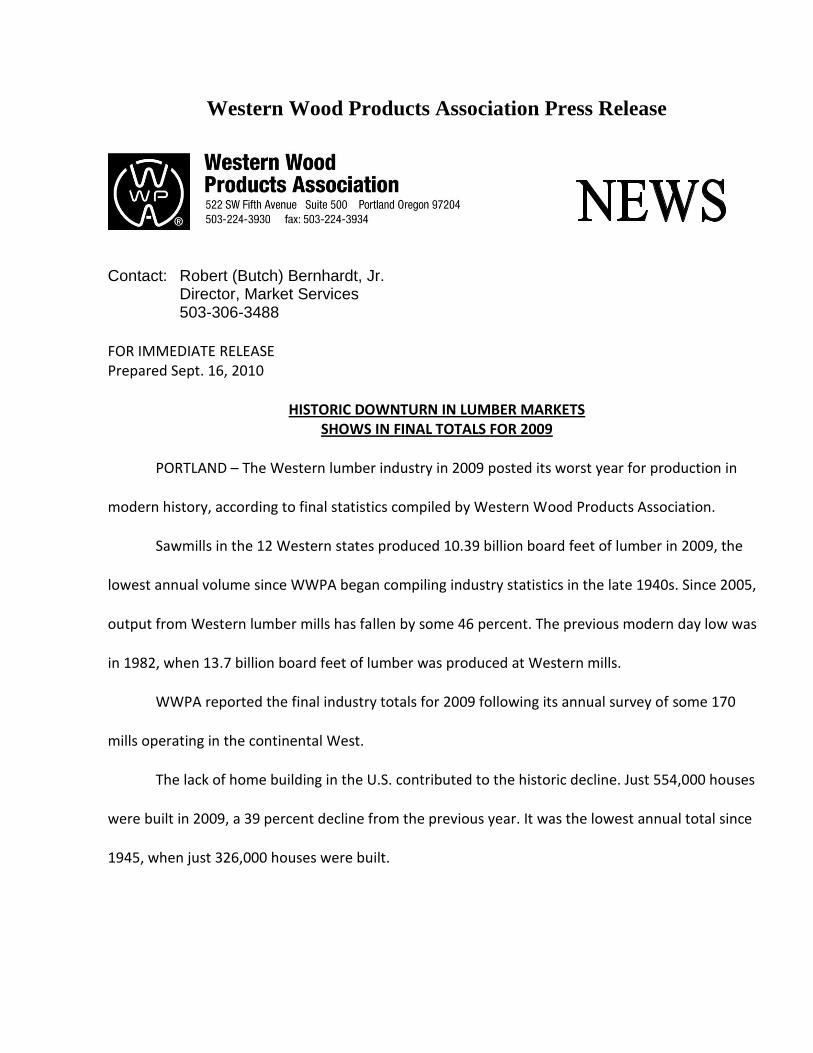
Western Wood Products Association Press Release
Contact: Robert (Butch) Bernhardt, Jr. Director, Market Services 503-306-3488
FOR IMMEDIATE RELEASE Prepared Sept. 16, 2010
HISTORIC DOWNTURN IN LUMBER MARKETS SHOWS IN FINAL TOTALS FOR 2009
PORTLAND – The Western lumber industry in 2009 posted its worst year for production in
modern history, according to final statistics compiled by Western Wood Products Association.
Sawmills in the 12 Western states produced 10.39 billion board feet of lumber in 2009, the
lowest annual volume since WWPA began compiling industry statistics in the late 1940s. Since 2005,
output from Western lumber mills has fallen by some 46 percent. The previous modern day low was
in 1982, when 13.7 billion board feet of lumber was produced at Western mills.
WWPA reported the final industry totals for 2009 following its annual survey of some 170
mills operating in the continental West.
The lack of home building in the U.S. contributed to the historic decline. Just 554,000 houses
were built in 2009, a 39 percent decline from the previous year. It was the lowest annual total since
1945, when just 326,000 houses were built.
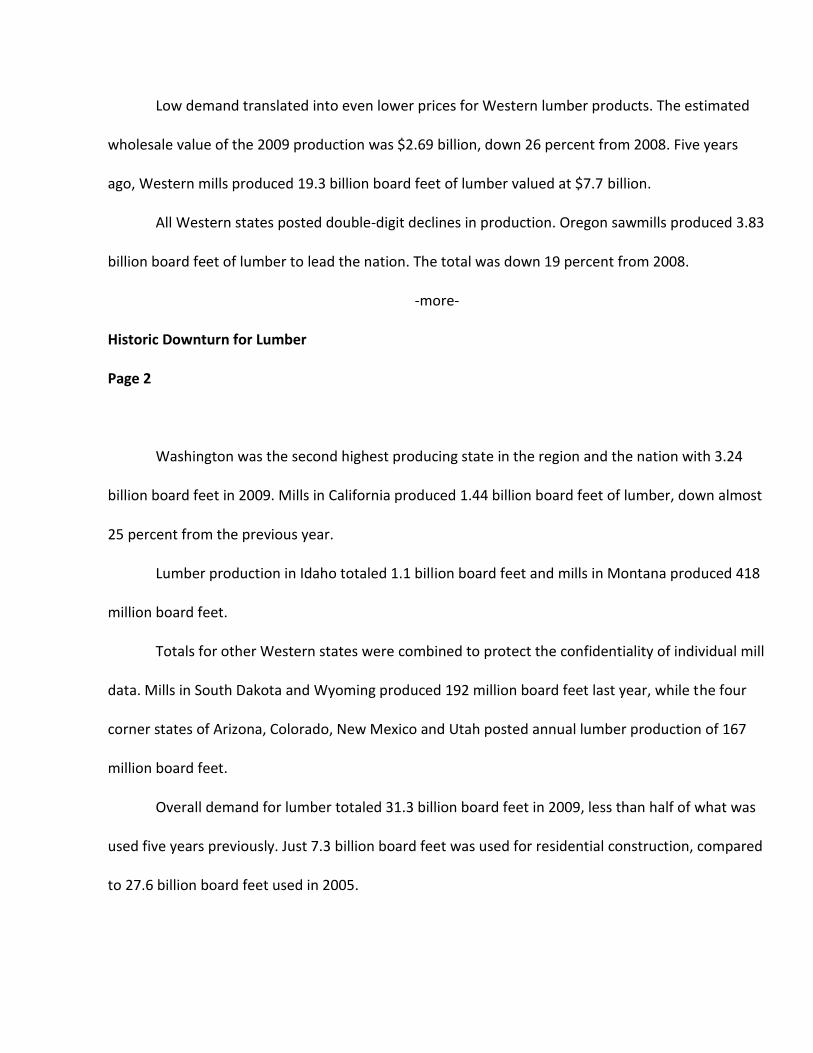
Low demand translated into even lower prices for Western lumber products. The estimated
wholesale value of the 2009 production was $2.69 billion, down 26 percent from 2008. Five years
ago, Western mills produced 19.3 billion board feet of lumber valued at $7.7 billion.
All Western states posted double-digit declines in production. Oregon sawmills produced 3.83
billion board feet of lumber to lead the nation. The total was down 19 percent from 2008.
-more-
Historic Downturn for Lumber
Page 2
Washington was the second highest producing state in the region and the nation with 3.24
billion board feet in 2009. Mills in California produced 1.44 billion board feet of lumber, down almost
25 percent from the previous year.
Lumber production in Idaho totaled 1.1 billion board feet and mills in Montana produced 418
million board feet.
Totals for other Western states were combined to protect the confidentiality of individual mill
data. Mills in South Dakota and Wyoming produced 192 million board feet last year, while the four
corner states of Arizona, Colorado, New Mexico and Utah posted annual lumber production of 167
million board feet.
Overall demand for lumber totaled 31.3 billion board feet in 2009, less than half of what was
used five years previously. Just 7.3 billion board feet was used for residential construction, compared
to 27.6 billion board feet used in 2005.
Lumber production in the southern U.S. followed the same downward trend, declining 19.5
percent to 11.79 billion board feet. Imports, mostly from Canada, lost more market share in 2009 and
totaled 8.9 billion board feet, down 30 percent from the previous year.
Western Wood Products Association represents lumber manufacturers in the 12 Western
states. Based in Portland, WWPA compiles lumber industry statistics and delivers quality standards,
technical and product support services to the industry.
# # #
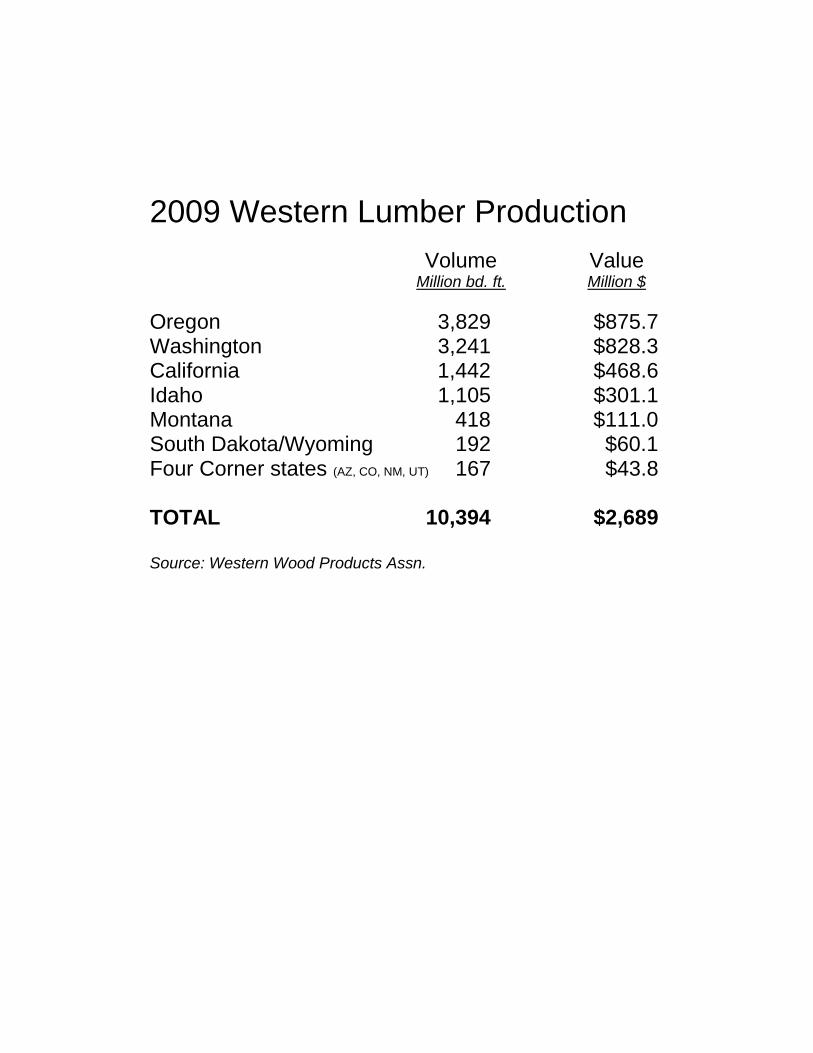
2009 Western Lumber Production
Volume Value Million bd. ft. Million $
Oregon 3,829 $875.7 Washington 3,241 $828.3 California 1,442 $468.6 Idaho 1,105 $301.1 Montana 418 $111.0 South Dakota/Wyoming 192 $60.1 Four Corner states (AZ, CO, NM, UT) 167 $43.8 TOTAL 10,394 $2,689 Source: Western Wood Products Assn.

APPENDIX B Cash Flow Models