Yu Liu Jingtao Ding Tsinghua University
11
Knowledge-driven Site Selection via Urban Knowledge Graph Yu Liu Tsinghua University [email protected] Jingtao Ding Tsinghua University [email protected] Yong Li Tsinghua University [email protected] ABSTRACT Site selection determines optimal locations for new stores, which is of crucial importance to business success. Especially, the wide appli- cation of artificial intelligence with multi-source urban data makes intelligent site selection promising. However, existing data-driven methods heavily rely on feature engineering, facing the issues of business generalization and complex relationship modeling. To get rid of the dilemma, in this work, we borrow ideas from knowl- edge graph (KG), and propose a knowledge-driven model for site selection, short for KnowSite. Specifically, motivated by distilled knowledge and rich semantics in KG, we firstly construct an urban KG (UrbanKG) with cities’ key elements and semantic relationships captured. Based on UrbanKG, we employ pre-training techniques for semantic representations, which are fed into an encoder-decoder structure for site decisions. With multi-relational message passing and relation path-based attention mechanism developed, KnowSite successfully reveals the relationship between various businesses and site selection criteria. Extensive experiments on two datasets demonstrate that KnowSite outperforms representative baselines with both effectiveness and explainability achieved. 1 INTRODUCTION The task of site selection, which selects optimal locations for open- ing new stores, is of crucial importance to business success. A good choice of location always brings substantial profits while an inappropriate one could lead to store closure, such as opening a Star- bucks store in a business area versus a residential one. Generally, site selection for a specific brand requires a comprehensive consid- eration of both its own characteristics and those of potential urban regions, e.g., the brand’s category and the region’s human flow and function. Traditional solution for most corporations is to em- ploy expert consultants and conduct manual surveys [4, 18, 24, 30], which are expensive, labor-intensive and time-consuming. Owing to the rapid development of location-based services [16] and the wide availability of multi-source urban data [51], recent studies introduce the data-driven paradigm for site selection [17, 19, 22, 39, 40]. As shown in Figure 1(a), these data-driven approaches typically extract various features from the multi-source urban data, which are then fed into a machine learning model like XGBoost [7] to calculate the score for site decision. However, the manually defined feature involves only one or two aspects (store density, human flow, etc.), failing to exploit complex relationships as well as diverse influences among multi-source urban data for site selection. Moreover, such approaches merely provide an importance score for each feature without logical reasoning, which is insufficient to persuade corporations [30, 44]. In comparison to the site selection still in data-driven paradigm, several other areas of artificial intelligence have further introduced Figure 1: Illustration of (a) data-driven paradigm and our proposed (b) knowledge-driven paradigm for site selection. knowledge-driven paradigm for superior performance, such as ques- tion answering [14], natural language understanding [50] and rec- ommender systems [11, 35]. The core of such knowledge-driven paradigm is knowledge graph (KG) [12]. With domain entities as nodes and semantic relations as edges, KG could integrate multi- source data into a graph structure, and then powerful knowledge representation learning (KRL) methods are developed to avoid com- plex feature engineering [15]. Hence, knowledge-driven paradigm stands out as a promising solution for site selection, but it is still underexplored due to following three critical challenges: • The difficulty of knowledge discovery from multi-source urban data. Recently, the target knowledge for site selection lies in complex relationships among multi-source urban data, e.g., attribute, affiliation, spatiality, mobility and etc., which increases the difficulty to discover structured knowledge. • The complexity of knowledge refinement for diverse in- fluences. The influences of various knowledge are diverse for site selection, e.g., for KFC opening stores, the site decision of McDonald’s is much more helpful than store density at regions. Thus, refining task-specific knowledge is non-trivial considering the rich while diverse urban contexts. • The necessity of knowledge explainability to site decision understanding. Although feature importance is provided in data-driven paradigm [17, 39], the reasons for site decisions re- mains unknown, e.g., finding new sites that have significant flow transition with existing sites. So a challenge is how to clearly ex- plain the logic behind corresponding site decisions for convincing and practical applications. To overcome the above challenges as well as explore the po- tential of KG, in this paper, we propose a generalized knowledge- driven paradigm for site selection. As shown in Figure 1(b), we arXiv:2111.00787v1 [cs.AI] 1 Nov 2021
Transcript of Yu Liu Jingtao Ding Tsinghua University

Knowledge-driven Site Selection via Urban Knowledge GraphYu Liu
Tsinghua [email protected]
Jingtao DingTsinghua University
Yong LiTsinghua University
ABSTRACTSite selection determines optimal locations for new stores, which isof crucial importance to business success. Especially, the wide appli-cation of artificial intelligence with multi-source urban data makesintelligent site selection promising. However, existing data-drivenmethods heavily rely on feature engineering, facing the issues ofbusiness generalization and complex relationship modeling. To getrid of the dilemma, in this work, we borrow ideas from knowl-edge graph (KG), and propose a knowledge-driven model for siteselection, short for KnowSite. Specifically, motivated by distilledknowledge and rich semantics in KG, we firstly construct an urbanKG (UrbanKG) with cities’ key elements and semantic relationshipscaptured. Based on UrbanKG, we employ pre-training techniquesfor semantic representations, which are fed into an encoder-decoderstructure for site decisions. With multi-relational message passingand relation path-based attention mechanism developed, KnowSitesuccessfully reveals the relationship between various businessesand site selection criteria. Extensive experiments on two datasetsdemonstrate that KnowSite outperforms representative baselineswith both effectiveness and explainability achieved.
1 INTRODUCTIONThe task of site selection, which selects optimal locations for open-ing new stores, is of crucial importance to business success. Agood choice of location always brings substantial profits while aninappropriate one could lead to store closure, such as opening a Star-bucks store in a business area versus a residential one. Generally,site selection for a specific brand requires a comprehensive consid-eration of both its own characteristics and those of potential urbanregions, e.g., the brand’s category and the region’s human flowand function. Traditional solution for most corporations is to em-ploy expert consultants and conduct manual surveys [4, 18, 24, 30],which are expensive, labor-intensive and time-consuming.
Owing to the rapid development of location-based services [16]and the wide availability of multi-source urban data [51], recentstudies introduce the data-driven paradigm for site selection [17, 19,22, 39, 40]. As shown in Figure 1(a), these data-driven approachestypically extract various features from the multi-source urban data,which are then fed into a machine learning model like XGBoost[7] to calculate the score for site decision. However, the manuallydefined feature involves only one or two aspects (store density,human flow, etc.), failing to exploit complex relationships as well asdiverse influences among multi-source urban data for site selection.Moreover, such approaches merely provide an importance scorefor each feature without logical reasoning, which is insufficient topersuade corporations [30, 44].
In comparison to the site selection still in data-driven paradigm,several other areas of artificial intelligence have further introduced
Figure 1: Illustration of (a) data-driven paradigm and ourproposed (b) knowledge-driven paradigm for site selection.
knowledge-driven paradigm for superior performance, such as ques-tion answering [14], natural language understanding [50] and rec-ommender systems [11, 35]. The core of such knowledge-drivenparadigm is knowledge graph (KG) [12]. With domain entities asnodes and semantic relations as edges, KG could integrate multi-source data into a graph structure, and then powerful knowledgerepresentation learning (KRL) methods are developed to avoid com-plex feature engineering [15]. Hence, knowledge-driven paradigmstands out as a promising solution for site selection, but it is stillunderexplored due to following three critical challenges:• The difficulty of knowledge discovery from multi-sourceurban data. Recently, the target knowledge for site selection liesin complex relationships among multi-source urban data, e.g.,attribute, affiliation, spatiality, mobility and etc., which increasesthe difficulty to discover structured knowledge.
• The complexity of knowledge refinement for diverse in-fluences. The influences of various knowledge are diverse forsite selection, e.g., for KFC opening stores, the site decision ofMcDonald’s is much more helpful than store density at regions.Thus, refining task-specific knowledge is non-trivial consideringthe rich while diverse urban contexts.
• The necessity of knowledge explainability to site decisionunderstanding. Although feature importance is provided indata-driven paradigm [17, 39], the reasons for site decisions re-mains unknown, e.g., finding new sites that have significant flowtransition with existing sites. So a challenge is how to clearly ex-plain the logic behind corresponding site decisions for convincingand practical applications.To overcome the above challenges as well as explore the po-
tential of KG, in this paper, we propose a generalized knowledge-driven paradigm for site selection. As shown in Figure 1(b), we
arX
iv:2
111.
0078
7v1
[cs
.AI]
1 N
ov 2
021

Conference’17, July 2017, Washington, DC, USA Yu Liu, Jingtao Ding, and Yong Li
first construct the KG from multi-source urban data (referred to asUrbanKG), based on which a generalized encoder-decoder structureis developed for site selection. Specifically, knowledge discoveryis achieved in UrbanKG, i.e., the key elements of the city such asregions, point of interests (POIs), corporation brands, etc. are iden-tified as entities, while their complex relationships on attribute,affiliation, spatiality, mobility, etc. are modeled as relations. To ob-tain semantic representations for entity and relation initialization,we adopt pre-training techniques on UrbanKG. Furthermore, wedesign a graph neural network (GNN) based encoder on UrbanKG,such that knowledge refinement for diverse influences is adaptivelymodeled via multi-relational message passing. As for the decoderpart, we carefully design a relation path based scoring functionfor knowledge explainability, which measures the plausibility ofsite decisions between corporation brands and regions with thelogical reasoning process revealed. The scoring function firstly in-troduces multiple multi-hop relation paths based on different siteselection criteria, then generates relation path representations viasemantic composition of relations, and finally obtains correspond-ing scores using the attention mechanism. The overall model istermed as KnowSite for Knowledge-driven Site selection. Our keycontributions are summarized as follows:• We are the first to propose the knowledge-driven paradigm forsite selection, and propose a model KnowSite generalized forvarious types of businesses. Especially, KnowSite leverages urbanknowledge via KG, and builds an encoder-decoder structure toexplore the knowledge for effective and explainable site selection.
• We conduct a systematic study of knowledge discovery frommulti-source urban data via KG construction, which identifieskey elements and complex relationships in the city as entitiesand relations, respectively.
• Under the proposed encoder-decoder structure, we design amulti-relational message passing mechanism with GNN based encoderfor knowledge refinement, and develop multi-hop relation pathbased decoder, which achieves knowledge explainability withthe reasons behind site decisions.
• We conduct extensive experiments on two real-world datasetsand the proposed KnowSite outperforms state-of-the-art data-driven approaches by more than 18% on precision, which demon-strates the effectiveness of knowledge-driven paradigm. Furthervisualization results shed light on understanding critical mecha-nism behind different brands’ site decisions.The rest of this paper is organized as follows. Section 2 introduces
the research problem, while Section 3 presents the details of ourproposed knowledge-driven framework. The empirical results arediscussed in Section 4. We review the related works in Section 5,followed by a conclusion in Section 6.
2 PROBLEM FORMULATIONTypically, the multi-source urban data for site selection can becategorized into three aspects [10, 17, 22].Spatial Data. It includes the road network data DRN and businessarea (Ba) dataDBa.DRN is a collection of road segments connectedeach other and DBa collects core areas of business and commercialactivities, e.g., Sanlitun1 in Beijing, China.1https://en.wikipedia.org/wiki/Sanlitun
Store Data. It includes the POI data DPOI, brand data DBrandand site selection data DSite. DPOI and DBrand are the collectionof venues and corporation brands respectively in the city. DSiterecords the brand and corresponding regions it opens a store.User Behavior Data. It includes trajectory data DTraj with usertrajectories, check-in data DCheck with users’ self-reported check-in records and click dataDClick of aggregated clicking POIs recordsusing map services.
Then we formulate the knowledge-driven site selection problem.Problem 1. Knowledge-driven Site SelectionProblem.Given
the multi source urban data, the knowledge-driven site selection prob-lem can be divided into two sub-problems of KG construction andsite selection. The KG construction sub-problem requires to constructKG G = 𝑓 (DRN,DBa,DPOI,DBrand,DSite,DTraj,DCheck,DClick)with construction method 𝑓 . Then the site selection sub-problem isformulated as a link prediction problem on𝐺 , predicting if there existsa site decision link between brand 𝑏 and region 𝑎, i.e., (𝑏, ?, 𝑎).
3 METHODOLOGY3.1 Framework Overview
Figure 2: The framework of our proposed knowledge-drivensite selection method.
To overcome the challenges of applying knowledge-driven par-adigm for site selection, we present the framework of our pro-posed method in Figure 2, including UrbanKG construction andthe KnowSite model for KG construction and site selection sub-problems, respectively. Specifically, to discover knowledge frommulti-source urban data, we firstly construct UrbanKG for struc-tured urban knowledge, which is comprised of two major compo-nents: schema definition and fact extraction. As for the KnowSitemodel, we develop the pre-training on UrbanKG for task-agnosticbut knowledgeable representations. To further refine knowledgefor diverse influences, we propose a GNN based encoder with task-specific representations learned. Finally, to make knowledge ex-plainable for identify reasons behind site decisions, we design arelation path based decoder with effective performance achieved.
3.2 UrbanKG ConstructionTo discover knowledge from multi-source urban data, we constructUrbanKG for structured urban knowledge. Formally, a KG is defined

Knowledge-driven Site Selection via Urban Knowledge Graph Conference’17, July 2017, Washington, DC, USA
Figure 3: The schema of urban knowledge graph. In (b), thedash lines represent inter-ontology relations and the solidlines for intra-ontology ones.
as a graph G = (E,R, F ), where E is the node set of entities andR is the edge set of relations, while F corresponds to the fact set{(𝑠, 𝑟, 𝑜) | 𝑠, 𝑜 ∈ E, 𝑟 ∈ R} [15, 37]. The triplet (𝑠, 𝑟, 𝑜) denotes thedirectional edge from node 𝑠 to node 𝑜 via the edge of relation 𝑟 .
3.2.1 Schema Definition. At first, by investigating the multi-sourceurban data, we build the schema of UrbanKG, as shown in Figure 3.It defines a high-level structure for the KG with ontologies andrelations [12], where the ontologies determine the types of entitiesin UrbanKG, including key elements in cities, i.e., Region, Ba, POI,Brand and Category, mainly identified from DRN,DBa,DPOI andDBrand. Since the category is an important property of POIs andbrands, we further divide the category into coarse-level, mid-level,and fine-grained categories, referred to as Cate_1/2/3.
Moreover, we identify the underlying relations to capture thecomplex relationships among city elements, as presented in Table 1.For intra-ontology relations, we describe them layer by layer, frombottom to up in Figure 3(b). At the first layer of Region, BorderByand NearBy define the spatial relationships of two regions, whileSimilarFunction link regionswith similar POI distributios. By analyz-ing DTraj, we devise FlowTransition to link regions with significantcrowd flow transitions. At POI layer, based on DCheck, CoCheckinreveals the geographical influence among POIs with check-in con-currence [6] and Competitive models the competitive relationshipamong POIs [20]. At Brand layer, RelatedBrand describes related-ness of brands. At Category layer, SubCateOf_ij defines the taxon-omy among three-level categories. As for inter-ontology relations,BaServe, BelongTo and LocateAt define the spatial relationships be-tween different ontologies, especially BaServe describes regionsare in service range of business area. Moreover, POIToCate_i andBrandToCate_i represent the attribute relationships, while BrandOfdescribes the affiliation relationship between POI and brand. Open-StoreAt represents site selection records in DSite. Besides, for asym-metric relations {𝑟 ∈R | (𝑠, 𝑟, 𝑜)⇎ (𝑜, 𝑟, 𝑠),∀(𝑠, 𝑟, 𝑜) ∈ F }, we intro-duce a new inverse relation 𝑟 ′ into UrbanKG schema.
3.2.2 Fact Extraction. Based on the defined schema above, we in-stantiate facts from the data, i.e., mapping ontologies to specific
Table 1: The details of defined relations in UrbanKG.
Relation Abbrev. Subject & ObjectOntologies Symmetry Data Source
BorderBy BB (Region, Region) ! DRNNearBy NB (Region, Region) ! DRN
FlowTransition FT (Region, Region) % DTrajSimilarFunction SF (Region, Region) ! DPOI,DRN
CoCheckin CC (POI, POI) ! DCheck,DPOICompetitive Comp (POI, POI) ! DBrand,DPOIRelatedBrand RB (Brand, Brand) ! DBrandSubCateOf_ij SCOij (Cate_i, Cate_j) % DPOI
BaServe BS (Ba, Region) % DBa,DRNBelongTo BT (POI, Ba) % DBa,DPOILocateAt LA (POI, Region) % DPOI,DRN
POIToCate_i P2Ci (POI, Cate_i) % DPOIBrandToCate_i B2C_i (Brand, Cate_i) % DBrand,DPOI
BrandOf BO (Brand, POI) % DBrand,DPOIOpenStoreAt OSA (Brand, Region) % DSite
entities and linking entities via semantic relations. First, we intro-duce the mapping step. For mapping Region ontology, we partitionthe city into disjointed regions according to the main road networkwith DRN. Compared with grid partition of equal size [40], ourpartition is much closer to people’s movement and urban func-tional units [26]. For Ba and POI ontologies, we obtain the entitiesfrom DBa and DPOI, respectively. For Brand ontology, we adopta text segmentation tool2 and name matching to obtain entities.For Category ontology, the three-level categories are divided bydomain experts, e.g., the Cate_3 entity Beijing Cuisine belongs tothe Cate_2 entity Chinese Food and the Cate_1 entity Food. Then, inthe second step, the entities are further linked via relations definedin Table 1 with corresponding data sources. Here we highlight thelink details for brand-related relations. For RelatedBrand, the factsare obtained from a public KG zhishi.me with the “relatedPage”relation. For BrandOf, POI entities and their corresponding brandentities are linked together, based on which the BrandToCate_ifacts are obtained by brands’ connected POIs. Other relational linksfollow the definitions above, and are obtained by data mapping,aggregation and calculation methods. In this way, the constructedUrbanKG successfully presents the structured knowledge amongmulti-source urban data.
Using the data introduced in Section 4.1.1 later, we constructUrbanKGs for two of the largest cities, which contains over 20k/40kentities and 300k/500k triplet facts in Beijing/Shanghai. Note thatthe original UrbanKGs are significantly large, andwe only report thestatistics of subgraphs utilized in this work. It is worth mentioningthat we utilize pre-training for knowledgeable representations ofentities and relations. Specifically, we leverage the KRL model,TuckER [2] for pre-training, which measures the plausibility oftriplets in UrbanKG with embeddings learned. Note that the pre-training process is task-agnostic and captures the global semanticinformation. To validate the representation capability of UrbanKG,we visualize the pre-trained entity embeddings using t-SNE [23].
2https://github.com/fxsjy/jieba

Conference’17, July 2017, Washington, DC, USA Yu Liu, Jingtao Ding, and Yong Li
60 40 20 0 20 40 60
40
20
0
20
40
60
80 BrandRegionBaCate_3Cate_2Cate_1SportsCompanyMedicalEdu.CarServiceShoppingAccomm.FoodOrg.
Figure 4: t-SNE of pre-trained entity embeddings of beijing’sUrbanKG (better viewed in color).Especially, we randomly sample 1000 POI entities and all of otherentities for visualization, as show in Figure 4. It can be observedthat, entities of the same ontology are clustered in space. Moreover,POIs of different categories are also separated in visualization. Suchresults indicate the effectiveness of our constructed UrbanKG withsemantics captured.
3.3 The KnowSite Model3.3.1 GNN based Encoder. To fully explore the potential of Ur-banKG and model diverse influences of various knowledge, wedesign the GNN based encoder for knowledge refinement.
For a node/entity 𝑣 in KG G = (E,R, F ), 𝑑 denotes the embed-ding dimension, 𝒉𝑘𝑣 ∈ R𝑑 denotes its representation after 𝑘 layersGNN,whileN𝑟
𝑣 denotes its neighbors under relation 𝑟 ∈ R. The rela-tion 𝑟 ’s representation at layer 𝑘 is denoted as 𝒉𝑘𝑟 ∈ R𝑑 . The numberof GNN layers is denoted as𝐾 . Especially, the representation of node𝑣 at layer 𝑘+1, 𝒉𝑘+1𝑣 is obtained via three steps [25, 33, 34, 46, 47]. (1)Message calculation, which defines the function MSG to calculatethe message for triplet (𝑢, 𝑟, 𝑣):𝑚𝑘+1𝑢𝑟𝑣 = MSG(𝒉𝑘𝑢 ,𝒉𝑘𝑟 ,𝒉𝑘𝑣 ). (2) Mes-sage aggregation, which defines the functionAGG to aggregate mes-sages from node 𝑣 ’s neighbors: 𝑀𝑘+1
𝑣 = AGG(𝑚𝑘+1𝑢𝑟𝑣 |𝑟 ∈R, 𝑢 ∈N𝑟𝑣 ).
(3) Representation update, which defines the function UPD to up-date 𝑣 ’s representation from the aggregated messages𝑀𝑘+1
𝑣 and 𝑣 ’sprevious layer representation 𝒉𝑘𝑣 : 𝒉𝑘+1𝑣 = 𝑈𝑃𝐷 (𝒉𝑘𝑣 , 𝑀𝑘+1
𝑣 ).In terms of message calculation, for a node 𝑣 with the triplet
(𝑢, 𝑟, 𝑣), our proposed GNN based encoder adopts the compositionof neighbor node and linked relation [25, 33]:
MSG(𝒉𝑘𝑢 ,𝒉
𝑘𝑟 ,𝒉
𝑘𝑣
)=𝑾𝑘
𝑟 𝜙
(𝒉𝑘𝑢 ,𝒉
𝑘𝑟
), (1)
where𝑾𝑘𝑟 is the relation-specific projection matrix, while 𝜙 : R𝑑 ×
R𝑑 → R𝑑 is the entity-relation composition operation, e.g., element-wise subtraction and element-wise multiplication.
Moreover, the message aggregation and the representation up-date are defined as relation-specific mean pooling and nonlineartransformation, respectively. Thus, the representation of node 𝑣 atlayer 𝑘 + 1 can be expressed as,
𝒉𝑘+1𝑣 = 𝑓©«∑︁𝑟 ∈R
1|N𝑟𝑣 |
∑︁𝑢∈N𝑟
𝑣
𝑾𝑘𝑟 𝜙
(𝒉𝑘𝑢 ,𝒉
𝑘𝑟
)ª®¬ , (2)
Figure 5: The illustration of KnowSite model with a sub-graph of UrbanKG.
whereN𝑟𝑣 denotes 𝑣 ’s neighbors under relation 𝑟 ∈R, while 𝑓 :R𝑑→
R𝑑 denotes the nonlinear activation function. Such relation-specificmessage passing is illustrated from Figure 5(a) to (b). Besides, in eachlayer the relation representation is obtained via linear projection,
𝒉𝑘+1𝑟 =𝑾𝑘+1rel 𝒉𝑘𝑟 , (3)
where𝑾𝑘+1rel denotes the relational projection matrix at layer 𝑘 + 1.
The pre-trained embeddings are initialized for 𝒉0𝑟 ,𝒉𝑘𝑢 ,𝒉𝑘𝑣 .Compared with task-agnostic pre-training, the GNN based en-
coding is task-specific, where the learnable projection matricesdetermine the influences of various messages and refine usefulknowledge for site selection, supervised by the task loss introducedin the following. Such multi-relational message passing mechanism
3.3.2 Relation Path based Decoder. With knowledgeable represen-tations obtained in GNN based encoder, to explore the explainabilityof knowledge, we further propose a relation path based decoder forboth effective and explainable site decisions. Here we first introducethe relation path in KG [21, 52].
Definition 3.1. RelationPath.A relation path in KGG = (E,R, F )is defined as 𝑝 = (𝑟1, · · · , 𝑟 |𝑝 |), where |𝑝 | denotes the number ofhops and 𝑟1, · · · , 𝑟 |𝑝 | ∈ R.
Obviously, the relation path provides rich semantic contexts andcan be used to explain the logical reasoning of site decisions withUrbanKG. For example, the relation path Brand
𝑟𝑂𝑆𝐴−→ Region𝑟𝑆𝐹−→
Region focuses on the criteria of region function, i.e., opening thenew store at the region with similar functions, while Brand
𝑟𝑅𝐵−→Brand
𝑟𝑂𝑆𝐴−→ Region indicates the logic that the brand learns fromits related brand and opens the new store at the same region. Thus,based on UrbanKG and key criteria in traditional site selection [44,45], we summarize the relation paths for site selection in Table 2.
Table 2: Relation paths for site selection in UrbanKG. Rela-tions of 𝑟 ′BS_1, 𝑟
′B2C_1 𝑟
′P2C_1 represent inverse relations.
Criteria Relation Paths with Ontologies
Region Distance Brand𝑟𝑂𝑆𝐴−→ Region
𝑟𝑁𝐵−→ RegionRegion Function Brand
𝑟𝑂𝑆𝐴−→ Region𝑟𝑆𝐹−→ Region
Region Flow Brand𝑟𝑂𝑆𝐴−→ Region
𝑟𝐹𝑇−→ Region
Business Area Brand𝑟𝑂𝑆𝐴−→ Region
𝑟 ′𝐵𝑆−→ Ba
𝑟𝐵𝑆−→ RegionRelated Brand Brand
𝑟𝑅𝐵−→ Brand𝑟𝑂𝑆𝐴−→ Region
Brand Category Brand𝑟𝐵2𝐶_1−→ Cate_1
𝑟 ′𝐵2𝐶_1−→ Brand
𝑟𝑂𝑆𝐴−→ RegionCompetitiveness Brand
𝑟𝐵𝑂−→ POI𝑟𝐶𝑜𝑚𝑝
−→ POI𝑟𝐿𝐴−→ Region
Store Category Brand𝑟𝐵2𝐶−→ Cate_1
𝑟 ′𝑃2𝐶_1−→ POI
𝑟𝐿𝐴−→ Region

Knowledge-driven Site Selection via Urban Knowledge Graph Conference’17, July 2017, Washington, DC, USA
Based on the relation paths, we introduce the design of rela-tion path based decoder, as shown in Figure 5(c). First, we obtainthe representation of each relation path by semantic composition[21]. Specifically, given a relation path 𝑝 = (𝑟1, · · · , 𝑟 |𝑝 |) and thebrand 𝑏, the brand-specific path representation can be calculatedvia following three ways,
Add :𝒑 = 𝒉𝐾𝑏+ 𝒉𝐾𝑟1 + · · · + 𝒉𝐾𝑟 |𝑝 | , (4)
Mult :𝒑 = 𝒉𝐾𝑏⊙ 𝒉𝐾𝑟1 ⊙ · · · ⊙ 𝒉𝐾𝑟 |𝑝 | , (5)
GRU :𝒑 = GRU( [𝒉𝐾𝑟1 , · · · ,𝒉𝐾𝑟 |𝑝 | ],𝒉
𝐾𝑏), (6)
where ⊙ is the element-wise product, and 𝒉𝐾𝑏in (6) is the initial
hidden state for gated recurrent unit (GRU) input.Since multiple factors/criteria are comprehensively considered
in site selection [32], we further applies the attention mechanism[33] on relation paths for brand-specific site decision vector,
𝒛𝑏 = Attention(𝑾Query𝒉𝐾𝑏,𝑾Key𝑷 ,𝑾Value𝑷 ), (7)
where 𝑷 = [𝒑1; · · · ;𝒑𝑛𝑝 ] is the concatenated relation path repre-sentation matrix and 𝑛𝑝 is the number of relation paths for siteselection (𝑛𝑝 = 8 in our case).𝑾Query,𝑾Key and𝑾Value are learn-able parameters in the attention mechanism. The attention weightsprovide explainable results behind site decisions, especially therelationship between brands and various criteria.
For pairwise data (𝑏, 𝑎) ∈ Dsite (𝑏 is the brand and 𝑎 is theregion), the decision vector is multiplied with region embeddingvector for the path based score. Additionally, for relatedness maxi-mization, we utilize the bilinear product3 to obtain the link basedscore via direct relation𝑂𝑝𝑒𝑛𝑆𝑡𝑜𝑟𝑒𝐴𝑡 . The two parts are fused by ahyper-parameter 𝛼 for final link prediction score on site selection.
𝑦𝑏𝑎 = (1 − 𝛼) · 𝒛⊤𝑏𝒉𝐾𝑎 + 𝛼 · ⟨𝒉𝐾
𝑏,𝒉𝐾𝑟𝑂𝑆𝐴
,𝒉𝐾𝑎 ⟩. (8)Accordingly, we adopt the cross-entropy loss for model parame-
ter learning, and formulate the objective function as follow,
min𝚯
∑︁(𝑏𝑖 ,𝑎 𝑗 ) ∈DSite
− log𝑒𝑦𝑏𝑖𝑎𝑗∑
𝑎𝑘 ∈A 𝑒𝑦𝑏𝑖𝑎𝑘
+ _ · ∥𝚯∥, (9)
where 𝚯 includes the learnable parameters in GNN based encoderand relation path based decoder. A represents the set of candidateregions. _ is used to regularize the model parameters. The proposedKnowSite model is trained in a mini-batch way to minimize theobjective formulation above.
Overall, with task-specific loss and end-to-end training, the pro-posed KnowSite model designs the multi-relational GNN based en-coder for site selection related message passing, and further learnsthe relation path based decoder to explicitly model the logic of sitedecisions, achieving both effective and explainable performance.
4 EVALUATION4.1 Experimental Setup4.1.1 Datasets. We collect two datasets for evaluation with twocities of Beijing and Shanghai. Several sources of urban data arecollected and crawled from map service, life service platform, socialmedia4 as well as Internet service provider, which are summarizedin Table 3. Besides, the user data has been anonymized for privacy
3 ⟨𝒂,𝒃, 𝒄 ⟩ = ∑𝑖 𝑎𝑖 · 𝑏𝑖 · 𝑐𝑖
4https://weibo.com, https://www.amap.com, https://www.meituan.com
protection. The details of site selection data and UrbanKG can befound in Section A.
Table 3: A summary of themulti-source urban data collectedfor Beijing/Shanghai in China. ISP denotes Internet ServiceProvider. 𝑛 denotes the sequence length.
Data Format Source Amount
DRN (region_id, {(lng𝑖 , lat𝑖 )}𝑛𝑖=1) Map Service 500/2kDBa (Ba_id, name, lng, lat) Life Service Platform 160/200DPOI (pid, name, lng, lat, cate_1/2/3) Map Service 22k/38kDBrand (brand_id, name) Text Mining 400DSite (brand_id, region_id) DPOI,DBrand,DRN 25k/40kDTraj (uid, {(lng𝑖 , lat𝑖 , 𝑡𝑖 )}𝑛𝑖=1) ISP 400k/150kDCheck (uid, pid, #check-in) Social Media 1MDClick (pid, #click) Map Service 22k/38k
4.1.2 Baselines. We compare our proposed KnowSite model withtwo types of models. First, following the feature engineering andframework in [17, 19, 22, 39, 40], we choose five traditional data-driven models, Lasso [29], SVR [1], XGBoost [7], RankNet [5] aswell as NeuMF-RS [19]. All data sources have been utilized forfeature extraction. Due to the model generalization issue to variousbrands, we train and test the first four models brand by brand,and report the average performance. Second, we further comparewith four typical KG link prediction models on UrbanKG, TransE[3], DistMult [42], ComplEx [31] and TuckER [2]. All the baselinesare tuned with their reported settings (in site selection works, ifapplicable), and the weights of𝑂𝑝𝑒𝑛𝑆𝑡𝑜𝑟𝑒𝐴𝑡 links in KG completionmodels are increased to 10 for the site selection task.
4.1.3 Evaluation Metrics. We evaluate the site selection perfor-mancewith five standardmetrics of NDCG@𝑘 , Hit@𝑘 , Precision@𝑘 ,Recall@𝑘 and MAP@𝑘 [17, 19, 39, 40] that defined in Section B.1.We evaluate the performance with 𝑘 = 5, 10, 20. Due to the spacelimitation, some results with 𝑘 = 5, 20 are omitted, which are inaccord with other metrics.
4.1.4 Implementation. For the proposed KnowSite model learning,the batch size is set to 128 and the embedding dimension 𝑑 is setto 64. Besides, batch normalization and dropout are used for reg-ularization. We use the rotate composition operator [9] in GNNbased encoder, and the number of GNN layers ranges from 1 to 3.We tune other hyper-parameters with early stopping mechanismon validation NDCG@10. The learning rate and the dropout aresearched from {0.0005, 0.001, 0.003, 0.005} and {0.1, 0.3, 0.5}, respec-tively. The fusion parameter 𝛼 ranges from 0.0 to 1.0. As for thepre-training step, we train the TuckER model with early stoppingmechanism on training loss. All models are run 10 times and theaverage results are reported to prevent extreme cases. Besides, thestores (POIs) as well as 𝑂𝑝𝑒𝑛𝑆𝑡𝑜𝑟𝑒𝐴𝑡 links in valid & test sets areremoved from UrbanKG to avoid test leakage.
Next, we present the performance comparison on two datasets,and then analyze the effectiveness of each module in KnowSite withablation study. Several explainable results are further investigatedfor the logic of site selection.

Conference’17, July 2017, Washington, DC, USA Yu Liu, Jingtao Ding, and Yong Li
Table 4: Performance comparison w.r.t. test NDCG@k, Hit@k, Precision@k, Recall@k and MAP@k on two datasets. Bestresults are in bold and the best results (in baselines) are underlined. The last two rows show relative improvement in percentageand 𝑝-value compared with the best baseline with 10 runs of experiments.
Beijing Shanghai
Model N@5 N@10 H@5 H@10 P@10 R@10 M@10 N@5 N@10 H@5 H@10 P@10 R@10 M@10
Lasso 0.057 0.061 0.189 0.305 0.061 0.068 0.031 0.039 0.037 0.118 0.176 0.037 0.038 0.020SVR 0.094 0.093 0.301 0.435 0.082 0.096 0.046 0.064 0.059 0.211 0.299 0.054 0.058 0.028
XGBoost 0.100 0.100 0.320 0.454 0.089 0.103 0.050 0.075 0.062 0.205 0.297 0.058 0.062 0.030RankNet 0.122 0.121 0.369 0.501 0.104 0.122 0.064 0.085 0.081 0.274 0.383 0.074 0.078 0.038NeuMF-RS 0.180 0.178 0.501 0.653 0.155 0.182 0.097 0.178 0.168 0.478 0.615 0.148 0.163 0.090
TransE 0.080 0.084 0.297 0.460 0.075 0.089 0.036 0.064 0.063 0.244 0.372 0.058 0.064 0.026DistMult 0.161 0.161 0.475 0.634 0.137 0.164 0.083 0.150 0.142 0.448 0.591 0.124 0.138 0.071ComplEx 0.170 0.169 0.502 0.657 0.143 0.171 0.088 0.147 0.142 0.442 0.583 0.126 0.140 0.070TuckER 0.183 0.183 0.518 0.673 0.156 0.187 0.098 0.188 0.174 0.502 0.620 0.150 0.166 0.094
KnowSite (Add) 0.218 0.217 0.556 0.707 0.185 0.222 0.125 0.218 0.200 0.541 0.653 0.171 0.191 0.113KnowSite (Mult) 0.221 0.219 0.565 0.709 0.186 0.224 0.127 0.219 0.202 0.543 0.664 0.173 0.193 0.115KnowSite (GRU) 0.220 0.219 0.557 0.713 0.186 0.223 0.127 0.220 0.205 0.543 0.671 0.177 0.197 0.116
Improv. 20.8% 19.7% 9.1% 5.9% 19.2% 19.8% 29.6% 17.0% 17.8% 8.2% 8.2% 18.0% 18.7% 23.4%𝑝−value 2.0e-10 1.5e-11 1.8e-6 1.6e-5 7.1e-12 1.1e-11 1.5e-11 1.1e-9 4.2e-11 6.9e-8 3.0e-10 1.9e-11 6.6e-11 1.2e-9
4.2 Performance ComparisonTable 4 presents the site selection performance comparison on bothdatasets. For KnowSite, all three composition operations of addition(Add), multiplication (Mult) and GRU are considered for relationpath representation. In general, our proposed KnowSite outper-forms all baselines across five evaluation metrics. Specifically, theimprovement in Beijing dataset ranges from 5.9%~29.6%, while theimprovement in Shanghai dataset is from 8.2%~23.4%. The consider-able improvements demonstrate the effectiveness of our proposedknowledge-driven paradigm as well as systematic encoder-decoderframework. Besides, KnowSite models with three composition op-erations achieve comparable performance, and we select the GRUoperation for detailed studies later.
Moreover, we have following three observations. First, knowledge-driven models of DistMult, ComplEx, TuckER and KnowSite per-form more competitively than left data-driven ones, which owesto the knowledge discovery on UrbanKG. For example, the bestdata-driven baseline NeuMF-RS formulates the problem as matrixcompletion, which is easily affected by limited brand-region sam-ples and cannot exploit rich semantics in multi-source urban dataas UrbanKG does. Second, knowledge-driven models show strongrobustness to various cities with knowledge refinement. For thetwo datasets, Shanghai dataset contains much more brands andcandidate regions, and thus is more challenging. Due to the in-completeness of feature engineering and diverse influences, theperformance gap of data-driven models between the two datasetsare significant, e.g., a gap of over 0.150 on Hit@10 for SVR/XGBoost.In comparison, the gap for knowledge-driven models is less than0.080 with site selection knowledge learned. Third, the performancegap between KG link prediction models and KnowSite implies thatextending KRL methods to site selection application is nontrivialand needs further customized designs, e.g., multi-relational mes-sage passing for knowledge refinement, and site selection relatedrelation paths as well as brand-specific attention mechanism forknowledge explainability.
4.3 Ablation StudyTo evaluate the effectiveness of each module in KnowSite, Figure 6shows the hit ratio performance of different model variants on bothdatasets. Specifically, we evaluate the KnowSite model withoutpre-training, GNN based encoder and relation path based decoder,respectively. Note that the variant without decoder (w/o Decoder)is equivalent to the KnowSite model with 𝛼 = 1 in (8).
Hit@5 Hit@10 Hit@20Metric
0.45
0.50
0.55
0.60
0.65
0.70
0.75
0.80
0.85
Perfo
rman
ce
KnowSitew/o Decoder
w/o Pretrainw/o Encoder
(a) Beijing
Hit@5 Hit@10 Hit@20Metric
0.40
0.45
0.50
0.55
0.60
0.65
0.70
0.75
0.80
Perfo
rman
ce
KnowSitew/o Decoder
w/o Pretrainw/o Encoder
(b) Shanghai
Figure 6: Performance comparison of different model vari-ants on datasets.
According to the results, without the GNN based encoder, themodel performance is reduced by 12% and 17% on Hit@10 for Bei-jing and Shanghai datasets, respectively. Thus, the GNN basedencoder plays a quite important role in performance guarantee,which confirms the importance of knowledge refinement and thegain of task-specific message passing mechanism. Compared withother KRL methods, the GNN based encoder successfully modelsdiverse knowledge with site selection, making the KnowSite modelexpressive. Besides, the pre-training step provides a task-agnosticbut semantic initialization, contributing a performance gain of 5%on Hit@10 for datasets. Moreover, relation path based decoder fur-ther achieves 4%-5% improvement on Hit@10 with brand-specificchoice of site selection criteria. Therefore, all three modules of pre-training, GNN based encoder and relation path based decoder arequite essential for effective site decisions.

Knowledge-driven Site Selection via Urban Knowledge Graph Conference’17, July 2017, Washington, DC, USA
4.4 Explainability StudyTo further investigate the influence of relation paths in KnowSiteas well as understand the reasons behind different brands’ sitedecisions, we present several case studies in this part.
4.4.1 Influence of Relation Paths. The relation paths in Table 2can be categorized into three types of region-based (the first fourpaths), brand-based (the 5th and 6th paths), and store-based (thelast two paths) criteria, and we investigate their influence on modelperformance by removing any type of relation paths in decoder ofKnowSite, as shown in Figure 7.
Hit@5 Hit@10 Hit@20Metric
0.50
0.55
0.60
0.65
0.70
0.75
0.80
0.85
Perfo
rman
ce
KnowSitew/o Brand
w/o Storew/o Region
(a) Beijing
Hit@5 Hit@10 Hit@20Metric
0.50
0.55
0.60
0.65
0.70
0.75
0.80
Perfo
rman
ce
KnowSitew/o Brand
w/o Storew/o Region
(b) Shanghai
Figure 7: Performance comparison of KnowSite modelswithout different types of relation paths on datasets.
Overall, we observe the performance decrease in both datasets.For example, based on the evaluation metric of Hit@10, removingbrand-based relation paths brings a drop of 4% for Beijing dataset,while removing region-based ones brings a drop of 3% for Shanghaidataset. More importantly, based on results in two datasets, we areable to identify different preferences to above relation paths fordifferent cities, which may be caused by different city structuresand other social factors. Specifically, the region-based relation pathsare the most important type for Shanghai but the least importantone for Beijing. This may partly owe to the different region struc-tures. Due to numerous waterways in Shanghai, the regions are inirregular structure and thus own various functions and sizes, whichfurther becomes a quite important factor for site selection. In con-trast, regions in Beijing are arranged in grid structure with similarfunctions and sizes, which is less important than other factors likethe characteristics of brands and stores. Hence, the influence ofrelation paths provides explainable site decisions in different cities.
4.4.2 Brands v.s. Site Selection Criteria. As described in Section 3.3.2,the attention weights in (7) show the relationship between brandsand criteria. Thus, we present the attention weight visualizationon two datasets in Figure 8. Several typical brands across food,leisure sports, accommodation and other categories are selectedfor visualization. A description of selected brands can be found inSection A.2 for better understanding.
By combining visualization results in different cities, i.e., Fig-ure 8(a) and (b) together, we have similar findings regarding tobrands’ preference to selection criteria that are both insightful andconvincing. First, all fast-food chain brands like KFC, McDonald’s,Burger King and Pizza Hut determine optimal locations with busi-ness area condition and related brand strategy considered, whichis in accord with the location game between brands [28] as wellas the commonsense that there always is one KFC store near oneMcDonald’s store [13]. Second, similar attention on related brandstrategy can also be observed among bank brands of ICBC, CCB and
KFCM
cDon
ald's
Burger
King
Pizza H
ut
Starbuck
s
Luckin
ZL Hotp
ot
YGF Hotp
ot
Wed
ome
Baosf
Pastry
Gong C
ha
alitte
-tea
Bianlife
ng
7-Elev
en
ICBC
CCBBOC
NikeAdidas
Li-Ning
Super 8
Hantin
g
99 In
nHom
e Inn
Region Distance
Region Function
Region Flow
Business Area
Related Brand
Brand Category
Competitiveness
Store Category
0.2
0.4
0.6
(a) Beijing
KFCM
cDon
ald's
Burger
King
Pizza H
ut
Starbuck
s
Luckin
ZL Hotp
ot
YGF Hotp
ot
Wed
ome
Baosf
Pastry
Gong C
ha
alitte
-tea
Bianlife
ng
7-Elev
en
ICBC
CCBBOC
NikeAdidas
Li-Ning
Super 8
Hantin
g
99 In
nHom
e Inn
Region Distance
Region Function
Region Flow
Business Area
Related Brand
Brand Category
Competitiveness
Store Category
0.2
0.4
0.6
0.8
(b) Shanghai
Figure 8: Attention weight visualization of different brandsto site selection criteria on datasets.
BOC, three large banks in China. These bank brands also focus onregion flow for more customers. Moreover, the last four columns infigures represent the preference of four popular hotel chain brandsto region flow, which determines the occupancy directly. Note thatthe slight difference between results in Figure 8(a) and (b) may becaused by different city conditions and noise in model learning.Overall, such results demonstrate the explainable capability of ourproposed KnowSite model, which can provide a good reference forsite selection understanding.
To further investigate the influence of site selection criteriaon brand representations, Figure 9 visualizes the cosine distancebetween selected brands in Beijing, in which Figure 9(a) utilizestask-agnostic representations 𝒉0
𝑏of pre-training, while Figure 9(b)
utilizes task-specific ones 𝒉𝐾𝑏of GNN based encoder output with
end-to-end training. Since UrbanKG contains semantic informationlike RelatedBrand links, related brands’ representations are closercompared with others, as shown in diagonal blocks of Figure 9(a).However, due to the task-agnostic learning’ in pre-training step,such correlation is not that obvious. In comparison, a remarkablebrand correlation is illustrated in Figure 9(b). Several highlightdiagonal blocks indicate the closeness of brands in hidden space,such as the first block of four fast-food chain brands and the lastblock of four hotel chain brands. Besides, the brand correlationsin off-diagonal parts are also enhanced in Figure 9(b), which alsosuggests the effectiveness of knowledge refinement with brandinformation encoding. Therefore, KnowSite successfully capturesthe semantic relatedness among brands and reveals the relationshipbetween brands and various site selection criteria.
4.4.3 Categories v.s. Site Selection Criteria. In Figure 10, we fur-ther reveal the relationship between categories and site selectioncriteria. For each dataset, eight typical categories are selected, andthe attention weights of all brands under corresponding categoriesare averaged for visualization.
Similar phenomenons in Figure 8 can be observed in Figure 10.The brands of food category focus on business area and related

Conference’17, July 2017, Washington, DC, USA Yu Liu, Jingtao Ding, and Yong Li
KFCM
cDon
ald's
Burger
King
Pizza H
ut
ICBC
CCBBOC
NikeAdidas
Li-Ning
Super 8
Hantin
g
99 In
nHom
e Inn
KFCMcDonald'sBurger King
Pizza HutICBCCCBBOCNike
AdidasLi-NingSuper 8Hanting
99 InnHome Inn
0.0
0.2
0.4
0.6
0.8
1.0
(a) Task-agnostic output
KFCM
cDon
ald's
Burger
King
Pizza H
ut
ICBC
CCBBOC
NikeAdidas
Li-Ning
Super 8
Hantin
g
99 In
nHom
e Inn
KFCMcDonald'sBurger King
Pizza HutICBCCCBBOCNike
AdidasLi-NingSuper 8Hanting
99 InnHome Inn
0.2
0.0
0.2
0.4
0.6
0.8
1.0
(b) Task-specific output
Figure 9: Cosine distance visualization of different brands’representations in Beijing.
FoodShop
ping
Sports
Service
Accomm.
Business
Med
ical
Edu.
Region DistanceRegion Function
Region FlowBusiness Area
Related BrandBrand CategoryCompetitiveness
Store Category
0.1
0.2
0.3
0.4
0.5
(a) Beijing
FoodShop
ping
Sports
Service
Accomm.
Business
Med
ical
Edu.
Region DistanceRegion Function
Region FlowBusiness Area
Related BrandBrand CategoryCompetitiveness
Store Category
0.2
0.4
0.6
0.8
(b) Shanghai
Figure 10: Attention weight visualization of different cate-gories to site selection criteria on datasets. Sports, Service,Accomm., Edu. represent leisure sports, life service, accom-modation and education, respectively.
brand, while the brands of accommodation category pay moreattention to region function and flow. Among the site selectioncriteria, the region factors of distance and function as well as relatedbrand strategy are commonly considered across various categories.Such results again validate the importance of relation path baseddecoder in KnowSite, and explore its potential in site selection forboth brand and category levels.
Throughout the experimental study, KnowSite achieves the state-of-the-art performance on site selection task, and the effectivenessof each designed module is validated. Moreover, with relation pathsand attention mechanism utilized, KnowSite successfully revealsthe influences of site selection criteria on various businesses.
5 RELATEDWORKHerewe discuss some closely related studies, including site selectionmethods, KRL with KG and KG applications in urban computing.
With multi-source urban data available, the data-driven methodsfirst extract features from data, and then learn regression/learning-to-rank models for the problem [17, 39]. Specifically, both Geo-Spotting [17] and DD3S [39] firstly investigate the predictive powerof various features like density, competitiveness and area popularity,and then apply traditional SVR [1] and RankNet [5] to determine theoptimal location. However, these methods learn individual modelsfor each brand and cannot generalize to various businesses. Fur-thermore, several works also integrate deep network with featureengineering [19, 22, 40]. For example, DeepStore [22] and AR2Net[40] extracts features from commercial data, satellite images, etc.,and further combine deep neural networks with attention mech-anism for solution. UKG-NN [49] builds a relational graph withmanually defined features, which are passed to the neural network
for site decisions. NeuMF-RS [19] adds restaurants’ and sites’ at-tributes to neural collaborative filtering for site selection. However,deep models suffer from explainability issues with black box neuralnetworks. Both traditional and deepmodels fail to extract vital infor-mation from data according to site selection criteria, i.e., knowledge,whose performance is easily affected by the quality of upstream fea-ture engineering. In contrast, our work leverages knowledge-drivenparadigm for both effective and explainable performance.
As for KRL to learn embeddings of entities and relations, thoughcomplete structures like GNN have been introduced [25, 33], tensordecomposition models still achieve the best performance [15], suchas DistMult [42], ComplEx [31] and TuckER [2]. Here we argue thatthe proposed GNN encoder is more suitable for representing specificknowledge of site selection, as it can flexibly control the informationsharing among diverse factors. Meanwhile, multi-hop relation pathshave been introduced in KRL for more accurate representations[21, 52]. In the proposed KnowSite, we adopt relation path baseddecoder to model site selection criteria for brands. Thus, it not onlyboosts the performance, but also provides explainable site decisionsbased on the relation path logic. Note that our relation path basedon KG is different from the meta-path counterpart in heterogeneousgraphs [43], which only learns node embeddings but ignores edgerepresentations [38], thus not applicable to this work.
In addition, there are some attempts to apply KG for urbancomputing. For example, the construction of geographic KGs isinvestigated in [27, 41], where the spatial relationships betweengeographic components are extracted. Some works [8, 36, 48] in-troduce KG with two or three relations and ontologies for specificapplications. However, such developed KGs miss important knowl-edge for site selection such as human flow, competitiveness, brandrelatedness, etc. In comparison, our proposed UrbanKG containsrich site selection related knowledge with over 20k entities in thecity and over 300k facts between them, which is a promising back-bone for various applications in urban computing.
6 CONCLUSIONIn this work, we proposed KnowSite, a knowledge-driven model forsite selection. By leveraging KG for urban knowledge representa-tion, KnowSite develops a generalized encoder-decoder framework,where multi-relational message passing and criteria-based relationpaths are adopted to reason different brands’ site decisions. Ex-tensive experiments demonstrate that KnowSite achieves superiorperformance with both effectiveness and explainability achieved.
As future work, we will combine KnowSite with the traditionaldata-driven paradigm, and utilize both KRL methods and featureengineering towards powerful site selection. Moreover, we plan toexplore our proposed UrbanKG as well as the generalized encoder-decoder framework for other urban computing tasks such as flowprediction, mobility prediction, etc.

Knowledge-driven Site Selection via Urban Knowledge Graph Conference’17, July 2017, Washington, DC, USA
REFERENCES[1] Mariette Awad and Rahul Khanna. 2015. Support Vector Regression. In Efficient
Learning Machines. Springer, 67–80.[2] Ivana Balažević, Carl Allen, and Timothy M Hospedales. 2019. TuckER: Tensor
Factorization for Knowledge Graph Completion. In EMNLP. 5185–5194.[3] Antoine Bordes, Nicolas Usunier, Alberto Garcia-Duran, Jason Weston, and Ok-
sana Yakhnenko. 2013. Translating Embeddings for Modeling Multi-relationalData. In NeurIPS. 2787–2795.
[4] Michael J Breheny. 1988. Practical Methods of Retail Location Analysis: A Review.In Store Choice, Store Location and Market Analysis. Routledge, London, Chapter 2,39–86.
[5] Chris Burges, Tal Shaked, Erin Renshaw, Ari Lazier, Matt Deeds, Nicole Hamilton,and Greg Hullender. 2005. Learning to Rank Using Gradient Descent. In ICML.89–96.
[6] Buru Chang, Gwanghoon Jang, Seoyoon Kim, and Jaewoo Kang. 2020. LearningGraph-based Geographical Latent Representation for Point-of-Interest Recom-mendation. In CIKM. 135–144.
[7] Tianqi Chen and Carlos Guestrin. 2016. XGBoost: A Scalable Tree BoostingSystem. In KDD. 785–794.
[8] Amine Dadoun, Raphaël Troncy, Olivier Ratier, and Riccardo Petitti. 2019. Loca-tion Embeddings for Next Trip Recommendation. In WWW. 896–903.
[9] Mikhail Galkin, Priyansh Trivedi, Gaurav Maheshwari, Ricardo Usbeck, and JensLehmann. 2020. Message Passing for Hyper-Relational Knowledge Graphs. InEMNLP. 7346–7359.
[10] Bin Guo, Jing Li, VincentWZheng, ZhuWang, and Zhiwen Yu. 2018. Citytransfer:Transferring Inter-and Intra-city Knowledge for Chain Store Site Recommenda-tion Based on Multi-source Urban Data. UbiComp 1, 4 (2018), 1–23.
[11] Qingyu Guo, Fuzhen Zhuang, Chuan Qin, Hengshu Zhu, Xing Xie, Hui Xiong,and Qing He. 2020. A Survey on Knowledge Graph-based Recommender Systems.IEEE TKDE (2020).
[12] Aidan Hogan, Eva Blomqvist, Michael Cochez, Claudia d’Amato, Gerard De Melo,Claudio Gutierrez, Sabrina Kirrane, José Emilio Labra Gayo, Roberto Navigli,Sebastian Neumaier, et al. 2021. Knowledge Graphs. ACM Comput. Surv. 54, 4(2021), 1–37.
[13] Wei Hu and Yuanyuan Xie. 2013. Comparative Study of McDonald’s and Ken-tucky Fried Chicken (KFC) Development in China. Sanovia: Internal BusinessAdministration (2013).
[14] Xiao Huang, Jingyuan Zhang, Dingcheng Li, and Ping Li. 2019. Knowledge GraphEmbedding Based Question Answering. In WSDM. 105–113.
[15] Shaoxiong Ji, Shirui Pan, Erik Cambria, Pekka Marttinen, and Philip S Yu. 2021.A Survey on Knowledge Graphs: Representation, Acquisition, and Applications.IEEE TNNLS (2021).
[16] Iris A Junglas and Richard T Watson. 2008. Location-based Services. Commun.ACM 51, 3 (2008), 65–69.
[17] Dmytro Karamshuk, Anastasios Noulas, Salvatore Scellato, Vincenzo Nicosia,and Cecilia Mascolo. 2013. Geo-spotting: Mining Online Location-based Servicesfor Optimal Retail Store Placement. In KDD. 793–801.
[18] Vipin Kumar and Kiran Karande. 2000. The effect of retail store environment onretailer performance. Journal of business research 49, 2 (2000), 167–181.
[19] Nuo Li, Bin Guo, Yan Liu, Yao Jing, Yi Ouyang, and Zhiwen Yu. 2018. Commer-cial Site Recommendation Based on Neural Collaborative Filtering. In UbiCompAdjunct. 138–141.
[20] Shuangli Li, Jingbo Zhou, Tong Xu, Hao Liu, Xinjiang Lu, and Hui Xiong. 2020.Competitive Analysis for Points of Interest. In KDD. 1265–1274.
[21] Yankai Lin, Zhiyuan Liu, Huanbo Luan, Maosong Sun, Siwei Rao, and Song Liu.2015. Modeling Relation Paths for Representation Learning of Knowledge Bases.In EMNLP. 705–714.
[22] Yan Liu, Bin Guo, Nuo Li, Jing Zhang, Jingmin Chen, Daqing Zhang, Yinxiao Liu,Zhiwen Yu, Sizhe Zhang, and Lina Yao. 2019. DeepStore: An Interaction-awareWide&Deep Model for Store Site Recommendation with Attentional SpatialEmbeddings. IEEE Internet Things J. 6, 4 (2019), 7319–7333.
[23] Laurens van der Maaten and Geoffrey Hinton. 2008. Visualizing Data Using t-sne.JMLR 9, Nov (2008), 2579–2605.
[24] Nicholas A Phelps and Andrew MWood. 2018. The Business of Location: Site Se-lection Consultants and the Mobilisation of Knowledge in the Location Decision.Journal of Economic Geography 18, 5 (2018), 1023–1044.
[25] Michael Schlichtkrull, Thomas N Kipf, Peter Bloem, Rianne Van Den Berg, IvanTitov, and Max Welling. 2018. Modeling Relational Data with Graph Convolu-tional Networks. In ESWC. 593–607.
[26] Erzhuo Shao, Huandong Wang, Jie Feng, Tong Xia, Hedong Yang, Lu Geng,Depeng Jin, and Yong Li. 2021. DeepFlowGen: Intention-aware Fine Grained
Crowd Flow Generation via Deep Neural Networks. IEEE TKDE (2021).[27] Yuhan Sun, Jia Yu, and Mohamed Sarwat. 2019. Demonstrating Spindra: A
Geographic Knowledge Graph Management System. In ICDE. 2044–2047.[28] Presh Talwalkar. 2012. Why are McDonald’s and Burger King Usually
Located Near Each Other? Fast Food Location Game Theory. https://mindyourdecisions.com/blog/2012/10/23/why-are-mcdonalds-and-burger-king-usually-located-near-each-other-fast-food-location-game-theory/
[29] Robert Tibshirani. 1996. Regression Shrinkage and Selection via the Lasso. Journalof the Royal Statistical Society: Series B (Methodological) 58, 1 (1996), 267–288.
[30] Harry Timmermans. 1986. Locational choice behaviour of entrepreneurs: anexperimental analysis. Urban Studies 23, 3 (1986), 231–240.
[31] Théo Trouillon, Johannes Welbl, Sebastian Riedel, Éric Gaussier, and GuillaumeBouchard. 2016. Complex Embeddings for Simple Link Prediction. In ICML.
[32] Gülden Turhan, Mehmet Akalın, and Cemal Zehir. 2013. Literature Review onSelection Criteria of Store Location Based on Performance Measures. Procedia-Social and Behavioral Sciences 99 (2013), 391–402.
[33] Shikhar Vashishth, Soumya Sanyal, Vikram Nitin, and Partha Talukdar. 2019.Composition-based Multi-relational Graph Convolutional Networks. In ICLR.
[34] Hongwei Wang, Hongyu Ren, and Jure Leskovec. 2021. Relational MessagePassing for Knowledge Graph Completion. In KDD. 1697–1707.
[35] Hongwei Wang, Fuzheng Zhang, Miao Zhao, Wenjie Li, Xing Xie, and MinyiGuo. 2019. Multi-task Feature Learning for Knowledge Graph Enhanced Recom-mendation. In WWW. 2000–2010.
[36] Pengyang Wang, Kunpeng Liu, Lu Jiang, Xiaolin Li, and Yanjie Fu. 2020. Incre-mental Mobile User Profiling: Reinforcement Learning with Spatial KnowledgeGraph for Modeling Event Streams. In KDD. 853–861.
[37] Quan Wang, Zhendong Mao, Bin Wang, and Li Guo. 2017. Knowledge GraphEmbedding: A Survey of Approaches and Applications. IEEE TKDE 29, 12 (2017),2724–2743.
[38] Xiao Wang, Houye Ji, Chuan Shi, Bai Wang, Yanfang Ye, Peng Cui, and Philip SYu. 2019. Heterogeneous Graph Attention Network. In WWW. 2022–2032.
[39] Mengwen Xu, Tianyi Wang, Zhengwei Wu, Jingbo Zhou, Jian Li, and HaishanWu. 2016. Demand Driven Store Site Selection via Multiple Spatial-temporalData. In SIGSPATIAL. 1–10.
[40] Yanan Xu, Yanyan Shen, Yanmin Zhu, and Jiadi Yu. 2020. AR2Net: An AttentiveNeural Approach for Business Location Selection with Satellite Data and UrbanData. ACM TKDD 14, 2 (2020), 1–28.
[41] Bo Yan, Krzysztof Janowicz, GengchenMai, and Rui Zhu. 2019. A Spatially ExplicitReinforcement LearningModel for Geographic Knowledge Graph Summarization.Transactions in GIS 23, 3 (2019), 620–640.
[42] Bishan Yang, Wen-tau Yih, Xiaodong He, Jianfeng Gao, and Li Deng. 2015. Em-bedding Entities and Relations for Learning and Inference in Knowledge Bases.In ICLR.
[43] Carl Yang, Yuxin Xiao, Yu Zhang, Yizhou Sun, and Jiawei Han. 2020. Heteroge-neous Network Representation Learning: A Unified Framework with Survey andBenchmark. IEEE TKDE (2020).
[44] Jeremy YL Yap, Chiung Ching Ho, and Choo-Yee Ting. 2018. Analytic HierarchyProcess (AHP) for Business Site Selection. InAIP Conference Proceedings, Vol. 2016.020151.
[45] Nurdan Yıldız and Fatih Tüysüz. 2019. A Hybrid Multi-criteria Decision MakingApproach for Strategic Retail Location Investment: Application to Turkish foodretailing. Socio-Economic Planning Sciences 68 (2019), 100619.
[46] Rex Ying, Dylan Bourgeois, Jiaxuan You, Marinka Zitnik, and Jure Leskovec. 2019.GNNExplainer: Generating Explanations for Graph Neural Networks.. In NeurIPS.9240–9251.
[47] Donghan Yu, Yiming Yang, Ruohong Zhang, and Yuexin Wu. 2021. KnowledgeEmbedding Based Graph Convolutional Network. In WWW. 1619–1628.
[48] Ningyu Zhang, Huajun Chen, Xi Chen, and Jiaoyan Chen. 2016. Semantic Frame-work of Internet of Things for Smart Cities: Case Studies. Sensors 16, 9 (2016),1501.
[49] Ningyu Zhang, Shumin Deng, Huajun Chen, Xi Chen, Jiaoyan Chen, XiaoqianLi, and Yiyi Zhang. 2018. Structured Knowledge Base as Prior Knowledge toImprove Urban Data Analysis. ISPRS International Journal of Geo-Information 7,7 (2018), 264.
[50] Zhengyan Zhang, Xu Han, Zhiyuan Liu, Xin Jiang, Maosong Sun, and Qun Liu.2019. ERNIE: Enhanced Language Representation with Informative Entities. InACL. 1441–1451.
[51] Yu Zheng, Licia Capra, Ouri Wolfson, and Hai Yang. 2014. Urban Computing:Concepts, Methodologies, and Applications. ACM TIST 5, 3 (2014), 1–55.
[52] Yao Zhu, Hongzhi Liu, Zhonghai Wu, Yang Song, and Tao Zhang. 2019. Represen-tation Learning with Ordered Relation Paths for Knowledge Graph Completion.In EMNLP. 2662–2671.
Conference’17, July 2017, Washington, DC, USA Yu Liu, Jingtao Ding, and Yong Li
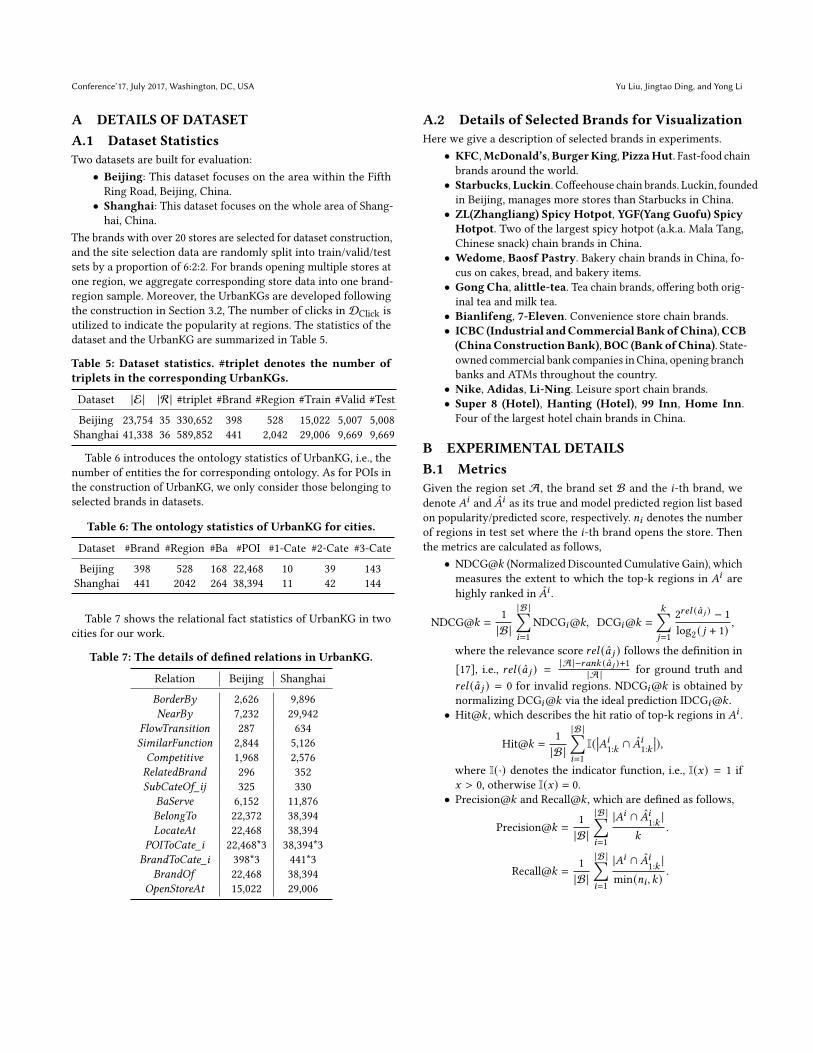
A DETAILS OF DATASETA.1 Dataset StatisticsTwo datasets are built for evaluation:
• Beijing: This dataset focuses on the area within the FifthRing Road, Beijing, China.
• Shanghai: This dataset focuses on the whole area of Shang-hai, China.
The brands with over 20 stores are selected for dataset construction,and the site selection data are randomly split into train/valid/testsets by a proportion of 6:2:2. For brands opening multiple stores atone region, we aggregate corresponding store data into one brand-region sample. Moreover, the UrbanKGs are developed followingthe construction in Section 3.2, The number of clicks in DClick isutilized to indicate the popularity at regions. The statistics of thedataset and the UrbanKG are summarized in Table 5.
Table 5: Dataset statistics. #triplet denotes the number oftriplets in the corresponding UrbanKGs.
Dataset |E | |R| #triplet #Brand #Region #Train #Valid #Test
Beijing 23,754 35 330,652 398 528 15,022 5,007 5,008Shanghai 41,338 36 589,852 441 2,042 29,006 9,669 9,669
Table 6 introduces the ontology statistics of UrbanKG, i.e., thenumber of entities the for corresponding ontology. As for POIs inthe construction of UrbanKG, we only consider those belonging toselected brands in datasets.
Table 6: The ontology statistics of UrbanKG for cities.
Dataset #Brand #Region #Ba #POI #1-Cate #2-Cate #3-Cate
Beijing 398 528 168 22,468 10 39 143Shanghai 441 2042 264 38,394 11 42 144
Table 7 shows the relational fact statistics of UrbanKG in twocities for our work.
Table 7: The details of defined relations in UrbanKG.
Relation Beijing Shanghai
BorderBy 2,626 9,896NearBy 7,232 29,942
FlowTransition 287 634SimilarFunction 2,844 5,126Competitive 1,968 2,576RelatedBrand 296 352SubCateOf_ij 325 330
BaServe 6,152 11,876BelongTo 22,372 38,394LocateAt 22,468 38,394
POIToCate_i 22,468*3 38,394*3BrandToCate_i 398*3 441*3
BrandOf 22,468 38,394OpenStoreAt 15,022 29,006
A.2 Details of Selected Brands for VisualizationHere we give a description of selected brands in experiments.
• KFC,McDonald’s,BurgerKing,PizzaHut. Fast-food chainbrands around the world.
• Starbucks,Luckin. Coffeehouse chain brands. Luckin, foundedin Beijing, manages more stores than Starbucks in China.
• ZL(Zhangliang) Spicy Hotpot, YGF(Yang Guofu) SpicyHotpot. Two of the largest spicy hotpot (a.k.a. Mala Tang,Chinese snack) chain brands in China.
• Wedome, Baosf Pastry. Bakery chain brands in China, fo-cus on cakes, bread, and bakery items.
• Gong Cha, alittle-tea. Tea chain brands, offering both orig-inal tea and milk tea.
• Bianlifeng, 7-Eleven. Convenience store chain brands.• ICBC (Industrial andCommercial BankofChina),CCB(ChinaConstructionBank),BOC (BankofChina). State-owned commercial bank companies in China, opening branchbanks and ATMs throughout the country.
• Nike, Adidas, Li-Ning. Leisure sport chain brands.• Super 8 (Hotel), Hanting (Hotel), 99 Inn, Home Inn.Four of the largest hotel chain brands in China.
B EXPERIMENTAL DETAILSB.1 MetricsGiven the region set A, the brand set B and the 𝑖-th brand, wedenote 𝐴𝑖 and 𝐴𝑖 as its true and model predicted region list basedon popularity/predicted score, respectively. 𝑛𝑖 denotes the numberof regions in test set where the 𝑖-th brand opens the store. Thenthe metrics are calculated as follows,
• NDCG@𝑘 (Normalized Discounted Cumulative Gain), whichmeasures the extent to which the top-k regions in 𝐴𝑖 arehighly ranked in 𝐴𝑖 .
NDCG@𝑘 =1|B|
|B |∑︁𝑖=1
NDCG𝑖@𝑘, DCG𝑖@𝑘 =
𝑘∑︁𝑗=1
2𝑟𝑒𝑙 (𝑎 𝑗 ) − 1log2 ( 𝑗 + 1) ,
where the relevance score 𝑟𝑒𝑙 (𝑎 𝑗 ) follows the definition in[17], i.e., 𝑟𝑒𝑙 (𝑎 𝑗 ) =
|A |−𝑟𝑎𝑛𝑘 (𝑎 𝑗 )+1|A | for ground truth and
𝑟𝑒𝑙 (𝑎 𝑗 ) = 0 for invalid regions. NDCG𝑖@𝑘 is obtained bynormalizing DCG𝑖@𝑘 via the ideal prediction IDCG𝑖@𝑘 .
• Hit@𝑘 , which describes the hit ratio of top-k regions in 𝐴𝑖 .
Hit@𝑘 =1|B|
|B |∑︁𝑖=1I(��𝐴𝑖1:𝑘 ∩𝐴𝑖1:𝑘 ��),
where I(·) denotes the indicator function, i.e., I(𝑥) = 1 if𝑥 > 0, otherwise I(𝑥) = 0.
• Precision@𝑘 and Recall@𝑘 , which are defined as follows,
Precision@𝑘 =1|B|
|B |∑︁𝑖=1
|𝐴𝑖 ∩𝐴𝑖1:𝑘 |𝑘
.
Recall@𝑘 =1|B|
|B |∑︁𝑖=1
|𝐴𝑖 ∩𝐴𝑖1:𝑘 |min(𝑛𝑖 , 𝑘)
.

Knowledge-driven Site Selection via Urban Knowledge Graph Conference’17, July 2017, Washington, DC, USA
KFCM
cDon
ald's
Burger
King
Pizza H
ut
Starbuck
s
Luckin
ZL Hotp
ot
YGF Hotp
ot
Wed
ome
Baosf
Pastry
Gong C
ha
alitte
-tea
Bianlife
ng
7-Elev
en
ICBCCCB
BOCNike
Adidas
Li-Ning
Super 8
Hantin
g
99 In
nHom
e Inn
KFCMcDonald'sBurger King
Pizza HutStarbucks
LuckinZL Hotpot
YGF HotpotWedome
Baosf PastryGong Cha
alitte-teaBianlifeng
7-ElevenICBCCCBBOCNike
AdidasLi-NingSuper 8Hanting
99 InnHome Inn
0.2
0.0
0.2
0.4
0.6
0.8
1.0
(a) Pre-training output
KFCM
cDon
ald's
Burger
King
Pizza H
ut
Starbuck
s
Luckin
ZL Hotp
ot
YGF Hotp
ot
Wed
ome
Baosf
Pastry
Gong C
ha
alitte
-tea
Bianlife
ng
7-Elev
en
ICBCCCB
BOCNike
Adidas
Li-Ning
Super 8
Hantin
g
99 In
nHom
e Inn
KFCMcDonald'sBurger King
Pizza HutStarbucks
LuckinZL Hotpot
YGF HotpotWedome
Baosf PastryGong Cha
alitte-teaBianlifeng
7-ElevenICBCCCBBOCNike
AdidasLi-NingSuper 8Hanting
99 InnHome Inn
0.4
0.2
0.0
0.2
0.4
0.6
0.8
1.0
(b) Encoder output
Figure 11: Cosine distance visualization of different brands’ representations in Beijing.
KFCM
cDon
ald's
Burger
King
Pizza H
ut
Starbuck
s
Luckin
ZL Hotp
ot
YGF Hotp
ot
Wed
ome
Baosf
Pastry
Gong C
ha
alitte
-tea
Bianlife
ng
7-Elev
en
ICBCCCB
BOCNike
Adidas
Li-Ning
Super 8
Hantin
g
99 In
nHom
e Inn
KFCMcDonald'sBurger King
Pizza HutStarbucks
LuckinZL Hotpot
YGF HotpotWedome
Baosf PastryGong Cha
alitte-teaBianlifeng
7-ElevenICBCCCBBOCNike
AdidasLi-NingSuper 8Hanting
99 InnHome Inn
0.0
0.2
0.4
0.6
0.8
1.0
(a) Pre-training output
KFCM
cDon
ald's
Burger
King
Pizza H
ut
Starbuck
s
Luckin
ZL Hotp
ot
YGF Hotp
ot
Wed
ome
Baosf
Pastry
Gong C
ha
alitte
-tea
Bianlife
ng
7-Elev
en
ICBCCCB
BOCNike
Adidas
Li-Ning
Super 8
Hantin
g
99 In
nHom
e Inn
KFCMcDonald'sBurger King
Pizza HutStarbucks
LuckinZL Hotpot
YGF HotpotWedome
Baosf PastryGong Cha
alitte-teaBianlifeng
7-ElevenICBCCCBBOCNike
AdidasLi-NingSuper 8Hanting
99 InnHome Inn
0.0
0.2
0.4
0.6
0.8
1.0
(b) Encoder output
Figure 12: Cosine distance visualization of different brands’ representations in Shanghai.
• MAP@𝑘 (Mean Average Precision), which measures the rel-ative ranking quality of the top-k regions in 𝐴𝑖 .
MAP@𝑘 =1|B|
|B |∑︁𝑖=1
1min(𝑛𝑖 , 𝑘)
·𝑘∑︁𝑗=1
|𝐴𝑖 ∩𝐴𝑖1:𝑗 |𝑗
· 𝑟𝑒𝑙 (𝑎 𝑗 ),
where 𝑟𝑒𝑙 (𝑎 𝑗 ) follows the same definition above.
B.2 Brands v.s. Site Selection CriteriaIn Figure 11 and 12, we provide the complete results of cosine dis-tance visualization of all selected brands’ representations in Beijingand Shanghai, respectively. According to the results, the related-ness between brands are further refined by GNN based encoder inKnowSite, i.e., a strong correlation can be observed on Figure 11(b)and 12(b), which further validates the effectiveness of task-specificrepresentation learning for site selection.
B.3 UrbanKG Embedding VisualizationWe further provide the embedding visualization in Shanghai inFigure 13, and a similar clustering results with Figure 4 can also beobserved therein. Since the ontology semantics to various entitiesare quite clear, pre-trained embeddings are successfully separatedfrom different ontology groups.
60 40 20 0 20 40 60 8080
60
40
20
0
20
40
60BrandRegionBaCate_3Cate_2Cate_1SportsCompanyMedicalEdu.CarServiceShoppingAccomm.FoodOrg.
Figure 13: t-SNE of pre-trained entity embeddings of shang-hai’s UrbanKG (better viewed in color).