Youth Employment and human capital valuation of Nestlé fileimpact that companies have upon society,...
27
1 Youth Employment and human capital valuation of Nestlé May 2018 Samuel Vionnet Sustainability Expert [email protected] www.valuingnature.ch CH +41 (0)76 372 90 27 GT +502 5012 3107 Public Version
Transcript of Youth Employment and human capital valuation of Nestlé fileimpact that companies have upon society,...

1
Youth Employment and human capital valuation of Nestlé
May 2018
Samuel Vionnet
Sustainability Expert
www.valuingnature.ch
CH +41 (0)76 372 90 27
GT +502 5012 3107
Public Version

2
Note from Nestlé about this study
Nestlé launched its Global Youth Initiative in 2017. This sets out to create 10 million opportunities for youngpeople in the next 10 years. This study explores how we might measure the impact of this initiative and calculatethe value created by the initiative for Nestlé and also for society.
Whilst there are increasing examples of companies calculating their impact upon society, there are as yet few examples of calculating the business value for the company. This report presents a first attempt.
We are therefore making this report public to raise awareness of the possibilities to measure and value the impact that companies have upon society, and to stimulate debate upon methodologies and data sources. For this public version of the report we have replaced the actual figures with indicative figures. These indicate the same magnitude of value created, but maintain a level of confidentiality of the actual base data. We have donethis to concentrate the debate upon the methodology and assumptions.
We particularly welcome scrutiny of the methods and assumptions we have taken in order to strengthen the approach for future iterations.
Christian Frutiger, Head, Public Affairs
Duncan Pollard, Head, Sustainability & Stakeholders Engagement

3
Table of content
Objective
Nestlé impact pathways
Model selected details and results
Overall results
Discussion pointsData/methodology development
Key data prioritiesInsights
4
5
9
20
2223-242526-27

4
Objective
Measure the value to Nestlé and to the society of the Global Youth Initiative.
5
Nestlé impact pathways

6
Data situation
Some high level data
?We can access qualitative description in some cases
Conclusion:1. We have to use a lot of assumptions and secondary data2. We have to improve on the data collection at Nestlé

7
Impact pathway – Business value
Apprenticeship/youth employment
Entrepreneurship
Partnership
Labour productivity
Reputation
Added-value (short term)
Internally generated goodwill
Social capital
Talent acquisition/skills
Added-value (long term)
Economic/financial valuefor Nestlé
Agripreneur Secured supply
Increase sales
High retention
HR
co
sts
and
p
rod
uct
ivit
y
Sou
rcin
g co
sts
and
Sa
les
Rep
uta
tio
n/
goo
dw
illFinancial
investment
Marketing
Stakeholders engagement
Human resources

8
Impact pathway – Societal value
Employment
Personal self-confidence
Taxes
Net increase income (in the future)
(Higher satisfaction/sense of purpose)
Skills
Reduced public costs
QALY/DALY
Financial investment
Marketing
Stakeholders engagement
Human resources Apprenticeship/
youth employment
Entrepreneurship
Partnership
Agripreneur

9
Value for Nestlé - SummaryData and Methodology
Description Data Quality Methodology
Agripreneur 2% reduced cost over sourcing costs. NPV 5yrs 8%.
Farmer Training Value is 10% of agripreneur, related to training time.
Entrepreneur CHF2000 av sales. OP/sales = 15%. NPV 5Yrs 8%
Apprenticeship Hiring costs Retention rate 50% apprentices stay, 20% trainees stay. Nestlé productivity . NPV duration of appr/traineeship
Traineeship
Employee (fixed) Not calculated (too sensitive to assess). May beassessed through synergy benefit between more senior and young employees (gain in efficiency).
Employee (temp)
Reputation Internally Generated Goodwill* allocated
* Difference between Mkt Cap and Book Value. Net change of position from FY16 to FY17 was accounted for.
We assumed 20% is due to Human Capital. GYI is 2.7% of annual report, so we used (20% x 2.7%)
Note: Indicative Values Only

10
Value for Society - SummaryData and Methodology
Description Data Quality Methodology
Agripreneur Income 40% Tax rate 10%. NPV 20 yrs 8%
Farmer Training 10% of agripreneur value.
Entrepreneur CHF 4000 (Nestlé MX data) Tax rate 10%. NPV 5 yrs 8%
Apprenticeship Educational value (Income 9.7%* /yr) with NPV 20 yrs8% additionally to income over duration of 24 months. Tax rate according to country.
Traineeship Income over duration of 6 months. Internship does not contribute to educational value but decreases by 6 months the time to find a job.
Employee (fixed) Income and 2.32%** additional income due to experience. NPV 5yrs (fixed), 1yr (temp), 8% discount rate. Tax rate according to country.
Employee (temp)
* Global Average increase per year of education (World Bank). This rate was adapted per region.
** two times the global inflation rate.
Note: Indicative Values Only

11
Model selected details and results

12
Agripreneurs – Value to society and Nestle’s value
Human capital = Net increase income
• 40% net increase income (based on a couple of case studies)• Net income (taxes deducted)
Nestlé value = Benefit (reduced sourcing costs) – Costs (training/coaching costs)
• Costs reduction might includes reduced turnover, less product rejection, lower cost of transaction, etc)
• Costs reduction is estimated at 2% of average sourcing cost per farmer (based on COGS and farmers’ number) based on twice the average sourcing volume cost (due to productivity gain)
• Cost of training/coaching is estimated at 5 days of training, at 30CHF/h of training.
• Additional costs should be considered (e.g. material and other support, overhead, etc)

13
Apprentices – Value to society
Human capital = Income (short term) + Education benefit (long term)
+ Time to employment• 50% of country’s median income (duration 2 years)
• Average income of the 40% poorest (Q1/Q2)• Net income (taxes deducted)• Occupation rate (50%)• Accounting only for the share of unemployed youth
(the others would get a similar position)
• Education value: applies to apprenticeship and not to traineeship/internship• Net increase income (ranges from 7-10% per year of education) in the future• 20 years net present value/8% discount rate
• Time to employment: applies only to traineeship/internship• Reduction of time to find a job (less unemployment period): 6 months
• Income accounted for is the average of the 40% the poorest (average Q1/Q2)• Net income (taxes deducted)

14
Apprentices – Value to societyCALCULATION EXAMPLE
EXAMPLE - Human capital for apprentices, for Italy, in CHF (in real CHF and not DALYs):
Italy has an average low income of 16’940 CHF/capita (average Q1 and Q2), leading to an average income for apprentice of 8’470 CHF/capita (estimated at half the low income). Youth unemployment is 36.6% and benefit from schooling is equivalent to 10% additional income per year of school. Average tax rate is 32%. Average duration of an apprenticeship is 2 years and they work at 50% at Nestlé. The calculation of human capital value is:
Income component: 8’470 * (100-32% “tax rate”) * 36.6% “unemployment” * 2 years “duration” * 50% “occupation ratio” = 2’108 USD
Education component: 30’613 * (100-32% “tax rate”) * 10% “value of education” * 2 years “duration” * 50% “occupation ratio” * 10.6 “NPV ratio” = 22'065 USD
Total human capital value = 2’108 + 22’065= 24'173 USD

15
Human capital – Results summaryResults based on impact (DALYs)
-
10'000
20'000
30'000
40'000
50'000
60'000
Austria
Belgiu
m
Bulgaria
France
Germany
Greece
Hungary
Italy
Netherla
nds
Poland
Portugal
Romania
Spain
United K
ingdom
Russia
n Feder
atio
n
Ukrain
eIsr
ael
Turkey
Brazil
Mexic
o
United St
ates
Switzerla
nd
Switzerla
nd HQ
China
CH
F/p
erso
n-y
ear
Apprenticees (CHF/pers) Interns (CHF/pers) Fixed employee (CHF/pers) Temporary employee (CHF/pers)
Note: Indicative Values Only
16
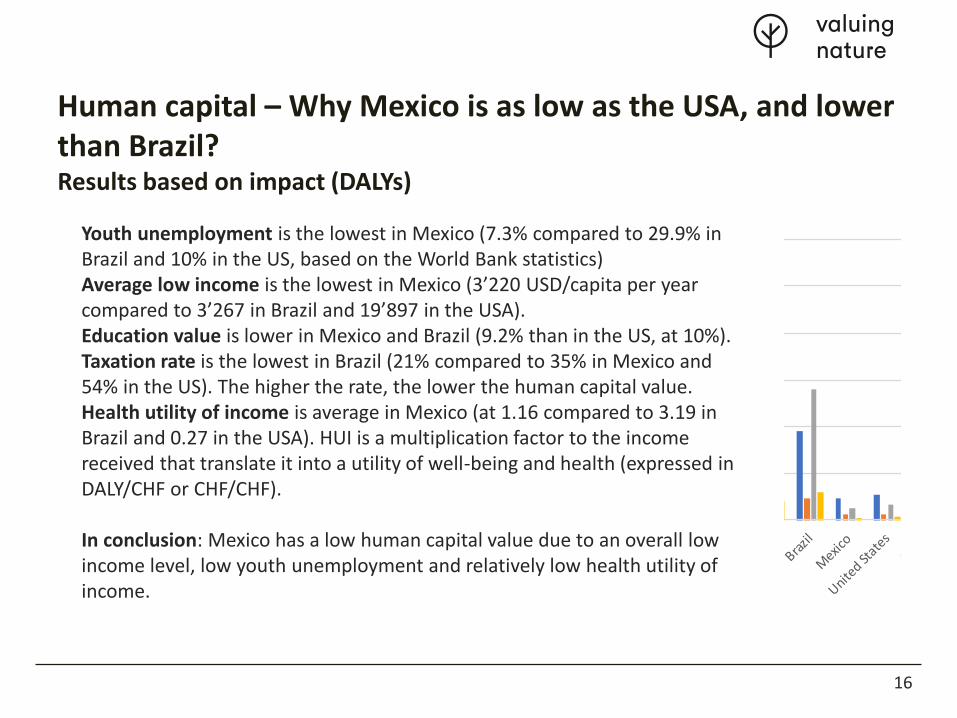
Human capital – Why Mexico is as low as the USA, and lower than Brazil?Results based on impact (DALYs)
-
10'000
20'000
30'000
40'000
50'000
60'000
Austria
Belgiu
m
Bulgaria
France
Germany
Greece
Hungary
Italy
Netherla
nds
Poland
Portugal
Romania
Spain
United K
ingdom
Russia
n Feder
atio
n
Ukrain
eIsr
ael
Turkey
Brazil
Mexic
o
United St
ates
China
CH
F/p
erso
n-y
ear
Apprenticees (CHF/pers) Interns (CHF/pers) Fixed employee (CHF/pers) Temporary employee (CHF/pers)
Youth unemployment is the lowest in Mexico (7.3% compared to 29.9% in Brazil and 10% in the US, based on the World Bank statistics)Average low income is the lowest in Mexico (3’220 USD/capita per year compared to 3’267 in Brazil and 19’897 in the USA).Education value is lower in Mexico and Brazil (9.2% than in the US, at 10%).Taxation rate is the lowest in Brazil (21% compared to 35% in Mexico and 54% in the US). The higher the rate, the lower the human capital value.Health utility of income is average in Mexico (at 1.16 compared to 3.19 in Brazil and 0.27 in the USA). HUI is a multiplication factor to the income received that translate it into a utility of well-being and health (expressed in DALY/CHF or CHF/CHF).
In conclusion: Mexico has a low human capital value due to an overall low income level, low youth unemployment and relatively low health utility of income.

17
Apprentices – Value to Nestlé
Value to Nestlé = Benefit (reduced hiring costs + tenure benefit + productivity)- Costs (hiring costs + coaching + salary)
• Hiring costs avoided: 6’000 CHF/apprentice or trainee/intern (adjusted using PPP values, country of reference used is CH)
• Tenure: 3x longer for 50% of apprentices (retention rate) = 6’000 CHF
• Productivity: break-even calculation or replacement cost method
• Hiring costs: 2’000 CHF/apprentice and 3’000 CHF for trainees/interns.
• Coaching: 17.5% of the time of a standard employee (country’s median income)
• Salary: 50% of country’s low income, average of 40% poorest income. Average duration of 2 years.
Reputation accounted for separately (based on IGG) and synergy not accounted for at the moment (synergy between young employees and older ones focusing on higher value tasks thanks to the formers)
Indicative Values Only

18
Nestlé Value – Apprenticeship / Switzerland
Value to Nestlé = Benefit (reduced hiring costs + tenure benefit + productivity)- Costs (hiring costs + coaching + income)
Benefit Costs
Hiring costs
Tenure
Productivity(replacement cost method)
Coaching
Salary
6’000
6’000
30‘000
-
-
(2’000)
-
-
(22’000)
(20’000)
46‘000 (44’000)
Net value for Nestlé = 2’000 CHF
Benefit Costs
6’000
6’000
66‘000
-
-
(2’000)
-
-
(46’000)
(36’000)
82‘000 (84’000)
Net value for Nestlé = -2‘000 CHF
With primary dataCountries model
Reputation
Synergies
4’000
?
-
-
4’000
?
-
-
Note: Indicative Values Only

19
Nestlé Value – Apprenticeship(replacement cost method for productivity. Excluding reputation)
-40'000
-35'000
-30'000
-25'000
-20'000
-15'000
-10'000
-5'000
-
5'000
10'000
CH
F/ap
pre
nti
ce
Net value without productivity Net value with productivity
-
1'000
2'000
3'000
4'000
5'000
6'000
Au
stri
a
Bel
giu
m
Bu
lga
ria
Fra
nce
Ge
rma
ny
Gre
ece
Hu
ng
ary
Ita
ly
Ne
the
rlan
ds
Po
lan
d
Po
rtu
gal
Ro
ma
nia
Sp
ain
Un
ite
d K
ing
dom
Ru
ssia
n F
ed
erat
ion
Ukr
ain
e
Isra
el
Tu
rke
y
Bra
zil
Me
xico
Un
ite
d S
tate
s
Sw
itze
rlan
d
Sw
itze
rlan
d H
Q
Ch
ina
CH
F/ap
pre
nti
ce
Net value without productivity Net value with productivity
Note: Indicative Values Only

20
Overall results

21
Overall results
Note: Indicative Values Only

22
Discussion points

23
Data/Methodology development
• The methodology addressing societal value is more mature than the one addressing Nestlé value.
• For the value to Nestlé, the reputational value is the biggest challenge to address. It is currently based on the internally generated goodwill value, allocated roughly to the youth initiative. This allocation is challenging and might be avoided if a bottom-up model can be put in place, addressing identified and specific impact pathways arising from the youth initiative.
• The value of young employees remains also a challenge to be addressed. It is currently not quantified, but it is expected that young employees allows to create a synergy with more senior employees by the task distribution optimization. Young employees allow more senior ones to be more efficient.
• Beyond a few other smaller methodological challenges, the biggest gap remains the access to data for all activities. The quantification of outputs (e.g. nb of agripreneurs, nb of apprentices, etc) is a useful information, but does not allow to quantify the value (outcome or impact) of such output. An important effort of data collection is required from Nestlé to support this type of methodological approach in the future.

24
Data/Methodology developmentNote on agripreneurs
• The current valuation method (Nestlé value) is based on short term changes to costs of purchasing. However, collecting data on those aspects is very challenging, as well as understanding the causation
• An alternative valuation discussed could consider the long term value of agripreneurs and farmers training. This long term value translates into business continuity and risk avoidance.
• In order to quantify it, specific case studies need to be assessed (specific to commodity, location, farms size, etc). Stories and existing knowledge need to be leveraged, with qualitative and quantitative data whenever possible. Analysingpast events will be a source of data too.
• The reputational side of it needs to be accounted for as well, as investing in agripreneurs/farmers training is a form of insurance policy.
• Further developments will be needed to develop this methodology, combining the knowledge of Nestlé with the latest developments in impact valuation.

25
Key data priorities
Below is a high level prioritization of key data to collect at short term to improve the model, based on what I think is feasible and available. Further detailed data could be collected at longer term and requirement more resources.
• Agripreneurs: risk avoidance and business disruptions stories (but also license to operate, avoided investment costs, etc), for specific context and supply chains. Comparison with business as usual cases can be done as well (what happened to other companies/supply chains).
• Farmers’ training: data or stories on conditions improvements of farmers linked to the training provided. More detail on farmers reached, topic and length of training.
• Entrepreneurs: business models descriptions and performance results (sales, costs, profit and its distribution, etc) would be required, as for the case of Nescafé Mexico.
• Apprentices, trainees, inters: real salaries data, productivity assessment and other HR costs (hiring costs). Stories on how this activity helped the reputation of Nestlé (business environment, license to operate, advantages provided by the government, etc).
• Young employees: real salaries data, productivity measures and synergies with more senior employees.

26
Insights (1)
• Investments prioritization and target setting for the youth initiative.• The results per country for the apprenticeships/internships and young employees
shows great variabilities. Higher societal and Nestlé value can be obtained for positions in poorer countries, countries with higher youth unemployment rates, and countries with higher inequalities. I recommend to consider using this insight to prioritize the activities/investments of the youth initiative.
• Optimise projects and activities• Key drivers to the value for the society and for Nestlé were identified (e.g. retention,
productivity, hiring costs, income, etc) and those can be prioritized and optimized to deliver higher value, both for Nestlé and the society. For instance, hiring costs of interns/trainees is relatively high and could be lowered by partnerships with universities or engagement events (on social media or in real events). Another example is the coaching that is required which can be optimized by creating an online academy which lower the cost per apprentice/trainee instead of repeating the same training with employees. This would also increase the educational benefit of such positions.

27
Insights (2)
• Measuring shared value and reaching net positive impact• The youth initiative needs to be considered within the overall activities of Nestlé and
its created shared value. The impact valuation results help understand the contribution of the youth initiative to the overall impact of Nestlé, and how its (social) ROI compares to other investments of Nestlé. It can potentially support strategic priorities and budget allocation.
• Communicate impact at corporate or brand level• Communication to and understanding of external stakeholders is crucial to maintain
the reputation of Nestlé and to improve its business environment. Impact valuation results is based on a relatively recently developed method/approach and has not been communicated often by the private sector, although cases of external communication are rapidly increasing (LafargeHolcim, Kering, BASF, Samsung, Novartis, etc).
• Traditional reporting will integrate more and more impact valuation results as they are relatively easy to understand for non-experts (monetary units), although this reporting is not mainstream and further developments are required.
• Using impact valuation for communication to KOL, sustainability experts, BtoB or even brand marketing can be done using a combined storytelling narrative and key figures from the impact valuation results. Further explorations on how to leverage those results to engage with external stakeholders would be required.