Youth Crime and Education Expansionftp.iza.org/dp6582.pdf · IZA Discussion Paper No. 6582 May 2012...
37
DISCUSSION PAPER SERIES Forschungsinstitut zur Zukunft der Arbeit Institute for the Study of Labor Youth Crime and Education Expansion IZA DP No. 6582 May 2012 Stephen Machin Olivier Marie Sunčica Vujić
Transcript of Youth Crime and Education Expansionftp.iza.org/dp6582.pdf · IZA Discussion Paper No. 6582 May 2012...

DI
SC
US
SI
ON
P
AP
ER
S
ER
IE
S
Forschungsinstitut zur Zukunft der ArbeitInstitute for the Study of Labor
Youth Crime and Education Expansion
IZA DP No. 6582
May 2012
Stephen MachinOlivier MarieSunčica Vujić

Youth Crime and Education Expansion
Stephen Machin University College London,
CEP, London School of Economics and IZA
Olivier Marie ROA, Maastricht University
and CEP, London School of Economics
Sunčica Vujić University of Bath
Discussion Paper No. 6582 May 2012
IZA
P.O. Box 7240 53072 Bonn
Germany
Phone: +49-228-3894-0 Fax: +49-228-3894-180
E-mail: [email protected]
Any opinions expressed here are those of the author(s) and not those of IZA. Research published in this series may include views on policy, but the institute itself takes no institutional policy positions. The Institute for the Study of Labor (IZA) in Bonn is a local and virtual international research center and a place of communication between science, politics and business. IZA is an independent nonprofit organization supported by Deutsche Post Foundation. The center is associated with the University of Bonn and offers a stimulating research environment through its international network, workshops and conferences, data service, project support, research visits and doctoral program. IZA engages in (i) original and internationally competitive research in all fields of labor economics, (ii) development of policy concepts, and (iii) dissemination of research results and concepts to the interested public. IZA Discussion Papers often represent preliminary work and are circulated to encourage discussion. Citation of such a paper should account for its provisional character. A revised version may be available directly from the author.

IZA Discussion Paper No. 6582 May 2012
ABSTRACT
Youth Crime and Education Expansion* We present new evidence on the causal impact of education on crime, by considering a large expansion of the UK post-compulsory education system that occurred in the late 1980s and early 1990s. The education expansion raised education levels across the whole education distribution and, in particular for our analysis, at the bottom end enabling us to develop an instrumental variable strategy to study the crime-education relationship. At the same time as the education expansion, youth crime fell, revealing a significant cross-cohort relationship between crime and education. The causal crime reducing effect of education is estimated to be negative and significant, and considerably bigger in (absolute) magnitude than ordinary least squares estimates. The education boost also significantly impacted other productivity related economic variables (qualification attainment and wages), demonstrating that the incapacitation effect of additional time spent in school is not the sole driver of the results. JEL Classification: I2, K42 Keywords: youth crime, education expansion Corresponding author: Sunčica Vujić Department of Economics University of Bath Claverton Down Bath, BA2 7AY United Kingdom E-mail: [email protected]
* We would like to thank the Editor and two anonymous referees for a number of useful comments and suggestions. Marie would like to thank the Executive Research Agency of the European Union for funding under the Marie Curie IEF grant number 252572.

1
1. Introduction A small, but growing, economic literature has presented empirical evidence showing a
negative causal impact of education on crime. For the United States, Lochner and
Moretti (2004) use variations in compulsory school leaving age laws across states to
identify the impact of education on crime, and Machin, Marie and Vujić (2011) exploit
the raising of the school leaving age across cohorts in England and Wales to do the
same. Both studies uncover a robust and sizable crime reducing effect of education.1
In this paper, we also consider the causal impact of education on crime, but
adopt a different route to identification. We present new evidence on the causal
relationship, by studying what happened to crime in a period when the UK post-
compulsory education system was very rapidly expanded. This large expansion
occurred in the late 1980s and early 1990s and significantly raised education levels
across the whole education distribution, thereby considerably reducing the number of
individuals with low education levels in birth cohorts exposed to the expansion. Our
approach is to think of these cohorts as a ‘treated’ set of individuals whose education
was raised and we can compare their education and crime outcomes with a ‘control’
set of cohorts who did not benefit from the expansion.
The education expansion we consider has been studied in other areas. Blanden
and Machin’s (2004) study focuses on the expansion as a key driver of falling
intergenerational mobility. Devereux and Fan (2011) have also looked at wage effects
associated with the education expansion, showing that on average it caused men and
women to gain respectively a year or slightly more than a year of education and that
this significantly raised wages. By considering the education expansion as an
exogenous increase in educational attainment, they present causal estimates of the
1 See also Lochner’s (2011) review of empirical work on the non-wage benefits of education where part of his focus is to review evidence on the crime-education relationship.

2
wage return to an extra year of schooling of about six percent for both men and
women.
To preview our results, we also report significant improvements in education
levels for cohorts affected by the education expansion. Given our focus on crime, it is
important that education improvements occurred at the bottom end of the education
distribution, as this is where its impact is most likely to affect offending behaviour. We
spend some time in our empirical analysis showing this to be the case. We then
consider what happened to crime for the treated cohorts relative to the control cohorts
and we show evidence that youth crime fell significantly as educational attainment
rose.
We present causal estimates in an instrumental variable setting, where a 1
percent increase in the proportion of male students reduces male youth crime by
around 1.9 percent and a 1 percent increase in the proportion of men staying on at
school after the compulsory school leaving age reduces male youth crime by around
1.7 percent. Whilst going in the same direction, results for women are smaller with
youth crime reductions of somewhere between 1.1 and 1.3 percent. For young men, we
also find that education causally reduces both property and violent crimes.
Finally, we discuss mechanisms underpinning the crime-education relation and
present evidence that the education boost from expansion also significantly impacted
other productivity related economic variables (qualification attainment and wages). We
interpret this as showing that keeping people in the education system (incapacitation)
is not the sole driver of the results, because the education boost is also associated with
better, productivity-raising, economic outcomes.
The rest of the paper is organised as follows. Section 2 offers a brief discussion
of the relevant literature, with an emphasis on the mechanisms behind the education-

3
crime relationship and their implications for our empirical analysis. Section 3 describes
the nature of the education expansion and the data sources we use. Section 4 first
shows the impact of the education expansion on the education distribution, before
moving on to report results from a causal analysis of the crime and education
relationship. In Section 5, we consider potential mechanisms underpinning the causal
crime-education relationship by also looking at other economic effects of the education
expansion. Section 6 concludes.
2. Education and Crime: Mechanisms and Implications
Mechanisms
There are number of theoretical reasons why education can impact on crime. Existing
literature highlights (at least) three main channels through which schooling might
affect criminal participation: income effects, patience or risk aversion, and time
availability. We consider each of these three mechanisms in turn:
(i) Income effects operate through education reducing crime by increasing the returns
to legitimate work and/or by raising the opportunity costs of illegal behaviour
(Lochner, 2004; Lochner and Moretti, 2004; Hjalmarsson, 2008). Empirical work
connecting crime to low wages broadly supports this notion (Gould et al., 2002;
Grogger, 1998; Machin and Meghir, 2004; Mocan and Unel, 2011). However, there is
some counter-evidence that education can also increase the earnings from crime for
some crime types as certain skills acquired in school can be used when engaging in
criminal activities.2
2 Levitt and Lochner (2001) report that males with higher scores on mechanical information tests had increased offence rates and Lochner (2004) reports some cross-cohort evidence that increases in average education are associated with higher white-collar arrest rates (although this finding is not statistically significant at conventional levels).

4
(ii) Patience and risk aversion are also mechanisms through which education may
impact on crime. Individuals with a lot of patience tend to have low discount rates and
therefore value future earnings more highly as compared to individuals with higher
discount rates. Indeed, Oreopoulos (2007) presents evidence that young people who
drop out of school tend to be myopic and are more focussed on immediate costs of
schooling, rather than on future gains from an additional year of schooling. Thus, he
argues that dropouts are more predisposed to risky behaviour. Similarly, education can
increase patience, thereby reducing the discount rate of future earnings, and in turn
lowering the propensity to commit crimes. Education may also increase risk aversion
and this can increase the weight individuals perceive to be attached to a possible
punishment, which consequently reduces crime.
(iii) Time spent in education can also have an impact. A ‘self-incapacitation’ effect
was documented by Tauchen et al. (1994) who found time spent at school (and work)
during a year to be negatively correlated with the probability of arrest that year.
Hjalmarsson (2008) looked at the opposite relationship, studying the impact of being
arrested and incarcerated before finishing school on the probability of graduating high
school. Her results suggest that the number of times being caught committing crime
and the amount of time spent in prison both greatly increase the likelihood of
becoming a high school dropout.
These are likely to be endogenous decisions, hence Jacob and Lefgren (2003)
instrument days off school with exogenous teacher training days. Luallen (2006) uses
unexpected school closings driven by teacher strikes as an instrument for student
absence from school. Both of these papers report there to be important incapacitation
effects of additional time spent in education on criminal participation. However, they
also report that violent offences increase while school is in session, a finding that is

5
attributed to a concentration effect.3 Anderson (2009) also reports evidence for the
United States, based on minimum high school dropout ages that vary across states, that
keeping youth in school decreases arrest rates.
Implications After obtaining estimates of the impact of education expansion on crime, an
issue we will face is to interpret them in view of these potential mechanisms that
underpin the crime-education relation. This is important here as the outcome variable
we will focus on measures convictions of young individuals aged 16 to 21 and the
education expansion we study substantially increased the educational participation of
this age group.4 Our estimates will therefore have a component that could be attributed
to the self-incapacitation effect due to certain cohorts of youths spending more time at
school. It is hard to completely rule out an incapacitation effect, but we will present
evidence that try to establish that this may not be the sole explanationof any crime
reductions that result from education expansion.
A first attempt to consider this comes about because of differences between our
approach and that of the other existing causal studies. Lochner and Moretti (2004) for
the US and Machin, Marie, and Vujić (2011) – MMV (2011) henceforth – for England
and Wales exploit changes in compulsory school leaving age laws to identify the
causal impact of an extra year of schooling on criminal participation. The cohort level
approaches of these papers is methodologically akin to the one we will adopt, but both
studies are able to mostly rule out any direct self-incapacitation effect of education on
crime. They do so by excluding the age group affected by the extra school year 3 The term concentration effect refers to the presence of a large number of youths in an educational establishment, which may result in an increased probability of violent encounters. 4 Whilst we want to study youth crime, the chosen age group is in part necessitated by data limitations. More specifically, the Offenders Index Database (described below) is only available until 2002 and we therefore chose to limit our analysis to the age group 16 to 21 in order to have a relatively balanced panel and enough cohorts around the ones treated by the policy. See the Data Appendix for details on the structure of the OID.

6
brought about by the policies studied from the arrest or conviction data used. The
findings from these papers are similar and point to (approximately) a 1 percent drop in
male property crime for every 1 percent of a male cohort obtaining some educational
qualification as a result of the reforms. Both studies find no significant effect on
female offending rates. The impact on male violent crime is less conclusive and while
Lochner and Moretti (2004) obtain relatively large (albeit imprecise) estimates, MMV
(2011) do not find a significant effect of education on this outcome.
Thus, a first simple way to attempt and disentangle which mechanism is
driving our results will be to benchmark our findings to those of MMV (2011). As
their results are ‘net’ of self-incapacitation effects, we might expect to see a stronger
effect on male property convictions in our context of studying youth crime and
tentatively attribute some of the difference directly to the extra time spent in school.
Perhaps more relevant will be the interpretation of a potential education effect on male
violent offences. Economic theory does not give much support to the existence of an
income effect mechanism for this type of criminal behaviour and this is why MMV
(2011) argued that it was not surprising they found no impact of education on violent
offending. There is, however, no reason to assume that violent offending is not
affected via the self-incapacitation channel for youths.5 We could therefore also
tentatively interpret a connection between young male violent convictions and
education as stemming from this mechanism.
A second possible route to investigate the underlying mechanisms of an
education impact on crime is to consider whether the education boost from expansion
impacted other productivity related outcomes. If we uncover evidence of this, then we
5 For example, Sabates (2010) and Sabates and Feinstein (2008) found evidence of reduced convictions for both ‘antisocial behaviour’ and burglary when studying a localised post-compulsory schooling incentivization scheme in a British context. These papers do not however investigate which potential mechanisms are driving these results.

7
can plausibly rule out that the incapacitation effect is the sole explanation of a crime
reducing effect of education. For example, if part of the changes in youth crime can be
attributed to an income impact of education expansion, this would be reflected in
differences in productivity related measures such as higher qualification attainment,
wages, and unemployment across treated and non-treated cohorts.
We will therefore also estimate the causal impact of education increases
induced by the expansion on these economic outcomes. This has similarities to the
analysis of wage returns to education expansion carried out by Devereux and Fan
(2011) who report significant wage returns associated with education expansion,
though they focus on older individuals (aged 25 to 50) than we will do, and use a
smaller number of years of the Labour Force Survey data (see the discussion below
and in the Data Appendix).
3. Expansion of the UK Post-Compulsory Education System The post-compulsory education system in the UK has hugely expanded since the
1960s. Figure 1 shows two post-compulsory education participation series between
1960 and 2002: (a) the rate of staying on beyond the compulsory school leaving age,
and (b) the higher education age participation index (API).6 The Figure shows
increases in both series from 1960 onwards.
A closer look at Figure 1 reveals that the staying on series appears to have been
on a steadily increasing path (although is subject to some cyclical variations) from the
start of the series through to the mid-1980s. However, from the late 1980s/early 1990s
there is a rapidly occurring step-change as staying on rates rise much faster, especially
between 1988 and 1992, before plateauing out in the mid 1990s.
6 The API is the proportion of individuals aged under 21 who enter higher education each year.

8
The increase in university participation is also very rapid, as shown by the API.
There was a sharp expansion in the 1960s, when the age participation index doubled
from 6 to 14 percent. It then rose marginally from this level through until the late
1980s, after which it grew even more rapidly than the 1960s change. By 2001 it had
reached 35 percent, rising up from under 20 percent at the start of the 1990s.
Figure 1 makes it clear that a very rapid education expansion took place in the
late 1980s/early 1990s in the UK, and that it occurred at lower and higher parts of the
education distribution. The fact that the staying on rate rose, and hence there were
fewer people leaving school at the compulsory school leaving age of 16, is important
and we will probe the nature and scale of this change in more detail with available
micro-data.
It is also worth reflecting on why the expansion of post-compulsory schooling
took place. Blanden and Machin (2004) emphasise two main factors. For the expansion
of the post-compulsory sector through increased staying on rates, they highlight the
change in the school leaving examination system that took place in 1988, with the
introduction of the General Certificate of Secondary Education (GCSE) and the
consequent improvement in examination results.7 For higher education (HE)
participation, they discuss increased university enrolment in the light of changes in
admissions and in financing, together with the perception of increased wage returns to
HE facilitated by very fast rises in the wage returns to a degree that occurred
throughout the 1980s, as a key part of a general rise in wage inequality (see, inter alia,
Machin and Vignoles, 2005).
7 The GCSE examinations are taken at the end of the last year of compulsory schooling (at age 16). Therefore the first affected cohort by this change was the cohort of students born in 1972. This will be important to keep in mind when defining treated cohorts for our identification below.

9
We must finally note that there is no evidence, to our knowledge, that the
political decision to expand educational attainment was motivated as a response to
particular trends in youth crime rates. It was also not specifically combined with other
crime fighting policies aimed at certain age groups or cohorts, thus making it a good
potential instrument to study the causal impact of education on offending.
Data Description
To study the impact of this education expansion on educational attainment and
crime there are a number of pertinent data issues that need to be discussed. The key
issue we face is that no single individual-level data source exists to study crime and
education effects working through this policy. We thus need some means of matching
crime and education data from different sources.
To do so we match at cohort level convictions data for England and Wales
from the Offenders Index Database (OID) with education data from the Labour Force
Survey (LFS). The OID contains criminal history data for offenders convicted of
standard list offences from 1963 and up to 2002.8 The data (which are described in
more detail in the Data Appendix) are derived from the court appearances system and
are updated quarterly. The Index was created purely for research and statistical
analysis. Its main purpose is to provide full criminal history data on a randomly
selected sample of offenders. We have access to OID data on anonymous samples for
offenders sentenced during four weeks each year. We also have the entire pre- and
post-court appearance history of these individuals. However, there is no information on
a defendant’s education level in the OID and so the data needs to be aggregated and
matched to education data from other sources. A big advantage (certainly relative to
8Standard list offences are all indictable or triable offences, plus a few of the more serious summary offences.

10
recorded offences data) is that some demographic characteristics are available in the
OID, notably age and gender.
We therefore calculated offending rates (per 10,000 population) using Office
for National Statistics (ONS) population data by birth cohort and year, separately for
men and women. In doing so, criminal offences were also broadly categorised as
property crimes (burglary and theft and handling of stolen goods) and violent crimes
(violence against the person and robbery). These offending rates can be matched to
education data from other micro-data sources where education measures can be
collapsed into birth cohort by year and gender cells.
We constructed education measures for the same birth cohorts by year and
gender cells from the LFS. The Data Appendix describes more fully how we matched
the OID and the LFS data for the main analysis in this paper. Our focus is on youth
crime and so our sample consists of birth cohorts aged 16 to 21 born between 1962 and
1982 from OID and LFS data across the 1978 to 2002 time period.9 This ensures the
panel of cohorts is relatively well balanced, especially around the years of the policy
intervention (see the Data Appendix for more details).
We focus upon two education measures:
i) the proportion of 16 to 21 year-olds in full time education;
ii) the proportion of 16 to 21 year-olds who stayed on after the compulsory school
leaving age (of 16).
We look at the relationship between youth crime and these education measures,
using the education expansion as an exogenous shock that we can exploit in order to
identify the causal impact of education on youth crime. For this to be a legitimate
9 In the early years of the LFS, the survey was biannual (in 1975, 1977, 1979, 1981 and 1983), after which it became annual. Therefore, we imputed values for missing years by interpolation (see the Data Appendix).
11
exercise, we need to show that the expansion which, as we argued above, was driven
by the reform of the school leaving exams (the move to the GCSE system) and a
subsequent rise in higher education participation, raised the education measures that
we look at.
Figure 2 shows the cross-cohort evolution of the two education measures
defined above. The upper Figure shows the proportion of the cohort still in full-time
education and the lower Figure shows the proportion staying on after the compulsory
school leaving age (of 16). In each of these, the dotted line is for women and the solid
line for men. A very clear pattern is present for both measures. For the 1962 to 1971
birth cohorts the education measures slowly rise (more so for women than men). The
next four birth cohorts (1972 to 1975) show very rapid increases. The 1972 birth
cohort was the first to take the GCSE exams in 1988.10 Thereafter, for cohorts born in
1976 and later, the education measures plateau out at a higher level.
Thus, it seems that the education expansion occurred very strongly for the 1972
to 1975 birth cohorts. Indeed, Blanden and Machin (2004) and Devereux and Fan
(2011) show that this increase also extended to higher education participation once
these cohorts became old enough (see also the earlier discussion of Figure 1).
Our interest is in whether the expansion impacted youth crime. This is
considered in Figure 3, which shows OID conviction rates by gender (measured as
convictions per 10,000 men or women) for the 1962 to 1982 birth cohorts. The solid
line shows that male convictions rose for the 1962 to 1971 cohorts, but fell very
10 The increases in education illustrated in Figure 2 may have already begun to slightly accelerate for older male cohorts born in 1970 and 1971. Indeed, Devereux and Fan (2011) include these two birth cohorts in their IV strategy. However, closer inspection of Figure 2 does reveal that, as expected, most of the policy impact seems to be concentrated on those turning 16 in 1988 or after when the new examination system was officially implemented. We therefore consider cohorts born between 1972 and 1975 as the treated ones throughout our analysis. However, if we used the Devereux-Fan definition and included 1970 and 1971 cohorts into the IV strategy, this produced very similar IV estimates that were never statistically different than for our preferred specifications presented here. These are available from the authors upon request.

12
sharply for the education expansion cohorts, and fell more slowly after that. The faster
fall for the 1972 to 1975 cohorts is suggestive of a crime fall happening because of the
expansion. For women, as shown by the dotted line, the conviction rates are noisier
(owing to there being far fewer female convictions), but a relatively similar pattern
emerges.
For men, we have big enough sample sizes to also break down convictions in
those for property and violent crimes. This is done in Figure 4. The sharp reduction in
conviction rates is seen for both crime types. Their evolutions are slightly different in
that violent convictions seem to rise again after the education expansion period but,
based on the descriptive analysis, the notion that education increased rapidly and that
convictions fell at the same time seems to be the case. In the next Section of the paper,
we model this more formally, and use the variation in education induced by the
expansion to present estimates of the causal impact of education on youth crime.
4. Statistical Estimates of the Crime-Education Relationship
Reduced and Structural Forms
We begin our statistical analysis by considering education and crime reduced form
models. Formally, these can be represented as follows for each age, subscript a (16 to
21), and year, subscript t (1982 to 2002), cells:
atat3jat2j
J
1j
jat1jat10at υZ)AGECOH(EEααED +++++= ∑
=
ϕϕϕ (1)
atat3jat2j
J
1j
jat1jat10at ωZ)AGEλCOH(λEEββC +++++= ∑
=
λ
where ED is education, C is crime, EE denotes the education expansion cohorts, where
each reduced form equation contains a Jth order polynomial in birth cohort (COH) and
age (AGE) - in most models below we include a quadratic (J=2) effect in cohort and a

13
cubic (J=3) effect in age. Z is a set of time varying demographic controls constructed
from the LFS (which are the age-year proportions of: non-white, living in London, and
from Wales), and υ and ω are equation error terms.
The reduced form parameters in (1) are related to the parameters of the
following crime structural form that models the causal crime-education relationship:
atat3jat2j
J
1j
jat1jat10at εZ)AGEγCOH(γEDθθC +++++= ∑
=
γ (2)
where the instrumental variable/two stage least squares (IV/2SLS) estimate of the
coefficient on the education variable in (2) is the ratio of the reduced form coefficients
in (1), 111 /αβθ = .
Reduced Form Estimates
Table 1 shows the reduced form estimates (equation (1)) for the two education
variables and for the total conviction rate for male and female cohorts. The education
expansion cohorts (EE in (1)) are modelled through the inclusion of four cohort
dummies, for birth cohorts 1972 through 1975. Each specification also includes a post-
EE cohort dummy to pick up the plateauing out, shown in the earlier education
Figures. The cohort effects are therefore estimated relative to cohorts born in 1971 or
before (the pre-GCSE examination period).
There are several interesting features of the results. Consider those for men
first. The estimated coefficients on the cohort dummies in the education equations
show significant step changes upwards, going from 0.031 to 0.137 from the 1972 to
1975 cohort, for the proportion of students in the cohort, and then plateauing out at
0.145. The same kind of pattern, going from 0.028 to 0.163 and plateauing out at 0.184
is seen for the staying on at age 16 variable. Moreover, as the F-tests in the Table
shows, these cohort dummies of the education impact of the reform are strongly

14
significant with large F-statistics (and associated p-values of 0.00). This supports use
of the cohort dummy variables as instruments in the causal estimations that we will
discuss in due course.
The conviction rate reduced form also shows a step change pattern, but this
time the estimated coefficients on the cohort dummies are negative, going from –0.050
to –0.239, and again showing the plateauing out feature with an estimated coefficient
of –0.248 on the post-EE cohort dummy variable. Similarly, the F-statistic testing for
the exclusion of the 1972 through 1975 cohort dummies being equal to zero is strongly
significant, with an F-statistic of 10.59 (and associated p-value of 0.00). We can
therefore conclude that for men, education significantly rose amongst the EE cohorts,
whilst at the same time their conviction rate fell.
For women, the pattern is qualitatively similar. There is evidence of strong
educational improvements, again with significant F-statistic testing the joint
significance of the EE cohort dummies. However, the crime reduced form is somewhat
weaker than the male one and the hypothesis of joint insignificance of the estimated
treated cohort effects can be rejected only at the 5 percent level. As discussed earlier,
this probably reflects the more infrequent occurrences of female convictions and thus
the noisier data.
Structural Form Estimates
Table 2 shows ordinary least squares (OLS) estimates of the crime-education
association and the causal 2SLS structural form estimates (of equation (2)) for male
and female cohorts. The OLS estimates reveal a negative association between the
conviction rate and both education measures, for both men and women, though the
estimated coefficients are not significant for women. The causal 2SLS estimates (using
the EE cohort dummies as instruments for the education variables) are greater in

15
(absolute) magnitude in all cases, and statistically significant (albeit only at the 5
percent level for women). The 2SLS results show that a 1 percent increase in the
proportion of male students reduces male youth crime by around 1.9 percent and a 1
percent increase in the proportion of men staying on at school after the compulsory
school leaving age reduces male youth crime by around 1.7 percent. Whilst going in
the same direction, results for women are smaller with youth crime reductions of
somewhere between 1.1 and 1.3 percent resulting from a 1 percent increases in the
proportion of female students and the proportion of females staying on respectively.
Thus, our first conclusion is that we are able to identify a quantitatively
important and strongly significant causal youth crime reducing effect of education,
especially for young men, working through the education expansion induced by the
reform of the examination system.
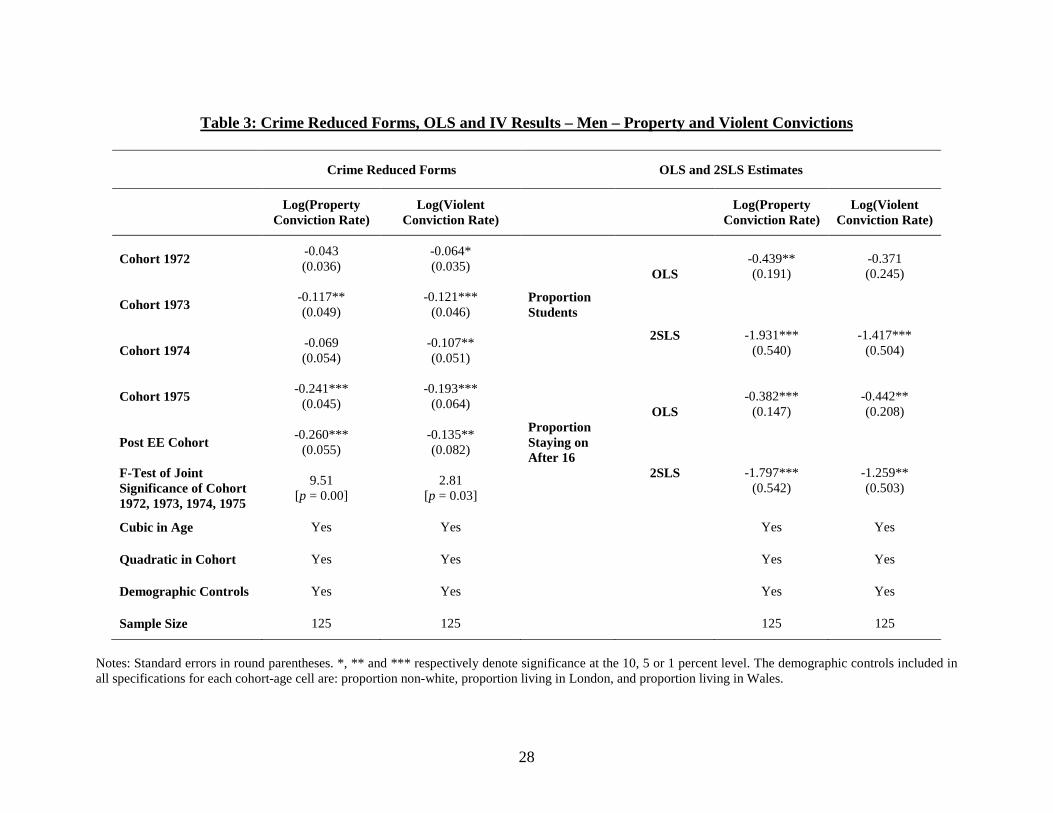
Property and Violent Crimes
In the existing literature, when crimes are broken down into property and
violent crimes, there is some disagreement about whether one can identify a causal
effect for both (for example, Lochner and Moretti’s, 2004, US work reports evidence
for both, whereas the England and Wales analysis of MMV, 2011, only reports a
significant effect for property crimes). In Table 3 we therefore consider property crime
convictions and violent crime convictions separately. These are considered for young
men only, because of the low frequency of female violent crime convictions.
Consider first the crime reduced forms in the left panel of Table 3.11 For both
property and violent crime convictions we see the same kind of pattern as before, with
there being a step change, followed by a plateauing out. The F-statistic of joint
significance is stronger for property than violent crimes.
11 The reduced forms for education remain the same as the ones already reported for males in Table 2.

16
Given these estimates, it is not surprising that we identify a significant causal
effect of education on property and violent crime convictions amongst young men. The
2SLS estimates in the right panel of Table 3 are again large in absolute magnitude, that
is, about 4 to 5 times larger than the corresponding OLS estimates. Thus our second
main conclusion is that, for young men, our estimates uncover a causal crime reducing
effect of education for both property and violent crime convictions.
5. Effects on Other Economic Outcomes
In Section 2 of the paper, we argued that looking at the impact of education on other
productivity related outcomes gives potential to rule out the notion that the only
mechanism at work in explaining the causal impact of education on crime is an
incapacitation effect. The stronger impacts on male property and violent crimes than
found by MMV (2011) do suggest that increased time spent at school had a direct
impact on criminal behaviour. However, in order to argue that it was or not the only
channel at play, we need to investigate if education expansion had an impact on other
outcomes (principally working through what we labelled the income effect earlier in
the paper). To do so, we consider the causal impact of education on productivity
related outcomes later in life (when aged 25 to 30) for our treated individuals, once the
vast majority have completed their education. The productivity related outcomes we
consider are qualification attainment and wages.12
In this Section, we are not forced to carry out a cohort level analysis since we
observe both the education variables and the productivity related outcomes at
individual level in the Labour Force Survey. Thus we can carry out individual analysis
12 In an earlier version of this paper, we also considered unemployment as an outcome. The reduced form for unemployment was not very strong and whilst the estimated effects went in the direction of unemployment reductions from education expansion, the IV results were very imprecise. These results are available from the authors on request.

17
of the relationship between these outcomes and the education variables affected by the
education expansion reform.13 We consider two education variables we can measure at
the individual level: a) whether the individual stayed on at school after the compulsory
school leaving age of 16; and b) age left full-time education.
The upper panel of Table 4 shows reduced form estimates for the two education
variables and for qualification attainment and for wages (both weekly and hourly). As
with the earlier, cohort-based analysis, the education variables are strongly related to
the 1972 to 1975 cohort dummies, with the same step-up pattern across cohorts, and
then a plateauing out, being observed. Again the F-tests of joint significance of the
cohort dummies are sizable.
There are also strong, similarly structured, reduced forms for qualification
attainment (here measured as whether an individual only achieves a low qualification -
see the Data Appendix for precise details) and wages (both weekly and hourly). The
probability of achieving a low qualification falls across the cohorts and then plateaus
out, whilst wages significantly improve.
The lower panel of Table 4 shows OLS and 2SLS estimates of the relationship
between the productivity related outcomes of interest and the education variables
where (in the case of 2SLS) the education expansion cohort dummies are used as
instruments. We identify a causal impact of increased education due to the expansion
that significantly reduces the probability of leaving school with low qualifications and
boosts both weekly and hourly earnings.
It is interesting that the 2SLS estimates for qualification attainment and wages,
as with the earlier crime results, are 2 to 3 times larger in (absolute) magnitude than the
13 In terms of the actual empirical specification, this means that we are no longer restricted to age-year cells (subscript at in the models above) and can look at the individual outcomes in a particular year (with the generic subscript it). Moreover we can now use dummies for the demographic controls (i.e., being non-white, living in London, or from Wales) rather than age-year proportions used before.

18
least squares results. We read these as showing a productivity enhancing effect of the
extra time spent in education because of the education expansion. Thus, we conclude
that this productivity increasing aspect of the education expansion means that we can
rule out the notion that the only mechanism underpinning the significant crime
reducing impact of education is incapacitation.
6. Conclusions
In this paper, we revisit the small, but growing, economic literature on the causal crime
reducing effect of education. We adopt a different route to identification compared to
the papers using raisings of the compulsory school leaving age. Instead, we study an
expansion of the post-compulsory education system that occurred in the UK for
cohorts of young people born between 1972 and 1975 who faced a change in the
school leaving examination system in 1988 when they reached the compulsory school
leaving age. This reform significantly expanded the number of individuals who
participated in post-compulsory education as full-time students who stayed on after the
compulsory school leaving age.
We use this variation in post-compulsory education participation to identify the
causal impact of education of crime. For young men, we report a strong crime reducing
effect of education, which is bigger in (absolute) magnitude than that implied by least
squares regressions. A 1 percent increase in the proportion of male students reduces
male crime by around 1.9 percent and a 1 percent increase in the proportion of men
staying on at school after the compulsory school leaving age reduces male crime by
around 1.7 percent. We also find crime reducing effects for young women, though
these are smaller with crime reductions of somewhere between 1.1 and 1.3 percent. For

19
young men, we also find that education causally reduces both property and violent
crimes.
Finally, we also find that the education boost from expansion significantly
affected other productivity related economic variables (qualification attainment and
wages), which we interpret as saying that keeping people in the education system
(incapacitation) is not the sole driver of the results. Rather, over and above the
incapacitation effects that exist, there is also a productivity enhancing aspect of the
increased time spent in post-compulsory education that has a direct crime reducing
impact.

20
References Anderson, D. M. (2009), “In School and Out of Trouble? The Minimum Dropout Age
and Juvenile Crime,” University of Washington, mimeo. Blanden, J. and S. Machin (2004), “Educational Inequality and the Expansion of UK
Higher Education,” Scottish Journal of Political Economy 51, 230-49. Devereux, P. and W. Fan (2011), “Earnings Returns to the British Education
Expansion,” Economics of Education Review 30, 1153–1166. Devereux, P. and R. Hart (2010), “Forced to be Rich? Returns to Compulsory
Schooling in Britain,” Economic Journal 120, 1345-64. Gould, E., D. Mustard and B. Weinberg (2002), “Crime Rates and Local Labor Market
Opportunities in the United States: 1979-1997,” Review of Economics and Statistics 84, 45-61.
Grogger, J. (1998), “Market Wages and Youth Crime,” Journal of Labor Economics
16, 756-791. Hjalmarsson, R. (2008), “Criminal Justice Involvement and High School Completion,”
Journal of Urban Economics 63, 613-630. Jacob, B. and L. Lefgren (2003), “Are Idle Hands the Devil’s Workshop?
Incapacitation, Concentration and Juvenile Crime,” American Economic Review 93, 1560-1577.
Levitt, S. and L. Lochner (2001), “The Determinants of Juvenile Crime,” in Gruber, J.
(ed.), Risky Behavior among Youths: An Economic Analysis, Chicago: University of Chicago Press.
Lochner, L. (2004), “Education, Work and Crime: A Human Capital Approach,”
International Economic Review 45, 811-843. Lochner, L. (2011), “Non-Production Benefits of Education: Crime, Health and Good
Citizenship,” in Hanushek, E., S. Machin and L. Woessmann (eds.), Handbook of the Economics of Education, Volume 4, North Holland: Amsterdam.
Lochner, L. and E. Moretti (2004), “The Effect of Education on Crime: Evidence from
Prison Inmates, Arrests and Self-Reports,” American Economic Review 94, 155-189.
Luallen, J. (2006), “School’s Out……Forever: A Study of Juvenile Crime, At-Risk
Youths and Teacher Strikes,” Journal of Urban Economics 59, 75-103. Machin, S., O. Marie and S. Vujić (2011), “The Crime Reducing Effect of Education,”
Economic Journal 121, 463-84.

21
Machin, S. and C. Meghir (2004), “Crime and Economic Incentives,” Journal of Human Resources 39, 958-979.
Machin, S. and A. Vignoles (2005) (eds.), “What’s the Good of Education? The
Economics of Education in the United Kingdom,” Princeton University Press: Princeton.
Mocan, N. and B. Unel (2011), “Skill-biased Technological Change, Earnings of
Unskilled Workers, and Crime,” National Bureau of Economic Research Working Paper 17605.
Oreopoulos, P. (2007), “Do Dropouts Drop out too Soon? Wealth, Health and
Happiness from Compulsory Schooling,” Journal of Public Economics 91, 2213-2229.
Sabates, R. (2010), “Educational Expansion, Economic Growth and Antisocial
Behaviour: Evidence from England,” Educational Studies, 36, 165-173. Sabates, R. and L. Feinstein (2008), “Effects of Government Initiatives on Youth
Crime,” Oxford Economic Papers 60, 462-83. Tauchen, H., A. Witte, and H. Griesinger (1994), “Criminal Deterrence: Revisiting the
Issue with a Birth Cohort,” Review of Economics and Statistics 76, 399-412.

22
Figure 1: Changes in Post Compulsory Education Participation from 1960 to 2002
Notes: Staying On measures the percentage of a cohort of individuals in England and Wales who are aged 16 in a certain year and who are enrolled in full time education (data from the Department for Education and Skills (DfES) are kindly provided by Damon Clark). The API is the Age Participation Index and is the percentage of individuals in England and Wales aged under 21 who enter higher education each year (data from DfES – note that there was a change in how this index was calculated from 2002 onwards and the series stops here in 2001 for consistency). The vertical line marks the 1988 introduction of the GCSE examination system.
020
4060
80
1962 1967 1972 1977 1982 1987 1992 1997 2002
Year
Staying On API

23
Figure 2: EducationMeasures by Cohort
Proportion of 16 to 21 Year Olds Still in Full Time Education
Proportion of 16 to 21 Year Olds Staying on After 16 by Cohort
Source: The Labour Force Survey. Authors’ calculations. The two vertical lines (i.e., 1972 to 1975 inclusive) denote the education expansion cohorts.
.25
.3.3
5.4
.45
.5P
ropo
rtio
n S
tude
nts
1962 1964 1966 1968 1970 1972 1974 1976 1978 1980 1982
Birth Cohort
Men Women
.4.5
.6.7
Pro
port
ion
Sta
y on
Afte
r 16
1962 1964 1966 1968 1970 1972 1974 1976 1978 1980 1982
Birth Cohort
Men Women

24
Figure 3:
Conviction Rates for Individuals Aged 16 to 21 by Cohort and Gender
Source: The Offenders Index Database. Authors’ calculations. The two vertical lines (i.e., 1972 to 1975 inclusive) denote the education expansion cohorts.
6.5
77.
58
8.5
4045
5055
6065
1962 1964 1966 1968 1970 1972 1974 1976 1978 1980 1982
Birth Cohort
Men (Left Axis) Women (Right Axis)

25
Figure 4: Property and Violent Conviction Rates for Men Aged 16 to 21 by Cohort
Source: The Offenders Index Database. Authors’ calculations. The two vertical lines (i.e., 1972 to 1975 inclusive) denote the education expansion cohorts.
88.
59
9.5
10
3540
4550
55
1962 1964 1966 1968 1970 1972 1974 1976 1978 1980 1982
Birth Cohort
Property (Left Axis) Violent (Right Axis)

26
Table 1: Education and Crime Reduced Forms – Men and Women
Men, Aged 16-21, Born 1962-1982 Women, Aged 16-21, Born 1962-82
Education
Reduced Forms Crime
Reduced Form Education
Reduced Forms Crime
Reduced Form
Proportion Students
Proportion Staying on After 16
Log(Total Conviction
Rate)
Proportion Students
Proportion Staying on After 16
Log(Total Conviction
Rate)
Cohort 1972 0.031
(0.019) 0.028
(0.0242) -0.050* (0.030)
0.020* (0.012)
0.012 (0.015)
-0.015 (0.063)
Cohort 1973 0.067*** (0.016)
0.055*** (0.019)
-0.122*** (0.041)
0.071*** (0.012)
0.061*** (0.017)
-0.082 (0.063)
Cohort 1974 0.106*** (0.020)
0.112*** (0.024)
-0.080* (0.046)
0.106*** (0.016)
0.098*** (0.023)
-0.222*** (0.073)
Cohort 1975 0.137*** (0.025)
0.163*** (0.031)
-0.239*** (0.039)
0.133*** (0.019)
0.153*** (0.022)
-0.112* (0.059)
Post-EE Cohort 0.145*** (0.028)
0.184*** (0.031)
-0.248*** (0.039)
0.139*** (0.023)
0.171*** (0.025)
-0.238** (0.087)
F-Test of Joint Significance of Cohort 1972, 1973, 1974, 1975
15.32 [p = 0.00]
9.64 [p = 0.00]
10.59 [p = 0.00]
18.27 [p = 0.00]
16.05 [p = 0.00]
2.41 [p = 0.05]
Cubic in Age Yes Yes Yes Yes Yes Yes
Quadratic in Cohort Yes Yes Yes Yes Yes Yes
Demographic Controls Yes Yes Yes Yes Yes Yes
Sample Size 125 125 125 125 125 125
Notes: Standard errors in round parentheses. *, ** and *** respectively denote significance at the 10, 5 or 1 percent level. The demographic controls included in all specifications for each cohort-age cell are: proportion non-white, proportion living in London, and proportion living in Wales.

27
Table 2: OLS and 2SLS Results – Men and Women – Total Convictions
Aged 16-21, Born 1962-82
Men - Log(Total
Conviction Rate)
Women - Log(Total
Conviction Rate)
Proportion Students
OLS -0.427***
(0.162) -0.220 (0.299)
2SLS -1.886***
(0.503) -1.302** (0.541)
Proportion Staying on After 16
OLS -0.390***
(0.126) -0.183 (0.247)
2SLS -1.743***
(0.498) -1.099** (0.473)
Cubic in Age Yes Yes
Quadratic in Cohort Yes Yes
Demographic Controls Yes Yes
Sample Size 125 125
Notes: Standard errors in round parentheses. *, ** and *** respectively denote significance at the 10, 5 or 1 percent level.The demographic controls included in all specifications for each cohort-age cell are: proportion non-white, proportion living in London, and proportion living inWales.
28
Table 3: Crime Reduced Forms, OLS and IV Results – Men – Property and Violent Convictions
Crime Reduced Forms OLS and 2SLS Estimates
Log(Property
Conviction Rate) Log(Violent
Conviction Rate)
Log(Property Conviction Rate)
Log(Violent Conviction Rate)
Cohort 1972 -0.043 (0.036)
-0.064* (0.035)
Proportion Students
OLS -0.439** (0.191)
-0.371 (0.245)
Cohort 1973 -0.117** (0.049)
-0.121*** (0.046)
Cohort 1974 -0.069 (0.054)
-0.107** (0.051)
2SLS -1.931*** (0.540)
-1.417*** (0.504)
Cohort 1975 -0.241***
(0.045) -0.193***
(0.064)
Proportion Staying on After 16
OLS -0.382***
(0.147) -0.442** (0.208)
Post EE Cohort -0.260***
(0.055) -0.135** (0.082)
F-Test of Joint Significance of Cohort 1972, 1973, 1974, 1975
9.51 [p = 0.00]
2.81 [p = 0.03]
2SLS -1.797*** (0.542)
-1.259** (0.503)
Cubic in Age Yes Yes Yes Yes
Quadratic in Cohort Yes Yes Yes Yes
Demographic Controls Yes Yes Yes Yes
Sample Size 125 125 125 125
Notes: Standard errors in round parentheses. *, ** and *** respectively denote significance at the 10, 5 or 1 percent level. The demographic controls included in all specifications for each cohort-age cell are: proportion non-white, proportion living in London, and proportion living in Wales.

29
Table 4: Qualification Attainment and Wages - Men, Aged 25-30
Men, Aged 25-30, Born 1962-1982 - LFS 1993 to 2010
Panel A: Reduced Forms Staying On
After 16 Age Left School
Low Qualification
Log(Weekly Wages)
Log(Hourly Wages)
Cohort 1972 0.025*** (0.007)
0.232*** (0.046)
-0.026*** (0.006)
0.025* (0.013)
0.027** (0.013)
Cohort 1973 0.043*** (0.009)
0.350*** (0.056)
-0.047*** (0.009)
0.050*** (0.012)
0.061*** (0.014)
Cohort 1974 0.104*** (0.009)
0.597*** (0.063)
-0.068*** (0.009)
0.057*** (0.011)
0.084*** (0.014)
Cohort 1975 0.141*** (0.009)
0.713*** (0.063)
-0.071*** (0.011)
0.084*** (0.014)
0.111*** (0.016)
Post EE Cohort 0.167*** (0.013)
0.693*** (0.081)
-0.062*** (0.010)
0.084*** (0.015)
0118*** (0.018)
F-Test of Joint Significance of Cohort 1972, 1973, 1974, 1975
95.23 [p = 0.00]
43.08 [p = 0.00]
17.76 [p = 0.00]
11.57 [p = 0.00]
14.88 [p = 0.00]
Sample Size 271,192 271,192 265,299 50,753 49,369
Panel B: OLS and 2SLS
Staying On After 16 OLS
-0.359*** (0.004)
0.208*** (0.007)
0.273*** (0.007)
2SLS -0.521***
(0.055) 0.479*** (0.095)
0.670*** (0.104)
Age Left School OLS
-0.104*** (0.001)
0.042*** (0.001)
0.054*** (0.001)
2SLS -0.102***
(0.008) 0.099*** (0.016)
0.131*** (0.018)
Notes: Standard errors clustered by age and cohort in round parentheses. *, ** and *** respectively denote significance at the 10, 5 or 1 percent level. All specifications include a cubic in age and a quadratic in cohort. They also include dummies for being non-white, living in London, and living in Wales.

30
Data Appendix
A.1 The Offenders Index Database (OID)
Our analysis uses Offenders Index Database (OID) data from 1978 to 2002, which
we match to Labour Force Survey (LFS) data for England and Wales by age cohort and
survey year. The version of the OID to which we have access holds criminal history data
for offenders convicted of standard list offences between 1963 and 2002. Standard list
offences are all indictable or triable either way offences, plus a few of the more serious
summary offences. Standard list class codes are set out in the Offenders Index (OI)
codebook. The data are derived from the Court Appearances system and are updated
quarterly.
The data set holds anonymous samples (of 4 weeks) for each year. The selection
of offenders is from analysis of the court appearance data using the date to select relevant
offenders. Selection of offenders occurs where they appeared in court during the first
week in March, the second week in June, the third week in September and the third week
in November.14
Matching OID to ONS population data, we calculated offending rates (per 10,000
population) by age cohort and year, separately for men and women, using date of birth
and gender variables. Criminal offences have been broadly categorised as property crimes
(burglary and theft and handling stolen goods) and violent crimes (violence against the
person and robbery), using categorisation in the Offence Class Code of variables.15 The
total conviction rate we use is the sum of the two. We focus on youth convictions for
individuals aged 16 to 21 years old enabling us to have a reasonably well balanced panel
14 The first week in any calendar month is the week where the Monday is the first Monday in that month. 15 We do not consider sexual offences since there are very few of them and their relationship with education is contrary to that of most other crimes (as in the case of rape in Lochner and Moretti, 2004).

31
around the policy years (from the 1988 introduction of the GCSE onwards) since the
cohorts studied were born between 1962 and 1982.
The data structure for men and women, with means of the total conviction rate per
10,000 population, as well as property and violent conviction rates, are presented in Table
A1.
Table A1: Offenders Index Database (OID) – Descriptives
OID Year
Age Range
Men, Total Convictions
Men, Property
Men, Violent
Women, Total Convictions
Women, Property
Women, Violent
1978 16-16 44.11 39.60 4.51 5.09 4.32 0.77 1979 16-17 45.22 38.27 6.95 7.03 6.24 0.79 1980 16-18 50.44 41.49 8.95 8.50 7.70 0.80 1981 16-19 54.31 45.46 8.85 7.28 6.66 0.62 1982 16-20 63.71 54.06 9.65 8.80 8.14 0.65 1983 16-21 57.97 49.01 8.96 8.03 7.17 0.87 1984 16-21 61.56 52.78 8.79 8.52 7.79 0.73 1985 16-21 60.74 51.53 9.21 8.58 7.93 0.65 1986 16-21 53.39 44.71 8.68 7.27 6.56 0.71 1987 16-21 69.41 59.97 9.43 7.43 6.70 0.72 1988 16-21 65.11 55.23 9.88 7.25 6.29 0.96 1989 16-21 57.74 47.54 10.20 7.55 6.48 1.07 1990 16-21 60.03 50.52 9.51 7.81 6.93 0.88 1991 16-21 61.58 53.23 8.35 8.14 7.31 0.83 1992 16-21 59.99 51.13 8.87 7.68 6.70 0.99 1993 16-21 53.12 43.49 9.62 6.69 5.90 0.79 1994 16-21 50.84 41.34 9.50 6.83 5.94 0.88 1995 16-21 48.87 41.14 7.73 6.40 5.79 0.62 1996 16-21 45.53 37.71 7.81 6.06 5.51 0.55 1997 16-21 46.24 37.17 9.06 6.94 6.06 0.88 1998 16-21 43.76 35.68 8.08 6.76 6.11 0.65 1999 17-21 44.11 35.66 8.45 7.85 7.13 0.72 2000 18-21 43.32 35.04 8.28 9.15 8.35 0.80 2001 19-21 41.82 33.44 8.38 8.51 7.84 0.67 2002 20-21 38.73 30.72 8.01 7.31 6.76 0.55
Note: There was an unexplained jump in the number of convictions recorded in 1999 in the OID, so that year is interpolated using cohorts between 1998 and 2000. Dropping this year from our sample yielded similar results to the ones reported in the main body of the paper.
A.2 The Labour Force Survey (LFS)
The LFS began in 1975 and was initially a biannual survey (up to 1983), after
which it became annual (up to 1991) and has since become a quarterly (since 1991)

32
sample survey of households living at private addresses in the United Kingdom. Its
purpose is to provide information on the UK labour market that can then be used to
develop, manage, evaluate and report on labour market policies. It is conducted by the
Office for National Statistics (ONS).
For the purposes of this paper, we make use of two distinct sets of LFS data,
restricted to individuals in England and Wales:
i) Cohort level averages (weighted by individual weights) from 1978 to 2002, matched to
OID data in order to analyse the impact of education expansion on youth crime.16
ii) Individual data from 1993 to 2010 to investigate the effect of the policy on later life
outcomes for the same cohorts.
The first set of LFS data is mainly used to obtain averages of educational
attainment levels by cohort in order to estimate actual impact of the expansion policy.
The two measures of education for our individuals aged 16 to 21 and born between 1962
and 1982 were defined as:
- ‘Student’: Individual was still enrolled at school at the time of survey.
- ‘Staying On’: Individual is still enrolled in school and is older than 16 or has left
full time education after that age.
Table A2.1 below describes the education measures by year, age range, and gender.
Table A2.1: LFS 1978-2002 – Descriptives
LFS Year
Age Range
Men, Proportion Students
Men, Proportion Staying On
Women, Proportion Students
Women, Proportion Staying On
1978 16-16 0.713 0.713 0.672 0.672 1979 16-17 0.521 0.562 0.473 0.511 1980 16-18 0.413 0.471 0.417 0.481 1981 16-19 0.327 0.395 0.360 0.452 1982 16-20 0.293 0.399 0.320 0.466
16 In the early years when the LFS was biannual, we interpolate data for missing years.

33
1983 16-21 0.264 0.407 0.289 0.484 1984 16-21 0.267 0.412 0.279 0.494 1985 16-21 0.250 0.407 0.276 0.486 1986 16-21 0.250 0.411 0.270 0.492 1987 16-21 0.271 0.431 0.276 0.498 1988 16-21 0.267 0.426 0.284 0.505 1989 16-21 0.270 0.429 0.290 0.505 1990 16-21 0.291 0.452 0.325 0.525 1991 16-21 0.322 0.479 0.344 0.558 1992 16-21 0.371 0.542 0.395 0.611 1993 16-21 0.404 0.581 0.434 0.649 1994 16-21 0.438 0.616 0.450 0.676 1995 16-21 0.438 0.641 0.464 0.695 1996 16-21 0.434 0.636 0.458 0.692 1997 16-21 0.423 0.639 0.459 0.697 1998 16-21 0.431 0.636 0.471 0.702 1999 17-21 0.367 0.612 0.396 0.677 2000 18-21 0.316 0.605 0.344 0.668 2001 19-21 0.275 0.597 0.284 0.648 2002 20-21 0.253 0.588 0.263 0.633 Note: In the early years of the LFS, the survey was biannual (in 1977, 1979, 1981 and 1983), after which it became annual. For the early missing years (1978, 1980, and 1982), we impute values by cohort by generating averages between the previous and next year.
The second use of the LFS comes from our interest in the effect of the education
expansion on productivity related outcomes later in the lives of the cohorts that
experienced this education expansion. Wage information was first reported in the first
quarter of 1993 and the data is available up to the last quarter of 2010. Since all the
information necessary for this part of the analysis (education and outcomes) is available
within the LFS, we can use individual micro information here rather than using cohort
level averages. The variables we look at are:
- ‘Staying On’: Individual left school after the compulsory age of 16
- ‘Edage’: Age individual left full time education
- ‘LowQual’: Left school without obtaining an intermediate qualification
- ‘Wkearn’: Gross weekly earnings
- ‘Hrearn’: Gross hourly earnings (i.e. weekly earnings / hours worked)

34
The sample of individuals is restricted to males born between 1962 and 1982, aged 25
to 30, but observed in later LFS years, which corresponds to the same cohorts used in the
analysis of education expansion on youth crime. Table A2.2 reports averages for these
variables by year and age range.
Table A2.2: LFS 1993-2010, Men – Descriptives
LFS Year
Age Range
Staying On After 16
Age Left School
Low Qual
Weekly Wages
Hourly Wages
1993 25-30 0.40 17.41 0.77 307.73 7.40
1994 25-30 0.42 17.46 0.78 297.27 7.05
1995 25-30 0.42 17.43 0.77 308.45 7.38
1996 25-30 0.41 17.52 0.76 319.51 7.72
1997 25-30 0.41 17.58 0.70 325.81 7.69
1998 25-30 0.42 17.70 0.68 339.34 8.00
1999 25-30 0.43 17.83 0.65 355.99 8.46
2000 25-30 0.45 17.89 0.65 370.75 8.83
2001 25-30 0.48 18.14 0.63 394.83 9.47
2002 25-30 0.51 18.31 0.61 405.72 9.82
2003 25-30 0.53 18.47 0.58 411.34 9.99
2004 25-30 0.55 18.52 0.57 423.78 10.49
2005 25-30 0.57 18.58 0.57 430.28 10.68
2006 25-30 0.58 18.66 0.55 430.48 10.64
2007 25-30 0.58 18.72 0.54 455.11 11.11
2008 26-30 0.59 18.79 0.53 496.05 12.20
2009 27-30 0.58 18.85 0.52 477.57 11.92
2010 28-30 0.57 18.79 0.52 493.09 12.19