YOUR TM ISTRC SYSTEM Report Sample - Sand-Based Green.pdf · The greens are core aerified once ......
16
YOUR ISTRC SYSTEM REPORT S S A A M M P P L L E E R R E E P P O O R R T T G G O O L L F F & & C C O O U U N N T T R R Y Y C C L L U U B B April 4, 2008 Greens 2, 5, 6, 11, 13, &17 Lab ID: 00000000 Presented To: Mr. Francisco Navas, GCS TM
-
Upload
trinhquynh -
Category
Documents
-
view
215 -
download
0
Transcript of YOUR TM ISTRC SYSTEM Report Sample - Sand-Based Green.pdf · The greens are core aerified once ......

YYOOUURR
IISSTTRRCC SSYYSSTTEEMM RREEPPOORRTT
SSAAMMPPLLEE RREEPPOORRTT GGOOLLFF && CCOOUUNNTTRRYY CCLLUUBB
AApprriill 44,, 22000088 GGrreeeennss 22,, 55,, 66,, 1111,, 1133,, &&1177
LLaabb IIDD:: 0000000000000000
PPrreesseenntteedd TToo:: Mr. Francisco Navas, GCS
TTMM

Page: 1
February 9, 2010 Mr. Francis G. McKee Jr., GCS PARKLAND GOLF & COUNTRY CLUB 10101 Trails End Rd. Parkland, FL 33076
re: Lab ID: 10010005; ISTRC SYSTEMTM BenchMarking of undisturbed core samples from Green #5 [center] – 1st, 2nd & 3rd tier, Green #10 [center], Green #17 [center], and the Putting Green [center].
Dear Frank; We have completed the ISTRC SYSTEMTM BenchMarking of the undisturbed core samples taken from Green #5 [center] – 1st, 2nd & 3rd tier, Green #10 [center], Green #17 [center], and the Putting Green [center].
I. BACKGROUND (per Information Supplied to ISTRC)
The Parkland Golf & Country Club is a Greg Norman design that was originally opened for play in 2004. The greens were built according to USGA recommended specifications using what appears to be a Sand/Inorganic amendment blend and established with Seadwarf Seashore Paspalum. Greens 5, 10, 17 and the Putting Green have been selected for testing as a representative sampling of the greens. We understand the greens have had a limited response to inputs since September with turf qualities that are poorer in comparison to previous years. The primary objective for testing is to establish an initial benchmark of the greens as a basis for monitoring the aging of the root zone and evaluating the impact of the current cultural practices. The greens are core aerified once per year using ¾ inch tines on 2 inch center to a depth of 4 inches. The greens are also supplemented with solid/pencil tining along with regular verti-cutting and light topdressing. For the age of the greens and turf-type, the cultural program has done an excellent job keeping up with the plant-deposited biomass. In addition to the cultural practices, another factor that is likely playing a key role in your ability to keep up with the organic matter and thatch accumulation is the lean fertilization program.
Table 1 is used to incorporate your evaluation of the tested green’s turf quality and micro-environment (growing conditions). As a general rule, turf quality is a function of the interrelationship between the physical properties of the root zone and the green’s micro-
11372 Strang Line Road Lenexa, KS 66215
Phone: 800-362-8873Phone: 913-829-8873
Fax: 913-829-4013E-Mail: [email protected]
Website: www.istrc.com

Page: 2
environment. Our research has found that it is possible to compensate for poor growing conditions by manipulating the physical properties of the root zone. Conversely, it is possible to compensate for poor physical properties with an excellent micro-environment. See, Section IV, D – The Green’s Micro-Environment – at page 15.
Table 1. Scale: 1 [bad] – 5 [moderate] – 10 [excellent]
Turf Quality (Current)
Air Movement
Direct Sunlight Comments
Green #5 3 8 10 Sits North to South
Green #10 7 10 10 Wide open location – unlimited air movement & sunlight
Green #17 10 10 10 Wide open location – unlimited air movement & sunlight
Putting Green 3 7 8 Sits low – vegetation & hills is limiting the greens access to air movement – morning shade until around 9 am
II. DISCUSSION OF LAB RESULTS The laboratory data can be found in its entirety at the end of this report. There are two sets of data. The first set of data consists of the physical evaluation, the evaluation of the root systems, and the measurement of the organic matter by layer.
The second set of data contains the textural & particle size analysis. The textural analysis measures the percentage of gravel, sand, silt and clay comprising the soil. The particle size distribution analyzes the size distribution of the sand.
We have also attached an aerification displacement chart at the end of the report. We designed the displacement chart to calculate the percentage of surface area that is removed from the green with various size tines and spacings. We have found that the chart is an excellent reference to evaluate the effectiveness of your program. On the following pages we will discuss the current test results. Included with the discussion are site photos of the greens, selected time lapse photos of the root zone, our Target Table with the greens’ physical properties, and an inch-by-inch analysis of the Textural & Sand Particle Size Distribution. Tables 2 - 5 compare the current test results to our recommended target range for well-drained, sand-based greens.
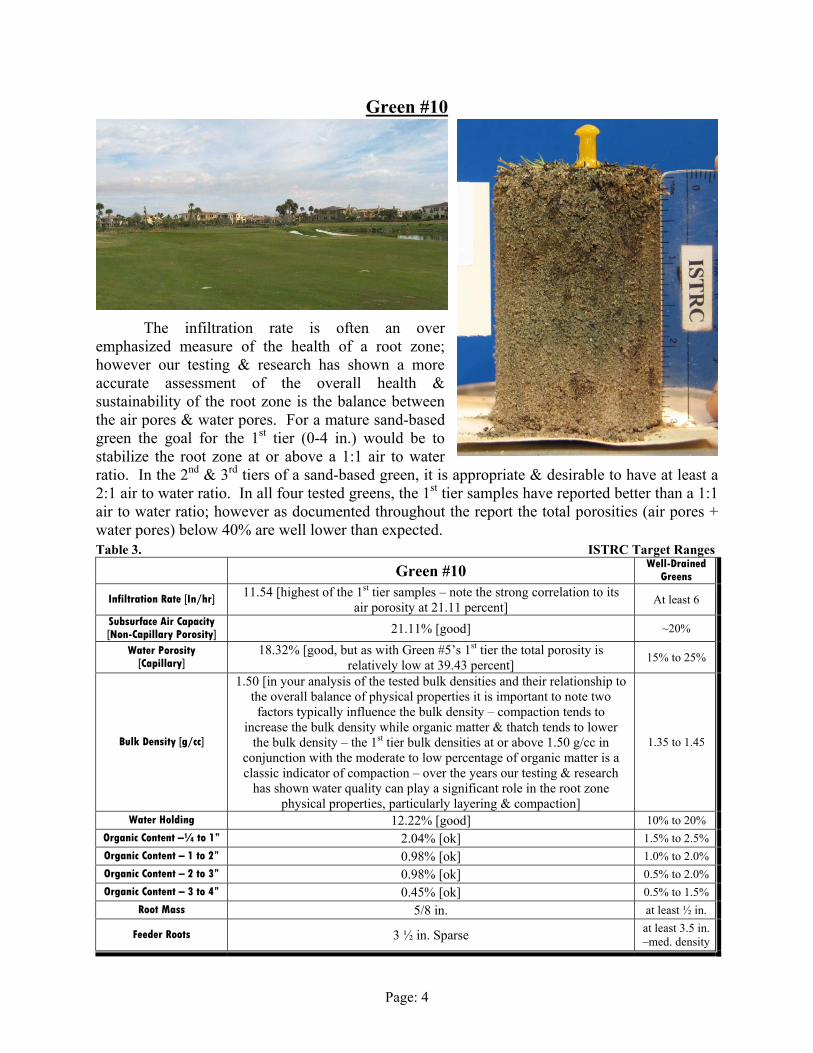
The time lapse photos included on the following pages were taken to monitor the drying process of your greens and to provide visual confirmation of the tested physical properties. As a general rule the darker the samples the higher the organic content & water holding properties. We have found the photos are an excellent indicator of layering and/or variations in water holding properties throughout the profile.

Page: 3
Green #5
Green #5’s time lapse photos were stacked to represent the entire 12-inch root zone. The darker coloration in the upper 2 to 3 inches reflects an accumulation of plant-deposited organic matter & compaction and accounts for the distinct contrasts in physical properties between the 1st tiers and the 2nd & 3rd tier samples. Based on Green #5’s 2nd & 3rd tier physical properties (4-8 & 8-12 in.), the greens were constructed with a relatively coarse USGA sand. The percentages of organic matter in the 2nd & 3rd tier would be consistent with a straight sand or sand/inorganic amendment blend.
Table 2. ISTRC Target Ranges
Green #5 1st tier (0-4 in.) 2nd tier (4-8 in.) 3rd tier (8-12 in.) Well-Drained Greens
Infiltration Rate [In/hr]
6.81 [well lower than the 2nd & 3rd tiers –
highlights the effects of the OM & compaction]
32.31 [ideal for the lower root zone of a sand-based green]
43.85 [excellent] At least 6
Subsurface Air Capacity [Non-Capillary Porosity]
18.92% [little low – also contributing to a low
total porosity (air pores + water pores at 35.31%]
25.72% [excellent] 27.31% [excellent] ~20%
Water Porosity [Capillary] 16.39% [ok] 9.79% [ok] 7.35% [ok] 15% to 25%
Bulk Density [g/cc] 1.53 [very high for a 1st tier sample – indicative of excess compaction]
1.50 [ok – target for a 2nd or 3rd tier is 1.40 to
1.50 g/cc] 1.47 [ok] 1.35 to 1.45
Water Holding 10.74% [ok] 6.54% [ok] 4.98% [mirrors the OM content] 10% to 20%
Organic Content [¼-1”] 1.71% [ok] [4-5”] 0.20% [ok] [8-9”] 0.03% [ok] 1.5% to 2.5%
Organic Content [1-2”] 1.18% [ok] [5-6”] 0.07% [equals a straight sand] [9-10”] 0.04% [ok] 1.0% to 2.0%
Organic Content [2-3”] 0.72% [ok] [6-7”] 0.05% [ok] [10-11”] 0.02% [ok] 0.5% to 2.0% Organic Content [3-4”] 0.88% [ok] [7-8”] 0.02% [ok] [11-12”] 0.01% [ok] 0.5% to 1.5%
Root Mass 5/8 in. N/A N/A at least ½ in.
Feeder Roots Less than 3 in. None None at least 3.5 in. –med. density
Page: 4
Green #10
The infiltration rate is often an over emphasized measure of the health of a root zone; however our testing & research has shown a more accurate assessment of the overall health & sustainability of the root zone is the balance between the air pores & water pores. For a mature sand-based green the goal for the 1st tier (0-4 in.) would be to stabilize the root zone at or above a 1:1 air to water ratio. In the 2nd & 3rd tiers of a sand-based green, it is appropriate & desirable to have at least a 2:1 air to water ratio. In all four tested greens, the 1st tier samples have reported better than a 1:1 air to water ratio; however as documented throughout the report the total porosities (air pores + water pores) below 40% are well lower than expected.
Table 3. ISTRC Target Ranges
Green #10 Well-Drained Greens
Infiltration Rate [In/hr] 11.54 [highest of the 1st tier samples – note the strong correlation to its air porosity at 21.11 percent] At least 6
Subsurface Air Capacity [Non-Capillary Porosity] 21.11% [good] ~20%
Water Porosity [Capillary]
18.32% [good, but as with Green #5’s 1st tier the total porosity is relatively low at 39.43 percent] 15% to 25%
Bulk Density [g/cc]
1.50 [in your analysis of the tested bulk densities and their relationship to the overall balance of physical properties it is important to note two factors typically influence the bulk density – compaction tends to
increase the bulk density while organic matter & thatch tends to lower the bulk density – the 1st tier bulk densities at or above 1.50 g/cc in
conjunction with the moderate to low percentage of organic matter is a classic indicator of compaction – over the years our testing & research
has shown water quality can play a significant role in the root zone physical properties, particularly layering & compaction]
1.35 to 1.45
Water Holding 12.22% [good] 10% to 20% Organic Content –¼ to 1” 2.04% [ok] 1.5% to 2.5% Organic Content – 1 to 2” 0.98% [ok] 1.0% to 2.0% Organic Content – 2 to 3” 0.98% [ok] 0.5% to 2.0% Organic Content – 3 to 4” 0.45% [ok] 0.5% to 1.5%
Root Mass 5/8 in. at least ½ in.
Feeder Roots 3 ½ in. Sparse at least 3.5 in. –med. density

Page: 5
Green #17
The selected time lapse photos for each of the tested greens provide some excellent insight into the root zone. The photos along with the inch-by-inch breakdowns of the OM content are an excellent confirmation the cultural program has been very effective in keeping up with the plant-deposited biomass, especially for 6 to 7 year old greens. A key variable in the analysis of the tested greens is the bulk density. To accurately assess the bulk density and its relationship to the overall balance of physical properties it is important to first isolate the two factors that influence the bulk density. Compaction tends to increase the bulk density while OM & thatch tends to lower the bulk density. The 1st tier (0-4 in.) bulk densities ranging from 1.50 to 1.54 g/cc in conjunction with total porosities less than 40% are classic indicators of compaction. Foot traffic, rolling, and/or a wet year are common contributors to compaction; however our testing & research has shown a build up of salts and/or bicarbonates from the irrigation water can increase a root zone’s susceptibility to compaction.
Table 4. ISTRC Target Ranges
Green #17 Well-Drained Greens
Infiltration Rate [In/hr] 9.23 [excellent] At least 6 Subsurface Air Capacity [Non-Capillary Porosity] 20.74% [good] ~20%
Water Porosity [Capillary] 17.85% [ok] 15% to 25%
Bulk Density [g/cc]
1.50 [high – over the years we have closely monitored the impact irrigation water has on the agronomic conditions of the root zone –
layering & compaction are often magnified in a root zone with a build up of salts resulting in a loss of permeability, high bulk density, and low total porosity – while the sodium levels are low in the water & soil
reports, the bicarbonate levels were high – it would not hurt to flushing the greens]
1.35 to 1.45
Water Holding 11.87% [ok] 10% to 20%
Organic Content –¼ to 1” 1.82% [ok – for the age of the greens the cultural program has done an excellent job keeping up with the plant-deposited OM & thatch] 1.5% to 2.5%
Organic Content – 1 to 2” 0.99% [ok] 1.0% to 2.0% Organic Content – 2 to 3” 0.89% [ok] 0.5% to 2.0% Organic Content – 3 to 4” 0.47% [ok] 0.5% to 1.5%
Root Mass 5/8 in. at least ½ in.
Feeder Roots 3 ½ in. Sparse at least 3.5 in. –med. density

Page: 6
Putting Green
The Practice Putting Green has reported the lowest 1st tier (0-4 in.) infiltration rate & highest bulk density of the tested greens. We understand the green receives heavy play and is located in a more pocketed micro-climate than the other tested greens. General wear & tear and compaction are all too common in a heavy use Practice Putting Greens. Additional hollow coring and/or non-disruptive aerification may be beneficial for the Practice Putting Green in the upcoming years, particularly if the organic percentages get higher in the upper 1 to 2 inches. Over the years our testing & research has shown ¼ inch hollow quads are an excellent tool to supplement larger tine aerifications and/or deep verti-cuttings. With an emphasis on compaction relief, it is not important to backfill the ¼ inch holes with sand; rather leaving the holes open allows for the expansion of the existing root zone, which is vital to reducing its density.
Table 5. ISTRC Target Ranges
Putting Green Well-Drained Greens
Infiltration Rate [In/hr]
6.69 [lowest of the tested 1st tiers – note the correlation between the infiltration rates and the bulk densities – Green #5 and the Putting Green
have reported lower infiltration rates that mirror their higher bulk densities]
At least 6
Subsurface Air Capacity [Non-Capillary Porosity] 19.93% [good] ~20%
Water Porosity [Capillary]
16.80% [good, but as documented in the other greens, the total porosity is low at 36.73 percent] 15% to 25%
Bulk Density [g/cc]
1.54 [very high for a 1st tier sample – with a similar OM content to the one report a typical 1st tier bulk density is around 1.40 g/cc – in your analysis of the bulk densities it is important to note seemingly subtle
differences (e.g. 0.02 to 0.03 g/cc) are significant in bulk density terms]
1.35 to 1.45
Water Holding 10.92% [ok] 10% to 20% Organic Content –¼ to 1” 1.24% [ok] 1.5% to 2.5% Organic Content – 1 to 2” 1.14% [ok] 1.0% to 2.0% Organic Content – 2 to 3” 0.76% [ok] 0.5% to 2.0% Organic Content – 3 to 4” 0.32% [ok] 0.5% to 1.5%
Root Mass 5/8 in. at least ½ in.
Feeder Roots 3 ½ in Sparse at least 3.5 in. –med. density
Page: 7
Textural Analysis Sand Particle Size Distribution
Sand Silt Clay Gravel Very Coarse Coarse Medium Medium Med/Fine Fine Very FineUSDA (mm) .05 to 2.00 .002 to .05 <.002 2.00 1.00 0.50 0.25 0.18 0.15 0.10 0.05U.S. Sieve (mesh) 270 to 18 (Pan) (Pan) 10 18 35 60 80 100 140 270SAMPLE NAME % Retained on Sieve.25 - 1.0 in. 98.48 0.62 0.63 0.27 2.22 37.25 38.17 12.45 5.42 2.20 0.771.0 - 2.0 in. 98.71 0.58 0.59 0.12 1.67 38.20 38.40 12.42 3.95 3.37 0.702.0 - 3.0 in. 98.30 0.01 1.69 0.00 0.45 40.42 40.42 10.67 4.12 1.62 0.603.0 - 4.0 in. 98.35 0.01 1.59 0.05 2.00 39.87 39.57 10.17 3.32 2.75 0.67
4.0 - 5.0 in. 98.61 0.01 1.38 0.00 0.90 36.50 41.77 11.87 5.00 1.95 0.625.0 - 6.0 in. 98.98 0.01 1.01 0.00 0.25 41.10 40.15 10.62 3.47 2.87 0.526.0 - 7.0 in. 99.19 0.01 0.68 0.12 0.50 37.70 41.07 11.95 5.32 2.10 0.557.0 - 8.0 in. 99.21 0.01 0.76 0.02 0.85 41.77 41.95 10.07 2.77 1.60 0.20
8.0 - 9.0 in. 99.83 0.01 0.16 0.00 2.57 40.32 41.32 10.00 3.77 1.50 0.359.0 - 10.0 in. 99.30 0.01 0.69 0.00 0.37 40.77 40.62 10.80 3.47 2.80 0.4710.0 - 11.0 in. 99.32 0.01 0.67 0.00 0.75 37.75 41.67 11.55 5.15 1.90 0.5511.0 - 12.0 in. 92.04 0.01 1.10 6.85 1.52 36.07 38.80 10.35 3.10 2.00 0.20
.25 - 1.0 in. 98.13 0.01 1.81 0.05 2.05 42.15 36.47 10.95 4.27 1.72 0.521.0 - 2.0 in. 97.70 0.02 2.08 0.20 2.30 45.32 35.47 9.15 2.77 2.22 0.472.0 - 3.0 in. 97.96 0.02 1.92 0.10 1.22 47.25 36.12 8.30 3.20 1.35 0.523.0 - 4.0 in. 98.62 0.01 1.37 0.00 0.15 45.60 38.30 8.85 2.72 2.40 0.60
.25 - 1.0 in. 97.46 1.22 1.22 0.10 2.57 41.05 35.85 10.82 4.57 2.00 0.601.0 - 2.0 in. 98.34 0.01 1.50 0.15 1.10 50.40 35.75 6.92 2.17 1.55 0.452.0 - 3.0 in. 98.34 0.01 1.58 0.07 1.30 44.95 36.12 10.30 3.67 1.50 0.503.0 - 4.0 in. 98.82 0.01 1.17 0.00 0.85 46.00 37.85 8.65 2.60 2.22 0.65
.25 - 1.0 in. 97.59 0.01 1.78 0.62 3.42 39.52 35.12 11.37 5.22 2.32 0.621.0 - 2.0 in. 97.94 0.02 1.92 0.12 2.90 38.60 37.75 11.70 3.47 2.85 0.672.0 - 3.0 in. 97.86 0.02 2.12 0.00 0.57 36.27 40.37 12.90 5.05 2.05 0.653.0 - 4.0 in. 98.83 0.01 1.16 0.00 1.02 45.85 39.47 8.02 2.27 1.80 0.40
89 to 100 5 Max. 3 Max. 3 Max. 10 Max. At Least 60 20 Max. 5 Max.pecifications 10 Max. w/ Fine & V.F. 10 Max. 10 Max. w/Silt & Claynes 89 to 100 5 Max. 3 Max. 3 Max. 10 Max. 15 to 25 40+ 10 to 15 20 - #80 5 Max.
10 Max. w/ Fine & V.F. 10 Max. 65 to 85 Optimum 10 Max. w/Silt & Clay
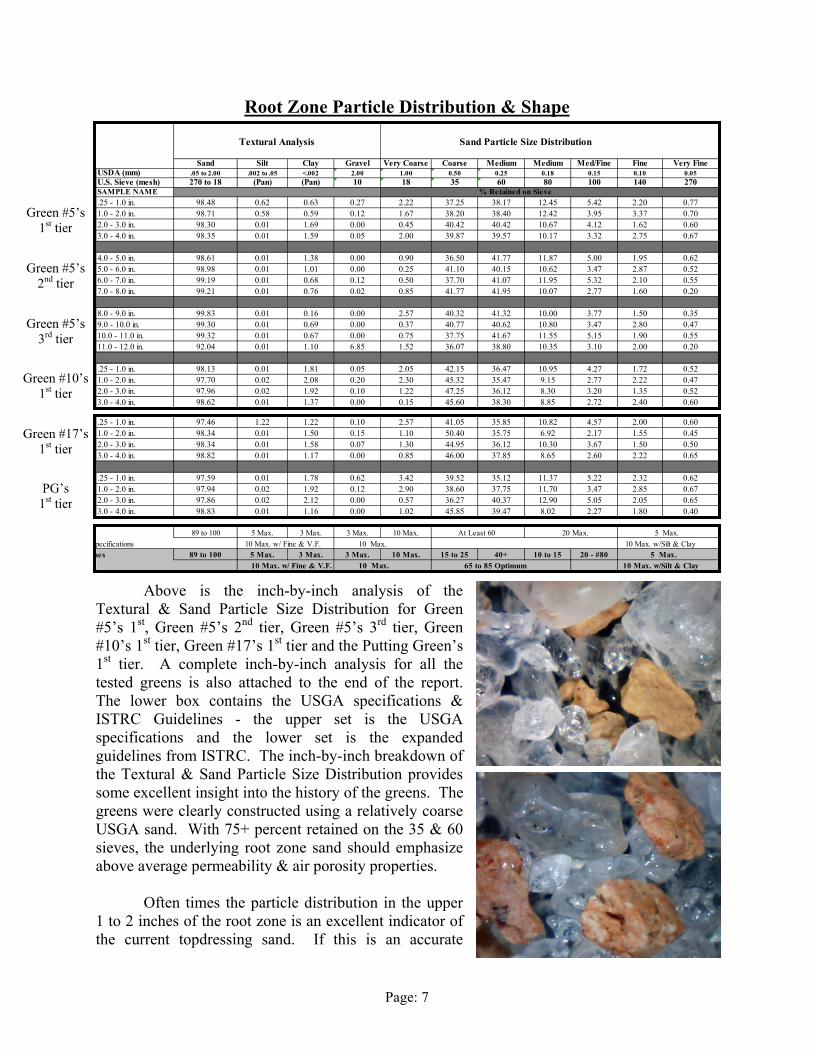
Root Zone Particle Distribution & Shape
Above is the inch-by-inch analysis of the Textural & Sand Particle Size Distribution for Green #5’s 1st, Green #5’s 2nd tier, Green #5’s 3rd tier, Green #10’s 1st tier, Green #17’s 1st tier and the Putting Green’s 1st tier. A complete inch-by-inch analysis for all the tested greens is also attached to the end of the report. The lower box contains the USGA specifications & ISTRC Guidelines - the upper set is the USGA specifications and the lower set is the expanded guidelines from ISTRC. The inch-by-inch breakdown of the Textural & Sand Particle Size Distribution provides some excellent insight into the history of the greens. The greens were clearly constructed using a relatively coarse USGA sand. With 75+ percent retained on the 35 & 60 sieves, the underlying root zone sand should emphasize above average permeability & air porosity properties. Often times the particle distribution in the upper 1 to 2 inches of the root zone is an excellent indicator of the current topdressing sand. If this is an accurate
Green #5’s 2nd tier
Green #5’s 1st tier
Green #10’s 1st tier
Green #5’s 3rd tier
Green #17’s 1st tier
PG’s 1st tier

Page: 8
depiction of the current topdressing sand it is very similar to the original root zone sand. With a relatively low percentage of Gravel and/or Very Coarse Sand the sand should be very suitable for light, frequent topdressing while the distinct peak on the 35 & 60 sieves, which should emphasize permeability & air porosity, should also make for a very good aerification sand.
In addition to its particle distribution, a shape analysis was conducted on a representative sampling of the greens. To document their shape digital microscope photos has been included on the previous page. Based on a representative sampling of the submitted sample, our classification of the sand would be Sub-Angular to Sub-Rounded with Medium Sphericity. Over the years our testing & research has shown angularity not only plays a significant role in the porosity & permeability of a root zone but also its stability. Angular sands tend to be more stable, produce a firmer putting surface, and support better physical properties than round sands.
III. SUMMARY
A general discussion on Maintenance Practices is contained in Section V of The ISTRC Guidebook. We encourage you to reference the Guidebook for a wide range of topics relating to the root zone, environmental factors, and maintenance.
Overall the greens are in good physical condition. The 1st tier (0-4 in.) infiltration rates from 6.69 to 11.54 in./hr. are very good and mirror the ratio of air pores to water pores at better than a 1:1 air to water ratio. The majority of the water retention is confined to the upper 1 to 2 inches, which is not uncommon in the maturation of sand-based greens. Data suggests the greens are compacted, as measured by their 1st tier bulk densities; however it is important to note there is no evidence of layering. In your evaluation of the inch-by-inch breakdown of the organic matter contents and their relationship to the overall balance of physical properties it is important to recognize the deposited biomass is the byproduct of an actively growing, healthy turf. As cumulative 1st tier organic contents (sum of the upper 4”) exceed 7 to 8 percent or 2 to 2 ½ percent, by inch, our testing & research has shown it becomes increasingly more difficult to keep the root zone open & breathing as well as maintain desirable firmness & speeds. Over the years the cultural program has done an excellent job keeping up with the biomass production. As we discussed on the phone, the 1st tier physical properties for all four greens would be more consistent with 2 to 3 year old greens rather than 6 to 7 year old greens.
The 2nd & 3rd tier samples (4-8 & 8-12 in.) submitted from Green #5 are in excellent physical condition. The accelerated infiltration rates & air porosities are indicative of a quality mix. The 2nd & 3rd tier water holding & water porosity properties are relatively low and mirror the organic contents, which are the equivalent of a straight sand or sand/inorganic amendment blend. Based on Green #5’s 2nd & 3rd tiers, we do not see an immediate need for a deep hollow tine aerification or Drill & Fill; rather aerify to a depth of 2 to 3 inches should penetrate below the organic matter & thatch providing channels for drainage & gas exchange.
The goal for the upcoming years would be to alleviate compaction, minimize any layering, and stabilize the percentage of organic matter in the upper 2 inches of the root zone. Aerification will continue to play a key role in the health & sustainability of the greens. Given

Page: 9
the current conditions, age of the greens, and turf-type our general recommendation for your greens would be a program that targets at least 15 percent annual surface area displacement. It will be important that you also continue to supplement the larger tine aerifications or deep verti-cuttings with regular venting using non-disruptive equipment such as the HydroJect, Planet Air, needle/pencil tines, bayonet tines, star tines, slicer, or deep spiker. Venting has proven to be extremely beneficial to the health of the turf and promoting gas exchange, particularly when done on a regular basis. Improving the ability for the root zone to breathe will not only encourage a deeper, more sustainable root system but also enhance microbial activity to aid in the natural decomposition of the organic matter & thatch.
Another topic that warrants discussion is water quality and its impact on the physical properties. It has been well documented over the years that a build up of sodium & bicarbonates causes a deterioration in root zone permeability, increased compaction, and a reduction in total porosity. Overall, the program has been effective in maintaining organic contents well within our target range; however with the density of the upper root zone (being expressed in the high 1st tier bulk densities and low total porosities) you may want to implement an aggressive deep leaching. Deep leaching of sand-based greens is not only an effective way to expel salts from the root zone, but also replenish soil oxygen throughout the profile. The current testing has established an initial benchmark of your greens. We would recommend that you continue to monitor your greens with regular testing. The information derived from regular testing will allow you to monitor the aging process of the greens, evaluate the effectiveness of the current cultural practices, modify the program based on hard data, make adjustments to the program to meet the individual needs of specific greens, and detect problems before they affect the health of the greens.
If you have any questions or need any additional information we encourage you to give us a call. We are always available to answer questions and discuss ideas with you. Our service is not confined to analyzing undisturbed cores. We do not charge for telephone calls and we encourage our client superintendents to use us as a resource. Sincerely, I.S.T.R.C. by:
Matt Pulis, M.S. Agronomist
encl.: ISTRC’s Guidebook
____________________________________________________________
INVOICE ISTRC EIN: 48-1078972
Invoice Number:
000000
Company: PARKLAND GOLF & COUNTRY CLUB
Facility: Greens 5, 10, 17, & Putting Green
Address: 10101 Trails End Rd.
Material tested: N/A
City: Parkland, FL 33076
Invoice Date: 02/09/10
Attention: Mr. Francis G. McKee Jr., GCS
Due Date: 03/09/10
Phone: 954-752-8804
Secondary Phone or E-mail:
Fax:
Lab ID #: 10010005
Customer Rep.: Mr. Nat Hubbard
Account No.: 9548804
Quantity Description Unit Price Invoiced Amount 6 ISTRC SYSTEM Undisturbed Core Analysis $475.00 $ 2,850.00 ============= TOTAL DUE THIS INVOICE: $ 2,850.00
Thank You For Your Business
We Accept:
*$10.00 Convenience fee for credit card processing will be applied
11372 Strang Line Road Lenexa, KS 66215
Phone: 800-362-8873Phone: 913-829-8873
Fax: 913-829-4013E-Mail: [email protected]
Website: www.istrc.com

I.S.T.R.C. Form: Physical Evaluation "ISTRC SYSTEM" is a Registered TradeMark of I.S.T.R.C.Copyright 1994 by I.S.T.R.C. Patents 5,668,306 - 5,672,813 - 5,672,814
I.S.T.R.C. Page: 1 "International Sports Turf Research Center, Inc."
11372 Strang Line Rd. Phone: 913-829-8873Lenexa, KS 66215 Phone: 800-362-8873
Fax: 913-829-4013 The I.S.T.R.C. System™
Company: PARKLAND GOLF CLUBName: Mr. Francis G. McKee Jr., GCS Account No. 9548804Address: 10101 Trails End Road Date 3-Feb-10City, ST, Zip Parkland, FL 33076 Facility Parkland G.C.
Physical Evaluation ISTRC Rep. Mr. Nat HubbardISTRC SYSTEM™ Core Analysis Porosity
Infiltration 40 cm Bulk Solids Total Capillary Non-CapillaryRate Water Holding Density Porosity [Water Pores] [Air Pores]
LAB ID NO. SAMPLE NAME in/hr % g/cc % % % %
10010005-G05 Green #5, Center, 1st Tier 6.81 10.74 1.53 64.69 35.31 16.39 18.92Organic [ISTRC Walkley/Black] .25 to 1 in. 1.71% Root Mass: 5/8"Organic [ISTRC Walkley/Black] 1 to 2 in. 1.18% Feeders: less than 3"Organic [ISTRC Walkley/Black] 2 to 3 in. 0.72%Organic [ISTRC Walkley/Black] 3 to 4 in. 0.88%
10010005-G05 Green #5, Center, 2nd Tier 32.31 6.54 1.50 64.49 35.51 9.79 25.72Organic [ISTRC Walkley/Black] 4 to 5 in. 0.20% Root Mass: N/AOrganic [ISTRC Walkley/Black] 5 to 6 in. 0.07% Feeders: noneOrganic [ISTRC Walkley/Black] 6 to 7 in. 0.05%Organic [ISTRC Walkley/Black] 7 to 8 in. 0.02%
10010005-G05 Green #5, Center, 3rd Tier 43.85 4.98 1.47 65.34 34.66 7.35 27.31Organic [ISTRC Walkley/Black] 8 to 9 in. 0.03% Root Mass: N/AOrganic [ISTRC Walkley/Black] 9 to 10 in. 0.04% Feeders: noneOrganic [ISTRC Walkley/Black] 10 to 11 in. 0.02%Organic [ISTRC Walkley/Black] 11 to 12 in. 0.01%
10010005-G10 Green #10, Center 11.54 12.22 1.50 60.57 39.43 18.32 21.11Organic [ISTRC Walkley/Black] .25 to 1 in. 2.04% Root Mass: 5/8"Organic [ISTRC Walkley/Black] 1 to 2 in. 0.98% Feeders: 3 1/2" sparseOrganic [ISTRC Walkley/Black] 2 to 3 in. 0.98%Organic [ISTRC Walkley/Black] 3 to 4 in. 0.45%
USGA Sample Range [Root Zone Mix] at least 6 10 to 20 1.4 to 1.7 45 to 65 35 to 55 15 to 25 15 to 30
Reviewed by:

I.S.T.R.C. Form: Physical Evaluation "ISTRC SYSTEM" is a Registered TradeMark of I.S.T.R.C.Copyright 1994 by I.S.T.R.C. Patents 5,668,306 - 5,672,813 - 5,672,814
I.S.T.R.C. Page: 2 "International Sports Turf Research Center, Inc."
11372 Strang Line Rd. Phone: 913-829-8873Lenexa, KS 66215 Phone: 800-362-8873
Fax: 913-829-4013 The I.S.T.R.C. System™
Company: PARKLAND GOLF CLUBName: Mr. Francis G. McKee Jr., GCS Account No. 9548804Address: 10101 Trails End Road Date 3-Feb-10
City, ST, Zip Parkland, FL 33076 Facility Parkland G.C. Physical Evaluation ISTRC Rep. Mr. Nat Hubbard
ISTRC SYSTEM™ Core Analysis PorosityInfiltration 40 cm Bulk Solids Total Capillary Non-Capillary
Rate Water Holding Density Porosity [Water Pores] [Air Pores]LAB ID NO. SAMPLE NAME in/hr % g/cc % % % %
10010005-G17 Green #17, Center 9.23 11.87 1.50 61.41 38.59 17.85 20.74Organic [ISTRC Walkley/Black] .25 to 1 in. 1.82% Root Mass: 5/8"Organic [ISTRC Walkley/Black] 1 to 2 in. 0.99% Feeders: 3 1/2" sparseOrganic [ISTRC Walkley/Black] 2 to 3 in. 0.89%Organic [ISTRC Walkley/Black] 3 to 4 in. 0.47%
10010005-PG Putting Green, Center 6.69 10.92 1.54 63.27 36.73 16.80 19.93Organic [ISTRC Walkley/Black] .25 to 1 in. 1.24% Root Mass: 5/8"Organic [ISTRC Walkley/Black] 1 to 2 in. 1.14% Feeders: 3 1/2" sparseOrganic [ISTRC Walkley/Black] 2 to 3 in. 0.76%Organic [ISTRC Walkley/Black] 3 to 4 in. 0.32%
Organic [ISTRC Walkley/Black] .25 to 1 in. Root Mass:Organic [ISTRC Walkley/Black] 1 to 2 in. Feeders:Organic [ISTRC Walkley/Black] 2 to 3 in.Organic [ISTRC Walkley/Black] 3 to 4 in.
Organic [ISTRC Walkley/Black] .25 to 1 in. Root Mass:Organic [ISTRC Walkley/Black] 1 to 2 in. Feeders:Organic [ISTRC Walkley/Black] 2 to 3 in.Organic [ISTRC Walkley/Black] 3 to 4 in.
USGA Sample Range [Root Zone Mix] at least 6 10 to 20 1.4 to 1.7 45 to 65 35 to 55 15 to 25 15 to 30
Reviewed by:

I.S.T.R.C. Form: Textural Analysis ISTRC SYSTEM is a Registered Trademark of I.S.T.R.C.
Copyright 1994 by I.S.T.R.C. Patents 5,668,306 - 5,672,813 - 5,672,814
I.S.T.R.C.International Sports Turf Research Center, Inc." Page: 1
11372 Strang Line Rd. Phone: 913-829-8873Lenexa, KS 66215 Phone: 800-362-8873
Fax: 913-829-4013
Company: PARKLAND GOLF CLUBName: Mr. Francis G. McKee Jr., GCS Account No. 9548804Address: 10101 Trails End Road Date 3-Feb-10City, ST, Zip Parkland, FL 33076 Facility Parkland G.C.
ISTRC Rep. Mr. Nat Hubbard
Textural Analysis Sand Particle Size Distribution
Sand Silt Clay Gravel Very Coarse Coarse Medium Medium Med/Fine Fine Very FineUSDA (mm) .05 to 2.00 .002 to .05 <.002 2.00 1.00 0.50 0.25 0.18 0.15 0.10 0.05U.S. Sieve (mesh) 270 to 18 (Pan) (Pan) 10 18 35 60 80 100 140 270
LAB ID NO. SAMPLE NAME % Retained on Sieve10010005-G05 .25 - 1.0 in. 98.48 0.62 0.63 0.27 2.22 37.25 38.17 12.45 5.42 2.20 0.77Green #5 1.0 - 2.0 in. 98.71 0.58 0.59 0.12 1.67 38.20 38.40 12.42 3.95 3.37 0.70Center 2.0 - 3.0 in. 98.30 0.01 1.69 0.00 0.45 40.42 40.42 10.67 4.12 1.62 0.601st Tier 3.0 - 4.0 in. 98.35 0.01 1.59 0.05 2.00 39.87 39.57 10.17 3.32 2.75 0.67
10010005-G05 4.0 - 5.0 in. 98.61 0.01 1.38 0.00 0.90 36.50 41.77 11.87 5.00 1.95 0.62Green #5 5.0 - 6.0 in. 98.98 0.01 1.01 0.00 0.25 41.10 40.15 10.62 3.47 2.87 0.52Center 6.0 - 7.0 in. 99.19 0.01 0.68 0.12 0.50 37.70 41.07 11.95 5.32 2.10 0.552nd Tier 7.0 - 8.0 in. 99.21 0.01 0.76 0.02 0.85 41.77 41.95 10.07 2.77 1.60 0.20
10010005-G05 8.0 - 9.0 in. 99.83 0.01 0.16 0.00 2.57 40.32 41.32 10.00 3.77 1.50 0.35Green #5 9.0 - 10.0 in. 99.30 0.01 0.69 0.00 0.37 40.77 40.62 10.80 3.47 2.80 0.47Center 10.0 - 11.0 in. 99.32 0.01 0.67 0.00 0.75 37.75 41.67 11.55 5.15 1.90 0.553rd Tier 11.0 - 12.0 in. 92.04 0.01 1.10 6.85 1.52 36.07 38.80 10.35 3.10 2.00 0.20
10010005-G10 .25 - 1.0 in. 98.13 0.01 1.81 0.05 2.05 42.15 36.47 10.95 4.27 1.72 0.52Green #10 1.0 - 2.0 in. 97.70 0.02 2.08 0.20 2.30 45.32 35.47 9.15 2.77 2.22 0.47Center 2.0 - 3.0 in. 97.96 0.02 1.92 0.10 1.22 47.25 36.12 8.30 3.20 1.35 0.52
3.0 - 4.0 in. 98.62 0.01 1.37 0.00 0.15 45.60 38.30 8.85 2.72 2.40 0.60
USGA 89 to 100 5 Max. 3 Max. 3 Max. 10 Max. At least 60 20 Max. 5 Max.Recommended Specifications 10 Max. w/ Fine & V.F. 10 Max. 10 Max. w/Silt & ClayISTRC Guidelines 89 to 100 5 Max. 3 Max. 3 Max. 10 Max. 15 to 25 40+ 10 to 15 20 - #80 5 Max.
10 Max. w/ Fine & V.F. 10 Max. 65 to 85 Optimum 10 Max. w/Silt & Clay
Reviewed by: ______________________________

I.S.T.R.C. Form: Textural Analysis ISTRC SYSTEM is a Registered Trademark of I.S.T.R.C.
Copyright 1994 by I.S.T.R.C. Patents 5,668,306 - 5,672,813 - 5,672,814
I.S.T.R.C.International Sports Turf Research Center, Inc." Page: 2
11372 Strang Line Rd. Phone: 913-829-8873Lenexa, KS 66215 Phone: 800-362-8873
Fax: 913-829-4013
Company: PARKLAND GOLF CLUBName: Mr. Francis G. McKee Jr., GCS Account No. 9548804Address: 10101 Trails End Road Date 3-Feb-10City, ST, Zip Parkland, FL 33076 Facility Parkland G.C.
ISTRC Rep. Mr. Nat Hubbard
Textural Analysis Sand Particle Size Distribution
Sand Silt Clay Gravel Very Coarse Coarse Medium Medium Med/Fine Fine Very FineUSDA (mm) .05 to 2.00 .002 to .05 <.002 2.00 1.00 0.50 0.25 0.18 0.15 0.10 0.05U.S. Sieve (mesh) 270 to 18 (Pan) (Pan) 10 18 35 60 80 100 140 270
LAB ID NO. SAMPLE NAME % Retained on Sieve10010005-G17 .25 - 1.0 in. 97.46 1.22 1.22 0.10 2.57 41.05 35.85 10.82 4.57 2.00 0.60Green #17 1.0 - 2.0 in. 98.34 0.01 1.50 0.15 1.10 50.40 35.75 6.92 2.17 1.55 0.45Center 2.0 - 3.0 in. 98.34 0.01 1.58 0.07 1.30 44.95 36.12 10.30 3.67 1.50 0.50
3.0 - 4.0 in. 98.82 0.01 1.17 0.00 0.85 46.00 37.85 8.65 2.60 2.22 0.65
10010005-PG .25 - 1.0 in. 97.59 0.01 1.78 0.62 3.42 39.52 35.12 11.37 5.22 2.32 0.62Putting Green 1.0 - 2.0 in. 97.94 0.02 1.92 0.12 2.90 38.60 37.75 11.70 3.47 2.85 0.67Center 2.0 - 3.0 in. 97.86 0.02 2.12 0.00 0.57 36.27 40.37 12.90 5.05 2.05 0.65
3.0 - 4.0 in. 98.83 0.01 1.16 0.00 1.02 45.85 39.47 8.02 2.27 1.80 0.40
USGA 89 to 100 5 Max. 3 Max. 3 Max. 10 Max. At Least 60 20 Max. 5 Max.Recommended Specifications 10 Max. w/ Fine & V.F. 10 Max. 10 Max. w/Silt & ClayISTRC Guidelines 89 to 100 5 Max. 3 Max. 3 Max. 10 Max. 15 to 25 40+ 10 to 15 20 - #80 5 Max.
10 Max. w/ Fine & V.F. 10 Max. 65 to 85 Optimum 10 Max. w/Silt & Clay
Reviewed by: ______________________________

ISTRC International Sports Turf Research Center
Aerification Displacement Chart
Tine Size 1.25” x 1.25” Centers
1.5” x 1.5” Centers
2.0” x 2.0” Centers
2.5” x 2.5” Centers
5” x 5” Centers
¼” Hollow Tines 3.14% 2.18% 1.23% 0.79% 3/8” Hollow Tines 7.07% 4.91% 2.76% 1.77% ½” Hollow Tines 12.57% 8.73% 4.91% 3.14% 5/8” Hollow Tines 13.64% 7.67% 4.91% 5/8” Hollow Vertidrain 1.23% ¾” Hollow Tines 7.07% 1.77% ¾” Hollow Vertidrain 1.77% 1” Hollow Tines 3.14% 1” Hollow Vertidrain 3.14% 7/8” Drill & Fill (7” Ctrs) 1.23% Graden Verticutter (15 Blades @ 1” Spacings)
1mm Blade 3.93%
2mm Blade7.87%
3mm Blade11.81%
Note: 1/4" Quadtines remove as much material as Regular 1/2" Hollow Tines 3/8” minimum for ease of topdressing fill if replacement of material is required For double aerification make two passes at approx. 37° (slightly less than 45°) to minimize overlap