
Your Patient Had A VTE – What Went Wrong?
51
ROOT CAUSE ANALYSIS & HOSPITAL-ACQUIRED VTE Artemis Diamantouros, Lynn Riley, Valentine Valenzuela, Bill Geerts April 16 th , 2015 “Your patient had a VTE – what went wrong?”
-
Upload
canadian-patient-safety-institute -
Category
Healthcare
-
view
135 -
download
0
Transcript of Your Patient Had A VTE – What Went Wrong?
ROOT CAUSE ANALYSIS &
HOSPITAL-ACQUIRED VTE
Artemis Diamantouros, Lynn Riley,
Valentine Valenzuela, Bill Geerts
April 16th, 2015
“Your patient had a VTE – what went wrong?”

Welcome to our francophone attendees
Bienvenue à nos participants francophones Hélène Riverin Conseillère en sécurité et en amélioration Safety Improvement Advisor
Objectives
By the end of this call, you will be able to:
1. Describe the processes of Root-Cause Analysis
(RCA) and Multi-Incident Analysis (MIA) and their
role in quality improvement
2. Compare and contrast the different approaches to
collecting hospital-acquired VTE data
3. Identify an approach suitable for improving patient
safety at your institution

Today’s Speakers
Bill Geerts Artemis Diamantouros Lynn Riley Valentine Valenzuela
Agenda
1. Brief primer on root cause analysis (RCA)
2. Measuring performance in VTE prevention
3. Using RCA in VTE prevention quality improvement
Root Cause Analysis (also called Incident Analysis)
Lynn Riley, RN
ISMP Canada
ISMP Canada
ISMP Canada is an independent not-for-profit organization dedicated to reducing preventable harm from medications.
Our goal is the creation of safe and reliable systems for managing medications in all environments.
www.ismp-canada.org
www.cmirps-scdpim.ca
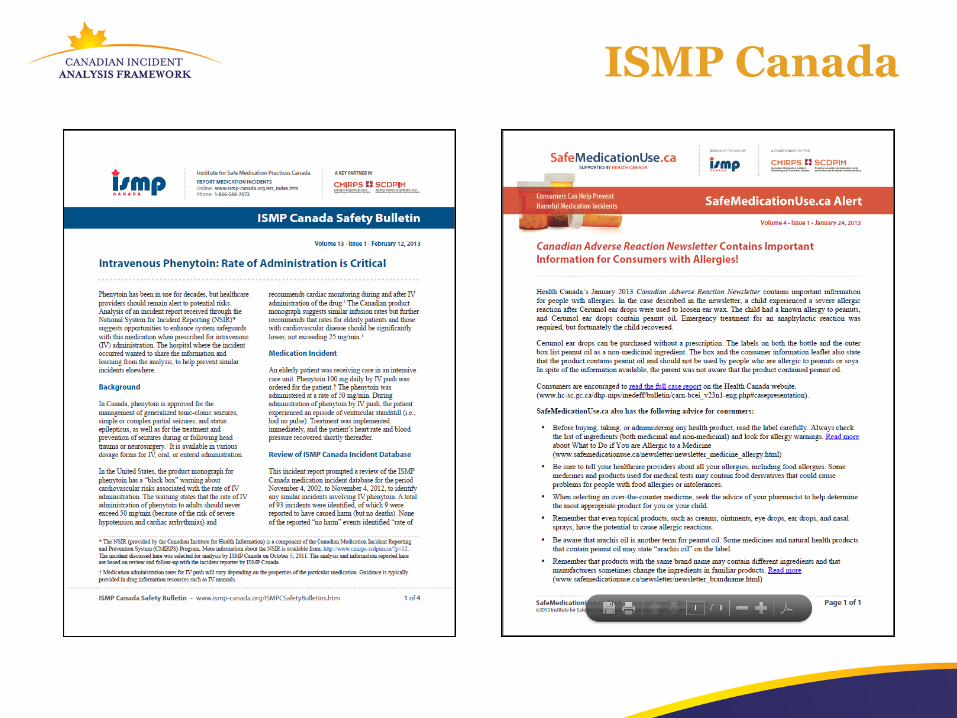
ISMP Canada
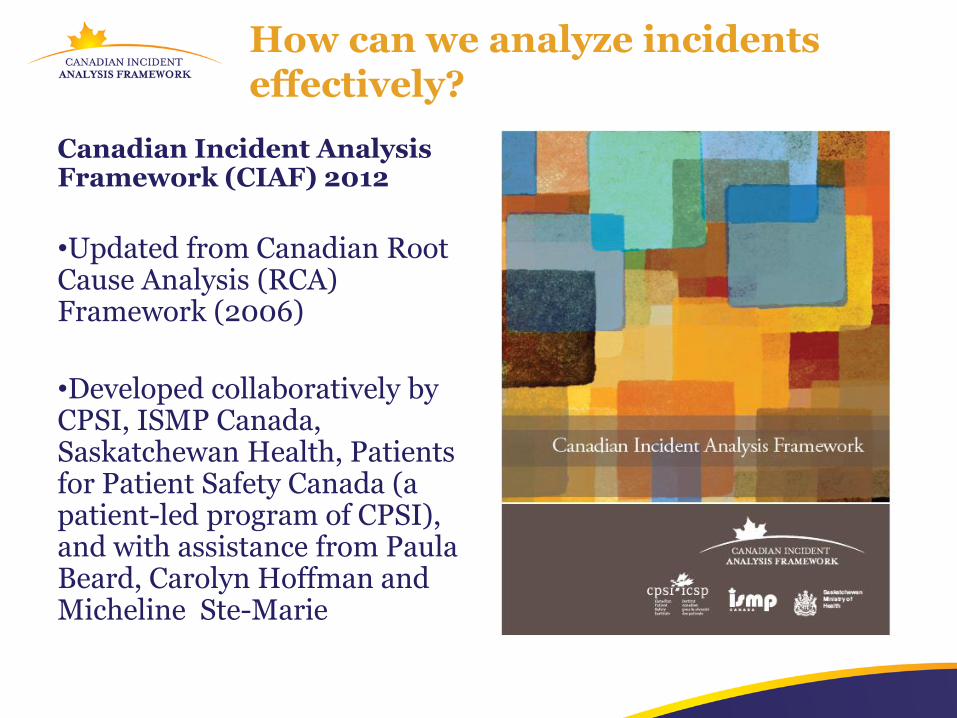
How can we analyze incidents effectively?
Canadian Incident Analysis Framework (CIAF) 2012
•Updated from Canadian Root Cause Analysis (RCA) Framework (2006)
•Developed collaboratively by CPSI, ISMP Canada, Saskatchewan Health, Patients for Patient Safety Canada (a patient-led program of CPSI), and with assistance from Paula Beard, Carolyn Hoffman and Micheline Ste-Marie
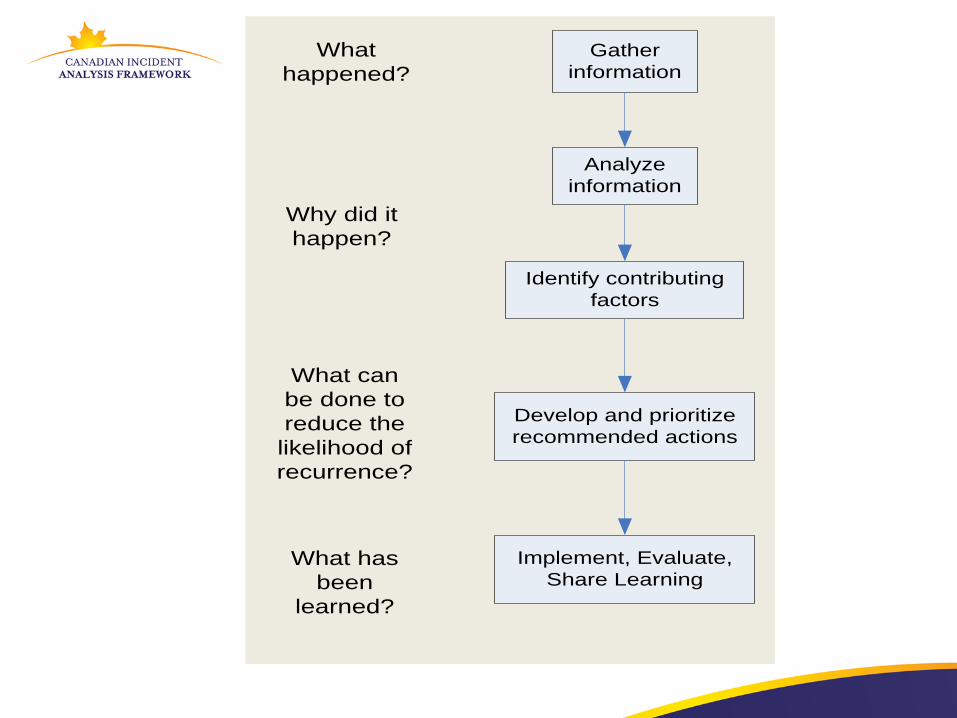
Gather
information
Analyze
information
Identify contributing
factors
Develop and prioritize
recommended actions
What
happened?
Why did it
happen?
What can
be done to
reduce the
likelihood of
recurrence?
Implement, Evaluate,
Share LearningWhat has
been
learned?
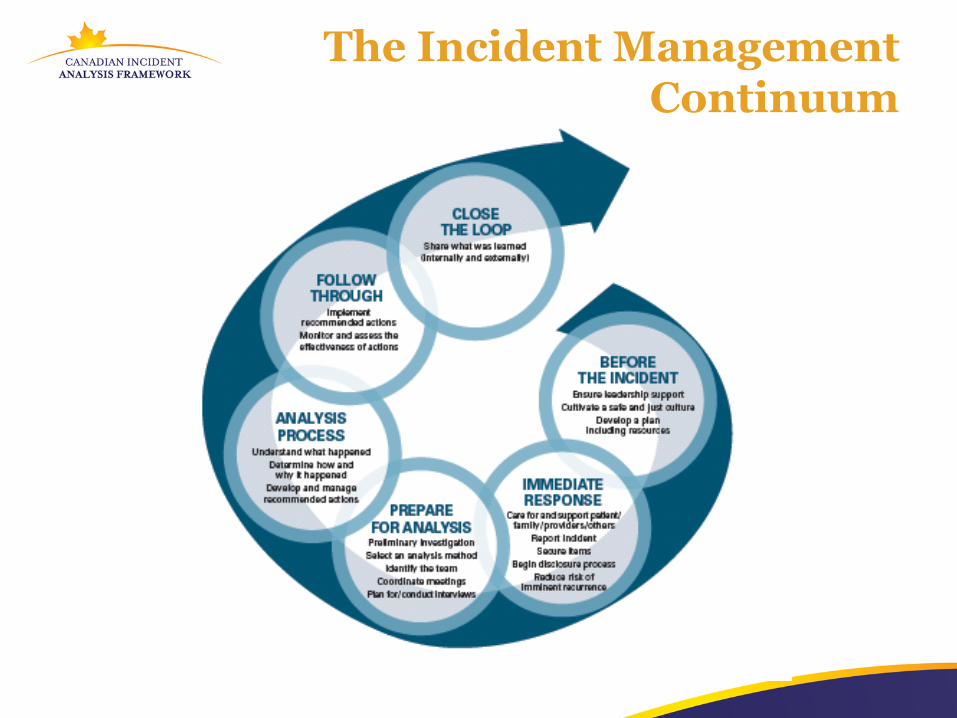
The Incident Management Continuum
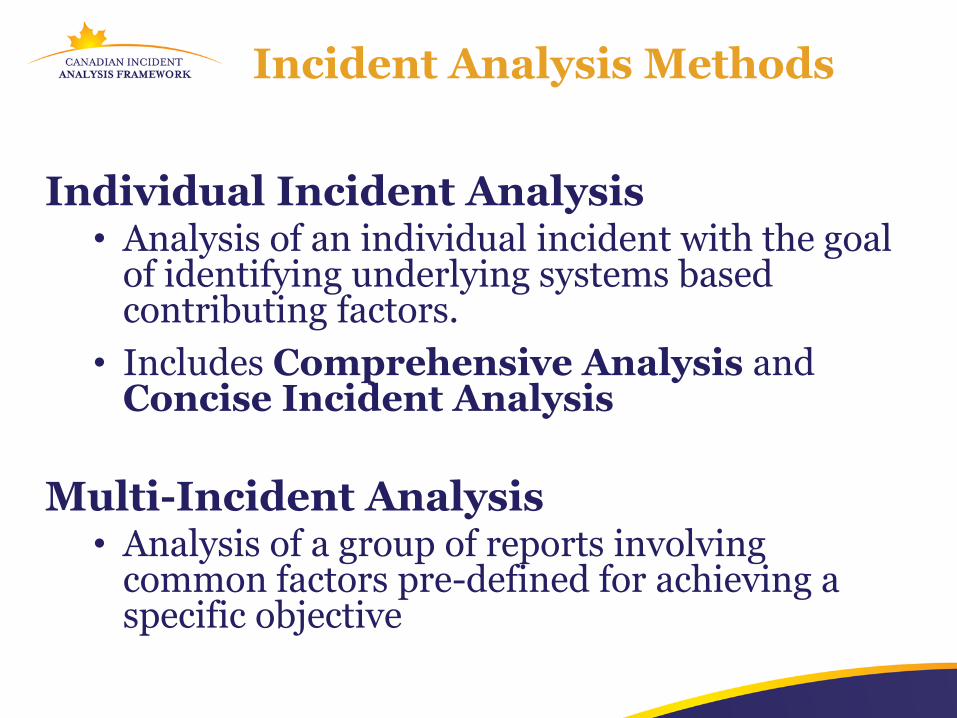
Incident Analysis Methods
Individual Incident Analysis • Analysis of an individual incident with the goal
of identifying underlying systems based contributing factors.
• Includes Comprehensive Analysis and Concise Incident Analysis
Multi-Incident Analysis • Analysis of a group of reports involving
common factors pre-defined for achieving a specific objective
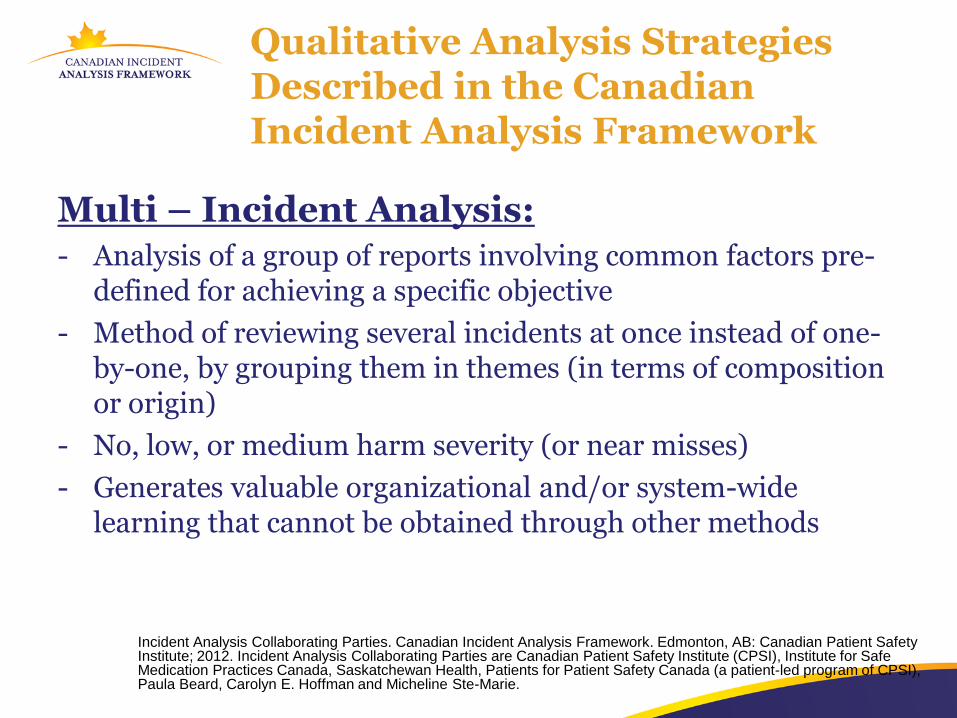
Qualitative Analysis Strategies Described in the Canadian Incident Analysis Framework
Multi – Incident Analysis:
- Analysis of a group of reports involving common factors pre-defined for achieving a specific objective
- Method of reviewing several incidents at once instead of one-by-one, by grouping them in themes (in terms of composition or origin)
- No, low, or medium harm severity (or near misses)
- Generates valuable organizational and/or system-wide learning that cannot be obtained through other methods
Incident Analysis Collaborating Parties. Canadian Incident Analysis Framework. Edmonton, AB: Canadian Patient Safety Institute; 2012. Incident Analysis Collaborating Parties are Canadian Patient Safety Institute (CPSI), Institute for Safe Medication Practices Canada, Saskatchewan Health, Patients for Patient Safety Canada (a patient-led program of CPSI), Paula Beard, Carolyn E. Hoffman and Micheline Ste-Marie.
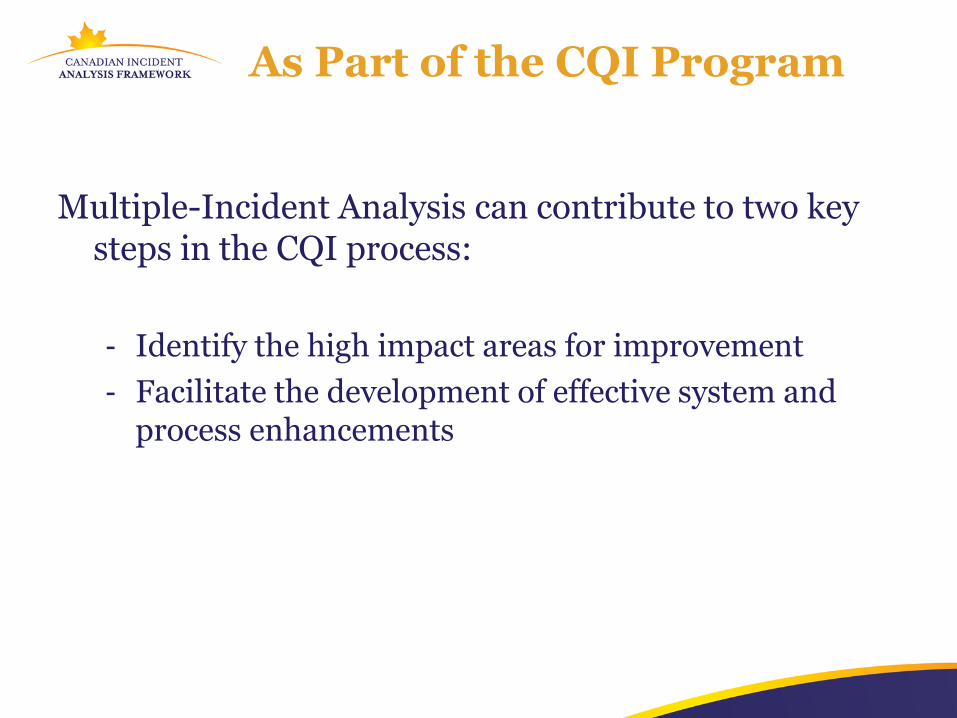
As Part of the CQI Program
Multiple-Incident Analysis can contribute to two key steps in the CQI process:
- Identify the high impact areas for improvement
- Facilitate the development of effective system and process enhancements
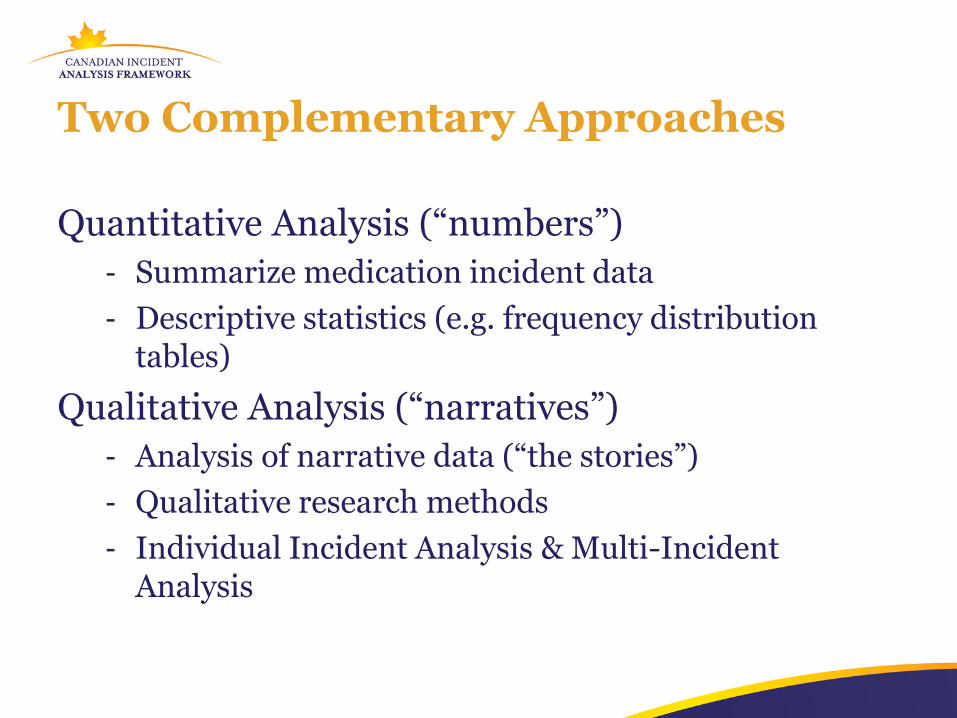
Two Complementary Approaches
Quantitative Analysis (“numbers”)
- Summarize medication incident data
- Descriptive statistics (e.g. frequency distribution tables)
Qualitative Analysis (“narratives”)
- Analysis of narrative data (“the stories”)
- Qualitative research methods
- Individual Incident Analysis & Multi-Incident Analysis
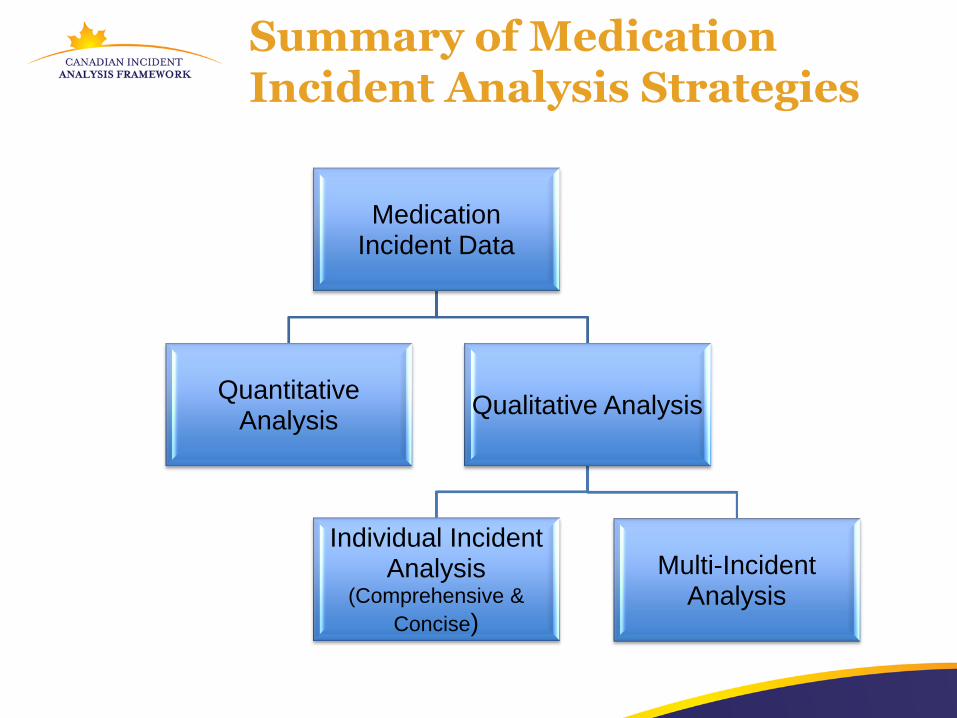
Summary of Medication Incident Analysis Strategies
Medication Incident Data
Quantitative Analysis
Qualitative Analysis
Individual Incident Analysis
(Comprehensive &
Concise)
Multi-Incident Analysis
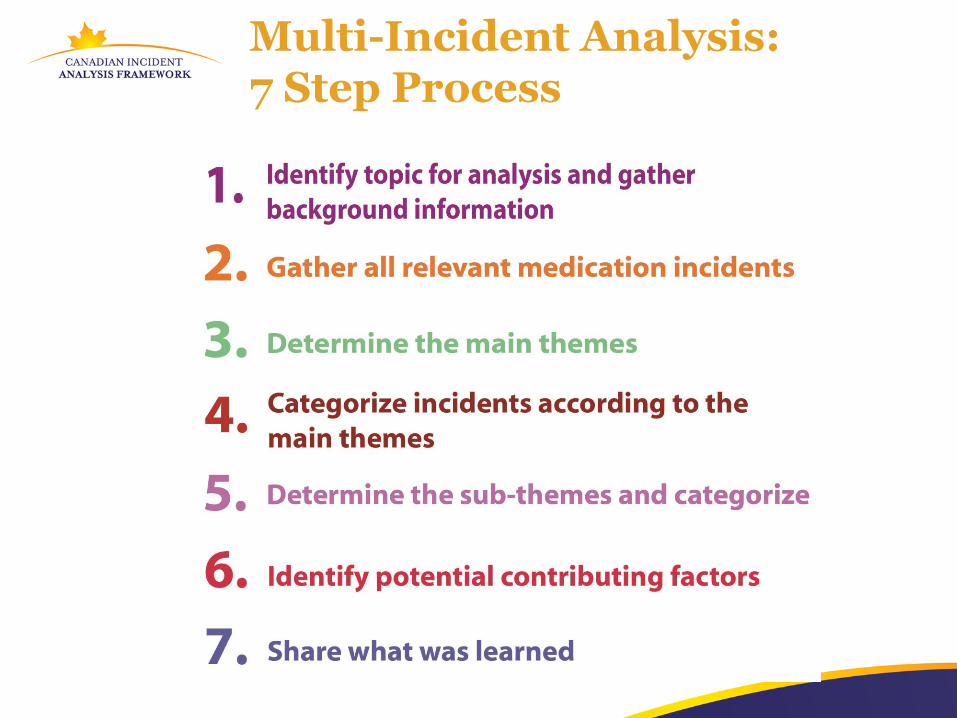
Multi-Incident Analysis: 7 Step Process
Summary
Multi-Incident Analysis: Analysis of the narrative data fields on a group of reports involving a common pre-defined factor
Maximizes analysis efficiency (analysis of a group of incidents at a time)
7 Step Process
ISMP Canada Workshops
May 20, 2015 Multi-Incident Analysis Workshop – Toronto
May 22, 2015 Incident Analysis Framework: Train-the-Trainer Workshop (For PSEP – Canada Trainers in Ontario LHIN 14) - Thunder Bay, ON
June 11-12, 2015 RCA/FMEA for pharmacy practice - Toronto
Request a Customized RCA/Incident Analysis Workshops in English or French
Tools
The Hospital Self-Assessment for Anticoagulant Safety (HSASAS) is designed to:
Heighten awareness of best practices with respect to anticoagulant safety
Create a baseline for hospital efforts to enhance the safety of anticoagulant use and assess progress with respect to these strategies and practices over time.
https://mssa.ismp-canada.org/hsasas
We encourage you to report medication incidents
Practitioner Reporting https://www.ismp-canada.org/err_report.htm Consumer Reporting www.safemedicationuse.ca/
Thank you
Lynn Riley
2. Measuring performance in
VTE prevention
Bill Geerts, MD, FRCPC
Thrombosis Consultant, Sunnybrook Health
Sciences Centre;
Professor of Medicine, University of Toronto;
National Lead, VTE Prevention, Safer Healthcare Now!
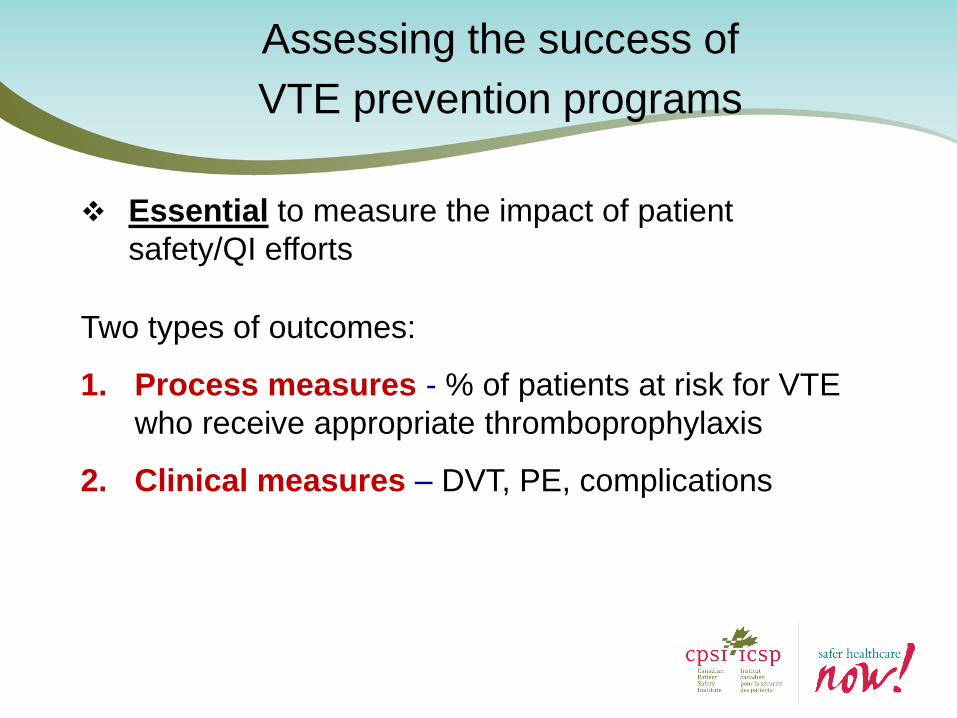
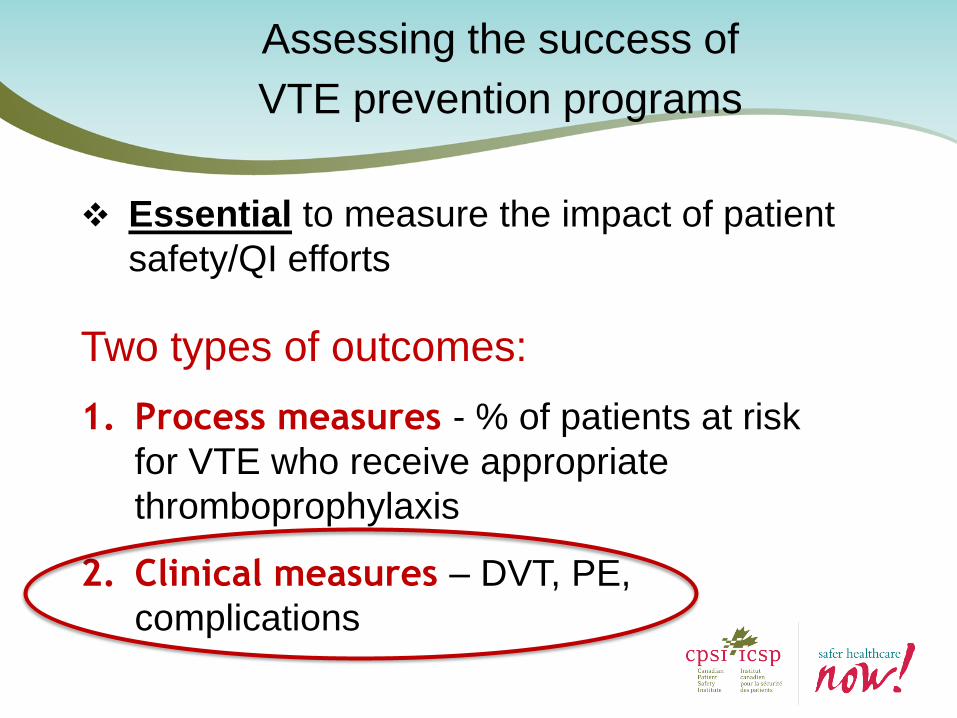
Assessing the success of
VTE prevention programs
Essential to measure the impact of patient
safety/QI efforts
Two types of outcomes:
1. Process measures - % of patients at risk for VTE
who receive appropriate thromboprophylaxis
2. Clinical measures – DVT, PE, complications
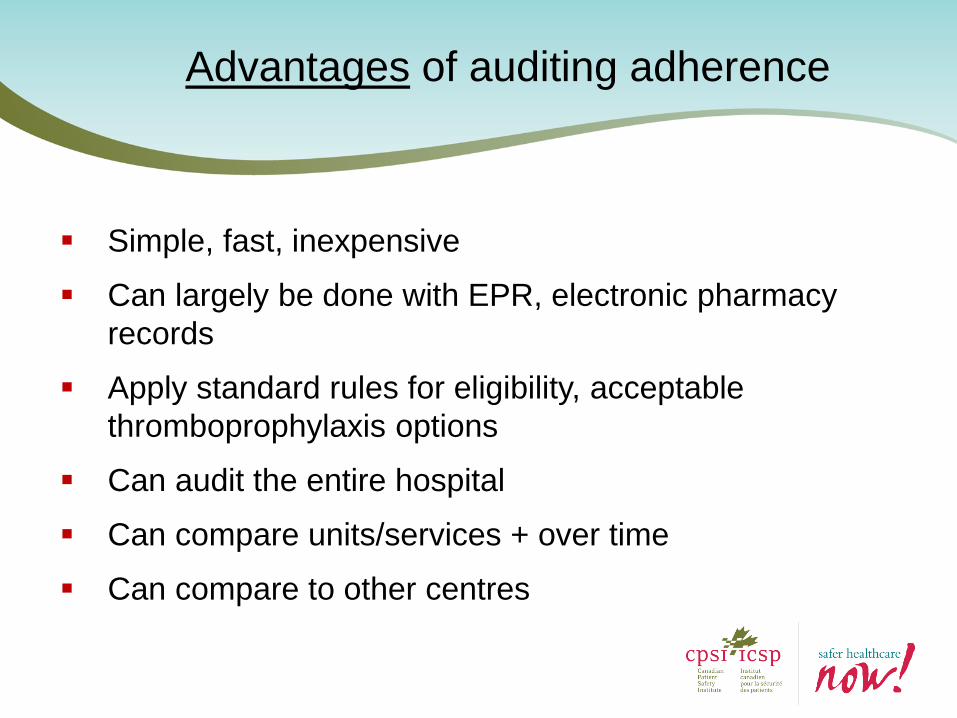
Advantages of auditing adherence
Simple, fast, inexpensive
Can largely be done with EPR, electronic pharmacy
records
Apply standard rules for eligibility, acceptable
thromboprophylaxis options
Can audit the entire hospital
Can compare units/services + over time
Can compare to other centres
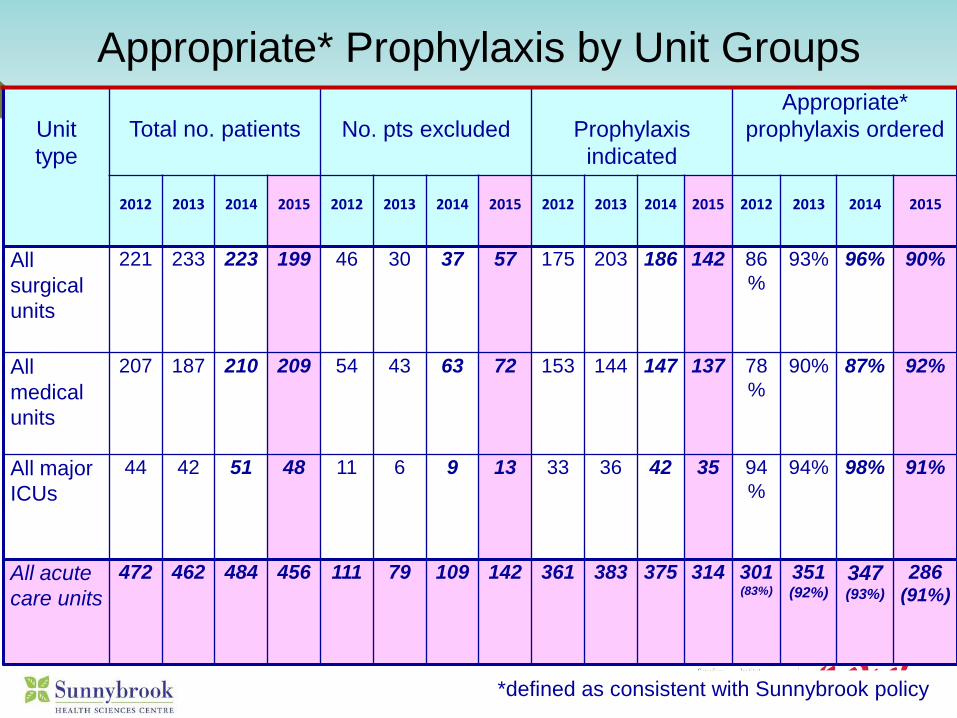
Unit
type
Total no. patients
No. pts excluded
Prophylaxis
indicated
Appropriate*
prophylaxis ordered
2012
2013
2014
2015
2012
2013
2014
2015
2012
2013
2014
2015
2012
2013
2014
2015
All
surgical
units
221 233 223 199 46 30 37 57 175 203 186 142 86
%
93% 96% 90%
All
medical
units
207 187 210 209 54 43 63 72 153 144 147 137 78
%
90% 87% 92%
All major
ICUs
44 42 51 48 11 6 9 13 33 36 42 35 94
%
94% 98% 91%
All acute
care units
472 462 484 456 111 79 109 142 361 383 375 314 301 (83%)
351 (92%)
347 (93%)
286 (91%)
Appropriate* Prophylaxis by Unit Groups
*defined as consistent with Sunnybrook policy
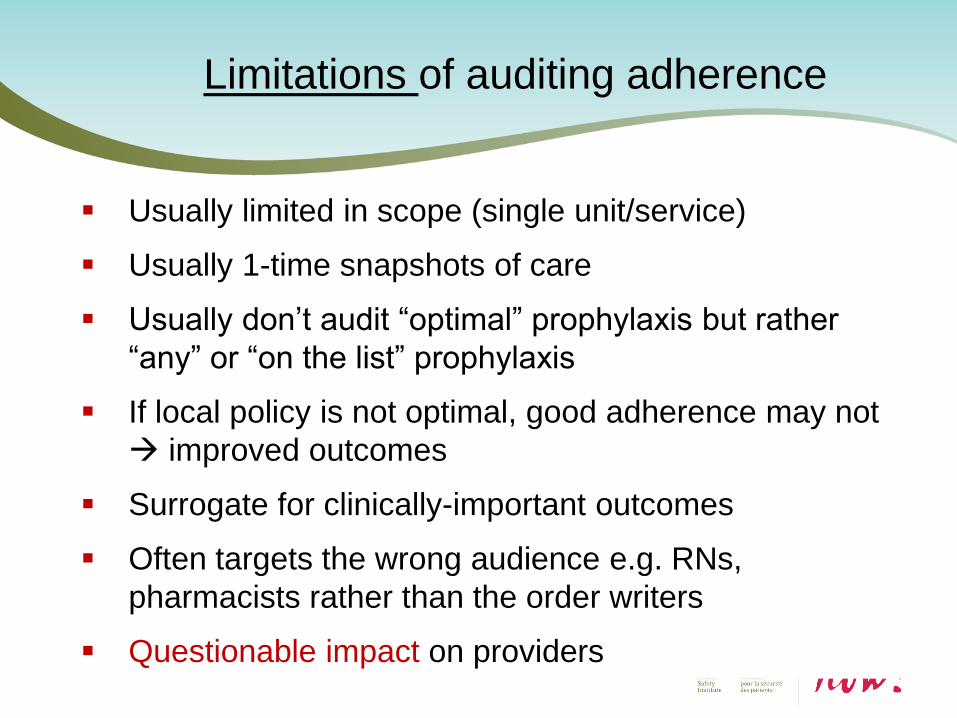
Limitations of auditing adherence
Usually limited in scope (single unit/service)
Usually 1-time snapshots of care
Usually don’t audit “optimal” prophylaxis but rather
“any” or “on the list” prophylaxis
If local policy is not optimal, good adherence may not
improved outcomes
Surrogate for clinically-important outcomes
Often targets the wrong audience e.g. RNs,
pharmacists rather than the order writers
Questionable impact on providers
Assessing the success of
VTE prevention programs
Essential to measure the impact of patient
safety/QI efforts
Two types of outcomes:
1. Process measures - % of patients at risk
for VTE who receive appropriate
thromboprophylaxis
2. Clinical measures – DVT, PE,
complications
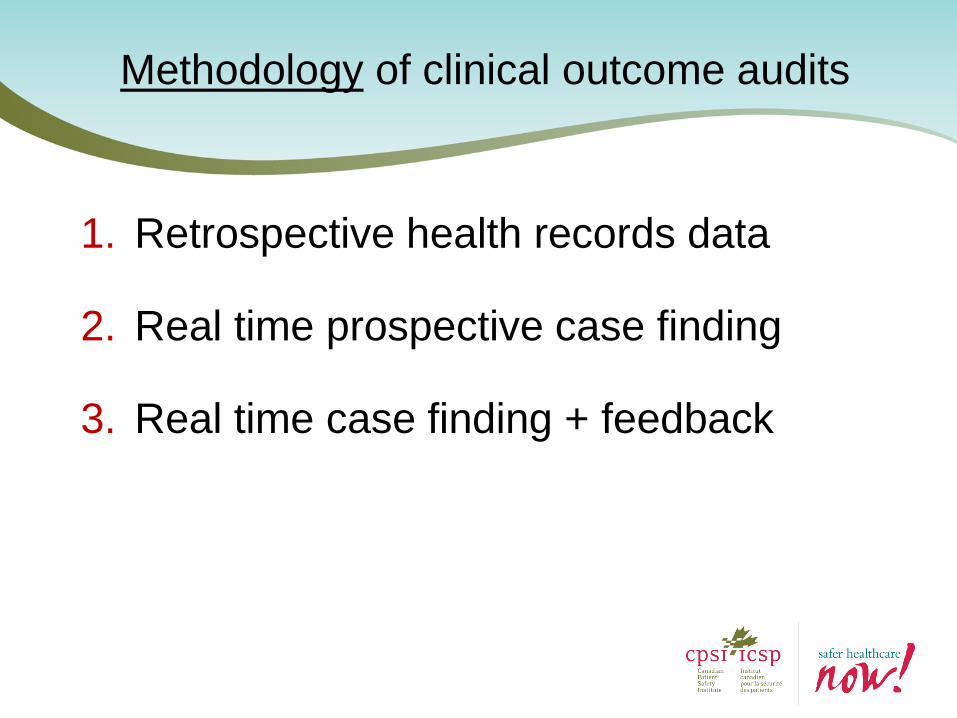
Methodology of clinical outcome audits
1. Retrospective health records data
2. Real time prospective case finding
3. Real time case finding + feedback
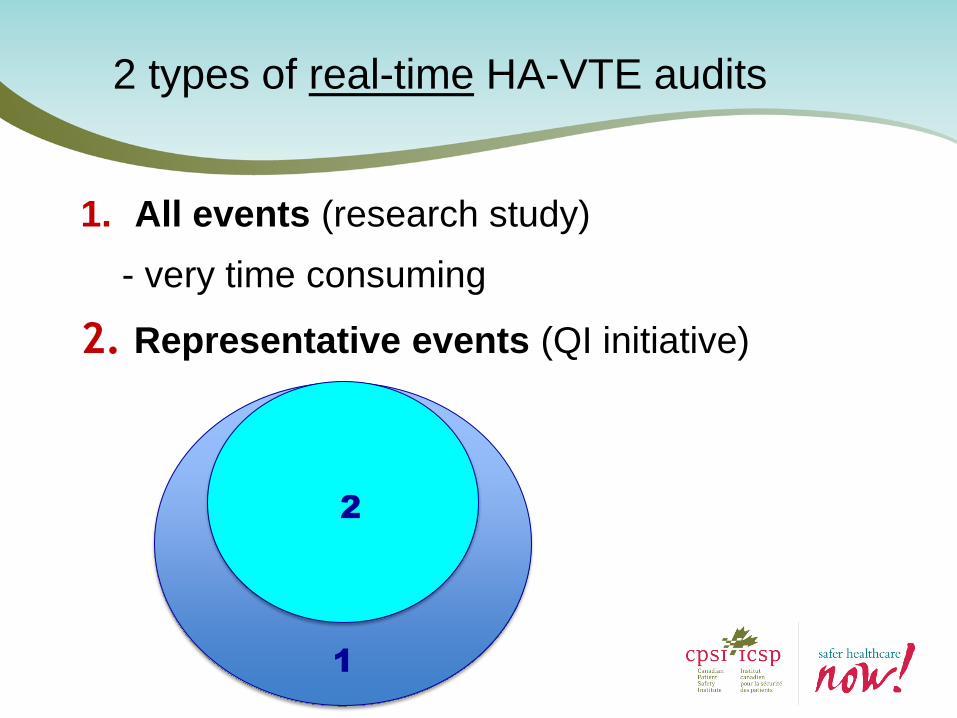
2 types of real-time HA-VTE audits
1. All events (research study)
- very time consuming
2. Representative events (QI initiative)
1
2
Limitations of auditing clinical outcomes
(VTE)
Difficult to find all cases of HA-VTE
Resource intensive to find cases, review
details, do root cause analysis
Many HA-VTE occur after discharge
Relatively small numbers per unit - may
be “underwhelmed” by results
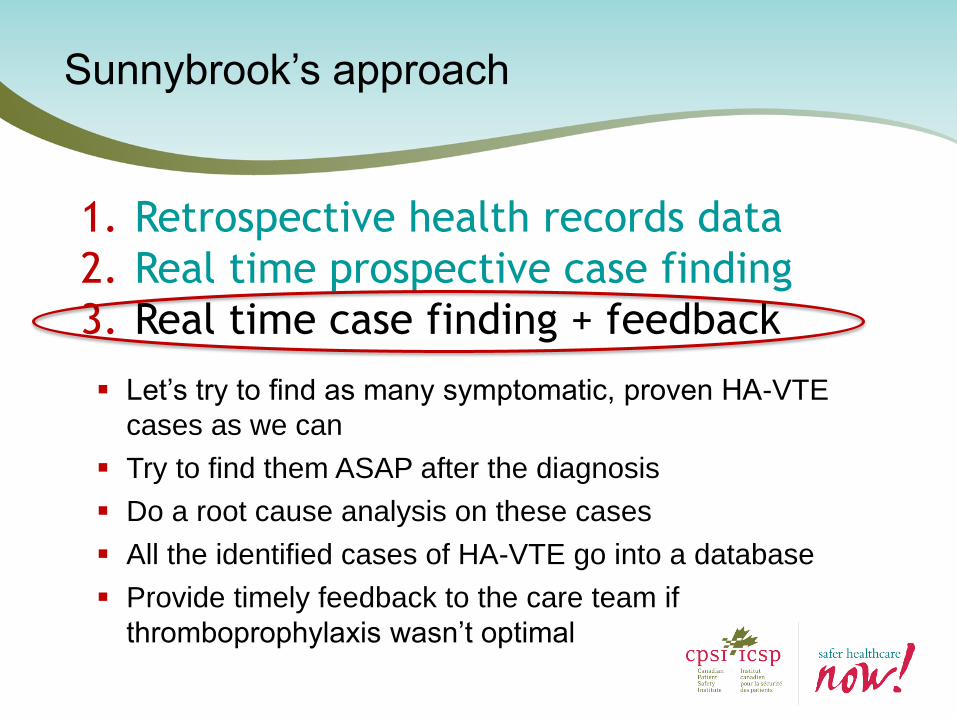
Sunnybrook’s approach
1. Retrospective health records data
2. Real time prospective case finding
3. Real time case finding + feedback
Let’s try to find as many symptomatic, proven HA-VTE
cases as we can
Try to find them ASAP after the diagnosis
Do a root cause analysis on these cases
All the identified cases of HA-VTE go into a database
Provide timely feedback to the care team if
thromboprophylaxis wasn’t optimal
3. Using RCA in VTE prevention
quality improvement
Val Valenzuela, RN
Thrombosis nurse, Sunnybrook HSC
Artemis Diamantouros, BScPhm, PhD
Knowledge Translation pharmacist, Sunnybrook HSC; National Coordinator VTE Prevention, Safer Healthcare Now!
VTE QI in real time
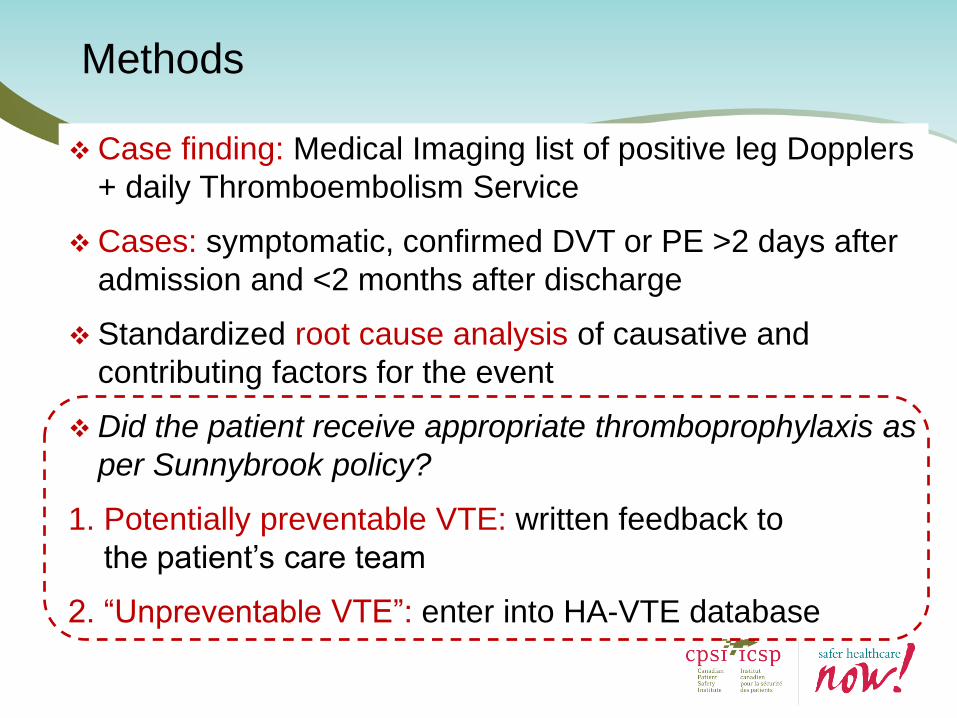
Methods
Case finding: Medical Imaging list of positive leg Dopplers
+ daily Thromboembolism Service
Cases: symptomatic, confirmed DVT or PE >2 days after
admission and <2 months after discharge
Standardized root cause analysis of causative and
contributing factors for the event
Did the patient receive appropriate thromboprophylaxis as
per Sunnybrook policy?
1. Potentially preventable VTE: written feedback to
the patient’s care team
2. “Unpreventable VTE”: enter into HA-VTE database
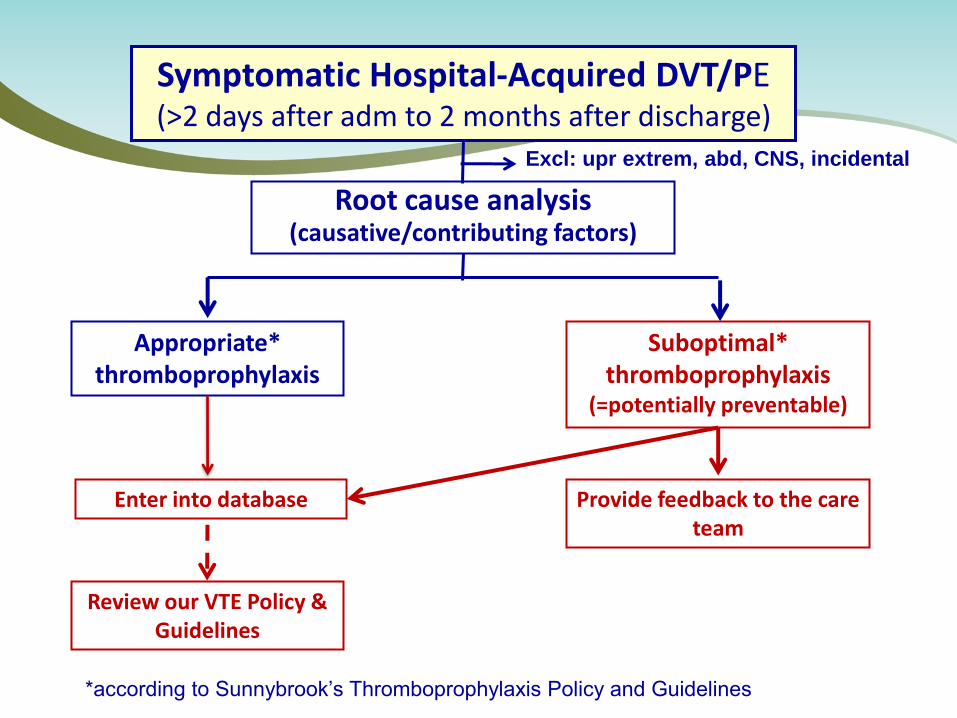
Symptomatic Hospital-Acquired DVT/PE (>2 days after adm to 2 months after discharge)
Appropriate* thromboprophylaxis
Suboptimal* thromboprophylaxis
(=potentially preventable)
Root cause analysis (causative/contributing factors)
Provide feedback to the care team
Enter into database
Review our VTE Policy & Guidelines
*according to Sunnybrook’s Thromboprophylaxis Policy and Guidelines
Excl: upr extrem, abd, CNS, incidental
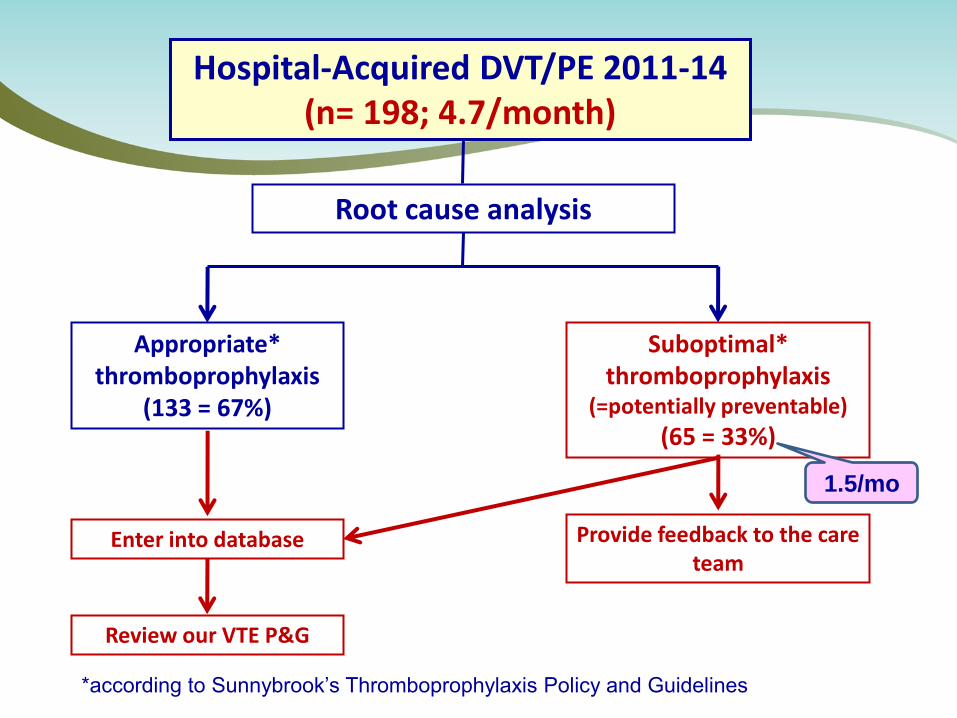
Hospital-Acquired DVT/PE 2011-14 (n= 198; 4.7/month)
Appropriate* thromboprophylaxis
(133 = 67%)
Suboptimal* thromboprophylaxis
(=potentially preventable)
(65 = 33%)
Root cause analysis
Provide feedback to the care team
Enter into database
Review our VTE P&G
1.5/mo
*according to Sunnybrook’s Thromboprophylaxis Policy and Guidelines
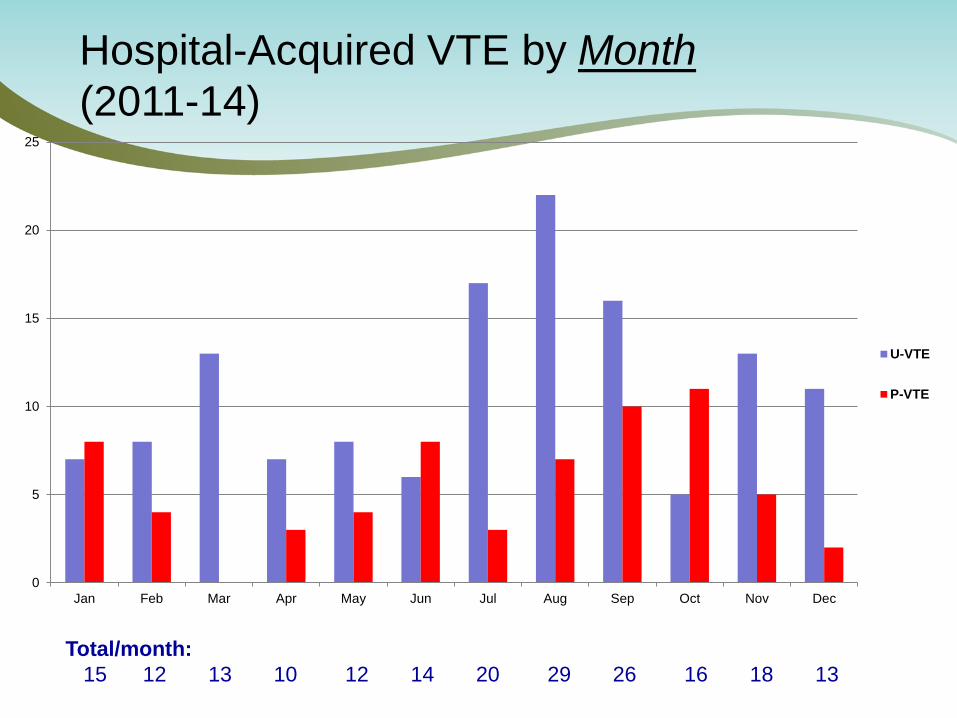
0
5
10
15
20
25
Jan Feb Mar Apr May Jun Jul Aug Sep Oct Nov Dec
U-VTE
P-VTE
Hospital-Acquired VTE by Month
(2011-14)
Total/month:
15 12 13 10 12 14 20 29 26 16 18 13
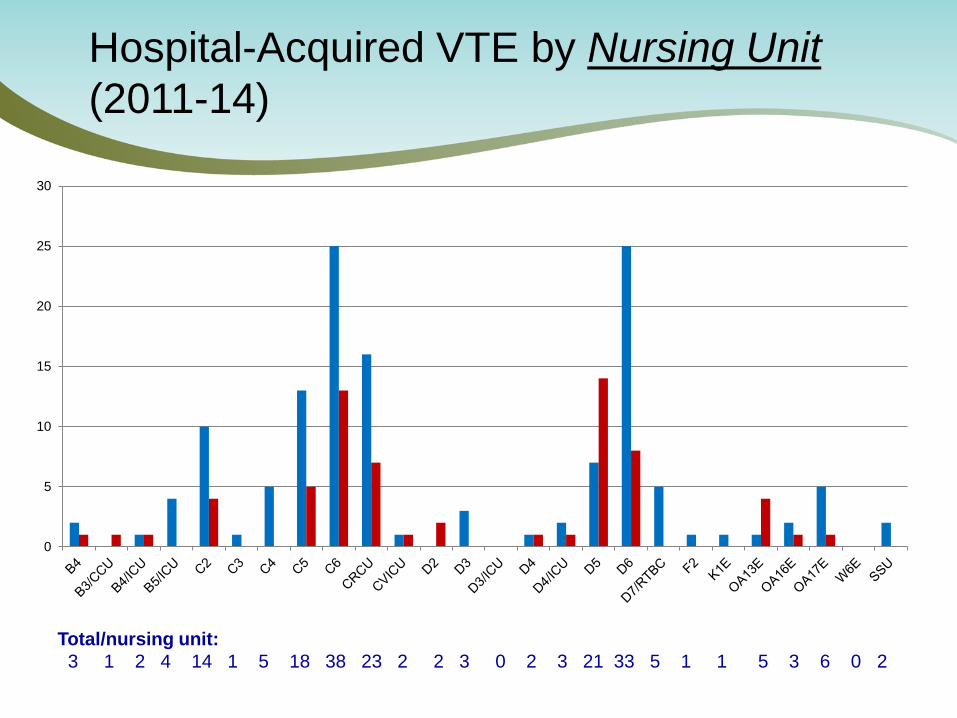
0
5
10
15
20
25
30
Hospital-Acquired VTE by Nursing Unit
(2011-14)
Total/nursing unit:
3 1 2 4 14 1 5 18 38 23 2 2 3 0 2 3 21 33 5 1 1 5 3 6 0 2
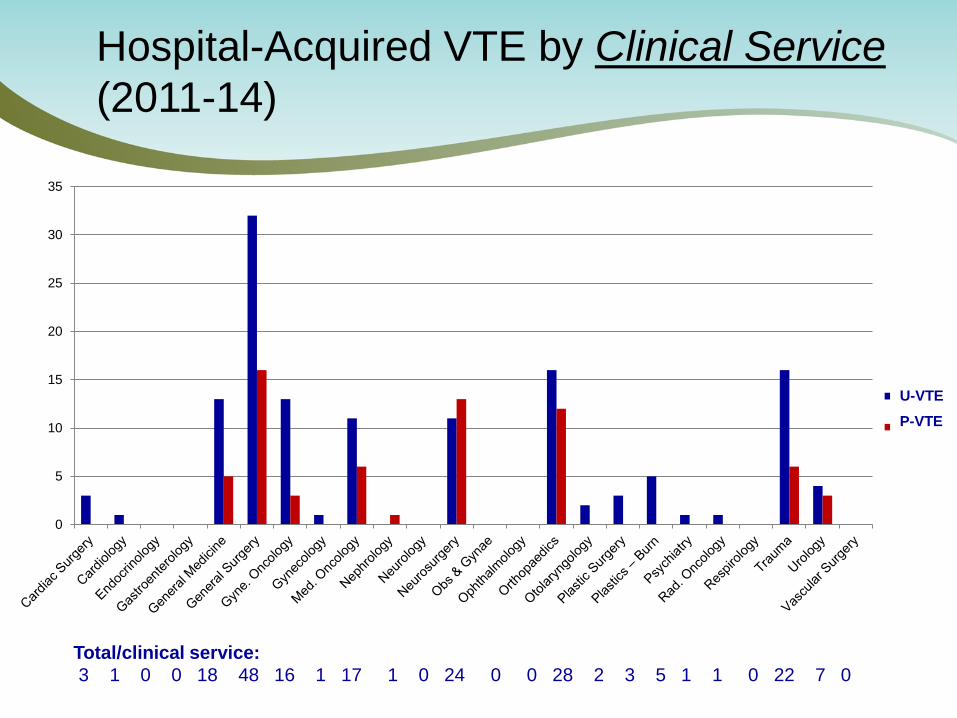
0
5
10
15
20
25
30
35
Series1
Series2
Hospital-Acquired VTE by Clinical Service
(2011-14)
U-VTE
P-VTE
Total/clinical service:
3 1 0 0 18 48 16 1 17 1 0 24 0 0 28 2 3 5 1 1 0 22 7 0
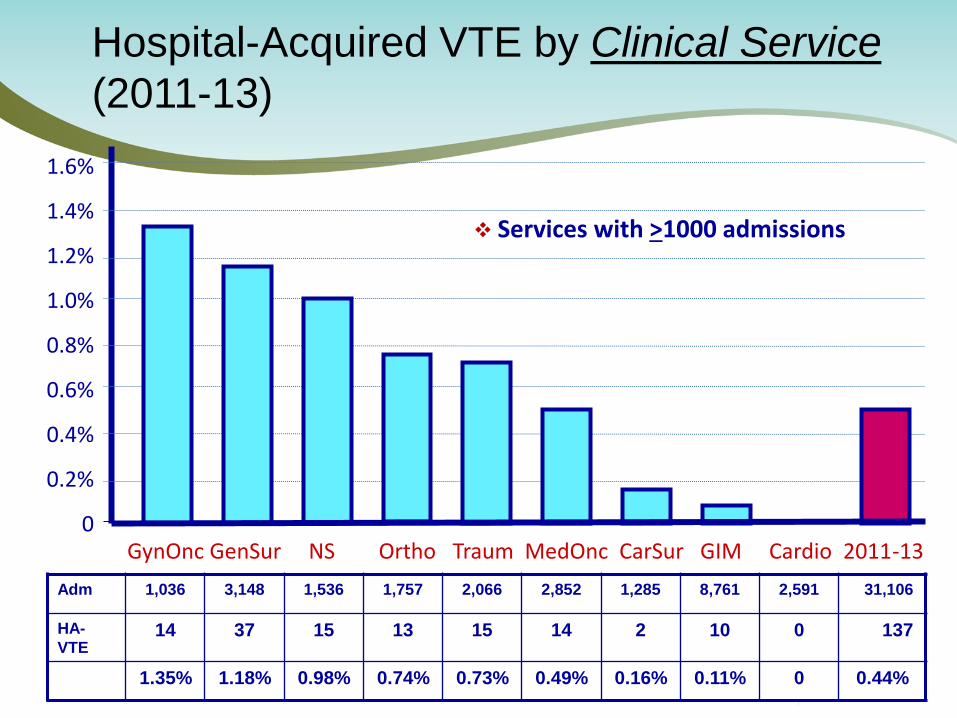
GynOnc GenSur NS Ortho Traum MedOnc CarSur GIM Cardio 2011-13
1.6%
1.4%
1.2%
1.0%
0.8%
0.6%
0.4%
0.2%
0
Adm 1,036 3,148 1,536 1,757 2,066 2,852 1,285 8,761 2,591 31,106
HA-
VTE 14 37 15 13 15 14 2 10 0 137
1.35% 1.18% 0.98% 0.74% 0.73% 0.49% 0.16% 0.11% 0 0.44%
Hospital-Acquired VTE by Clinical Service
(2011-13)
Services with >1000 admissions
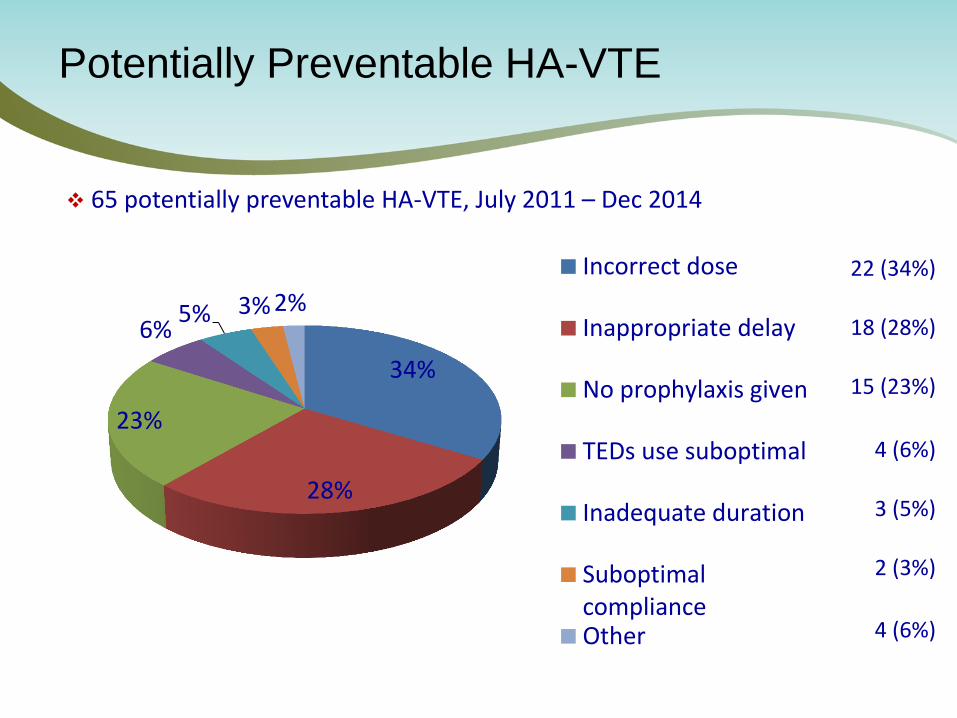
Potentially Preventable HA-VTE
65 potentially preventable HA-VTE, July 2011 – Dec 2014
22 (34%)
18 (28%)
15 (23%)
4 (6%)
3 (5%)
2 (3%)
4 (6%)
34%
28%
23%
6% 5% 3% 2%
Incorrect dose
Inappropriate delay
No prophylaxis given
TEDs use suboptimal
Inadequate duration
SuboptimalcomplianceOther
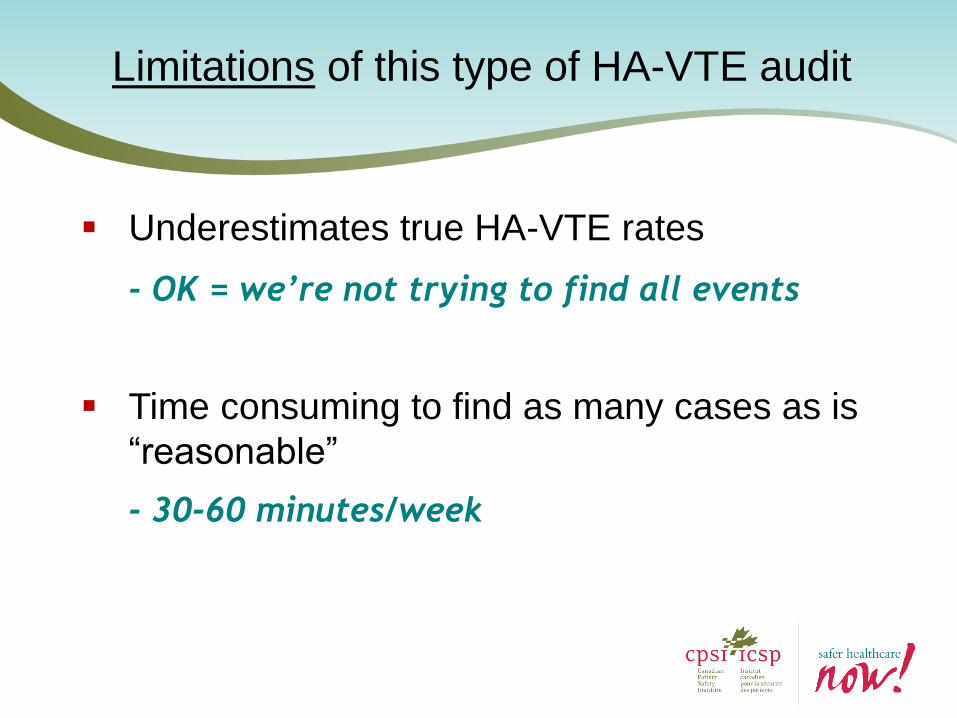
Limitations of this type of HA-VTE audit
Underestimates true HA-VTE rates
- OK = we’re not trying to find all events
Time consuming to find as many cases as is
“reasonable”
- 30-60 minutes/week
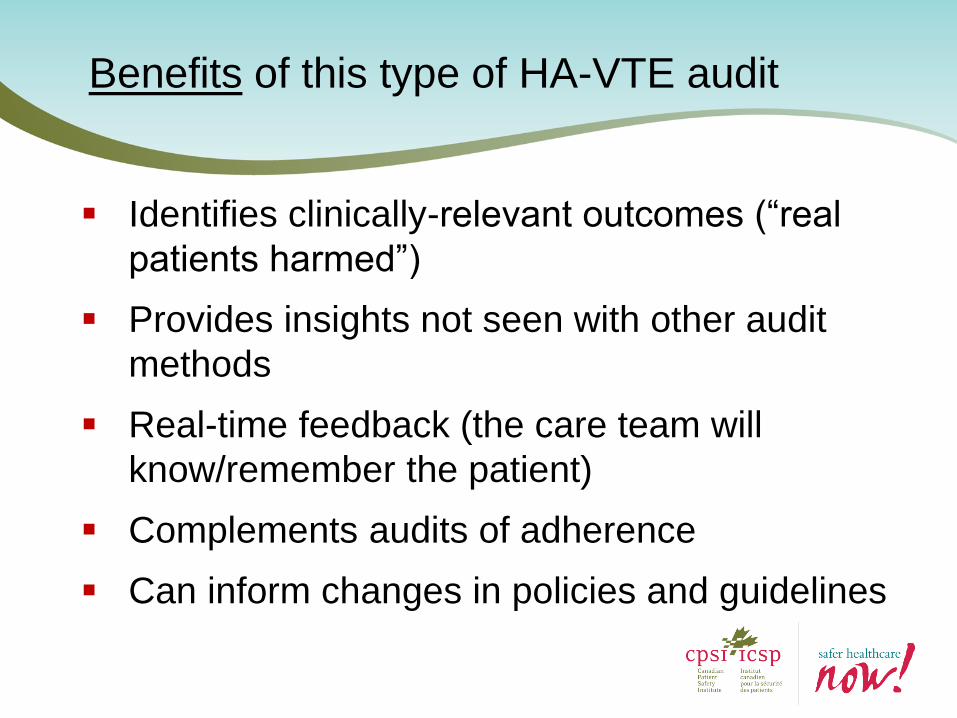
Benefits of this type of HA-VTE audit
Identifies clinically-relevant outcomes (“real
patients harmed”)
Provides insights not seen with other audit
methods
Real-time feedback (the care team will
know/remember the patient)
Complements audits of adherence
Can inform changes in policies and guidelines
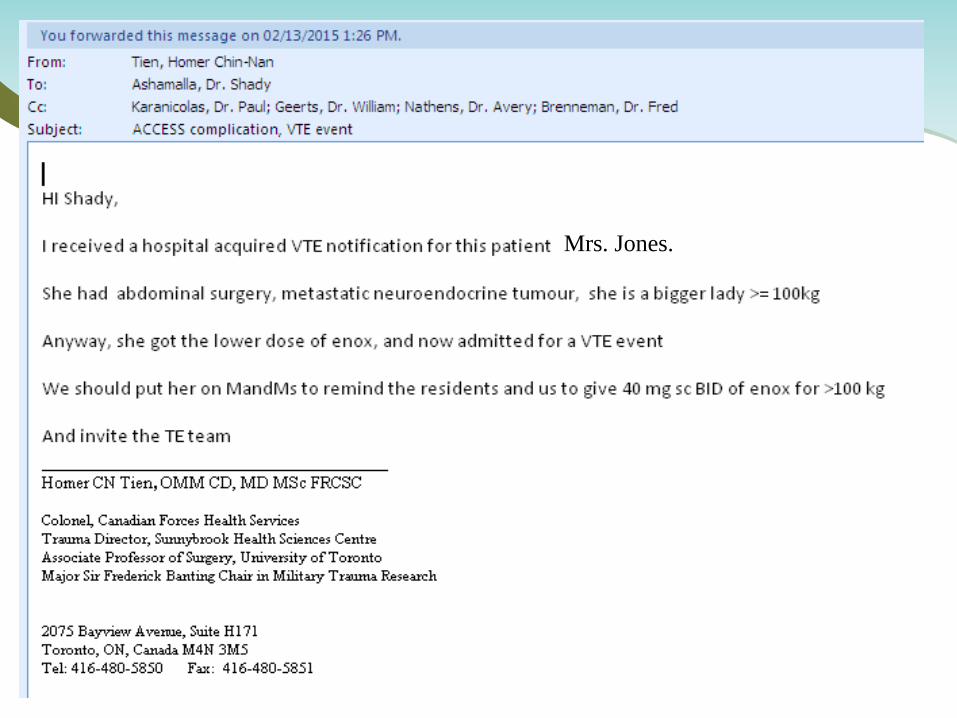
Mrs. Jones.
Take Home Messages
Root cause analysis is a powerful quality
improvement tool
- Individual incident
- Multi-incident
RCA can be used in VTE prevention QI
Provides unique insights into care and can be
used to help change culture
Keep up the great work – clots can be beaten!
“Taking the Pulse” Poll / Sondage
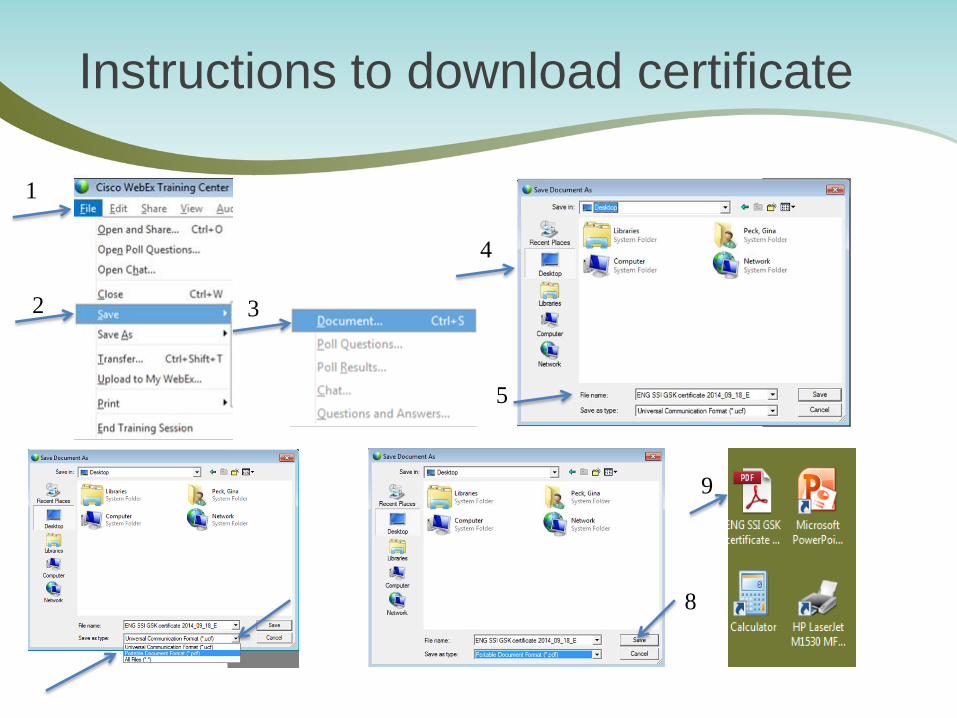
Instructions to download certificate
1
2 3
4
5
8
9
Thank you!
Questions; comments/suggestions
How can Safer Healthcare Now!
help you?
Artemis Diamantouros 416-480-6100 x 3654
Email: [email protected]
Bill Geerts
Email: [email protected]