Autoliv Develops Next Generation Alcohol Sensing System to Prevent Impaired Driving

1
YOUNG DRIVERS AND ALCOHOL IMPAIRED DRIVING: 1 A DRIVING SIMULATOR EXPERIMENT 2
3
4 Zoi Christoforou, Ph.D. 5
Research Associate, Department of Transportation Planning and Engineering, School of Civil 6 Engineering, National Technical University of Athens, Greece, e-mail: [email protected] 7
8 Matthew G. Karlaftis, Ph.D. 9
Associate Professor, Department of Transportation Planning and Engineering, School of Civil 10 Engineering, National Technical University of Athens, Greece, e-mail: [email protected] 11
12 George Yannis, Ph.D. 13
Associate Professor, Department of Transportation Planning and Engineering, School of Civil 14 Engineering, National Technical University of Athens, Greece, e-mail: [email protected] 15
16
17
ABSTRACT 18
19 Young individuals who drive under the influence of alcohol have a higher relative risk of crash 20 involvement; as such, the literature has extensively investigated the factors affecting such 21
involvement through post-accident surveys. The effects of alcohol consumption on young driver 22 behavior, however, have been largely unaddressed, mainly as a result of the difficulty in 23
collecting the necessary data. We explore young driver behavior under the influence of alcohol 24 using a driving simulator experiment where 40 participants were subjected to a common pre-25
defined dose of alcohol consumption. Comparing driver behavior before and after consumption 26 allows for interesting insights and suggestions regarding policy interventions. As expected, the 27 results indicate that increased reaction times before consuming alcohol strongly affect post-28
consumption reaction times, while increased BAC levels increase reaction times; a 10% increase 29 in BAC levels results in a 2% increase in reaction time. Interestingly, individuals with faster 30
alcohol consumption times perform better regardless of absolute BAC level, while recent meals 31 lead to higher reaction times and exercising to lower 32
33 Keywords: alcohol, impaired driving, reaction times, simulator, random-parameter regression 34
35
INTRODUCTION 36 37 Alcohol impaired driving has been repeatedly linked to high accident involvement rates and 38 severities (Mann et al. 2010; NHTSA, 2005; Williams, 2006). In the US, for example, alcohol-39
related accidents account for over 40% of total road accidents, while 32% of the fatally injured 40 drivers have blood alcohol concentrations (BACs)over 0.08%. (NHTSA, 2004).External costs of 41 DWI include rescue and hospitalization expenses, property damages and loss of productivity, 42
quality of life, and future earnings; Miller et al. (1999) estimated the cost/km driven sober to be 43 $0.07, while at Blood Alcohol Concentration (BAC)over 0.08 g/dL at $3.40.Young people who 44 drink and drive have a relatively higher risk of crash involvement compared for all BAC ranges 45 (Mayhew et al., 1986; Peck et al., 2008; Zador, 2000), and as a result lower BAC limits often 46
apply. Jenigan (2001) reports that drivers between 20 and 29 have a three times higher crash risk 47
2
involvement compared to drivers over 30, a possible result or relative inexperience with drinking, 48 with driving, and with combining these two (Williams, 2003). 49 50 Alcohol consumption and impaired driving have been extensively linked (Harrison and Fillmore, 51
2005). Alcohol consumption causes longer reaction times and breaking distances, inaccurate 52 steering, difficulties in perceiving roadway information and so on (Kuypers et al., 2006); 53 combining alcohol with drugs or fatigue further intensifies these effects (Banks et al., 2004; 54 Ramaekers et al., 2000).Alcohol‟s changes in cognitive reaction include exacerbation of fatigue 55 (NHTSA, 1998), decreased attention (Exum, 2006), changes in risk perception (Frick et al., 56
2000), and modification of cerebral activity (Aires Dominges et al., 2009). The magnitude of 57
alcohol-related effects also depends on driver attributes such as weight, gender, drinking 58
experience (Hiltunen 1997), and beverage type (Richman and Warren, 1985). 59 60 Despite the obvious interest in DWI and in the factors that affect driver behavior under the 61 influence of alcohol, very few studies have focused on the differentiated effect of alcohol on 62
driving performance among young people, possibly because of the difficulty in collecting the 63 necessary data. We explore young driver behavior under the influence of alcohol by means of a 64
driving simulator experiment that allows for the comparison of behavior before and after 65 consumption, and for interesting insights to be made regarding alcohol impaired driving. 66 67
BACKGROUND 68 69 Various road surveys, cross-sectional and case-control studies have shed light on the factors that 70 influence alcohol-related fatalities (Annex I includes a complete list of research on driving under 71
the influence of alcohol). Significant predictors include road and driving conditions such as road 72 type, lighting, and number of passengers; de Carvalho Ponce et al. (2011) found that most 73
alcohol-related accidents in Brasiloccur at nighttime and on weekends. In New Zealand, higher 74 traffic volume and illuminated roads appear to be significantly safer (Keall et al., 2005), while 75 the risk of fatal crashes at nighttime increases with the number of passengers for all BAC levels 76
(Keall et al., 2004). Novice drivers are more affected by alcohol consumption (Peck et al., 2008), 77 particularly during nighttime (Keall et al., 2004), while general risk-taking driver behavior 78
aggravates alcohol impairment (Horwood and Ferguson, 2000). Authors focusing on the general 79
tendency to drink and drive argue that in the US, members of fraternities, heavy drinkers, and 80 people with a history of alcohol abuse are more likely to drink and drive (LaBrie et al. 2011). 81 82
Studies using driving simulators to investigate drinking and driving have been scarce, 83 particularly considering the possible advantages of a controlled environment for such 84 investigations. Early simulator experiments in the US explored the effects of alcohol 85 consumption on driving behavior among University students. Alcohol was found to impair 86 abilities that are critical to driving such as braking and steering (Rimm et al., 1982), while “high 87
sensation seekers” were more likely to drive dangerously compared to “low sensation seekers” 88 while intoxicated (McMillen et al., 1989). The authors argued that “high sensation seekers” 89
interpret alcohol consumption as a justification for risk-taking. Gawron and Ranney (1990) 90 extended the age group to 55 to study the efficiency of spot treatments as potential alcohol 91 countermeasures; however, their results did not support this hypothesis. 92 93

3
In 2001, Arnedt et al. studied the effects of prolonged sleeplessness versus alcohol impairment 94 among eighteen Canadian males 19 and 35.Driving performance was measured in terms of speed 95 deviation, lane position, and off-road occurrences. The experiment showed that impairment is 96 evident even for low BACs. The authors suggest that extending sleeplessness by 3hours can 97
result to a reduced ability to maintain speed and road position equal to those found at the legal 98 BAC limits 99 100 Lenné et al. (2003) designed a simulator experiment to study the effects of the opioid 101 pharmacotherapies methadone, LAAM and buprenorphine, by themselves, as well as combined 102
with alcohol (around the 0.05% BAL). Participants were 10methadone, 13 LAAM, 11 103
buprenorphine stabilized clients, and 21 non-drug Australians. Simulated driving skills were 104
measured through standard deviations of lateral position, speed and steering wheel angle, and 105 reaction time. The authors argue that BAC at 0.05% impairs all measurements of driving 106 performance. Surprisingly, alcohol was found to have a more detrimental effect on speed and 107 steer deviation on straight road sections. 108
109 In another study, Leung and Starmer (2005) examined gap acceptance and risk-taking by young 110
and mature drivers using a simulator. 16 young and 16 mature drivers in Sydney were recruited 111 for the experiment; they consumed 0.6 g (if female) or 0.7 g (if male) of alcohol per kg of weight. 112 Driving tasks included other-vehicle detection, overtaking, and time-to-collision estimation. 113
Detection times were significantly lower with age, alcohol consumption and lower approaching 114
vehicle speeds particularly on curved road sections. Young drivers showed a greater tendency to 115 engage in risky driving. In similar line of reasoning, Harrison and Fillmore (2005) tested the 116 driving performance of 28 adults (21-31) in the US, under either an active dose of alcohol (0.65 117
g/kg) or a placebo. The objective was to examine whether „bad‟ drivers are more likely to be 118 impaired by alcohol. In parallel, a personal drinking habits questionnaire was completed, and a 119
subjective intoxication degree was estimated. Significant within-lane deviation confirmed 120 alcohol impairment; however, individuals with poorer baseline skills appeared to be more 121 impaired by alcohol. 122
123 Ronen et al. (2008) assessed the effects of marijuana compared to alcohol ingestion on driving 124
performance, physiological strain, and subjective feelings. They recruited 14 students (25-27) in 125
Israel, that were recreational marijuana and alcohol users. Active and placebo dosages were 126 administrated to identify differences in reaction time, number of collisions, average speed, lane 127 position and steering variability. Alcohol consumption caused speed and reaction time increase, 128
sleepiness, and lack of attention. Following the same protocol and using similar equipment, 129 Ronen et al. (2010) further investigated the effects of alcohol (BAC=0.05%), marijuana, and 130 their combined consumption. Alcohol consumption was found to increase speed, while the 131 combination of alcohol and THC appeared to have the most intense effect following intake. 132 Lenné et al. (2010) designed a simulator experiment to study the combined effects of cannabis 133
and alcohol (vs. only cannabis) on driving impairment. To this end, they recruited both novice 134 and experienced Australian drivers having a history of alcohol and cannabis consumption. Speed, 135
headway, steering, reaction time, and lateral position data were used as driving performance 136 indicators. Results showed that alcohol consumption is associated with speed increases and 137 lateral position variability, but it does not affect reaction time nor does it produce synergistic 138

4
effects when combined with cannabis. The authors attribute the latter to the relatively low 139 alcohol dosage (ethanol of app. 0.5g/kg). 140 141 Despite the work done using simulators and the various aspects of driving after drinking 142
investigated, few – if any - studies have considered the differential effects of BAC levels and 143 other important factors upon driver reaction times. 144 145
EXPERIMENTAL DESIGN 146 147
Participants 148 149
Participants were voluntarily subjected to a common pre-defined dose of alcohol consumption, 150 underwent two driving sessions, and completed a questionnaire. All subjects (N=49, 151 F(male)=53,1%)) were non-abstaining drinkers holding a valid driving license, followed no 152 medical treatment and were between the ages of 20 and 30 (mean age=23.2, SD=2.7). Other 153
authors have also concentrated on the same age group for studying young driver alcohol 154 impairment (Harrison and Fillmore, 2005, as an example). The racial makeup of the sample was 155
100% Caucasian and consisted of 32.7% self-reported heavy drinkers (alcohol consumption 156 higher than 3 times a week), 47.0 %light drinkers (consumption lower that twice a week), and 157 8.2% occasional-drinkers (consumption less than twice a month).We note that all drivers 158
provided informed consent prior to participating and did not leave the laboratory before their 159
BAC level was zero. Participants were also requested to abstain from consuming drugs or 160 alcohol for a minimum of 18h prior to the experiment. Any subject who tested positive for the 161 presence of alcohol prior to the experiment was excluded from the study. All sessions took place 162
during late evening hours to approximate actual drinking and driving conditions. 163 164
Laboratory settings 165 166 The experiment was held at the Department of Transportation Planning and Engineering of the 167
National Technical University of Athens, Greece. We used a driving simulator (Foerst F12PT-168 3L40), along with a certified breath alcohol test device (Lion SD-400). The simulator includes a 169
full car cabin, while visual images are projected onto three monitors resulting in a field view of 170
1350. The driving cabin is equipped with usual functional car commands and features such as 171
indicators, pedals, steering wheel, gearbox, dashboard, handbrake, car seat, and seatbelt. 172 173
Experimental procedure 174 175 The experiment was designed following a 4-stage procedure. 176 177
1. 1. Subjects were briefed on the experimental procedure and requirements. They were 178
introduced to the testing equipment (alcoholmeter and simulator), and had 3 minutes of 179 free driving to get familiarized with the simulator. They were also instructed to complete 180
a questionnaire regarding their physical state (e.g. fatigue, hours of nighttime sleep), 181 personal attributes (age, weight, gender, and so on), travel habits (e.g. annual mileage), 182 crash involvement history (e.g. number of accidents, whether at fault, severity outcome), 183

5
drinking habits (e.g. frequency, quantity), and driving behavior (average travelling speed 184 on highways, drink-driving, and so on). 185
2. Subjects underwent a 4-minute session of free driving under normal weather conditions, 186 in the presence of on-coming traffic, and in a small-sized city environment. Predefined 187
events (such as, for example, sudden opening of the door of a parked vehicle, animal 188 entering suddenly the road, and so on) - triggered randomly by the operator - allowed for 189 reaction times estimation. This driving test served as a baseline measure to assess driving 190 skills and performance while sober. 191
3. Subjects ingested 100 ml of liquor (approximately 40ml of ethanol) within a short period 192
(about 10 minutes; liquor included vodka, whisky or gin, diluted (e.g. with fruit juice) or 193
straight, according to personal preferences). However, all such differentiations were 194
recorded and statistically examined for possible influences on BAC and driving 195 performance. All participants were administered equal ethanol quantity regardless of their 196 physical characteristics (weight), so as to obtain a range of BACs. After a 20 min post-197 ingestion interval, subjects provided breath samples every 20 minutes and over a 1.3 hour 198
period (4 times overall), to observe BAC variation overtime. 199 4. Subjects repeated the – stage 2 - driving session one hour after liquor administration and 200
while still intoxicated. Triggering events were again used to estimate reaction times. We 201 note that simulator driving only approximates actual road and driving conditions and is 202 unable to capture the complexity of real-life procedures such as decision-making, hazard 203
perception, and so on. However, it can be reasonably assumed that relative performance 204
(sober vs. intoxicated for example) on the simulator can reflect alcohol impairment. 205 206
Performance measures 207 208 Driving performance (before and after intoxication) was assessed by driver reaction times to 209
triggering events. Average time lag (in milliseconds) between triggering event occurrences and 210 driver reaction (braking or steering) served as driving performance indicator. We note that 211 reaction time (RT) is critical to road safety and has been used as a performance measure in 212
previous simulator experiments (Lenné et al, 2003; Leung and Starner, 2005; Ronen, 2008). 213 214
DATA AND METHODOLOGY 215
216 The Data 217 218 Reaction time (M=1.1 sec, SD=0.3) while intoxicated was used as the dependent variable in our 219 analysis. Questionnaire data and breath test results served as independent variables. Table 2 220 provides a description of all independent variables considered along with summary statistics. We 221 created a dummy variable „Alc1/3‟to capture the absolute difference between the third (right 222 before the driving while intoxicated session) and the first (immediately following alcohol 223
ingestion) breath test results. Interestingly, the positive sign for 41% of the cases indicates that 224 BAC may continue to rise for as long as 1h following ingestion; the average value of 1.2 and S.D. 225
of 0.6 indicate strong heterogeneity across individuals regarding BAC time variation. 226 227 228 229

6
Table 1.Explanatory variables in reaction time analysis 230
Variable Type Summary
Statistics1 Description
experiment data
Sleeping time
(sleep) continuous M=7.7, SD=2.1 hours of nighttime sleep
Awake time
(awake) continuous M=7.8, SD=2.6 hours since morning wake-up
Last meal
(meal) continuous M=6.5, SD=6.6 hours since last meal
Fatigue
(tired) dummy F(0)=53.1% =0 if tired; =1 otherwise
personal data
Weight
(weight) continuous M=71.1, SD=14.9 weight in kg
Age
(age) continuous M=23.2, SD=2.6 age in years
Height
(height) continuous M=174.3, SD=9.4 height in cm
Driving experience
(exper) continuous M=4.4, SD=3.1 years since driving license
Gender
(female) dummy F(0)=46.9% =0 if female; =1 otherwise
Eyesight
(problem) dummy F(0)=53.1% =0 if yes; =1 otherwise
Physical exercise
(no_ex) dummy F(0)=40.8% =0 if no regular exercise; =1 otherwise
(12_ex) dummy F(0)=26.5% =0 if 1-2h weekly; =1 otherwise
(4_ex) dummy F(0)=16.3% =0 if over 4h weekly; =1 otherwise
Alcohol consumption
(alc_2) dummy F(0)=85.7% =0 if 1- 2 drinks/week; =1 otherwise
Breath test experience
(test) dummy F(0)=46.9% =0 if previous experience; =1 otherwise
driving behavior
Traffic violation
(infra) dummy F(0)=26.5% =0 if previous infraction; =1 otherwise
Accident involvement
(acc) dummy F(0)=53.1% =0 if previous acc involvement; =1 otherwise
Speeding
(speed) continuous M=105.4, SD=24.8 average travel speed on highways (km/h)
Speed limit violation
(sp_viol) dummy F(0)=12.2% =0 if „speed‟>130; =0 otherwise
Low self-confidence
(low_self) dummy F(0)=20.4% =0 if low and average; =1 otherwise
Drink and drive
(ndd) dummy F(0)=28.5% =0 if never; =1 otherwise
(sdd) dummy F(0)=61.2% =0 if sometimes; =1 otherwise
breath test
Breath test results
(Alc-1) continuous M=0.3, SD=0.1 first breath test (mg/lt)
(Alc-2) continuous M=0.3, SD=0.1 second breath test (mg/lt)
(Alc-3) continuous M=0.2, SD=0.1 third breath test (mg/lt)
(Alc-4) continuous M=0.2, SD=0.1 fourth breath test (mg/lt)
(Av_Al) continuous M=0.2, SD=0.1 average result for all breath tests
Comparison between results

7
(Alc3-1) dummy F(0)=59.2% =0 if („Alc3‟-„Alc1‟)<0; =1 otherwise
(Alc1/3) continuous M=1.2, SD=0.6 ratio of third to first breath test results 1 F: frequency
M: average value
SD: Standard Deviation
231 Methodology 232 233 Multiple linear regression is commonly used to model the relationship between a continuous 234 dependent variable and several regressors that are thought to covary. Subject reaction time 235 following alcohol administration is a continuous nonnegative variable and can be reasonably 236
assumed to covary with experimental data (such as BACs, subject age and physical condition, 237
and so on). Following Washington et al. (2010), reaction time can be modeled as follows 238
(1) 239
where is reaction time for subject i=1,2,…,49, is the constant term, stands for the 240
coefficients to be estimated for the j=1,2,…,ρ independent variables considered, and is the 241 disturbance term for individual i. 242
243 The functional form of the multiple linear regression in Eq. (1) assumes that the estimated 244 parameters are the same for all observation; however, initial regression results indicated 245
significant heterogeneity among subjects and raised certain questions regarding the validity of 246
such a fixed parameter assumption which, if violated, may result in inconsistent estimates. To 247 relax the fixed-parameter restriction, a random parameter linear regression model was instead 248 used (Washington et al. 2010) 249
250
(2) 251
, with a randomly distributed term. The distribution of the termacross 252
individuals is to be specified along with the other model parameters (possible distributions 253 include Normal, Uniform and Triangular). The random-parameter model randomizes the 254
parameters to allow for the influence of the independent variables affecting reaction time to vary 255
across individuals (for more information and a detailed discussion on random parameter models 256
see Anastasopoulos and Mannering 2009 and 2011). 257 258
RESULTS 259 260 Two fixed- and two random-parameter models were used to model reaction times and alcohol-261
related variables while controlling for driver attributes. We also estimated two separate models; 262 in the first type, the BAC level was the value obtained at the third breath test was used (right 263 before driving while intoxicated and 1h following alcohol ingestion). In the second, variable 264 „alc1/3’ was used in order to observe differences with respect to alcohol absorption rates for the 265 subjects (joint consideration of all alcohol-related variables was rejected because of 266
multicollinearity concerns). The fixed-parameter specification was estimated using ordinary least 267 squares (OLS), while maximum likelihood estimation was used to estimate the underlying 268 population parameters for the random parameters model. We note that simulations were based on 269 random draws with OLS parameter estimates serving as starting values. Normal, triangular and 270
8
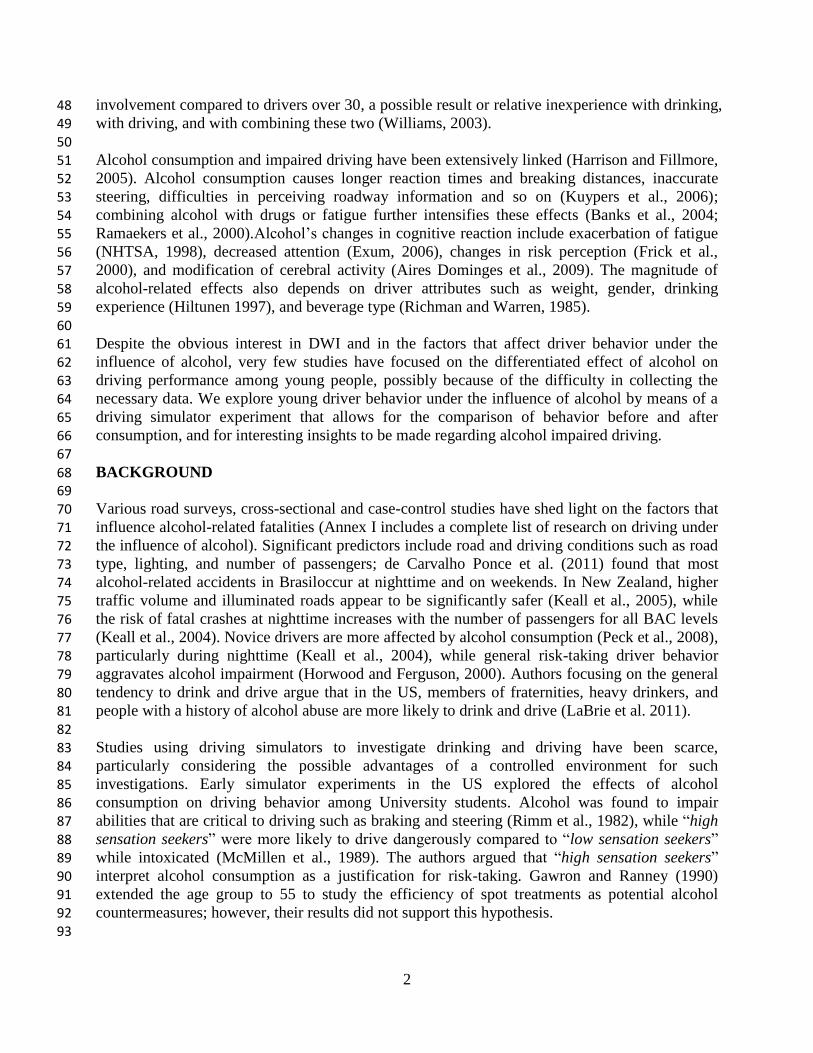
uniform distributions were considered for the functional form of the random parameter density 271 functions. 272 273 Model estimation results are shown in Tables 2 and 3; variables were excluded from the final 274
models because of low statistical significance. All estimated parameters included in the final 275 models are statistically significant at the 95% confidence level. The standard deviation for the 276 distribution of the random parameters was significantly different from 0 for all the variables 277 included in the random-parameter models. Elasticities are estimated for all continuous variables 278 to assess reaction time sensitivity with respect to changes in the regressors. 279
280
In all cases, random-parameter models significantly outperform fixed-parameter models based 281
on the likelihood ratio test. The test yields values higher than the X2critical values, indicating a 282
confidence that the random parameter models outperform the fixed parameter specification. We 283 also note that, besides statistical fit, the two model specifications yield – in some cases - 284 qualitatively and quantitatively different results for the parameter estimates. For example, 285
variables „alc_2’ and „low_self‟ were found to be statistically significant only in the random-286 parameter analysis. 287
288 Table 2. Model Estimation Results for Model Type 1 289
Fixed Parameters Random Parameters
Variables coefficient t-statistics elasticity coefficient t-statistics S.D.a elasticity
constant 0.41 1.94 0.93 16.21 0.04
RT-bef 0.47 3.83 0.54 0.10 2.56 0.18 0.12
Alc-3 0.38 0.95 0.08 0.89 7.08 0.06 0.20
4_ex 0.15 1.87 0.15 7.95 0.03
sp_viol 0.14 -1.33 0.15 -6.31 0.11
meal -0.01 -1.12 0.03 -0.01 -3.68 0.01 0.04
low_self -0.01 0.09 0.21 -9.37 0.05
alc_2 0.09 1.08 -0.10 -4.34 0.26
Number of observations 49
Log-likelihood at zero LL(0) -3.32
Log-likelihood at convergence LL(β) 12.1
28.81
Number of parameters 8 17
R-squared 0.47
Likelihood-ratio test Random vs. fixed parameters
X2=-2(LL(βfixed)-LL(βrandom))
33.42
Critical X2 (0.9995 level of confidence and v=9 d.o.f.)
29.67
aStandard deviation of parameter distribution
290
291 292 293 294

9
Table 3. Model Estimation Results for Model Type 2 295
Variables
Fixed Parameters Random Parameters
coefficient t-statistics elasticity coefficient t-statistics S.D.a elasticity
constant 1.47 8.09 1.36 21.66 0.04
Alc1/3 -0.14 -2.36 0.14 -0.13 -8.10 0.04 0.14
ndd 0.21 -2.76 0.11 -6.20 0.11
4_ex 0.31 3.36 0.29 10.17 0.05
sp_viol 0.25 -2.32 0.22 -5.57 0.16
meal -0.01 -1.62 0.42 0.01 1.83 0.00 0.02
low_self 0.08 -1.01 0.17 -6.59 0.02
alc_2 0.03 0.29 0.06 1.50 0.12
Number of observations 49
Log-likelihood at zero LL(0) -3.32
Log-likelihood at convergence LL(β) 8.05
23.71
Number of parameters 8 17
R-squared 0.37
Likelihood-ratio test Random vs. fixed parameters
X2=-2(LL(βfixed)-LL(βrandom))
31.32
Degrees of freedom v=17-8=9
Critical X2 (0.9995 level of confidence)
29.67
aStandard deviation of parameter distribution
296 In the first model type, we focus on the relationship between reaction time while intoxicated 297
(RT_after), reaction time before drinking (RT_bef) and BAC level (Alc-3). Results indicate that 298 light drinkers (alc_2), having low or average – self assessed - driving skills (low_self), driving at 299 speeds beyond the legal limits (sp_viol), and exercising for less than 4h per week (4_ex) 300
significantly increase reaction time while intoxicated. Increased BAC levels are related to 301 increased reaction times with an elasticity of -0.2. Reaction time decreased with lower times 302
since the last meal (meal), but with lower elasticity than the BAC levels. Finally, increased 303 reaction times while driving without alcohol (RT_bef) is strongly related to increased reaction 304 times when driving under the influence (RT_after). All regressors were significant in the random 305 parameter model with „RT_bef’, ‘4_ex’, ‘meal’, ‘low_self’, and ‘alc_2’ following the normal 306
distribution, „alc-3’ following the uniform distribution, and „sp_viol’ following the triangular 307 distribution. 308 309 In the second model type, we focus on the relationship between reaction time while intoxicated 310 („RT_after’), and the ratio of breath test results („Alc1/3’). Empirical results suggest that low or 311
average – self assessed - driving skills (‘low_self’),driving at speeds beyond legal limits 312 („sp_viol’), exercising for less than 4h per week („4_ex’), and never driving after drinking („ndd’) 313
significantly increase reaction times while intoxicated. In contrast to the first model type, light 314 drinkers and recent meals seem to result in decreased reaction times. Further, increasing BAC 315 ratios („Alc1/3’) result in lower reaction times; all regressors were found to have random 316 parameters. 317

10
318
Experiment-specific driver data 319 320 Among all the variables related to experiment-specific data, reaction time before intoxication 321
(„RT-bef’) and the time elapsed since the last meal („meal’) were found to be significant; instead, 322 hours of nighttime sleep and hours since morning wake-up do not appear to statistically influence 323 reaction time. This finding contradicts some previous research (Arnedt et al., 2001), where 324 prolonged sleeplessness was found to increase alcohol‟s effects; we do note however that in this 325 research we also considered additional fatigue-related variables such as „meal‟ and „RT-bef’. 326
327
Empirical results from the first model type indicate that „meal‟ has a random parameter with a 328
mean of-0.006 and a SD of 0.009; this implies that for 75% of the subjects recent meal has an 329 increasing effect on reaction time. This finding can be explained by the overall fatigue resulting 330 from the additive effect of alcohol and a meal. Interestingly, in the second model type, „meal‟ 331 has a positive random coefficient of 0.003 and an SD of 0.004; this suggests a possibly strong 332
heterogeneity between individuals and would have been neglected under a fixed-parameter 333 approach; however, further investigation is needed in order to fully interpret the relationship 334
between meal and reaction times. 335 336 Empirical results also indicate that „RT-bef’ significantly influences reaction time while 337
intoxicated. This clearly suggests that higher baseline reaction times correspond to higher 338
reaction times after drinking. The corresponding random coefficient is normally distributed with 339 a mean value of 0.102 and an SD of 0.181; the latter indicates that for 75% of the sample, 340 increased values for initial reaction times are related to increased reaction times following 341
intoxication. Similar findings were reported by Harrison and Fillmore (2005) where individuals 342 with poorer baseline skills were found to be more affected by alcohol. For the remainder 25% of 343
the subjects, increased baseline reaction times resulted in decreased reaction times after drinking; 344 this rather counter-intuitive finding may be a result of low-dosage (a similar hypothesis was 345 formulated by Lenné et al. (2010). We also note that the elasticity of „RT-bef’ is lower than„alc-346
3’,indicating that changes in BAC levels have a stronger effect on reaction times compared to 347 baseline driving skills. 348
349
Personal data 350 351 Regarding personal data, two variables were found to significantly affect reaction times in all 352
random-parameter models: physical exercise and drinking frequency. Both variables were not 353 statistically significant under the fixed-parameter modeling approach. Variables related to weight, 354 age, and sex were not found to be significant; measured BAC is believed to „absorb‟ all relative 355 variance and indirectly – at least - capture such driver attributes. 356 357
Exercising for over 4hrs per week („4_ex’) reduces reaction times. This is a rather intuitive 358 finding suggesting that „fit‟ individuals respond quicker to external stimuli even when 359
intoxicated. The corresponding coefficient was found to follow the normal distribution with a 360 relatively low SD compared to the mean, suggesting that this finding holds for the entire sample. 361 362

11
In both model types, being a light drinker (alc_2) was found to have a significant impact on 363 reaction times. In the first model type, light drinkers show reduced reaction times compared to 364 all other drinking frequencies (both occasional and heavy). This implies that drivers used to 365 driving under the influence negotiate better with unexpected road hazards; however, the latter is 366
restrained by an upper limit of two drinks per week. The random coefficient has a mean of -367 0.103 and an SD of 0.255, indicating that the distribution is positive only for 66% of the subjects. 368 The second model type indicates that light drinkers show increased reaction times when 369 compared to all other drinking frequencies. Again, the corresponding random coefficient is 370 normally distributed with a mean of 0.062 and an SD of 0.120 indicating that the latter holds for 371
65% of the subjects. 372
373
Driving Behavior 374 375 Several variables related to self-reported driving behavior were examined regarding their 376 influence on reaction times following intoxication. Results suggest that a – self-reported - 377
average highway travelling speed over the maximum legal limit seems to correspond to longer 378 reaction times. This finding suggests that driving while intoxicated is related to general risk-379
taking behaviors as suggested by Horwood and Ferguson (2000). In all random parameter 380 models we find that drivers who self-assess their skills as low or average (low_self), have longer 381 reaction times compared to more self-confident drivers. We finally find that drivers who report 382
to never driving while intoxicated have significantly longer reaction times compared to drivers 383
that drive while intoxicated on a „regular‟ basis. 384 385
BAC 386 387 Breath tests enable us to consider several BAC-related variables; „Alc-3’ and „Alc1/3‟ were 388
found to be significant. As expected, the concentration of alcohol appears to have a strong 389 relationship with driving performance as it directly affects cognitive abilities by exacerbating the 390 effects of fatigue (NHTSA, 1998), decreased attention (Exum, 2006), changing risk perception 391
(Frick et al., 2000), and modifying cerebral activity (Aires Dominges et al., 2009). The 392 Elasticities for both variables are rather high (0.2 and 0.14 respectively), verifying the increased 393
sensitivity of reaction time with changes in alcohol dosage and consequent BAC increases. 394
Results suggest that increased BAC level as measured 1 hour after alcohol consumption and just 395 before driving („Alc-3’) is linked to longer reaction times. Tzambazis and Stough (2000) 396 conducted a psychometric experiment and concluded that increasing BACs impair speed of 397
information processing, simple reaction time, choice reaction time and higher-order cognitive 398 abilities; similar findings can be found in other medicine-oriented experiments. Results also 399 indicate („Alc1/3’) to also be significant; increased values for the BAC ratio are related to lower 400 reaction times. Increased values for „Alc1/3‟ imply that the initial BAC level has been 401 significantly changed towards lower values, while the opposite is implied by lower BAC values. 402
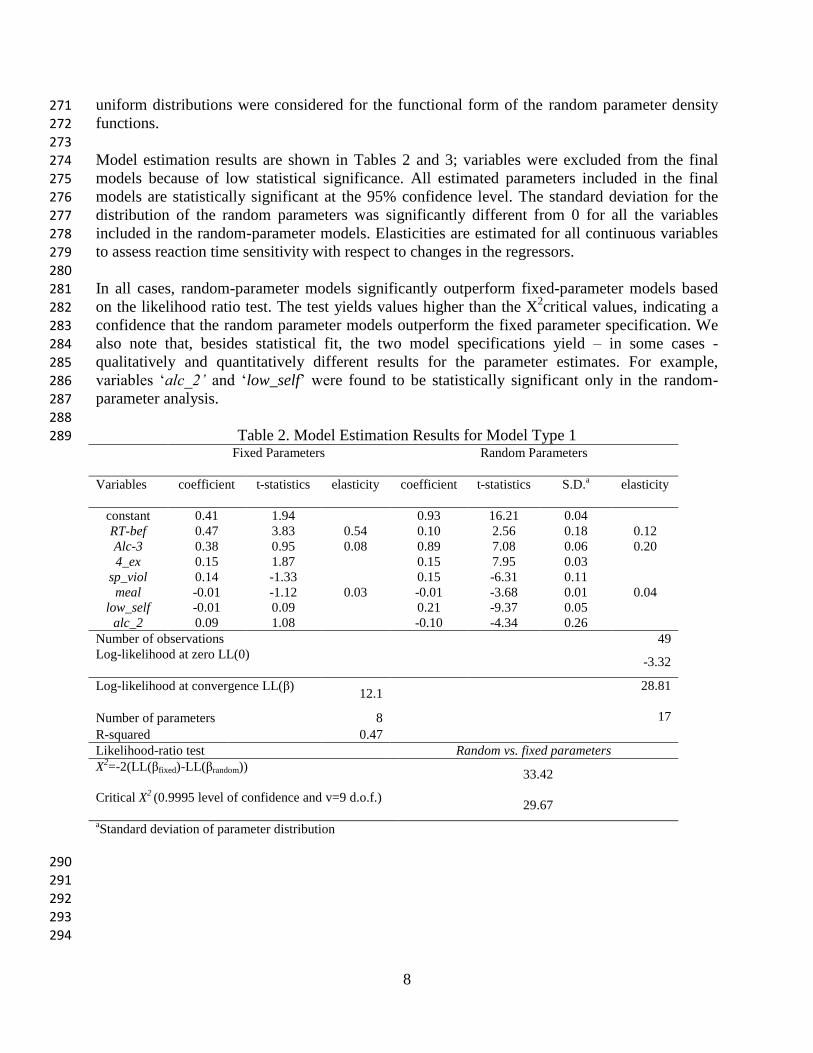
Figure 1 depicts probable BAC time evolution with a biphasic effect on cognitive abilities for the 403 ascending and the descending parts (King et al., 2002; Pihl et al., 2003). Increased BAC ratios 404
indicate narrower BAC curves and quicker BAC evolution overtime; the corresponding 405 coefficient has a mean of -0.133 and an SD of 0.044, with this finding suggesting that individuals 406 with narrower curves (faster alcohol absorption) show better driving performance regardless of 407 their absolute BAC level. 408

12
409 410 411 412
413 414 415 416 417
418
419
Figure 1. Qualitative BAC curve 420 421
422 CONCLUSIONS 423 424 We explored alcohol impairment through a driving simulator experiment and focused on younger 425
drivers as there is empirical evidence indicating a significantly stronger effect of alcohol on 426 young driver behavior, and a higher rate of accident involvement due to relative inexperience. In 427 contrast to most studies where behavior has been studied under an equal-BAC-level hypothesis, 428
we instead administrated the same alcohol quantity to all subjects leading to a wide range of 429
BAC levels. This better approximates actual drinking habits of social drinkers who consume 430 alcohol based on socially prevalent drinking patterns and not their body weight. Driving 431 performance was measured in terms of reaction time to unexpected events as the relationship 432
between longer reaction times and driving impairment has been well documented in the literature. 433 We make the hypothesis that personal data (drinking and driving habits, driver attributes) and 434
BAC level explain post-consumption reaction times. We didn‟t limit our research to the 435 relationship between pre- and post-consumption reaction times because we assume a non-linear 436 relationship between personal data, resulting BAC and impaired driving performance. 437
438 We explored the relationship between driver reaction times and BAC-related variables using 439
random parameters linear regression models to account for the strong heterogeneity between 440
individuals. Results indicate that exercising for less than 4h per week significantly increase 441 reaction times while intoxicated, while increased reaction times during the baseline driving task 442 are related to increased reaction times after drinking; elasticity estimates suggest that 10% faster 443
reaction times for the baseline task lead to 5.4% faster reaction times while intoxicated. The 444 effect of being a light drinker and having had a recent meal is largely differentiated across 445 individuals. Most importantly, increasing BACs seems to relate strongly to slower reaction times, 446 while quick reduction in BACs relates strongly to faster reaction times. In general we note that 447 increased BAC levels increase reaction times; a 10% increase in BAC levels results in a 2% 448
increase in reaction time. We finally note that individuals with faster alcohol consumption times 449 perform better regardless of absolute BAC levels. 450
451 Overall, our findings suggest that there exist significant differentiations among individuals 452 regarding driving performance while intoxicated. These differentiations need to be investigated 453 further, while individual drinking, driving, and driving after drinking behavioral patterns 454
BAC
time
Alc-1

13
significantly affect actual performance. As a caveat, we note that our research suffers from some 455 limitations that need to be considered in interpreting the results including limited sample size, the 456 lack of additional performance measures such as average travel speed and vehicle positioning, 457 and the inherent shortcomings of driving simulators. 458
459
ACKNOWLEDGEMENTS 460 461 The authors thank all volunteer participants in the experiment and the „Panos Mylonas‟ Institute 462 for kindly providing all necessary breath test equipment. 463
464
REFERENCES 465 466 Anastasopoulos, P. C., and Mannering, F. L. (2011). An empirical assessment of fixed and 467 random parameter logit models using crash- and non-crash-specific injury data. Accident 468 Analysis and Prevention, 43(3), 1140-1147. 469
470 Anastasopoulos, P. C., and Mannering, F. L. (2009).A note on modeling vehicle accident 471
frequencies with random-parameters count models.Accident Analysis and Prevention, 41(1), 472 153-159. 473 474
Aires Domingues, S.C., Mendonca, J.B., Laranjeira, R., and Nakamura-Palacios, E.M., (2009). 475
"Drinking and driving: a decrease in executive frontal functions in young drivers with high blood 476 alcohol concentration, Alcohol, 43(8), 657-664. 477 478
Arnedt, J.T., Wilde, G.J.S., Munt, P.W., and MacLean, A.W., (2001). "How do prolonged 479 wakefulness and alcohol compare in the decrements they produce on a simulated driving 480
task?",Accident Analysis &Prevention, 33(3), 337-344. 481 482 Banks, S., Catcheside, P., Lack, L., Grunstein, R.R., and McEvoy, R.D., (2004). "Low levels of 483
alcohol impair driving simulator performance and reduce perception of crash risk in partially 484 sleep deprived subjects",Sleep, 274(6), 1063-1067. 485
486
Beirness, D.J., (1987). "Self-estimates of blood alcohol concentration in drinking-driving 487 context", Drug and Alcohol Dependence, 19(1), 79-90. 488 489
Beirness, D.J., Simpson H.M., and Desmond, K., (2005). "The Road Safety Monitor",Traffic 490 Injury Research Foundation, Ottawa, Canada. 491 492 Compton, R., and Berning, A., (2009). "Results of the 2007 National Roadside Survey of alcohol 493 and drug use by drivers", U.S. Department of Transportation, National Highway Traffic Safety 494
Administration, Washington D.C., U.S.A. 495 496
Dawson, D.A., (1999). Alternative definitions of high risk for impaired driving: the overlap of 497 high volume, frequent heavy drinking and alcohol dependence, Drug and Alcohol Dependence, 498 54(3), 219-228. 499

14
de Carvalho Ponce, J., Munoz, D.R., Andreuccetti, G., de Carvalho, G.D., and Leyton, V., 500 (2011). "Alcohol-related traffic accidents with fatal outcomes in the city of Sao Paulo", Accident 501 Analysis & Prevention, 43(3), 782-787. 502 503
Dols, S.T., Gonzalez, A.F.J., Aleixandre, N.L., Vidal-Infer,A., Rodrigo,M.J.T.,andValderrama-504 Zurian, J.C.,(2010). "Predictors of driving after alcohol and drug use among adolescents in 505 Valencia (Spain) ", Accident Analysis & Prevention, 42(6), 2024-2029. 506 507 Exum, M.L., (2006). "The application and robustness of the rational choice perspective in the 508
study of intoxicated/angry intentions to aggress", Criminology, 40(4), 933-966. 509
510
Frick, U., Rehm, J., Knoll, A., Reifinger, M., and Hasford, J., (2000). "Perception of Traffic 511 Accident Risk and Decision to Drive under Light Alcohol Consumption--A Double-Blind 512 Experimental Study", Journal of Substance Abuse, 11(3), 241-251. 513 514
Gawron, V.J., and Ranney, T.A., (1990)."The effects of spot treatments on performance in a 515 driving simulator under sober and alcohol-dosed conditions", Accident Analysis & Prevention, 516
22(3), 263-279. 517 518 Harrison, E.L.R, and Fillmore, M.T., (2005). "Are bad drivers more impaired by alcohol?: Sober 519
driving precision predicts impairment from alcohol in a simulated driving task", Accident 520
Analysis & Prevention, 37(5), 882-889. 521 522 Hiltunen,A.J., (1997). "Acute alcohol tolerance in social drinkers: Changes in subjective effects 523
dependent on the alcohol dose and prior alcohol experience", Alcohol, 14(4), 373-378. 524 Horwood, L.J., and Fergusson, D.M., (2000). "Drink driving and traffic accidents in young 525
people", Accident Analysis & Prevention, 32(6), 805-814. 526 527 Jenigan D.H., (2001). "Global Status Report: Alcohol and Young People",World Health 528
Organization, Geneva, Switzerland. 529 530
Keall, M.D., Frith, W.J., and Patterson, T.L., (2004). "The influence of alcohol, age and number 531
of passengers on the night-time risk of driver fatal injury in New Zealand", Accident Analysis & 532 Prevention, 36(1), 49-61. 533 534
Keall, M.D., Frith, W.J., and Patterson, T.L., (2005). "The contribution of alcohol to night time 535 crash risk and other risks of night driving", Accident Analysis & Prevention, 37(5), 816-824. 536 537 King, A.C., Houle, T., de Wit, H., Holdstock, L. and Schuster, A., (2002). "Biphasic alcohol 538 response differs in heavy versus light drinkers", Alcoholism: clinical and experimental research, 539
26(6), 827-835. 540 541
Kuypers, K.P.C., Samyn, N., andRamaekers, J. G., (2006). "MDMA and alcohol effects, 542 combined and alone, on objective and subjective measures of actual driving performance and 543 psychomotor function ", Psychopharmacology, 187(4), 467-475. 544 545

15
LaBrie, J.W., Kenney, S.R., Mirza, T., and Lac, A., (2011). "Identifying factors that increase the 546 likelihood of driving after drinking among college students", Accident Analysis & Prevention, 547 43(4), 1371-1377. 548 549
Lee, G.A., and Forsythe, M., (2011). "Is alcohol more dangerous than heroin? The physical, 550 social and financial costs of alcohol", International Emergency Nursing, In Press. 551 552 Lenne, M.G., Dietze, P., Rumbold, G.R., Redman, J.R., and Triggs, T.J., (2003). "The effects of 553 the opioid pharmacotherapies methadone, LAAM and buprenorphine, alone and in combination 554
with alcohol, on simulated driving", Drug and Alcohol Dependence, 72(3), 271-278. 555
556
Leung, S., andStarmer, G., (2005). "Gap acceptance and risk-taking by young and mature drivers, 557 both sober and alcohol-intoxicated, in a simulated driving task", Accident Analysis & Prevention, 558 37(6), 1056-1065. 559 560
Mann, R.E., Stoduto, G., Vingilis, E., Asbridge,M., Wickens, C.M., Ialomiteanu, A., Sharpley, J., 561 and Smart, R.G, (2010). "Alcohol and driving factors in collision risk", Accident Analysis & 562
Prevention, 42(6), 1538-1544. 563 564 Mayhew, D.R., Donelson, A.C., Beirness, D.J., and Simpson, H. M., (1986). "Youth alcohol and 565
relative risk of crash involvement", Accident Analysis and Prevention, 18(4), 273–287. 566
567 McMillen, D.L., Smith, S.M, and Wells-Parker, E., (1989). "The effects of alcohol, expectancy, 568 and sensation seeking on driving risk taking", Addictive Behaviors, 14(4), 477-483. 569
570 Miller, T.R., Spicer, R.S., and Levy, D.T., (1999). "How intoxicated are drivers in the United 571
States? Estimating the extent, risks and costs per kilometer of driving by blood alcohol level", 572 Accident Analysis & Prevention, 31(5), 515-523. 573 574
NHTSA, (1998). "Drowsy driving and automobile crashes: NCSCR/NHTSA expert panel on 575 driver fatigue and sleepiness", U.S. Department of Transportation, National Highway Traffic 576
Safety Administration, Washington D.C., U.S.A. 577
578 NHTSA, (2004). "Traffic Safety Facts 2002: A compilation of motor vehicle crash data from 579 The Fatality Analysis Reporting System and The General Estimates System",U.S. Department of 580
Transportation, National Highway Traffic Safety Administration, National Center for Statistics 581 and Analysis, Washington D.C., U.S.A. 582 583 NHTSA, (2005). "Crash Risk of Alcohol Involved Driving: A Case-Control Study",U.S. 584 Department of Transportation, National Highway Traffic Safety Administration, Washington 585
D.C., U.S.A. 586 587
Peck, R.C., Gebers, M.A., Voas, R.B., and Romano, E., (2008). "The relationship between blood 588 alcohol concentration (BAC), age, and crash risk", Journal of Safety Research, 39(3), 311-319. 589 Pihl, R.O., Paylan, S.S., Gentes-Hawn, A. and Hoaken, P.N.S., (2003). "Alcohol affects 590 executive cognitive functioning differentially on the ascending versus descending limb of the 591

16
blood alcohol concentration curve", Alcoholism: clinical and experimental research, 27(5), 773-592 779. 593 594 Ramaekers, J.G., Robbe, H.W. J., and O'Hanlon, J.F., (2000). "Marijuana, Alcohol and Actual 595
Driving Performance",Human Psychopharmacology: Clinical and Experimental, 15(7), 551-558. 596 597 Rehm J., Mathers C., Popova S., Thavorncharoensap M., Teerawattananon Y., and Patra J., 598 (2009). "Global burden of disease and injury and economic cost attributable to alcohol use and 599 alcohol-use disorders", Lancet, 373(9682), 2223–2233. 600
601
Richman, A., and Warren, R.A., (1985). "Alcohol consumption and morbidity in the Canada 602
Health Survey: Inter-beverage differences", Drug and Alcohol Dependence, 15(3), 255-282. 603 604 Rimm, D.C., Sininger, R.A., Faherty, J.D., Whitley, M.D., and Perl, M.B., (1982). "A balanced 605 placebo investigation of the effects of alcohol vs. alcohol expectancy on simulated driving 606
behavior", Addictive Behaviors, 7(1), 27-32. 607 608
Ronen, A., Chassidim, A.S., Gershon, P., Parmet, Y., Rabinovich, A., Bar-Hamburger, R., 609 Cassuto,Y., and Shinar, D., (2010). "The effect of alcohol, THC and their combination on 610 perceived effects, willingness to drive and performance of driving and non-driving tasks", 611
Accident Analysis & Prevention, 42 (6), 1855-1865. 612
613 Ronen, A., Gershon, P., Drobiner, H., Rabinovich, A., Bar-Hamburger, R., Mechoulam, R., 614 Cassuto, Y., and Shinar, D., (2008). "Effects of THC on driving performance, physiological state 615
and subjective feelings relative to alcohol", Accident Analysis & Prevention, 40(3), 926-934. 616 Transport Canada, (1998). "1997 Canadian Motor Vehicle Traffic Collision Statistics", TP 3322, 617
Ottawa, Canada. 618 619 Tzambazis, K and Stough, C., (2000). "Alcohol impairs speed of information processing and 620
simple and choice reaction time and differentially impairs higher-order cognitive abilities", 621 Alcohol & Alcoholism , 35(2), 197–201. 622
623
Washington, S.P., Karlaftis, M.G., Mannering, F.L., (2010)."Statistical end Econometric 624 Methods for Transportation Data Analysis – 2nd Edition". Chapman & Hall/CRC. 625 626
WHO (2011). "Global status report on alcohol and health",World Health Organization. ISBN 627 978 92 4 156415 1, Geneva, Switzerland. 628 629 Williams, A.F., (2003). "Teenage drivers: patterns of risk",Journal of Safety Research, 34(1), 5–630 15. 631
632 Williams, A.F., (2006). "Alcohol-impaired driving and its consequences in the United States: 633
The past 25 years", Journal of Safety Research, 37(2), 123-138. 634
635 636
637

17
638 Annex 1.Overview of alcohol impairment studies 639
640 Author Date Study objective Method Cases Main results
Aires
Dominges
et al.
2009 Influence of alcohol
on executive frontal
functions among
nighttime drivers
(Brazil).
Road survey 389 drivers randomly
recruited by police
agents in Vitoria
- Increasing BAC decreases
frontal activity.
- Alcohol-induced impairment
particularly important among
young drivers (20-30 years)
Arnedt et
al.
2001 Effects of alcohol
vs. prolonged
wakefulness on
driving (speed
maintenance and
road position) in
Canada
Driving
simulator
18 males aged 18-35
(psychology students)
-Even modest BAC levels
involve driving impairment.
-3h of prolonged wakefulness
produces impairment as
serious as 0.05% BAC.
-Combination of the 2 effects
explains high crash rates at
nighttime.
Beirness 1987 Pattern
identification in
BAC self-
estimations
(Canada).
Drinking
sessions.
(breath
measures,
BAC self-
estimation)
72 volunteers aged 20-
57 (38 males, 34
females)
-the pattern of BAC estimation
errors is related to the decision
to drive after drinking.
-3 groups were identified.
-„Underestimators‟ are most
likely to drive while impaired.
Beirness et
al. (Traffic
Injury
Research
Foundation
)
2005 People perception
and driving behavior
(Canada).
Telephone
interview
1,209 randomly sampled
households interviewed
by Opinion search inc.
-88% of all impaired driving
trips are made by 4% of the
drivers.
-Young drivers account for
small% of the impaired driving
trips.
Compton
and
Berning
(NHTSA)
2009 Alcohol use by
drivers in the US.
National
roadside
survey
9,413 randomly sampled
nighttime drivers
-Males, motorcycle and pickup
drivers are more likely to drink
and drive.
-The % of drivers above illegal
BAC is higher at late
nighttime.
-Impaired drivers % has
decreased over 1973-2007.
Dawson 1999 Alcohol
consumption and
impaired driving
patterns in the US.
National
longitudinal
epidemiology
survey
18,352 drinkers out of
42,862 randomly
sampled households
-Impaired driving is higher
among individuals with high-
risk drinking patterns
De
Carvalho
Ponce et
al.
2011 Relate fatal accident
victims with alcohol
consumption
(Brazil)
Cross-
sectional
study
Crash reports from 907
accident victims in Sao
Paulo (2005)
-39.4% of the victims were
positive to alcohol.
- Most accidents occur at night
and weekends and involve
males aged 25-54.
-No age-related differentiation
among women.
Dols et al. 2010 Prevalence and
predictor factors for
driving after alcohol
and drug use
(Spain).
Cross-
sectional
survey
Questionnaires from
11,239 students aged 14-
18 in Valencia. Stratified
sampling.
-45% reported drink-driving.
- Alcohol dependence, being
male, having poor family
relationship increase the
likelihood of driving after
drinking.
Frick et al. 2000 Light alcohol Double-blind 104 students aged 19-24 -Light alcohol consumption

18
consumption and
crash risk perception
(German)
block-
randomized
experiment
does not influence risk
perception and has a positive
influence on the ability to
detect traffic hazards.
Gawron
and
Ranney
1990 Efficiency of spot
treatments as
alcohol
countermeasure
(US).
Driving
simulator
12 licensed male drivers
aged 21-55
-Spot treatment effect was
relatively weak.
Harrison
and
Fillmore
2005 Driving skills and
impairment level
due to alcohol
consumption (US)
Driving
simulator,
questionnaire,
subjective
impairment
measurement
28 volunteers (21-31
years of age)
-Individuals with poorer
baseline skills are more
impaired by alcohol
-Within-lane variation
increased with alcohol
consumption
Horwood
and
Ferguson
2000 Relationship
between drink
driving behavior and
accident rate (New
Zealand).
Birth cohort
study
(interview)
907 drivers in
Christchurch aged 21
-Drink-driving is related to
higher crash risk and to
general risk-taking driving
behaviors.
Keall et al. 2005 Influence of alcohol
and other risk
factors on nighttime
crash occurrence
(New Zealand).
Case-control
study
(logistic
regression)
23,912 crash records
(1997-1998) vs. 14,000
interviews from
randomly sampled
households.
-Risk at night decreases with
increasing age.
-Higher volume roads are not
preferred by drinking drivers.
-Drivers under 40, weekend
trips and drink driving are risk
factors.
Keall et al. 2004 Influence of alcohol,
age and number of
passengers on
nighttime crash risk
(New Zealand).
Case-control
study
(logistic
regression)
103 fatal crash date and
14,000 interviews from
randomly sampled
households vs. 85,163
police BAC controls
(1995-2000)
-Risk is five times higher for
drivers aged under 20 and
three times higher for drivers
aged 20-29 for all BAC levels.
-Risk increases with the
number of passengers
-Fatal injury risk increases
exponentially with BAC.
LaBrie et
al.
2011 Predictors of driving
after drinking
among college
students (US).
Survey
(interviews)
3,753 from a randomly
degenerated list of
students from 2 West
Coast Universities
-Significant predictors include:
being male or member of
fraternities, having alcohol
abuse history, being heavy
drinker, showing higher
approval of drink-driving,
having alcohol expectancies
for sexual enhancement.
Lenné et
al.
2010 Effects of alcohol
and cannabis on
arterial driving
(Australia)
Driving
simulator
(main effects
models)
22 novice drivers (aged
18-21) and 25
experienced drivers aged
(25-40)
-Alcohol results to increases in
speed and lateral position
variation.
-Alcohol had no effect on
reaction time
-Alcohol effect was more
severe for inexperienced
drivers regarding speed
deviation and vehicle control.
Lenné et
al.
2003 Combined effect of
opioid
pharmacotherapies
and alcohol
Driving
simulator
(main effects
model)
10 methadone, 13
LAAM, 11
buprenorphine stabilised
clients, 21 non-using
-Alcohol at 0.05% impaired all
measurements of driving
performance.
-Alcohol had a more

19
(Australia) detrimental effect on speed
and steer deviation in straight
road sections.
Leung and
Starmer
2005 Effect of age and
alcohol on driving
performance
(Australia)
Driving
simulator
16 young (18-21), 16
mature (25-35) drivers
recruited in Sydney
-Alcohol impaired driver
ability to divide attention, but
had little effect on decision-
making.
-Young drivers showed a
greater tendency to engage in
risky driving.
-Other vehicle detection time
increases with alcohol
consumption and maturity.
Mann et al. 2010 Alcohol and driving
factors that increase
collision risk
(Canada)
Cross-
sectional
telephone
survey
8,542 Ontario adults.
(random digit-dialing
method)
-Drink-driving behavior, high
alcohol consumption and
alcohol problems are crash risk
predictors.
McCartt et
al.
2010 Effects of raising the
minimum legal
drinking age on
drink-driving in the
US.
Descriptive
meta-analysis
Fatal crash reports, road
surveys and alcohol
consumption
epidemiology survey.
-Raising the legal drinking age
reduces alcohol related crashes
on highways.
McMillen
et al.
1989 Effects of both
actual and expected
alcohol consumption
on driving (US)
Driving
simulator and
questionnaire
96 undergraduate (64
males, 32 females)
psychology students
aged 21+
-High sensation seekers drive
more dangerously if believing
to have consumed alcohol
- Low sensation seekers drive
more carefully if believing to
have consumed alcohol
Miller et
al.
1999 Extent, risks, and
cost of driving while
alcohol-impaired
(US)
Case control
study
Crash reports vs.
roadside survey
-The number of drink-driven
kilometers declines.
- Driving at BALs > 0.08%
costs 50 times compared to
sober driving
Peck et al. 2008 Relationship
between BAC, age,
and crash risk (US)
Case control
study
(logistic
regression)
3,791 crash reposrts vs.
7,582 controls from road
surveys.
-age-BAC interaction is highly
significant
-Novice drivers are more
affected by alcohol
consumption.
-Drink drivers aged under 21
show pre-existing
characteristics that predisposed
them to risk
Rimm et
al.
1982 Effect of alcohol
expectancies on
driving errors (US)
Driving
simulator
44 male students from a
Texas University, social
drinkers
-Alcohol impairs abilities
critical to driving.
-No alcohol expectancy affects
driving.
Ronen et
al.
2008 Effects of THC vs.
alcohol on driving
performance and
subjective feelings
(Israel)
Driving
simulator
(factor
analysis)
14 students (aged
26.11.3), recreational
marijuana and alcohol
users
-the effects of 0.05% BAC are
similar to low-level THC
cigarettes.
-Alcohol consumption caused
speed and reaction time
increase, sleepiness, and lack
of attention.
Ronen et
al.
2010 Combined effects of
alcohol and THC on
willingness to drive
Driving
simulator
12 students (7 males, 5
females), recreational
marijuana and alcohol
-Consuming THC increases
alcohol impairment.
-Alcohol consumption

20
and driving task
performance (Israel)
users, aged 24-29 increases speed.
-No effects were observed 24h
after consumption.
Vollrath et
al.
2005 Consequences of
relaxing the BAC
limit in East
Germany
Roadside
surveys and
interviews
21,198 drivers randomly
stopped by police mostly
at nighttime and on
weekends in Thüringen
and Unterfranken
-Raising BAC limit increases
BAC of drink-drivers, but not
their number.
-Young drivers are more
vulnerable to legal changes
than other drivers.
641