York Boulevard — The Economics of a Road Diet, McCormick, Cullen · Miguel Ramos LACBC Jim...
85
By Cullen McCormick THE ECONOMICS OF A ROAD DIET
Transcript of York Boulevard — The Economics of a Road Diet, McCormick, Cullen · Miguel Ramos LACBC Jim...
By Cullen McCormick
THE ECONOMICS OF A ROAD DIET


AcknowledgementsI would like to thank the following individuals and organizations for their irreplaceable support with this project:
Bikes Belong financial sponsorshipAlexis Lantz LACBC, Client RepresentativeDonald Shoup, Ph.D. UCLA, Faculty AdvisorNate Baird LADOT, Project Advisor
Daniella Alcedo LACBCEvelyn Blumenberg, Ph.D. UCLAJane Choi LA Department of City PlanningLeobardo Estrada, Ph.D. UCLARicardo Gutierrez LADOT, UCLAJen Klausner LACBCMichelle Mowery LADOTMiguel Ramos LACBCJim Schwartzenberger California State Board of EqualizationMiguel Vargas LACBCThe businesses and patrons of York Boulevard
ACKNOWLEDGEMENTS
iii

Table of Contents
ES Executive Summary ES1
1 Introduction 1
2 Abridged Literature Review 12
3 Methodology 15
4 Findings 31
5 Recommendations 44
A Complete Literature Review A1
B References B1
C Survey Instruments C1
List of Tables
ES1 Researchapproachandfindings ES6
1 Research methods and resources 16
2 Initial hedonic price model variables 26
3 Quantitative data summary 35
4 Sales tax revenues in 2011 dollars 37
A1 Summary of existing empirical
research A3
YORK BOULEVARD: THE ECONOMICS OF A ROAD DIET
iv
List of Sidebar Discussions
The mechanics of a road diet 4
About York Boulevard 7

TABLE OF CONTENTS
v
List of Figures
ES1 Typical road diet conversion ES2
ES2 York Boulevard study corridor ES3
1 Typical road diet conversion 3
2 York Boulevard study corridor 5
3 Business survey sample
development 19
4 Customer intercept survey
locations 20
5 Sales tax analysis parcel selection
process 22
6 Board of Equalization sales tax data
availability 23
7 Business composition comparison 30
8 Merchant survey responses 33
9 Customer survey responses 34
10 Reasons for supporting or not
supporting bike lanes that replace
on-street parking 32
11 Average property sale price per
square foot and sales tax revenues
in 2011 dollars 36
12 Property sale locations and sale
values per square foot in 2011
dollars 38

YORK BOULEVARD: THE ECONOMICS OF A ROAD DIET
ES1
ES. Executive SummaryPremise
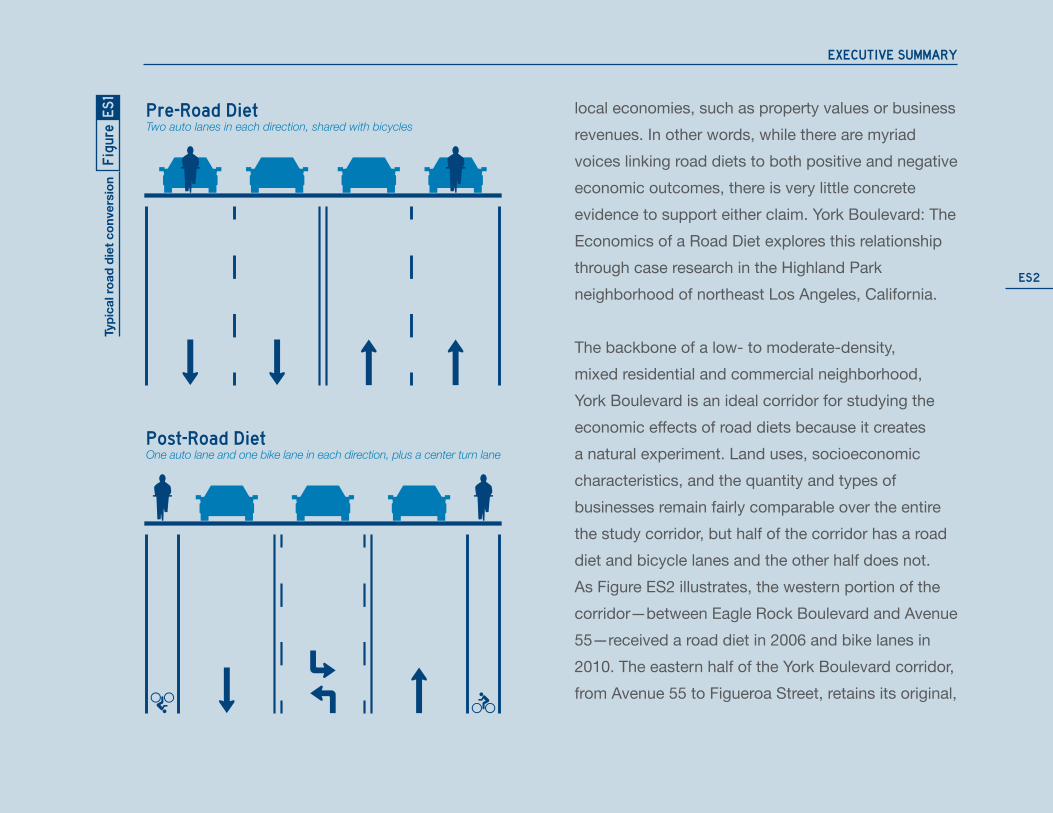
Cities throughout the United States are increasingly implementing bicycle infrastructure and related roadway modifications as a unified approach to mounting environmental, public health, and traffic safety concerns. Among the most ubiquitous modifications are “road diets,” which reapportion auto lanes used for through-moving traffic to center turn lanes, bike lanes, widened sidewalks, and/or on-street parking. Figure ES1 depicts a typical road diet conversion. While road diets have gained support in many communities, they are also a
source of controversy among some merchants and residents. These constituents feel that reducing auto lanes or replacing them with bike lanes creates traffic congestion, makes it more challenging for customers to access businesses, and may negatively impact property values.
Traffic studies have consistently shown that road diets will not worsen congestion under the appropriate conditions—streets with less than about 20,000 daily vehicle trips, or roughly what one might expect on the main street of a small to medium downtown. Yet there are remarkably fewer data on how road diets affect components of surrounding
ES2
EXECUTIVE SUMMARY
local economies, such as property values or business revenues. In other words, while there are myriad voices linking road diets to both positive and negative economic outcomes, there is very little concrete evidence to support either claim. York Boulevard: The Economics of a Road Diet explores this relationship through case research in the Highland Park neighborhood of northeast Los Angeles, California.
The backbone of a low- to moderate-density, mixed residential and commercial neighborhood, York Boulevard is an ideal corridor for studying the economic effects of road diets because it creates a natural experiment. Land uses, socioeconomic characteristics, and the quantity and types of businesses remain fairly comparable over the entire the study corridor, but half of the corridor has a road diet and bicycle lanes and the other half does not. As Figure ES2 illustrates, the western portion of the corridor—between Eagle Rock Boulevard and Avenue 55—received a road diet in 2006 and bike lanes in 2010. The eastern half of the York Boulevard corridor, from Avenue 55 to Figueroa Street, retains its original,
Pre-Road DietTwo auto lanes in each direction, shared with bicycles
Post-Road DietOne auto lane and one bike lane in each direction, plus a center turn lane
Figu
reTy
pica
l roa
d di
et c
onve
rsio
nES
1

YORK BOULEVARD: THE ECONOMICS OF A ROAD DIET
ES3
2
110
Eagl
e Ro
ck B
lvd
Ave
55
Ave
54Ave
50
Aldama St
Figueroa St
York Blvd
OccidentalCollege
Highland Park MetroGold Line Station
HighlandPark
Eagle Rock
FranklinHigh School
Eagle Rock Boulevard - Avenue 55Road diet/bike lanes
Avenue 55 - Figueroa StreetNo road diet/bike lanes
York Boulevard Study Corridor
LosAngeles
DowntownLos Angeles
YorkBoulevard
1 Mile
Figu
reYo
rk B
oule
vard
stu
dy c
orrid
orES
2

ES4
EXECUTIVE SUMMARY
On-street bicycle facilities demonstrate no consistent effect on economic metrics such as business revenues, yet they remain contentious among adjacent businesses.
Research on road diets and economic activity is significantly limited. While existing research suggests that road diets can boost economic performance, negative perceptions of road diets persist among some segments of the public.
Methodology and Key FindingsThis project seeks to determine whether the York Boulevard road diet has helped, hindered, or had no effect on economic activity in the surrounding community. Specifically, I ask, since the York Boulevard road diet implementation in 2006, has there been any change in local economic activity between the sections of York Boulevard with and without a road diet/bicycle lanes? I define local economic activity to comprise quantitative metrics of economic performance, such as property values, as well as qualitative perceptions, namely whether local
non-road diet configuration. These conditions present the unique opportunity to evaluate the economic effects of a road diet both temporally (before and after the road diet implementation) and spatially (how similar settings fare with and without a road diet). By controlling for differences over time and place, such an arrangement may produce more accurate findings than a comparable analysis in a less ideal setting.
Before launching into my analysis, I complete a review of the existing, albeit narrow literature on the interactions between road diets, bicycle facilities (such as bike lanes, bike routes, and bike paths), and local economies, which, for the most part, include property values, sales tax revenues, and stakeholder perceptions. This literature review yields the following overarching observations, which help inform my research approach:
Off-street bicycle paths generally have neutral or positive impacts on surrounding property values, yet findings related to off-street paths have little transferability to on-street bicycle infrastructure.

YORK BOULEVARD: THE ECONOMICS OF A ROAD DIET
ES5
important roadway additions. Still, opinions about removing on-street parking and auto lanes for bike lanes/road diets are divided.
On-street parking is clearly an important asset to both local merchants and customers.
Merchants’ perceptions about their customers’ travel patterns do not align with customers’ stated patterns. Merchants assume more customers drive than reflected in customer survey responses.
Businesses and customers alike seem to prefer slower vehicle speeds or feel that speed is unimportant.
RecommendationsQuantitative data do not support the notion that road diets lower surrounding local businesses and property values. Opposition to road diets on economic grounds therefore appears unfounded. Still, popular support for converting auto lanes and on-street parking to bike lanes remains lukewarm.
merchants and customers believe bicycle facilities have a generally positive or negative impact on their businesses and shopping patterns, respectively. I evaluate my hypothesis using the following resources:• Qualitative merchant and customer surveys• Quantitative data on property sale price, business
turnover and new businesses openings, sales tax revenues, and a hedonic price model integrating multiple data sources
Table ES1 summarizes my research approach and principal findings. From these findings I posit the following key takeaways:
Road diets have little effect on surrounding businesses, property values, and customer shopping patterns. Therefore, opposition to road diets on economic grounds appears unfounded.
The majority of surveyed merchants do not feel that bike lanes hurt their businesses, and similarly large percentages of customers believe bike lanes are

ES6
EXECUTIVE SUMMARY
Metric Analysis Findings
Qua
litat
ive Business
owner/manager surveys
Assesses merchants’ perceptions of road diets and bike lanes on business performance and customer shopping patterns
Survey responses are generally similar between merchants and customers and between both corridor halves. A noteworthy exception is that merchants’ perceptions about their customers’ travel patterns do not align with customers’ stated travel modes; merchants assume more customers drive to their businesses than reflected in customers’ responses
Customer intercept surveys
Assesses customers’ perceptions of road diets and bike lanes on shopping patterns
Qua
ntita
tive Property
sale priceCompares commercial and residential property sale price per square foot between the corridor halves and before/after the road diet implementation
No significant differences in property sale price exist between the corridor halves or before/after the road diet implementation
Bradley-Burns sales tax
Compares sales tax revenues, collected as a proxy for business sales, between the corridor halves and before/after the road diet implementation
Sales tax revenues are higher on the road diet section of York Boulevard; although, since the data are provided in aggregate terms, it is not possible to conduct statistical tests or attribute the higher sales tax revenues to the presence of the road diet
New business openings
Compares the number of new businesses that have opened on each corridor half since the road diet implementation
No significant differences exist in the number of new business openings between the two corridor halves
Business turnover
Compares the number of businesses on each corridor half that have closed over the 2001-2011 period
No significant differences exist in business turnover between two the corridor halves
Hedonic price model
Gauges how much the presence or absence of a road diet influences property sale price
The presence or absence of road diet is not a significant determinant of property sale price
Tabl
eResea
rchap
proa
chand
find
ings
ES1

YORK BOULEVARD: THE ECONOMICS OF A ROAD DIET
ES7
Cities and bicycle advocacy organizations should integrate localized economic impact studies into bikeway planning and conduct follow-up studies after bikeway implementation. Such studies may help rectify the dissonance between economic data on road diets, which suggest these treatments have little economic impact on surrounding communities, and community perceptions, which reflect a greater hesitance to convert travel lanes or on-street parking to bike lanes for economic reasons.
Given the stated importance of on-street parking among community members, future economic research should examine how converting on-street parking to bike lanes affects adjacent businesses.
Cities should continue their efforts to install road diets, bike lanes, and similar infrastructure.
In summary, road diets appear unlikely to harm local economies. Cities, employing proper outreach, should therefore continue to install road diets to improve safety and encourage bicycling.
Given pressing safety concerns for people riding bicycles—if not broader concerns for public health and the environment—simply not building bikeways in controversial situations is an untenable solution. In light of these conditions, I propose the following recommendations and potential avenues for future research.
The design of road diets and bicycle facilities must carefully involve local community members—especially those whose businesses and homes flank proposed road diets and bicycle facilities—and any roadway modifications must be sensitive to the needs of people who bicycle as well as those who do not.
Multilingual, multifaceted outreach efforts are essential to successful bikeway projects.
When faced with the decision between removing an auto travel lane or on-street parking for a bike lane installation, cities should favor removing the travel lane or defer to local preferences.


YORK BOULEVARD: THE ECONOMICS OF A ROAD DIET
1
low-income communities. Los Angeles’ highways, as well as local streets, also rank among the most congested in America—burning fuel and time, and fueling growing concern about global climate change (Texas Transportation Institute, 2011). Finally, and shockingly, 99 Californians lost their lives while bicycling in 2009, the second highest number of such fatalities in the country (National Highway Traffic Safety Administration, 2011). Almost a quarter of these fatalities, 22, occurred in Los Angeles County (Biking in LA, 2012).
At the same time as these traffic safety, environmental, and health issues come to a head, transportation infrastructure is crumbling. Today’s municipalities operate in an increasingly constrained budgetary environment, limiting cities’ abilities to upkeep infrastructure (Yglesias, 2011). The dearth of revenues has resulted in transportation maintenance needs that have largely eclipsed stagnating available funds (Taylor, 1995). Even worse, and as nearly every American is aware, national recession and sweeping home foreclosures have put countless individuals out
1. IntroductionLos Angeles at a Crossroads
As Los Angeles progresses into the second decade of the twenty-first century, the city is increasingly experiencing the pressures of interwoven public health, environmental, and economic concerns. Rates of obesity and diabetes have climbed to epidemic proportions throughout the city and are highest among economically disadvantaged populations (County of Los Angeles, 2011; County of Los Angeles, 2007). On many days of the year, regional air quality remains among the worst in the country, which has spurred rising incidences of asthma and other respiratory ailments (South Coast Air Quality Management District, n.d.). Moreover, an expanding body of research suggests that exposure to ultrafine particles emitted from diesel exhaust may adversely affect the brain and heart in previously unforeseen ways (Li et al., 2010; McAuley et al., 2010; Schmid et al., 2009). These findings generate particular concern in Los Angeles given the region’s numerous ports, rail terminals, and highways, many of which abut
2
INTRODUCTION
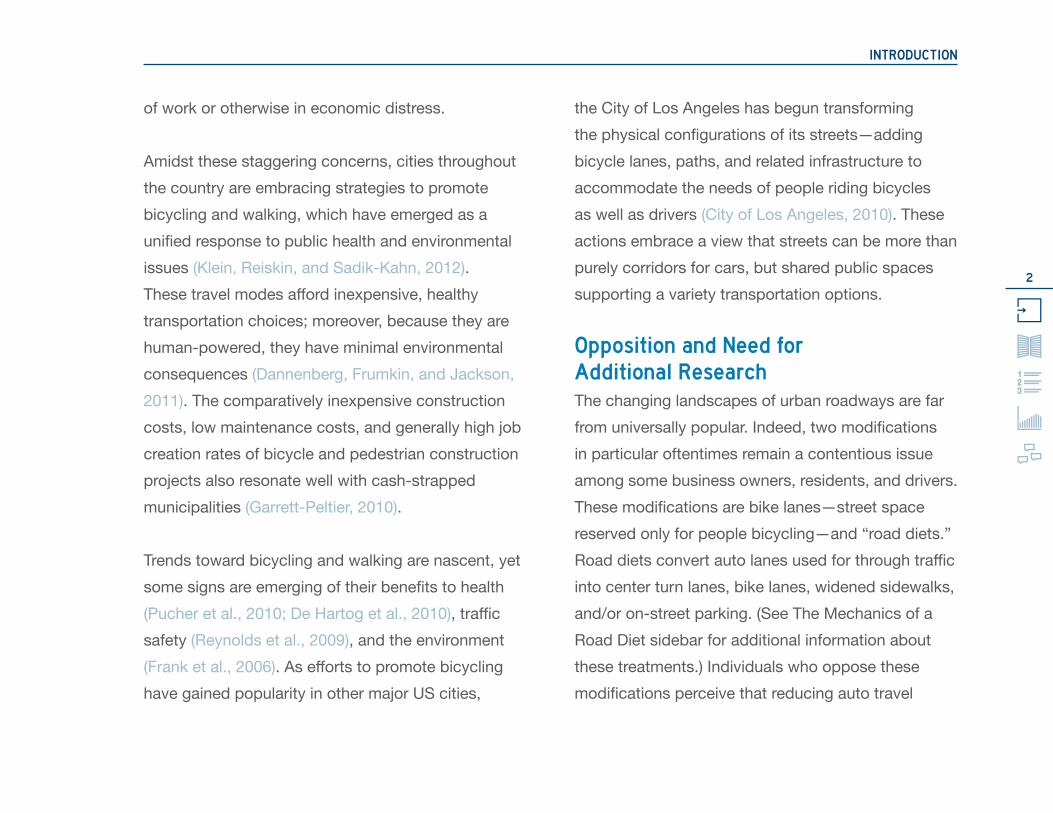
the City of Los Angeles has begun transforming the physical configurations of its streets—adding bicycle lanes, paths, and related infrastructure to accommodate the needs of people riding bicycles as well as drivers (City of Los Angeles, 2010). These actions embrace a view that streets can be more than purely corridors for cars, but shared public spaces supporting a variety transportation options.
Opposition and Need for Additional ResearchThe changing landscapes of urban roadways are far from universally popular. Indeed, two modifications in particular oftentimes remain a contentious issue among some business owners, residents, and drivers. These modifications are bike lanes—street space reserved only for people bicycling—and “road diets.” Road diets convert auto lanes used for through traffic into center turn lanes, bike lanes, widened sidewalks, and/or on-street parking. (See The Mechanics of a Road Diet sidebar for additional information about these treatments.) Individuals who oppose these modifications perceive that reducing auto travel
of work or otherwise in economic distress.
Amidst these staggering concerns, cities throughout the country are embracing strategies to promote bicycling and walking, which have emerged as a unified response to public health and environmental issues (Klein, Reiskin, and Sadik-Kahn, 2012). These travel modes afford inexpensive, healthy transportation choices; moreover, because they are human-powered, they have minimal environmental consequences (Dannenberg, Frumkin, and Jackson, 2011). The comparatively inexpensive construction costs, low maintenance costs, and generally high job creation rates of bicycle and pedestrian construction projects also resonate well with cash-strapped municipalities (Garrett-Peltier, 2010).
Trends toward bicycling and walking are nascent, yet some signs are emerging of their benefits to health (Pucher et al., 2010; De Hartog et al., 2010), traffic safety (Reynolds et al., 2009), and the environment (Frank et al., 2006). As efforts to promote bicycling have gained popularity in other major US cities,

YORK BOULEVARD: THE ECONOMICS OF A ROAD DIET
3
lanes or replacing them with bike lanes creates traffic congestion, makes it more challenging for customers to access businesses, and may negatively impact property values (Aldous, 2011; Banks, 2010; Bowen, 2011; Grynbaum, 2011; Lee, 2011; Scott, 2011). Indeed, road diets remain a particularly controversial subject in Los Angeles, where debates of their merit soldier on passionately in community meetings and public discourse (Banks, 2010).
At the same time, traffic analyses have consistently found that road diets on streets that carry roughly 20,000 autos per day will generally not worsen traffic congestion (Huang, Stewart, and Zegeer, 2004; see The Mechanics of a Road Diet sidebar for additional explanation). Twenty thousand trips per day is approximately the amount of traffic York Boulevard carries, or what one might expect on the main street of a small to medium downtown. Without significantly altering auto capacity, road diets expand space for people to bicycle. This unique harmony may help allay concerns over road diets reducing auto capacity. Yet planners and economists have
Pre-Road DietTwo auto lanes in each direction, shared with bicycles
Post-Road DietOne auto lane and one bike lane in each direction, plus a center turn lane
Figu
reTy
pica
l roa
d di
et c
onve
rsio
n1
4
INTRODUCTION
The Mechanics of a Road Diet
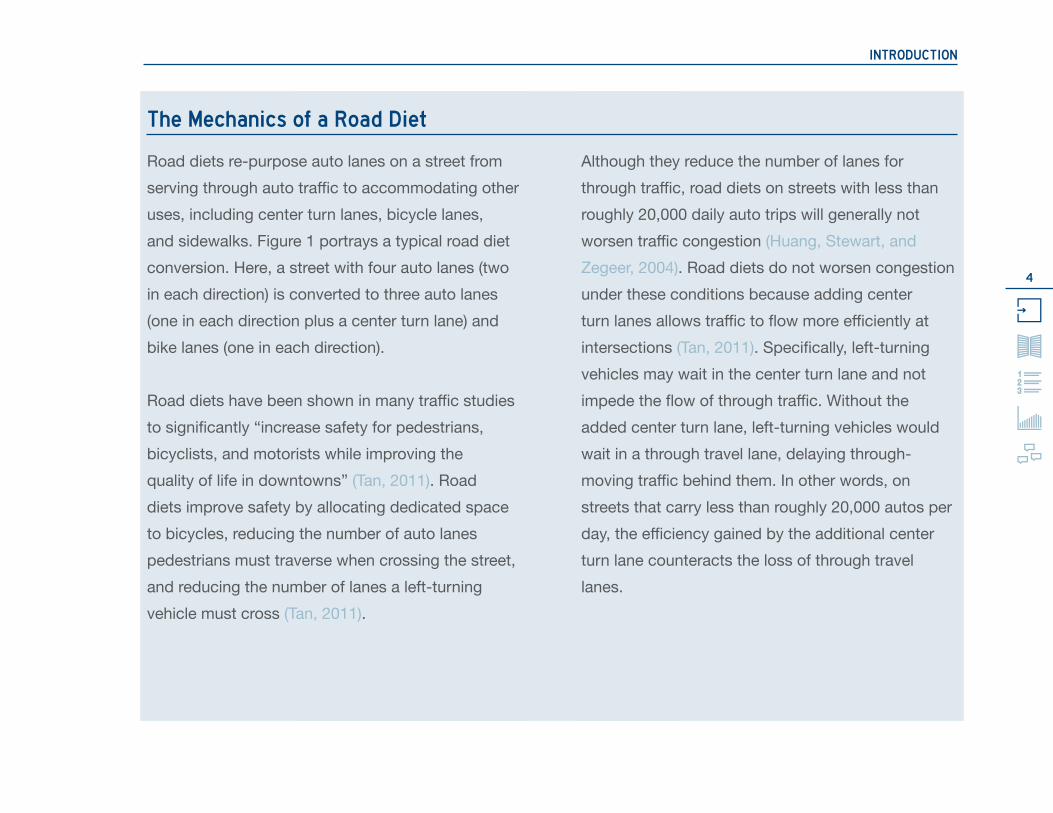
Road diets re-purpose auto lanes on a street from serving through auto traffic to accommodating other uses, including center turn lanes, bicycle lanes, and sidewalks. Figure 1 portrays a typical road diet conversion. Here, a street with four auto lanes (two in each direction) is converted to three auto lanes (one in each direction plus a center turn lane) and bike lanes (one in each direction).
Road diets have been shown in many traffic studies to significantly “increase safety for pedestrians, bicyclists, and motorists while improving the quality of life in downtowns” (Tan, 2011). Road diets improve safety by allocating dedicated space to bicycles, reducing the number of auto lanes pedestrians must traverse when crossing the street, and reducing the number of lanes a left-turning vehicle must cross (Tan, 2011).
Although they reduce the number of lanes for through traffic, road diets on streets with less than roughly 20,000 daily auto trips will generally not worsen traffic congestion (Huang, Stewart, and Zegeer, 2004). Road diets do not worsen congestion under these conditions because adding center turn lanes allows traffic to flow more efficiently at intersections (Tan, 2011). Specifically, left-turning vehicles may wait in the center turn lane and not impede the flow of through traffic. Without the added center turn lane, left-turning vehicles would wait in a through travel lane, delaying through-moving traffic behind them. In other words, on streets that carry less than roughly 20,000 autos per day, the efficiency gained by the additional center turn lane counteracts the loss of through travel lanes.

YORK BOULEVARD: THE ECONOMICS OF A ROAD DIET
5
2
110
Eagl
e Ro
ck B
lvd
Ave
55
Ave
54Ave
50
Aldama St
Figueroa St
York Blvd
OccidentalCollege
Highland Park MetroGold Line Station
HighlandPark
Eagle Rock
FranklinHigh School
Eagle Rock Boulevard - Avenue 55Road diet/bike lanes
Avenue 55 - Figueroa StreetNo road diet/bike lanes
York Boulevard Study Corridor
LosAngeles
DowntownLos Angeles
YorkBoulevard
1 Mile
Figu
reYo
rk B
oule
vard
stu
dy c
orrid
or2

6
INTRODUCTION
with community economic activity. My hope is that planners, community members, and other decision-makers can apply the body of information this research generates to enhance the planning, design, and outreach efforts of future road diet and bicycle infrastructure projects.
Why York Boulevard?This project examines the community lining the roughly two-mile section of York Boulevard between Eagle Rock Boulevard and Figueroa Street in the Highland Park neighborhood of northeast Los Angeles, California. This section of York Boulevard is the backbone of a low- to moderate-density, mixed residential and commercial neighborhood. As Figure 2 illustrates, the western portion of the corridor—between Eagle Rock Boulevard and Avenue 55—received a road diet in 2006. The road diet reconfigured the street from two travel lanes in each direction with on-street parking to one travel lane in each direction with a center turn lane and on-street parking. The Los Angeles Department of Transportation (LADOT) later added bike lanes to
only a limited understanding of the impacts of road diets and bicycle lanes on the economic health of adjacent communities (Krizek, 2007a). Furthermore, there is very little research into how merchants are likely to react to bike lanes/road diets and how business owners may perceive these modifications to affect their businesses. Indeed, the heads of city transportation departments in Chicago, New York, San Francisco, and other major US cities consistently call for additional research into the economic implications of bicycle infrastructure and road diets (Klein, Reiskin, and Sadik-Kahn, 2012).
This information gap detracts from arguments both favoring and opposing road diets on economic grounds since factual data to support either claim are scarce. The need for information of this nature is particularly relevant given that economic vitality remains a prevalent concern among road diet opponents, if not all Americans. York Boulevard: The Economics of a Road Diet helps close the knowledge gap by providing a definitive illustration of exactly how road diets and bike lanes interact

YORK BOULEVARD: THE ECONOMICS OF A ROAD DIET
7
Figueroa St
York Blvd
Ave
54Av
e 55
Ave
50
Eagle Ro
ck B
lvd 1832.20
1833.001834.01
1836.201836.10
1834.021862.01
Road DietEagle Rock Blvd - Ave 55Length: 1.3 miles
Non-Road DietAve 55 - Figueroa StLength: 0.88 miles
Section
About York Boulevard
1 Mile
Soci
oeco
nom
ics
Con
figur
atio
n/U
sage
Race/Ethnicity Pie Chart
LatinoWhite
BlackAsian
Other
1832.20 Census tract
Median Income Map
$50,000 - $55,000$45,000 - $50,000$40,000 - $45,000
Source: US Census Bureau. 2010 US Census (race/ethnicity); 2010 American Community Survey 5-year estimates (income)
Street cross-section
8’ 8’11’ 11’ 11’ 11’ 11’
8’8’ 5’ 5’11’ 11’ 11’
Measurements: Google Earth
22,199York Blvd at Ave 546/25/200924-hour period
23,646York Blvd at Figueroa St10/12/201024-hour period
Daily auto trips
Source: LADOT
168York Blvd at Ave 509/13/2011Total of 2-hr a.m., 2hr-midday,and 2-hr p.m. counts
No data
Daily bicycle trips
Source: LACBCMeasurements: Google Earth

8
INTRODUCTION
Ave
55Av
e 54Av
e 50
Aldama St
Figue
roa St
Eagle Rock B
lvd
Ave
55
Meridian St
Ave
54Ave
50
Aldama St
Figue
roa St
York BlvdYork Blvd Eagle Roc
k Blvd
Zoning Bikeways
About York Boulevard (Continued)
1 Mile
Road DietEagle Rock Blvd - Ave 55
Non-Road DietAve 55 - Figueroa St
Section
Land
Use
sTi
mel
ine
153
97
Total businesses
Source: Author
Source: Los Angeles County Assessor’s Office Source: Los Angeles Department of City Planning
Distribution of uses
Source: Los Angeles County Assessor’s Office
0 50 100 150 200
AutomotiveIndustrialOffice (bank, commercial, office, medical)Other (religious, government, parking)
CommercialIndustrial
Bike laneBike route/bicyclefriendly streetProposedExisting
PublicResidential
Residential (multi family)
Vacant
RestaurantRetail
Residential (single family)
Zoni
ng/B
ikew
ays
2006
LADOT implementsYork Blvd road diet
2010
LADOT adds bikelanes to road dietsection of York Blvd
2012
York Boulevard: TheEconomics of a RoadDiet study completed
2012
York Blvd bike lanes plannedfor eastward extension toFigueroa St

YORK BOULEVARD: THE ECONOMICS OF A ROAD DIET
9
an arrangement may produce more accurate findings than a comparable analysis in a less ideal setting.
Project Goals and StructureThis project seeks to determine whether the York Boulevard road diet has helped, hindered, or had no effect on economic activity in the surrounding community. Specifically, I ask, since the York Boulevard road diet implementation in 2006, has there been any change in local economic activity between the sections of York Boulevard with and without a road diet/bicycle lanes? I define local economic activity to comprise quantitative metrics of economic performance, such as property values, as well as qualitative perceptions, namely whether local merchants and customers believe bicycle facilities have a generally positive or negative impact on their businesses and shopping patterns, respectively. As a point of departure, I assume that there is no difference in economic activity between the road diet and non-road diet sections of York Boulevard. I evaluate my hypothesis using the following resources:
this segment in December, 2010. The slightly wider eastern half of York Boulevard, from Avenue 55 to Figueroa Street, retains its original configuration of two travel lanes in each direction, a center turn lane, and on-street parking. Pending community support, LADOT plans to implement a road diet for this segment of York Boulevard as well, which would remove one travel lane and add bike lanes.
York Boulevard is an ideal corridor in which to study how road diets interact with surrounding economies because it creates a natural experiment. As the About York Boulevard sidebar displays, land uses, socioeconomic characteristics, and the quantity and types of businesses remain fairly comparable over the entire the study corridor, but half of the corridor has a road diet and bicycle lanes and the other half does not. This arrangement affords the unique opportunity to evaluate the economic effects of a road diet both temporally (before and after the road diet implementation) and spatially (how similar settings fare with and without a road diet). By controlling for differences over time and place, such
10
INTRODUCTION
noted above, this two-pronged approach relies upon qualitative surveys of businesspersons and customers as well as quantitative property sale price, sales tax, and new business/business turnover data analyses, as well as a hedonic price model. I also address considerations and known weaknesses to my research strategy, which generally stem from the inability to obtain completely random samples in my surveying efforts.
Chapter 4, Findings, presents the results of my analyses. I first analyze the survey data and find minimal differences in survey responses between the two sections of York Boulevard. I then turn to the quantitative data sources, which likewise exhibit statistically insignificant differences in economic metrics between the road diet and non-road diet segments. I contrast and draw conclusions from the qualitative and quantitative sources, revealing that road diets and bike lanes are not likely to adversely affect surrounding local economies.
• Qualitative merchant and customer surveys• Quantitative comparisons of property sale
price data, data on business turnover and new businesses openings, sales tax data, and a hedonic price model integrating multiple data sources
I begin this investigation in Chapter 2, Abridged Literature Review, with a summary of existing research into the economic implications of bicycle infrastructure and road diets. This limited body of research yields no consistent relationship between bike lanes and economic activity but does suggest that road diets may boost economic performance based on property values, sales taxes, and stakeholder perceptions. The abridged literature review presents only major research themes and their applicability to the York Boulevard study. Appendix A contains the complete literature review.
Chapter 3, Methodology, outlines the research strategy for analyzing the economic impacts of the bike lanes and road diet along York Boulevard. As
YORK BOULEVARD: THE ECONOMICS OF A ROAD DIET
11
auto lanes and on-street parking to bike lanes remains lukewarm. I therefore recommend a bikeway outreach, planning, and design process that carefully involves local community members. Finally, cities and bicycle advocacy organizations should integrate studies similar to this investigation into bikeway planning and post-implementation evaluation.
Chapter 5, Recommendations, concludes the study. Based on the quantitative analyses, opposition to road diets on economic grounds appears to be unfounded. Furthermore, under the proper conditions, there is little basis in traffic engineering for road diet opposition (Tan, 2011; Huang, Stewart, and Zegeer, 2004). Still, popular support for converting

12
ABRIDGED LITERATURE REVIEW
Research on road diets and economic activity is significantly limited. While existing research suggests that road diets can boost economic performance, negative perceptions of road diets persist among some segments of the public.
Takeaway From LiteratureThe majority of existing research into road diets, bicycle infrastructure, and economic activity pertains to the economic impacts of off-street bike paths, which have little transferability to their on-street counterparts (Racca and Dhanju, 2006). Moreover, the limited research addressing road diets and on-street bicycle facilities in an economic light—and the even further constrained body of peer-reviewed work—produces a wide spectrum of conclusions (Krizek, 2007a). These findings vary immensely by region and perhaps even by methodology (Krizek, 2007a). Stantec’s report, for example, identifies that merchants tended to overestimate losses in surveys when compared to recorded sales data (2011). Finally, the dearth of economic research on road diets makes it nearly impossible to develop meaningful
2. Abridged Literature ReviewKey Literature Findings
Before launching into my analysis, I complete a review of the existing, albeit narrow literature on the interactions between road diets, bicycle facilities (such as bike lanes, bike routes, and bike paths), and local economies, which, for the most part, include property values, sales tax revenues, and stakeholder perceptions. Appendix A contains a complete literature review. Here, I summarize the overarching findings of the review and discuss the literature’s applicability to the York Boulevard study.
Off-street bicycle paths generally have neutral or positive impacts on surrounding property values, yet findings related to off-street paths have little transferability to on-street bicycle infrastructure.
On-street bicycle facilities demonstrate no consistent effect on economic metrics such as business revenues, yet they remain contentious among adjacent businesses.

YORK BOULEVARD: THE ECONOMICS OF A ROAD DIET
13
The York Boulevard study proffers recommendations to create bicycle facilities that are economically harmonious with their context. Stantec’s report offers a relevant framework for such facilities, including, for example, “allocating scare [road] space to different uses according to the demand at different times” and moving “quickly to meet with the businesses that have been particularly impacted...in order to mitigate sales losses” (2011, vi).
Although Krizek (2006) and Racca and Dhanju (2006) show on-street bikeways to have little effect on property values, these studies investigate only residential environments. Examining property sale prices along a mixed commercial and residential corridor such as York Boulevard may yield differing results. Additionally, the socioeconomic contexts of Krizek (2006) and Racca and Dhanju’s (2006) studies—Minneapolis-Saint Paul and Delaware, respectively—may very well be irrelevant to Los Angeles.
conclusions about their economic impact.
Skepticism toward on-street bicycle facilities and road diets clearly persists—particularly among merchants when such facilities come at the expense of on-street parking (Grynbaum, 2011; Lee, 2011; Scott, 2011). Although the opinions of proponents and opponents are essential to framing discussions, they alone should not guide on-street bikeway decision-making. Yet, excepting hedonic price analyses, much existing research draws upon “anecdote rather than actual market data” while existing, readily available sources, such as sales tax revenues and property values, go largely untapped (Nicholls and Crompton, 2005, 321). This incongruence calls to a need for research that balances surveys—an excellent mechanism for assessing stakeholder perceptions—with numeric sales and property data, which minimize bias in the conditions they portray. My research fuses surveys with numeric data in just this manner.
14
ABRIDGED LITERATURE REVIEW
Perhaps the most cohesive criteria for future economic studies of road diets and bikeways comes from Krizek et al. (2007b), which establishes that research should:1. Measure effects at a neighborhood, municipal, or
regional scale2. Inform bikeway policy decisions and
implementation3. Utilize stakeholder surveys and existing data4. Employ units that are comparable within the
individual study as well as among related studies5. Quantify effects both for cyclists and the broader
community
The methodology I employ, described in the next section, builds explicitly upon Krizek’s (2007b) five recommendations.

YORK BOULEVARD: THE ECONOMICS OF A ROAD DIET
15
Using these sources stems directly from the economic impact research framework that Krizek et al. (2007b) develops to assess bicycle infrastructure.
I use the above data sources to evaluate a number of key variables. In all instances, the independent variable is the presence or absence of a road diet. I attempt to determine how this independent variable interacts with several dependent variables that together represent economic activity. For the surveys, the dependent variable is perceptions of how bike lanes and a road diet may affect shopping patterns and business performance. The quantitative data sources all attempt to measure a dependent variable I refer to as economic performance—whether property values and sales tax revenues are higher and whether there are more new businesses in either the road diet or non-road diet section of York Boulevard.
The unit of analysis for measuring the above variables is York Boulevard between Eagle Rock Boulevard and Figueroa Street (as displayed previously in Figure 2). Specifically, my research compares the section of
3. MethodologyResearch Question
This research asks the following question: since the York Boulevard road diet implementation in 2006, has there been any change in local economic activity between the sections of York Boulevard with and without a road diet/bicycle lanes? I define local economic activity to comprise quantitative metrics of economic performance, such as property sale prices—a close approximation of overall property value—and sales taxes—a proxy for retail sales revenues. My definition also includes qualitative perceptions, namely whether local merchants believe road diets/bike lanes to improve or hurt their businesses and whether these pieces of road infrastructure affect customers’ shopping patterns.
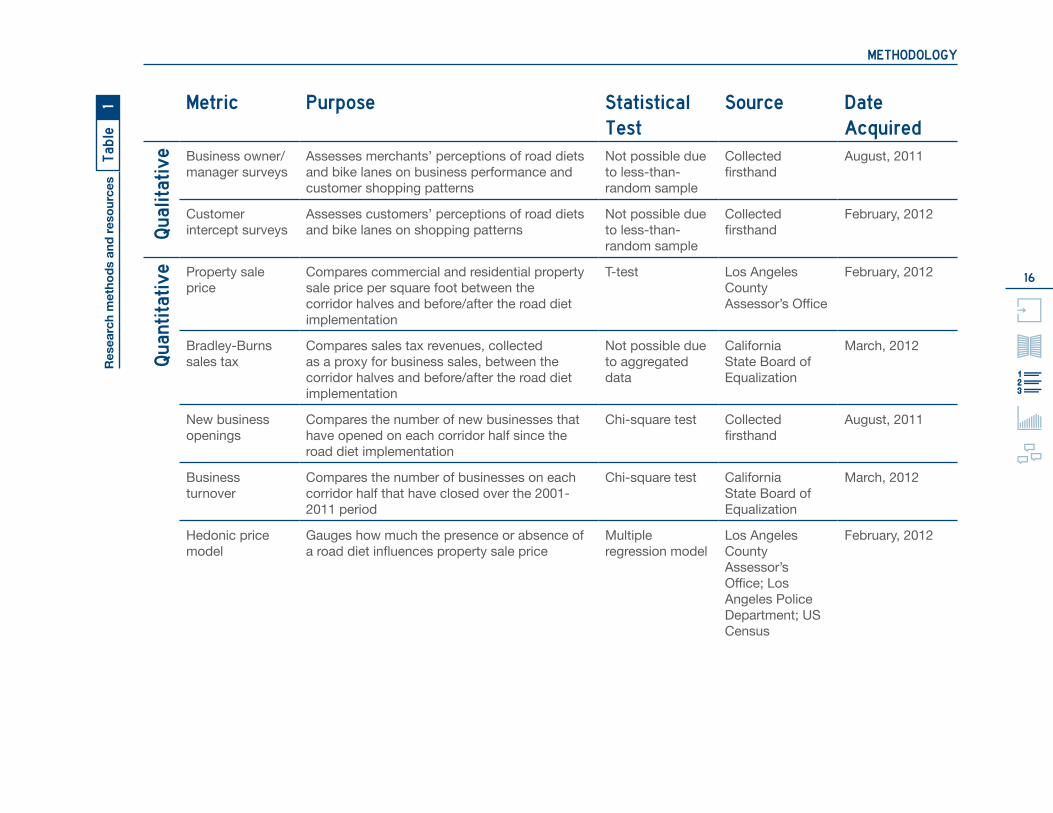
Research DesignTo determine what changes in local economic activity, if any, have occurred since the York Boulevard road diet procedure, this research utilizes the methods and resources outlined in Table 1.
16
METHODOLOGY
Metric Purpose Statistical Test
Source Date Acquired
Qua
litat
ive Business owner/
manager surveysAssesses merchants’ perceptions of road diets and bike lanes on business performance and customer shopping patterns
Not possible due to less-than-random sample
Collected firsthand
August, 2011
Customer intercept surveys
Assesses customers’ perceptions of road diets and bike lanes on shopping patterns
Not possible due to less-than-random sample
Collected firsthand
February, 2012
Qua
ntita
tive Property sale
priceCompares commercial and residential property sale price per square foot between the corridor halves and before/after the road diet implementation
T-test Los Angeles County Assessor’s Office
February, 2012
Bradley-Burns sales tax
Compares sales tax revenues, collected as a proxy for business sales, between the corridor halves and before/after the road diet implementation
Not possible due to aggregated data
California State Board of Equalization
March, 2012
New business openings
Compares the number of new businesses that have opened on each corridor half since the road diet implementation
Chi-square test Collected firsthand
August, 2011
Business turnover
Compares the number of businesses on each corridor half that have closed over the 2001-2011 period
Chi-square test California State Board of Equalization
March, 2012
Hedonic price model
Gauges how much the presence or absence of a road diet influences property sale price
Multiple regression model
Los Angeles County Assessor’s Office; Los Angeles Police Department; US Census
February, 2012
Tabl
eR
esea
rch
met
hods
and
reso
urce
s1

YORK BOULEVARD: THE ECONOMICS OF A ROAD DIET
17
were collected. Unfortunately, the inception of this research project in 2011 bars me from having collected surveys before the road diet and bike lane implementations. The quantitative analyses all compare conditions before and after the road diet implementation in 2006. The Los Angeles Department of Transportation (LADOT) added bike lanes to the road diet section of York Boulevard in 2010. With this narrow time frame, there are insufficient data to measure whether the bike lanes are associated with any additional change in economic conditions above and beyond those that might be linked to the road diet. Accordingly, the quantitative sources principally address the potential economic impacts associated with the road diet procedure.
Survey Methodology and Analysis ProceduresSurvey OverviewI survey a sample of more than 50 businesses from each section of the York Boulevard study corridor. Additionally, I complete a patron intercept survey with 25 customers from each corridor half. The
York Boulevard with bike lanes and a road diet—from Eagle Rock Boulevard to Avenue 55—to the section between Avenue 55 and Figueroa Street without these features.
Study populations vary depending on the given analysis. For the business surveys and new business data, the population includes all businesses directly abutting York Boulevard between Eagle Rock Boulevard and Figueroa Street. The sales tax and business turnover data include all non-chain businesses with taxable sales, which is explained in greater detail below, over this same geography. For property sale price information and the hedonic price model, the population includes all commercial and residential parcels with available data directly abutting York Boulevard. The intercept surveys target any individual shopping, dining, or walking along York Boulevard.
All surveys reflect attitudes, opinions, and other conditions present from August, 2011, until February, 2012, the period during which surveys

18
METHODOLOGY
Considerations and Survey Results sections below, are generally about 50 percent.
The business surveys contain 11 yes/no, multiple choice, and short answer questions. The questions inquire about the following subjects:• Business tenure• Perceived customer modes of transport used to
access York Boulevard• Attitudes toward road width and vehicle travel
speed—as proxies representing road diet/non-road diet conditions—and whether these factors have any impact on business performance
• Attitudes toward bike lanes—whether businesspersons feel that bike lanes have hurt their business and whether they would be willing to trade an auto travel lane or on-street parking for a bike lane
The customer intercept surveys comprise a shorter, six-question survey including yes/no, multiple choice, and short answer questions. This instrument asks for the following information:
business surveys investigate whether interviewees—comprising business owners and managers—feel that bike lanes, vehicle travel speeds, and roadway width, as well as trade-offs between vehicle travel lanes, on-street parking, and bike lanes, have any effect on business performance. The patron intercept surveys ask whether customers feel these same variables affect where they choose to shop.
Survey Question DevelopmentI develop the businessperson and customer survey instruments, shown in Appendix C, through an iterative process with Los Angeles County Bicycle Coalition staff, Los Angeles Department of Transportation Bicycle Program staff, and UCLA Luskin School of Public Affairs faculty. For ease and speed of implementation, I primarily utilize yes/no and multiple choice question formats. I create both English and Spanish versions of the surveys, as well as an oral consent document, and administer the surveys in both languages. I administer the surveys in person and record participants’ responses. Survey response rates, which I expand upon in the

YORK BOULEVARD: THE ECONOMICS OF A ROAD DIET
19
corridor. I cross-reference the list of commercial parcels obtained through the ZIMAS database with the observed businesses directly abutting York Boulevard.
From these sources, I create one master list of businesses fronting the York Boulevard corridor. As Figure 3 displays, I then create two sub-lists of businesses, one for each half of the corridor. To obtain random samples, I alphabetize the businesses
• Mode of transport used to access York Boulevard• Attitudes toward road width and vehicle travel
speed—again as proxies representing road diet/non-road diet conditions—and whether these factors influence where customers choose to shop
• Attitudes toward bike lanes—whether customers feel that bike lanes are necessary infrastructure and whether they would be willing to trade an auto travel lane or on-street parking for a bike lane
Sample DevelopmentTo complete the business surveys, I first develop an accurate, comprehensive list of active businesses along the study corridor. I use the City of Los Angeles’ Zone Information and Map Access System (ZIMAS) online mapping database to develop the population of businesses from which to draw a sample. Specifically, I retrieve Assessor’s information for each parcel abutting York Boulevard. I note all parcels containing at least partial commercial activity on the site as determined by the parcel’s Use Code. I then conduct a field visit of the York Boulevard study
250TotalBusinesses along YorkBoulevard betweenEagle Rock Boulevardand Figueroa Street
97Non-road dietBusinesses alongYork Boulevardbetween Avenue 55and Figueroa Street
153Road diet
Businesses along YorkBoulevard between
Eagle Rock Boulevardand Avenue 55
50Road diet
Businesses inrandom sample
50Non-road dietBusinesses inrandom sample
Figu
reBu
sine
ss s
urve
y sa
mpl
e de
velo
pmen
t3

20
METHODOLOGY
walking along York Boulevard. (Walking includes trips to/from a car or bicycle.) Figure 4 shows the locations of these surveys.
My data analysis compares merchant and customer survey responses between the two halves of the York Boulevard corridor. I examine whether opinions differ between sections with and without bike lanes/road diets and between customers and patrons. To
on each of the sub-lists; I then sequentially number the businesses on each list. I use a random number generator to select 50 businesses from each list. The generator is run twice, once for each half of the corridor.
The customer intercept surveys involve a more straightforward procedure. I collect 25 survey responses for each half of the York Boulevard corridor for a total of 50 surveys. I survey any willing participant who I observe shopping, dining, or
Ave
55
Ave
54
Ave
50
Aldama St
York Blvd
Figueroa St
EagleRock Blvd
1 2 3 4 8
1 Mile
Road diet
Non-road diet
SectionYork Boulevard corridor Number of surveys conductedFi
gure
Cus
tom
er in
terc
ept s
urve
y lo
catio
ns4

YORK BOULEVARD: THE ECONOMICS OF A ROAD DIET
21
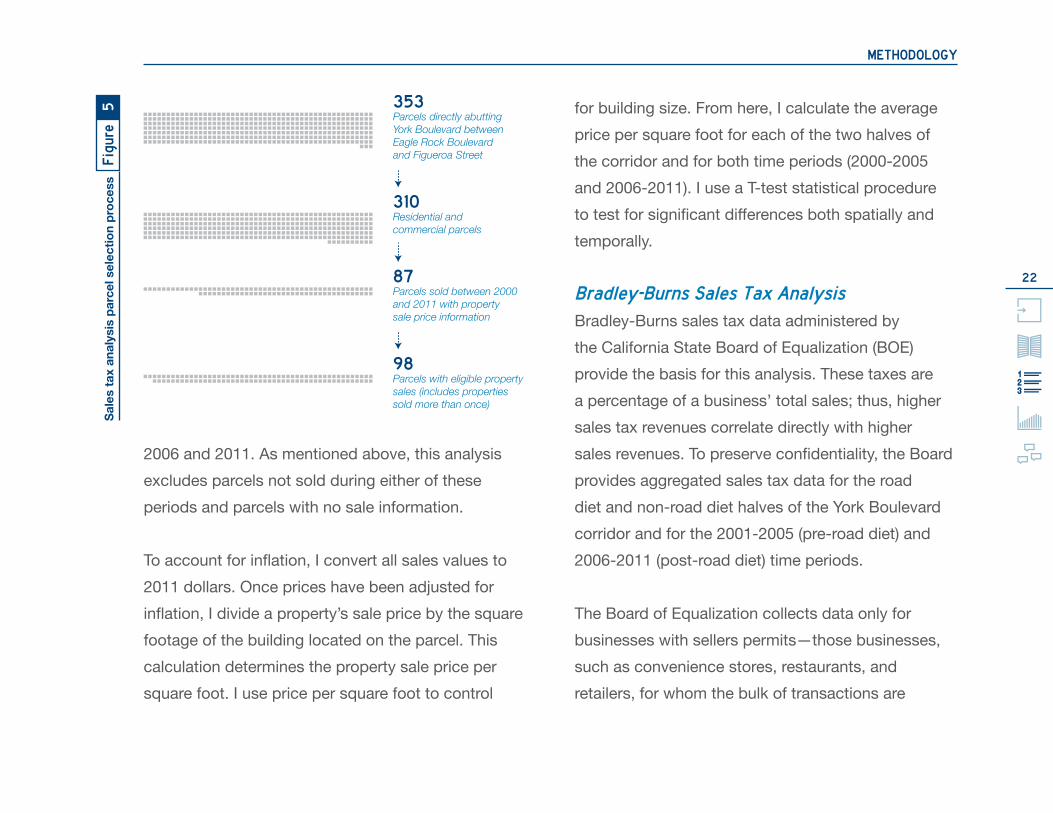
uses, and narrows the number of parcels studied to 310. I then exclude all parcels that were not sold during my study period of 2000 to 2011 or that lack property sale price information. This narrows the eligible parcels to only 87 for the entire study area. However, since it is property sales I am concerned with, and not necessarily the parcels themselves, I double count any parcels that were sold more than once during either the pre- (2000-2005) or post-road diet (2006-2011) periods. Duplication increases the number of parcels with eligible property sales to 98. Figure 5 shows the parcel selection process. Since property sales can occur at any time and for a multitude of reasons, I assume this selection of parcels to be a close approximation of a random sample.
Using geographic information system (GIS) software, I display parcels spatially and classify them based on whether a parcel is located within the road diet or non-road diet section of York Boulevard. For both sections, I categorize data based on whether the property was last sold between 2000 and 2005 or
protect confidentiality, I aggregate responses to the half-corridor level (i.e. road diet and non-road diet sections) and compare responses as percentages.
Quantitative Data Methodology and Analysis ProceduresProperty Sale Price AnalysisThis research component begins by acquiring Los Angeles County Assessor’s Office parcel data from the Los Angeles Department of City Planning. To protect confidentiality, I only discuss parcel data in aggregate terms. I collect Secured Basic File Abstract data for all 353 parcels directly abutting York Boulevard between Eagle Rock Boulevard and Figueroa Street. These data provide recent, albeit incomplete information about the last three sale prices and dates of sale for most parcels. Since economic objections to road diets and bike lanes most commonly hinge on residential property values and impacts to businesses, I narrow my scope to only include residential and commercial parcels. Filtering the data in this manner excludes all parcels with religious, governmental, parking, and vacant
22
METHODOLOGY
for building size. From here, I calculate the average price per square foot for each of the two halves of the corridor and for both time periods (2000-2005 and 2006-2011). I use a T-test statistical procedure to test for significant differences both spatially and temporally.
Bradley-Burns Sales Tax AnalysisBradley-Burns sales tax data administered by the California State Board of Equalization (BOE) provide the basis for this analysis. These taxes are a percentage of a business’ total sales; thus, higher sales tax revenues correlate directly with higher sales revenues. To preserve confidentiality, the Board provides aggregated sales tax data for the road diet and non-road diet halves of the York Boulevard corridor and for the 2001-2005 (pre-road diet) and 2006-2011 (post-road diet) time periods.
The Board of Equalization collects data only for businesses with sellers permits—those businesses, such as convenience stores, restaurants, and retailers, for whom the bulk of transactions are
2006 and 2011. As mentioned above, this analysis excludes parcels not sold during either of these periods and parcels with no sale information.
To account for inflation, I convert all sales values to 2011 dollars. Once prices have been adjusted for inflation, I divide a property’s sale price by the square footage of the building located on the parcel. This calculation determines the property sale price per square foot. I use price per square foot to control
353Parcels directly abuttingYork Boulevard betweenEagle Rock Boulevardand Figueroa Street
98Parcels with eligible propertysales (includes propertiessold more than once)
310Residential andcommercial parcels
87Parcels sold between 2000and 2011 with propertysale price information
Figu
reSa
les
tax
anal
ysis
par
cel s
elec
tion
proc
ess
5

YORK BOULEVARD: THE ECONOMICS OF A ROAD DIET
23
diet period by five and the six-year (2006-2001), post-road diet period by six to produce standardized one-year figures. To compensate for differences in business size and the number of businesses on the two corridor halves, I divide sales tax data for each half-corridor by the total commercial square footage
taxable sales. The BOE data exclude service businesses—such as medical offices, financial service providers, and hair salons—which have few or no taxable sales and do not require sellers permits. Additionally, the Board of Equalization cannot isolate sales tax revenues from individual stores within a retail chain. Thus, the BOE data also exclude chain stores. Figure 6 shows that of the 150 businesses listed in the BOE records for the road diet portion of the corridor (a number that differs only slightly from the 153 businesses I observed in my field visit), 101 are non-service, non-chain businesses with available sales tax data. Similarly, 45 of the 97 businesses on the non-road diet portion of the corridor have available sales tax data. In other words, sales tax data are available for half to two-thirds of all corridor businesses.
I compare the BOE data both in their raw form and as sales tax revenue per square foot per year. In both instances, I convert the data to 2011 dollars to control for inflation. For the latter comparison, I divide data from the five-year (2001-2005), pre-road
247TotalBusinesses along YorkBoulevard betweenEagle Rock Boulevardand Figueroa Streetin Board of Equalization(BOE) records
97Non-road dietBusinesses alongYork Boulevardbetween Avenue 55and Figueroa Streetin BOE records
150Road diet
Businesses along YorkBoulevard between
Eagle Rock Boulevardand Avenue 55in BOE records
101Road dietNon-chain
businesses withsellers permitsand thus BOEsales tax data
available
45Non-road dietNon-chainbusinesses withsellers permitsand thus BOEsales tax dataavailable
Figu
reBo
ard
of E
qual
izat
ion
sale
s ta
x da
ta a
vaila
bilit
y6

24
METHODOLOGY
procedure to compare the number of businesses that have opened on each section of York Boulevard since the road diet implementation in 2006. To protect confidentiality, I aggregate responses to the half-corridor level (i.e. road diet and non-road diet sections).
The California State Board of Equalization provides aggregated data on the number of businesses that have gone out of business and been replaced with a new business—referred to as business turnover—for each half of the York Boulevard corridor. As with sales tax data, turnover information is available only for non-chain businesses with taxable sales. These turnover data are not disaggregated to the pre- and post-road diet periods; they are provided only for the entire 2001-2011 timespan. Therefore, I compare the total number of properties that have had at least one turnover between the road diet and non-road diet corridor halves. Similar to the new business analysis, I use a Chi-square statistical test to compare business turnover. Contrasting the turnover data with the information on new businesses provides a more
present on each half-corridor. This square footage includes all parcels with commercial, restaurant, retail sales, and shopping center use codes; it omits all parcels with service business use codes (i.e. medical buildings, offices, and similar businesses with no taxable sales).
Since the data are only available in aggregate form, I cannot ascertain adequate information (namely the standard deviation of the data) to perform statistical tests. Instead, I complete non-statistical temporal and spatial comparisons of the sales tax data.
New Business and Business Turnover AnalysesI obtain information about new businesses that have opened along the York Boulevard corridor through my survey questionnaire, in which I ask business owners/managers how long their businesses have been located on York Boulevard (see Appendix C). From this information, I create two classes of businesses: those which have opened since the road diet implementation in 2006 and those which had been in operation prior to 2006. I use a Chi-square statistical

YORK BOULEVARD: THE ECONOMICS OF A ROAD DIET
25
diet. Necessarily then, this model compares the road diet and non-road diet sections of the York Boulevard corridor during the post-road diet implementation period of 2006 to 2011.
Table 2 displays the initial variables considered for use in the hedonic pricing model. Property sale price is the dependent variable; property and neighborhood characteristics comprise the independent variables. I employ a stepwise regression, which automatically generates an optimized model employing only those variables with the strongest influence on sale price. Accordingly, not all of the variables listed in Table 2 are ultimately used in the hedonic model. The model ensuing from the stepwise regression, along with an analysis of my modeling results, is located in the Findings section below.
ConsiderationsStrengths and Weaknesses of ApproachIn designing this research, I have attempted to build upon prior approaches, findings, and recommendations; my goal: to develop
holistic examination; it shows not just how many new businesses are opening, but the degree to which businesses are succeeding or failing along York Boulevard.
Hedonic Price ModelAs a final metric of the impact of road diets on economic activity, I develop a hedonic price model. A hedonic price model is a form of regression analysis. It assumes that property sale prices are the sum of a variety of tributary components (Nicholls and Crompton, 2005). These components include both characteristics of the property itself, including building size, amenities, and upkeep, as well as neighborhood factors such as crime and transportation infrastructure (Franklin and Waddell, 2002). With the hedonic model, the degree to which a tributary component is present directly influences a property’s sale price (Nicholls and Crompton, 2005). The hedonic model I develop therefore attempts to control for various property and neighborhood factors and determine how much of a property’s sale price is attributable to the presence or absence of the road

26
METHODOLOGY
Tabl
eIn
itial
hed
onic
pric
e m
odel
var
iabl
es
2 Variable Description
Inde
pend
ent Property sale price Property sale price per square foot for all parcels along the study corridor sold during the 2006-
2011, post-road diet period (in 2011 dollars); a way of representing property valueD
epen
dent
Nei
ghbo
rhoo
d ch
arac
teris
tics Presence/absence
of road dietDummy variable measuring whether a property is located along the road diet or non-road diet section of the corridor; the key determinant of how/whether road diets influence property sale price
Location in commercial core
Dummy variable measuring whether a property is located along the two-block commercial core between Avenue 50 and Avenue 52; a way of controlling for walkability and gentrification, as, within the York Boulevard corridor, this section has generally been the epicenter of investment from abroad
Crime per mile Total number of crimes per linear mile reported along each half of the York Boulevard study corridor for the six-month period between August, 2011, and February, 2012; a means of controlling for neighborhood safety. Source: Los Angeles Police Department (http://www.crimemapping.com)
Median income Household median income for the census tract in which a property is located; a way of controlling for income. Source: 2010 American Community Survey 5-year estimates.
Prop
erty
cha
ract
eris
tics Lot square footage Measurement of the size of a parcel; a way of controlling for parcel size
Building size/livable area
Measurement of the size of the structure located on a parcel; a way of controlling for building size
Land value Assessed parcel value; a way of controlling for the value of land
Improvement value Assessed value of improvements made to the parcel, including buildings, landscaping, etc.; a way of controlling for the amount of investment on a given property
Year built The year that the structure on the parcel was constructed; a way of controlling for building age
Unless noted otherwise, the source for all variables in the above table is the Los Angeles County Assessor’s Office.

YORK BOULEVARD: THE ECONOMICS OF A ROAD DIET
27
For all quantitative sources, it is difficult to draw correlation, and almost impossible to prove causality, between road diets/bike lanes and changes in economic metrics such as property sale prices. A host of factors independent from road diets and bike lanes certainly contribute to variation in economic performance. These influences range from broad, macroeconomic forces, namely the national economic downturn, to the localized variables of neighborhood and property characteristics. The hedonic price model attempts to control for these factors and determine how much of a property’s sale price is attributable exclusively to the road diet.
Using the road diet conversion in 2006 as the threshold with which to assess economic changes places a stronger emphasis on the road diet implementation than the later bike lane addition. Nonetheless, I feel that the road diet installation warrants this emphasis. The diet’s fundamental reconfiguration of York Boulevard appears more
a comprehensive tool for understanding the connections between bike lanes, road diets, and economic activity. I believe the model I have developed represents a sound approach for analyzing the research question. It takes into account a multitude of quantitative and qualitative factors to enhance the robustness of the findings. Despite these advantages, the research approach is not without constraints, and I attempt to enumerate known limitations in this section.
Limitations of Data SourcesThe data I employ come from pre-published sources and stakeholder opinions, both of which carry implications for data accuracy and reliability. The Bradley-Burns sales tax applies only to “sales of tangible personal property” (California State Board of Equalization, 2009). Thus, businesses with minimal taxable sales, such as York Boulevard’s numerous auto repair shops and hair salons, may be underrepresented in the sales tax analysis.

28
METHODOLOGY
of years their business had been in operation, these accounts are subject to inaccurate or deceptive responses as well.
Although these inescapable potentialities exist, gaining an understanding of the support or opposition of local merchants and community members is clearly an important factor in evaluating road diets and bike lanes. Still, opinions are not a surrogate for numeric data, or vise versa. The design of this research therefore strives to blend qualitative and quantitative sources and, in doing so, maximize the objectivity of the research findings.
Nonresponses Preclude Statistical Analyses of Survey DataThe limitations of my survey implementation generally preclude statistical comparisons. For reasons of convenience, privacy, or disinterest, many patrons of the York Boulevard corridor may understandably refuse to participate in intercept surveys. This nonresponse bias represents a significant, yet unavoidable limitation of the intercept surveying
plausible to affect surrounding conditions than the later bike lane installation, which added the lanes without modifying other elements of the road cross-section. I envision the bike lanes playing a more critical role among the perceptions of York Boulevard merchants, customers, and other community stakeholders as their addition creates a noticeable visual presence.
All survey responses represent opinions of the impacts of road diets and bike lanes on business performance and shopping patterns. By definition, individuals’ subjective preferences and values frame the context for these responses. Additionally, individuals may not be able to understand all questions, or may choose to respond to questions dishonestly, both of which could potentially degrade the survey data reliability (Alwin and Krosnick, 1991).
Business owners/managers self report the number of years that their businesses have been located on York Boulevard. Although most business owners appeared knowledgeable, if not proud, of the number
YORK BOULEVARD: THE ECONOMICS OF A ROAD DIET
29
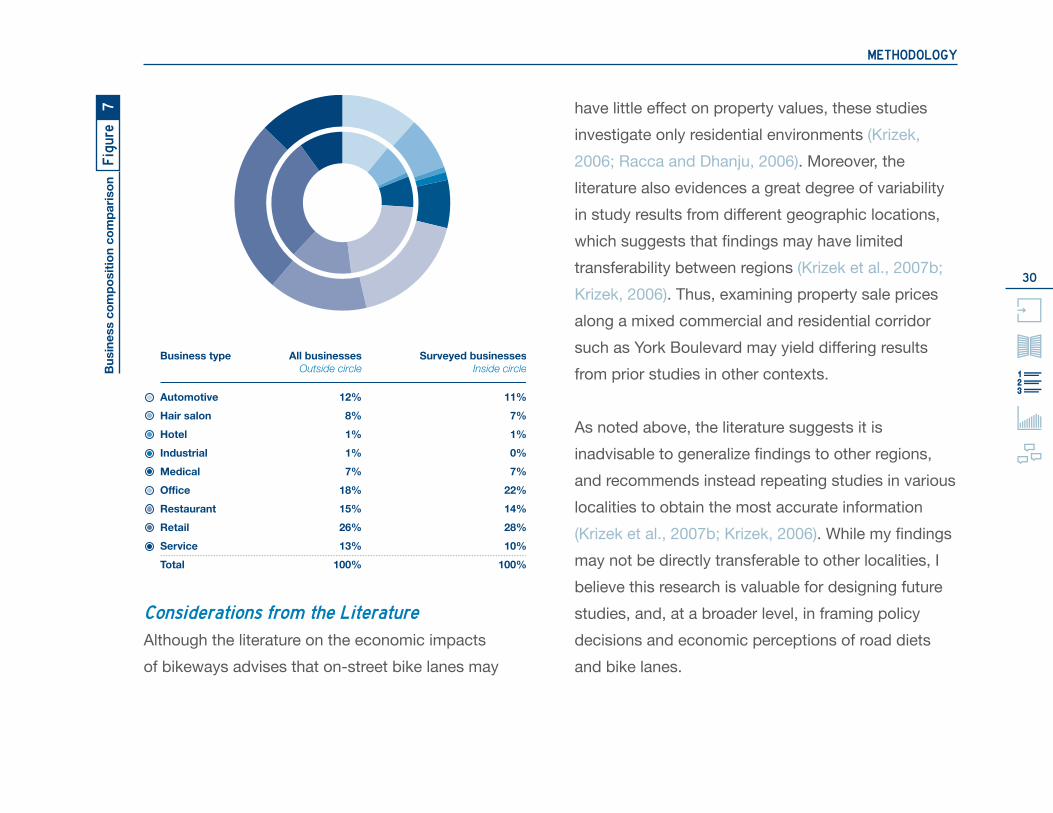
To compensate for nonresponses yet still obtain at least 50 business surveys from each half of the corridor, I surveyed some business that were not included in my initial random sample. While I deviated from the initial random sample, I made sure to maintain a representative balance of the types of businesses I surveyed. Figure 7 shows the types of all businesses located along the York Boulevard corridor and juxtaposes them with the businesses in my survey. The figure reveals that the distribution of surveyed businesses aligns closely with the proportions of all businesses along the corridor. Still, this substitution precludes a statistical comparison of business survey responses because it results in a sample that is not purely random. While not completely random, the business and intercept surveys do afford an incredibly useful portrayal of a diverse segment of stakeholders, whose attitudes and perceptions play an important role in drawing conclusions about the interactions between road diets, bike lanes, and economic activity.
approach. It makes it difficult to obtain large volumes of survey responses. Moreover, it precludes obtaining a random sample of patrons and thereby drawing broader conclusions about York Boulevard customers in general. Figure 4 displays that survey responses tend to fall into geographic clusters. Clustered survey responses may create a locational bias; customers of businesses located near activity centers may be over-represented in survey responses.
Several randomly sampled businesses remained consistently closed after multiple survey attempts at different times on different days. I was therefore unable to survey these businesses. An additional five businesses refused to participate in surveys; individuals at these businesses cited not supporting solicitors, privacy, and being too busy as their rationales for not participating. In total, and coincidentally, I was unable to survey 23 of the 50 randomly sampled businesses on each half of the corridor.
30
METHODOLOGY
have little effect on property values, these studies investigate only residential environments (Krizek, 2006; Racca and Dhanju, 2006). Moreover, the literature also evidences a great degree of variability in study results from different geographic locations, which suggests that findings may have limited transferability between regions (Krizek et al., 2007b; Krizek, 2006). Thus, examining property sale prices along a mixed commercial and residential corridor such as York Boulevard may yield differing results from prior studies in other contexts.
As noted above, the literature suggests it is inadvisable to generalize findings to other regions, and recommends instead repeating studies in various localities to obtain the most accurate information (Krizek et al., 2007b; Krizek, 2006). While my findings may not be directly transferable to other localities, I believe this research is valuable for designing future studies, and, at a broader level, in framing policy decisions and economic perceptions of road diets and bike lanes.
Considerations from the LiteratureAlthough the literature on the economic impacts of bikeways advises that on-street bike lanes may
AutomotiveHair salonHotelIndustrialMedical
ServiceTotal
RestaurantRetail
Office
All businessesOutside circle
Business type
12%8%1%1%7%
18%15%26%13%
100%
Surveyed businessesInside circle
11%7%1%0%7%
22%14%28%10%
100%
Figu
reBu
sine
ss c
ompo
sitio
n co
mpa
rison
7

YORK BOULEVARD: THE ECONOMICS OF A ROAD DIET
31
study corridor that day. Each individual indicated that he or she lived in the neighborhood, and I chose to survey these individuals nonetheless.
Figures 8 and 9 display that responses are fairly harmonious between the two halves of the study corridor and between the businessperson and customer surveys. Most response pairs (i.e. road diet/non road diet, or merchant/customer) fall within ten percentage points of one another. Significantly, the overwhelming majority of merchants on both halves of the corridor—85 percent on the non-road diet section and 95 percent on the road diet section—feel that bike lanes have not hurt their businesses. Similarly, over 95 percent of customers surveyed on the road diet section and 80 percent of customers along the non-road diet portion feel that bike lanes are important roadway additions. Still, merchants and customers alike are divided in their feelings about removing a car lane or on-street parking for bike lanes; support for removing auto lanes or parking in favor of bike lanes waivers from roughly 40 to 60 percent.
FindingsSurvey Results
Figure 8 summarizes the business owner/manger survey responses. (Note: To facilitate comparison, I present Figure 8 and Figure 9, which displays customer intercept survey responses, on facing pages after Figure 10.) In total, 40 percent of businesses (60 out of 153) on the road diet section of York Boulevard (between Eagle Rock Boulevard and Avenue 55) and just under 60 percent of businesses (55 out of 97) on the non-road diet section (from Avenue 55 to Figueroa Street) participated in surveys. As explained in the Considerations section above, I was unable to survey 23 of the 50 randomly sampled businesses on each half of the corridor.
For the intercept surveys, I received 25 customer responses on each half of the York Boulevard corridor. Figure 9 shows the results of the customer intercept surveys; Figure 4, the locations of these surveys. When surveyed, three individuals indicated that they had not shopped along the York Boulevard

32
FINDINGS
Quantitative Data Results
Table 3 summarizes the quantitative research findings.
Property Sale Price and Sales TaxFigure 11 displays the results of the property sale price and sales tax analyses. The figure presents these results for both the road diet and non-road diet sections of York Boulevard and the pre- and
The most noticeable dissonance in survey responses is that between merchants’ perceptions of their customers’ travel choices and customers’ actual travel patterns. Merchants on both halves of the corridor presume the majority of their customers arrive by car, when in fact no more than about a quarter of customers indicated that they drove to York Boulevard. Figure 10 illustrates the most common responses merchants and customers offered when asked why they chose to support or not support removing on-street parking for bike lanes. Large numbers of merchants and customers alike voiced that on-street parking is critical to the health of businesses.
Figu
reR
easo
ns fo
r sup
port
ing
or n
ot s
uppo
rtin
g bi
ke la
nes
that
repl
ace
on-s
tree
t par
king
10
Source: Wordle

YORK BOULEVARD: THE ECONOMICS OF A ROAD DIET
33
0%
10%
20%
30%
40%
50%
60%
70%
80%
90%
100%
Mult. modesTransitWalkBicycleDrive
No response
SlowFast
No effectNo responseNo changeLessMore
No responseNo changeLess
No responseNoYes
More
No responseNot sureNoYes
No responseNot sureNoYes
Legend
Do you think more people visit your business when cars drive fast past your business or when they have to drive slowly past your business?
Do you think more, less, or the same number of people would visit your business if there were more car lanes on the road?
Do you think more, less, or the same number of people would visit your business if there were less car lanes on the road?
Do you think bicycle lanes hurt your business?
Would you support removing car lanes on the road to add bicycle lanes?
Would you support removing parking lanes on the road to add bicycle lanes?
How would you guessmost of your customerscome to your business?
Surveyquestion
Road diet
Non-road
diet
Figu
reM
erch
ant s
urve
y re
spon
ses
8

34
FINDINGS
0%
10%
20%
30%
40%
50%
60%
70%
80%
90%
100%
Legend TransitWalkBicycleDrive
SlowFast
No effect No effectNarrowWide
NoYes
NoYes
NoYes
Do you prefer to shop on streets where cars drive fast or where cars drive slowly, or does the speed of cars have no effect on where you shop?
Do you prefer to shop on narrow, quiet streets or wide, busy streets, or does the type of street have no effect on where you shop?
Do you think it is important to have bicycle lanes on streets?
Would you support removing car lanes on the road to add bicycle lanes?
Would you support removing parking lanes on the road to add bicycle lanes?
How did you get here today?
Surveyquestion
Road diet
Non-road
diet
Figu
reC
usto
mer
sur
vey
resp
onse
s9

YORK BOULEVARD: THE ECONOMICS OF A ROAD DIET
35
Tabl
eQ
uant
itativ
e da
ta s
umm
ary
3Metric Analysis Findings Road Diet Non-Road DietProperty sale price Compares commercial
and residential property sale price per square foot between the corridor halves and before/after the 2006 road diet implementation
No significant differences in property sale price exist between the corridor halves or before/after the road diet implementation
$229Pre-road diet implementation
$270Post-road diet implementation
$624Pre-road diet implementation
$380Post-road diet implementation
Bradley-Burns sales tax Compares sales tax revenues, collected as a proxy for business sales, between the corridor halves and before/after the road diet implementation
Sales tax revenues are higher on the road diet section of York Boulevard; although, since the data are provided in aggregate terms, it is not possible to conduct statistical tests or attribute the higher sales tax revenues to the presence of the road diet
$727,937Pre-road diet implementation
$1,116,745Post-road diet implementation
$344,623Pre-road diet implementation
$574,778Post-road diet implementation
New business openings Compares the number of new businesses that have opened on each corridor half since the road diet implementation
No significant differences exist in the number of new business openings between the two corridor halves
21New business openings
19New business openings
Business turnover Compares the number of businesses on each corridor half that have closed over the 2001-2011 period
No significant differences exist in business turnover between two the corridor halves
55%Percent of businesses that have turned over at least once
62%Percent of businesses that have turned over at least once
Hedonic price model Gauges how much the presence or absence of a road diet influences property sale price
The presence or absence of road diet is not a significant determinant of property sale price

36
FINDINGS
$229$270
$624
$380
18%-39%
$0.52 $0.66 $0.37 $0.51
27%
39%
Average property saleprice per square foot
Average sales tax revenueper square foot per year
Road diet
Pre-road diet
(2000-2005)
Post-road diet
(2006-2011)
Percent changeNon-road diet
Road diet
Non-road diet
Figu
reAv
erag
e pr
oper
ty s
ale
pric
e pe
r squ
are
foot
and
sal
es ta
x re
venu
es in
201
1 do
llars
11

YORK BOULEVARD: THE ECONOMICS OF A ROAD DIET
37
revenues is higher on the road diet portion. Thus, in this instance, the growth rate is somewhat deceptive. Since sales tax data are only available in an aggregated form, it is not possible to complete more precise statistical comparisons.
New Businesses and Business TurnoverSince the 2006 road diet installation, 21 new businesses opened on the road diet section of the York Boulevard corridor, which constitutes 14 percent of the businesses on this corridor half. Nineteen new businesses opened on the non-road diet section, or
post-road diet implementation periods. Additionally, Figure 12 shows the spatial distribution of property sales and sale values. What is less apparent from the two figures is that there is a high degree of sale price variation within each corridor half and time period. These extreme variations make it difficult to conclude statistically that there is a meaningful difference in property sale prices either spatially or temporally. Indeed, although Figure 11 illustrates that sale prices vary—in some cases markedly—between the road diet and non-road diet sections and over time, none of these differences are statistically significant. Therefore, adding the road diet does not appear to have meaningfully altered property values. Variations in property values are instead the result of other factors, which the Hedonic Price Model section below further discusses.
Referencing Table 4 reveals that sales tax revenues along the road diet portion of York Boulevard are roughly double those of the non-road diet section. While tax revenues exhibit a higher growth rate along the non-road diet section, the absolute growth in
Tabl
eSa
les
tax
reve
nues
in 2
011
dolla
rs4Road Diet Non-Road
DietPre-road diet implementation
$727,937 $344,623
Post-road diet implementation
$1,116,745 $574,778
Absolute growth
$388,808 $230,155
Percent change 53% 67%

38
FINDINGS
Ave
55
Figue
roa St
York Blvd
Eagle Rock Blvd
Source: Los Angeles County Assessor’s Office
Road diet Non-road dietTop:Pre-road diet(2000 - 2005)
Bottom:Post-road diet(2006 - 2011)
Price per square foot Property sales along York Boulevard corridor
Low$40 - $250
Medium$250 - $500
High$500 - $5,000
1 Mile
Figu
rePr
oper
ty s
ale
loca
tions
and
sal
e va
lues
per
squ
are
foot
in 2
011
dolla
rs12

YORK BOULEVARD: THE ECONOMICS OF A ROAD DIET
39
POST-ROAD DIET PROPERTY SALE PRICE PER SQUARE FOOT = -135,316.31 + 63,413.51*PRESENCE OR ABSENCE OF ROAD DIET + 109.44*BUILDING AREA + 1.28*PARCEL LAND VALUE
The host of variables initially considered for this model exhibit a strong amount of multicollinearity, or interference with one another. To minimize double counting among unique variables that measure closely related phenomena, I have employed only the variables with the highest significance, or ability to explain the dependent variable of property sale price.
The model’s r-square value of 0.959 means that, in total, the model explains roughly 96 percent of variation in property sale prices. Although the model as a whole explains a substantial portion of property sale price variation, the presence or absence of a road diet is not a statistically significant variable. In other words, the model’s other two variables pertaining to property characteristics have the strongest bearing on property sale price. Thus, as
twenty percent of the businesses on this half. Neither of these changes is statistically significant.
One hundred and one business sites on the road diet section of York Boulevard have Bradley-Burns sales tax data, and thus property turnover information, available. Fifty six of these locations, or fifty five percent, had gone out of business at least once in the period between 2001 and 2011. On the non-road diet segment, 28 of 45 businesses with data, or 62 percent, turned over during the same period. These changes are not statistically significant. From these findings, the presence or absence of a road diet does not appear to influence either new business openings or business turnover.
Hedonic Price ModelBased on the results of the stepwise regression described previously in the Methodology section, the final hedonic price model employs three variables and takes the following form:

40
FINDINGS
Additionally, the data on new business starts and turnover show that there are no significant differences in these metrics between the sections of York Boulevard with and without a road diet. One could conceivably link the road diet section’s slower tax revenue growth rate to the presence of the road diet. Following this logic, one would also have to attribute the higher sales tax revenues and absolute growth found on the road diet portion to the presence of the road diet. In this case, road diets would have an indeterminate effect on sales tax revenues. However, taken in context with the other business analyses and the hedonic price model, what seems more plausible is that variations in sales tax revenues stem not from road diets, but from factors related to business type, location, and broader economic forces.
Survey results also point to a weak connection between road diets and customer shopping habits. Surveyed customers exhibit no prevailing preference for shopping on wider or narrower streets (a proxy for road diet street reconfigurations used in the survey questions). These responses suggest that road diets
with the previous analyses, the hedonic price model shows that road diets have a negligible effect on surrounding property values.
Key TakeawaysThis section synthesizes the primary findings from the above data. I organize this discussion into the following major themes.
Road diets have little effect on surrounding businesses, property values, and customer shopping patterns. Therefore, opposition to road diets on economic grounds appears unfounded.
The quantitative analyses in this report do not reveal meaningful linkages between the presence of a road diet and changes in economic conditions. For example, the property sale price research demonstrates that spatial and temporal fluctuations in sale prices are statistically insignificant. Further, as the hedonic price model shows, these variations are mostly the result of factors independent from road diets.

YORK BOULEVARD: THE ECONOMICS OF A ROAD DIET
41
Eighty five to ninety five percent of all business survey respondents do not feel that bike lanes have hurt their businesses. Eighty to ninety five percent of surveyed customers on both corridor halves also view bike lanes beneficially. Moreover, the proportions of merchants and customers who respond in these favorable manners are higher on the road diet section of the corridor. These higher percentages suggest that opposition to road diets and bike lanes may wane after the bikeway implementation.
are not likely to alter customer shopping patterns. Convenience and availability of needed products or services are likely larger determinants affecting where customers choose to shop.
From the above findings, implementing a road diet along York Boulevard has not lowered property values or degraded business performance. Thus, the data do not support arguments that implementing road diets—reducing the number of car travel lanes on a road—hurts the surrounding local economy. While road diets are unlikely to harm surrounding economies, it is important to note that the addition of these facilities alone does not appear to improve surrounding economic conditions either.
The majority of surveyed merchants do not feel that bike lanes hurt their businesses, and similarly large percentages of customers believe bike lanes are important roadway additions. Still, opinions about removing on-street parking and auto lanes for bike lanes/road diets are divided.
42
FINDINGS
however, the study does not directly address parking loss as parking was not removed with the York Boulevard road diet. As discussed in the following Recommendations section, future bikeway projects should be sensitive to community needs such as preserving parking. Further, since it is not possible to quantitatively evaluate the effects of parking removal on business performance with this research, the topic should be a priority for future research.
Merchants’ perceptions about their customers’ travel patterns do not align with customers’ stated patterns.
On both halves of the study corridor, merchants indicate that they believe most customers drive to their businesses. These speculations generally do not align with customers’ stated travel patterns. Almost 60 percent and 75 percent of merchants on the road diet and non-road diet sections of York Boulevard, respectively, state that customers drive to their businesses. However, only about 15 and 30 percent of customers on the same respective corridor halves indicate that they drive. The majority of customers,
At the same time, the above opinions assume no tradeoffs between bicycle infrastructure and other uses of road space, such as on-street parking or auto travel lanes. When presented with a tradeoff between bike lanes and auto lanes or on-street parking, only about half of all survey respondents appear willing to divert road space to bicyclists. Still, since most merchants do not perceive bike lanes to have negative business impacts, and since most customers view bike lanes favorably, building additional support for converting auto lanes or on street parking to bike lanes may be possible.
On-street parking is clearly an important asset to both local merchants and customers.
A common theme among survey responses is the perceived importance of parking to business performance. To many businesspersons and customers, removing parking translates directly to lost business revenues. This study demonstrates that road diets removing auto travel lanes do not adversely affect businesses or property values;

YORK BOULEVARD: THE ECONOMICS OF A ROAD DIET
43
preferences, and traffic safety goals. Assuming these anecdotes hold true among the broader population of area merchants and customers, slower travel speeds might be used to justify traffic calming projects, which employ a variety of engineering treatments, such as widened sidewalks at intersections or traffic circles, as a means of improving traffic safety (Project for Public Spaces, n.d.).
56 percent on each half of the corridor, either walk or bicycle to businesses. This disconnect speaks to a need for additional outreach efforts to merchants about the importance of walking and bicycling—and appropriate infrastructure for both—on businesses. It also justifies the extension of bike lanes along the non-road diet section of York Boulevard.
Businesses and customers alike seem to prefer slower vehicle speeds or feel that speed is unimportant.
Many surveyed merchants perceive that slower traffic makes their businesses more noticeable to passing motorists, which may increase the likelihood of motorists patronizing their establishments. Those customers who favor slower traffic indicate that it creates safer conditions in which to shop. Based on these anecdotes from merchants and customers, slower traffic speeds may represent a common ground between merchant needs, customer

44
RECOMMENDATIONS
The design of road diets and bicycle facilities must carefully involve local community members—especially those whose businesses and homes flank proposed road diets and bicycle facilities—and any roadway modifications must be sensitive to the needs of people who bicycle as well as those who do not.
Most surveyed merchants indicate that they do not feel bike lanes will hurt their businesses. When surveyed, most customers also believe that bike lanes are important roadway additions. These responses suggest that there is at least some latent community support for bikeway improvements. Yet, large percentages of merchants and customers also remain hesitant to support road diets that convert on-street parking and auto lanes to bike lanes. Given pressing safety concerns for people riding bicycles—if not broader concerns for public health and the environment—simply not building bikeways in controversial situations is an untenable solution. Instead, I put forth a twofold implementation approach.
RecommendationsAs the previous Findings section demonstrates, quantitative data do not support the notion that road diets negatively affect surrounding local businesses and property values. Opposition to road diets on economic grounds therefore appears unfounded. Furthermore, on streets such as York Boulevard with roughly 20,000 daily auto trips, there is little basis in traffic engineering for road diet opposition (Tan, 2011; Huang, Stewart, and Zegeer, 2004). With the majority of surveyed business customers bicycling and walking to businesses, there is a clear need for infrastructure facilitating safe travel by these modes. Still, popular support for converting auto lanes and on-street parking to bike lanes remains lukewarm. In light of these conditions, I propose the following recommendations, which aim to reshape bikeway planning, design, and outreach to include broader community input. Finally, I conclude with potential avenues for future research.

YORK BOULEVARD: THE ECONOMICS OF A ROAD DIET
45
stakeholder input and partnering with community members. At a minimum, government agencies must not present pre-designed bicycle facilities to the community. Municipal staff should instead listen to community members’ preferences and concerns and earnestly incorporate this input into designs. In some instances it may be beneficial for planners and engineers, calling on their professional experience, to explain the benefits or tradeoffs of various bikeway designs better inform community-based decision-making.
First, public agencies must enlist support for bikeway projects from bicycling advocacy organizations, supportive merchants, and sympathetic members of the public. Merchant and community member surveys, discussions with business and neighborhood leaders, and public meetings are all viable tools for assessing this support. Cities and bicycle advocacy organizations must then encourage proponents to be vocal in their support for specific bikeway projects—both in their communities and to elected officials. Some potential venues for supporting bikeway projects include:• Advocacy campaigns• Calls and letters to city councilmembers• Promotional internet videos• Social media outlets• Window signs for homes and businesses
Second, public agencies need to work directly with community members to design bikeway projects. Neighborhood walking tours, booths at public festivals, social media, and bikeway design workshops represent opportunities for gathering

46
RECOMMENDATIONS
neighborhood amenities with widespread appeal into bikeway projects. These amenities include street trees, outdoor seating, and widened sidewalks among other examples. Cities may consider partnerships with business improvement districts, if such districts exist, to help finance these additional improvements.
The above demonstrates that, although more complex and time-intensive than traditional planning efforts, a collaborative process embracing flexibility and compromise offers the most promise for designing bikeways that are suitable for a variety of stakeholders, even in controversial situations.
Multilingual, multifaceted outreach efforts are essential to successful bikeway projects.
Cities, bicycle advocates, and other supporters must outreach to neighbors and businesses at two stages during bikeway planning and implementation—particularly for substantial or controversial projects. First, outreach must announce bicycle planning
Ideally, neighbors, merchants, bicyclists, and other stakeholders would collaborate alongside planners and engineers to first identify which corridors should be prioritized for bikeways. Likely these will be routes contained in the city’s bike plan. Then, the same actors should partner to design bikeways that satisfy the needs of bicyclists, members of the general public, and opponents as best as possible. Narrowing auto lane widths while preserving the number of auto lanes, retaining some on-street parking, designing bicycle facilities on parallel routes, and employing innovative bicycle facilities (such as protected bike lanes, colored pavement along bikeways, and cycletracks) are examples of potential strategies for satisfying competing needs.
Numerous planning scholars have noted that, to be acceptable, “a change must benefit many interests, which consequently would decide to support the change” (Wachs, 2004; Altshuler, 1965). Therefore, to build support for bikeway projects, if not more broadly encourage participation in planning efforts, cities may consider incorporating additional

YORK BOULEVARD: THE ECONOMICS OF A ROAD DIET
47
the loss of an auto travel lane. Therefore, preserving parking may represent a way to minimize opposition when designing new bike lane projects.
Furthermore, on-street parking creates a buffer between passing cars and pedestrians on the sidewalk, thereby improving pedestrian comfort and safety (Institute of Transportation Engineers, 2010). In the event that replacing an auto lane with a bike lane results in slower traffic speeds, business survey responses suggest that merchants may respond favorably to slower speeds or have no opinion of this change. Slower traffic speeds would also likely improve traffic safety (Aarts and Van Schagen, 2006).
Cities and bicycle advocacy organizations should integrate localized economic impact studies into bikeway planning and conduct follow-up studies after bikeway implementation. Such studies may help rectify the dissonance between economic data on road diets, which suggest these treatments have little economic impact on surrounding communities, and community perceptions, which reflect a greater
events and encourage community attendance. A second wave of outreach needs to occur prior to bikeway installation to alert neighbors and businesses of the impending roadway change. Outreach should occur in multiple languages and utilize a variety of techniques, including:• Blog and social media posts• Flyers• Signs in homes and businesses, at bus stops, and
in other publicly visible areas• Stories in local newspapersFinally, outreach efforts should cite the findings of this York Boulevard study and similar research to show that road diets can be implemented in ways that do not impact surrounding economies.
When faced with the decision between removing an auto travel lane or on-street parking for a bike lane installation, cities should favor removing the travel lane or defer to local preferences.
The loss of on-street parking appears less popular among surveyed merchants and customers than

48
RECOMMENDATIONS
context. Therefore, when economic impacts are at question, cities and advocacy organizations should implement localized economic studies similar to this York Boulevard research.
Understanding constraints on municipal and advocacy organization budgets, these economic studies need not be complex undertakings. At their core, studies should strive to (1) comparatively analyze quantitative data and (2) poll local community members. I deliberately provide a detailed methodology in hopes that my approach can be duplicated and enhanced.
Economic studies should occur at two stages. Researchers should first collect baseline data along a proposed bikeway corridor during early planning stages for the bikeway. Researchers must also collect data after the bikeway project implementation. Studies during planning stages should preferably occur before community workshops so that data are available for these meetings. Studies conducted in the months, if not years, after a bikeway project
hesitance to convert travel lanes or on-street parking to bike lanes for economic reasons.
Among the some sectors of the public, uncertainties persist about the neighborhood-level economic impacts of road diets and bike lanes. The York Boulevard research illustrates that road diets and bike lanes insignificantly affect surrounding local economies. Yet, these results may not necessarily be transferable to other settings. Further, community members in other neighborhoods or other cities may be incredulous of findings from outside their local

YORK BOULEVARD: THE ECONOMICS OF A ROAD DIET
49
model that uses sales tax revenues as the dependent variable could be a powerful tool to understand potential effects of lost parking on adjacent businesses. With a growing body of research, the once-nebulous interactions between road diets, bicycle facilities, and local economic health will come increasingly into focus.
Cities should continue their efforts to install road diets, bike lanes, and similar infrastructure.
As shown throughout this research, road diets appear unlikely to harm local economies. Cities, employing proper outreach, should therefore continue to install road diets and related infrastructure, which improves safety, encourages bicycling, and thereby contributes to improved public health and environmental outcomes.
implementation can help to identify trends in economic activity over time.
Given the stated importance of on-street parking among community members, future economic research should examine how converting on-street parking to bike lanes affects adjacent businesses.
In quantitative terms, the York Boulevard study examines the economic impacts that transpire when a bike lane replaces an auto lane. The more broadly focused qualitative component of the research asks stakeholders to consider a host of factors, including on-street parking. Given the stated importance of on-street parking to businesspersons and customers, it would be helpful to study whether removing on-street parking for a bike lane has dissimilar economic outcomes to removing an auto travel lane. If disaggregated data can be obtained, a hedonic


YORK BOULEVARD: THE ECONOMICS OF A ROAD DIET
A1
and patrons toward road diets and bicycle infrastructure. For the purposes of this review, I divide bicycle infrastructure into two categories: on-street bicycle lanes and off-street bicycle paths. Although less relevant to York Boulevard, I include the latter because researchers have paid the most attention to their influence on economic activity.
There is a generally narrow body of research pertaining to the interactions between bicycle facilities/road diets and economic activity. To quote one author on the subject, “existing literature can be described as ‘spotty’ at best” (Krizek, 2007a). Striving to balance objectivity with comprehensiveness, I include in this review a selection of non-peer-reviewed professional reports and works of advocacy organizations.
I structure this review first by investigating the effects of off-street bicycle paths on economic activity. I digest a comparatively abundant volume of research that finds these facilities to have neutral or positive impacts on property values. At the same
A. Complete Literature ReviewObjectives and StructureThis literature review examines existing research into the relationship between bicycle infrastructure, road diets, and economic activity. The review asks what role existing literature may play in informing my research, and how the York Boulevard research may fill gaps in the current knowledge base.
While various studies have attempted to assess the impact of bicycle infrastructure on regional employment and job creation (Garrett-Peltier, 2010; Governor’s Bicycle Coordinating Council, 2005), the goal of this review is instead to determine whether any notable trends exist between bicycle infrastructure/road diets and local-level economic activity. In other words, does the literature suggest that bicycle facilities and road diets generally improve or harm local economic activity? I define local economic activity to include property values, business performance, and attitudes of merchants

A2
COMPLETE LITERATURE REVIEW
Researchers have employed a combination of resident, merchant, and bicyclist surveys (Krizek, 2006; Lawrie et al., 2004; Macy and MacDonald, 2005) as well as hedonic price models (Karadeniz, 2008; Krizek, 2006; Lindsey et al., 2004; Nicholls and Crompton, 2005; Racca and Dhanju, 2006) to assess the local economic impacts of off-street bicycle paths. Hedonic price models assume that one can disaggregate property sale prices, a proxy for property value, into tributary components (Nicholls and Crompton, 2005). Further, the presence or absence of these various components, such as bicycle infrastructure, influences property price (Nicholls and Crompton, 2005). Research applying surveys and hedonic models in an assortment of locations consistently finds “that the presence of a bike path/trail either increases property values and ease of sale slightly or has no effect” (Racca and Dhanju, 2006, 22). Lawrie et al.’s 2004 surveys also conclude that merchants and customers of the Outer Banks in North Carolina perceive bicycle paths to positively influence to retail sales and property values. Perhaps the only dissenting voice is Krizek
time, research on off-street bicycle paths appears to have little transferability to on-street bicycle lanes, such as those lining the western half of the York Boulevard study corridor. Accordingly, I turn next to the relationship between on-street bicycle facilities and local economic activity. This body of work is less cohesive in its findings; it yields no consistent relationship between bike lanes and economic activity. Finally, I focus on the thin literature surrounding road diets and economic vitality. I find that, while road diets possibly boost economic performance, negative perceptions of these street reconfigurations persist among some segments of the public. In general, I conclude that additional, localized research into the economic impacts of bicycle lanes and road diets is essential to framing bikeway decision-making.
Literature FindingsOff-street bicycle paths generally have neutral or positive impacts on surrounding property values, yet findings related to off-street paths have little transferability to on-street bicycle infrastructure.

YORK BOULEVARD: THE ECONOMICS OF A ROAD DIET
A3
Author Location BicycleFacility Studied
Methods Economic Metric
Peer Review
Economic impact of bicycle facility
Campbell and Wittgens (2004)
Canada All bicycle facilities
Case studies Stakeholder preferences
No Positive
Clean Air Partnership (2009)
Toronto, Ontario Bike lane Merchant and patron surveys
Stakeholder preferences
No Positive
Drennen (2003) San Francisco, California
Road diet/bike lane
Merchant and patron surveys
Stakeholder preferences
Yes Positive
Hoffman and Mallavarapu (2011)
Long Beach, California
Bike lane Sales tax data analysis
Business performance
No Neutral
Karadeniz (2008) Southwestern Ohio
Off-street bike path
Hedonic pricing model
Property sale prices
Yes Positive
Krizek (2006) Minneapolis–Saint Paul, Minnesota
Off-street bike path
Hedonic pricing model
Property sale prices
Yes Negative
Lawrie et al. (2004)
Outer Banks, North Carolina
Off-street bike path
Merchant and patron surveys
Stakeholder preferences
No Positive
Lindsey et al. (2004)
Indianapolis, Indiana
Off-street bike path
Hedonic pricing model
Property sale prices
Yes Positive
Macy and MacDonald (2005)
Denver, Colorado Off-street bike path
Resident surveys Property value No Positive
Nicholls and Crompton (2005)
Austin, Texas Off-street bike path
Hedonic pricing model
Property sale prices
Yes Positive
Tabl
eSu
mm
ary
of e
xist
ing
empi
rical
rese
arch
A1

A4
COMPLETE LITERATURE REVIEW
bicycle paths are likely to affect property values. Additionally, nearly all of the off-street bike path studies address predominately residential, suburban or rural locations. These studies may be less applicable to the mixed commercial and residential land use makeup of York Boulevard.
On-street bicycle facilities demonstrate no consistent effect on economic metrics such as business revenues, yet they remain contentious among adjacent businesses.
Perhaps stemming from the conclusions of Racca and Dhanju (2006) and Krizek (2006) that on-street bicycle facilities seldom influence surrounding
(2006), who finds that proximity to an off-street bicycle path reduces home values in the Minneapolis-Saint Paul metropolitan region.
While most of the above studies report a neutral-to-positive relationship between bike paths and economic prosperity, the nature of bike paths, which possess a strong recreational component and serve in many cases as linear parks, may have little transferability to on-street bikeways (Racca and Dhanju, 2006). Bike lanes “are for the most part indistinguishable from the road corridor itself and are more a feature of the existing road rather than the neighboring properties” (Racca and Dhanju, 2006, 1). Krizek’s 2006 research confirms that only off-street
Racca and Dhanju (2006)
Delaware Off-street bike path
Hedonic pricing model
Property sale prices
Yes Neutral to positive
Ryan, A. Vancouver, Washington
Road diet Sales tax data analysis
Business performance
No Positive
Stantec Consulting Ltd. (2011)
Vancouver, British Columbia
Cycletrack Merchant and patron surveys; some sales data analysis
Business performance
No Neutral to negative
VanZerr (2009) Portland, Oregon Bicycle boulevard
Resident surveys Stakeholder preferences
Yes Neutral to positive
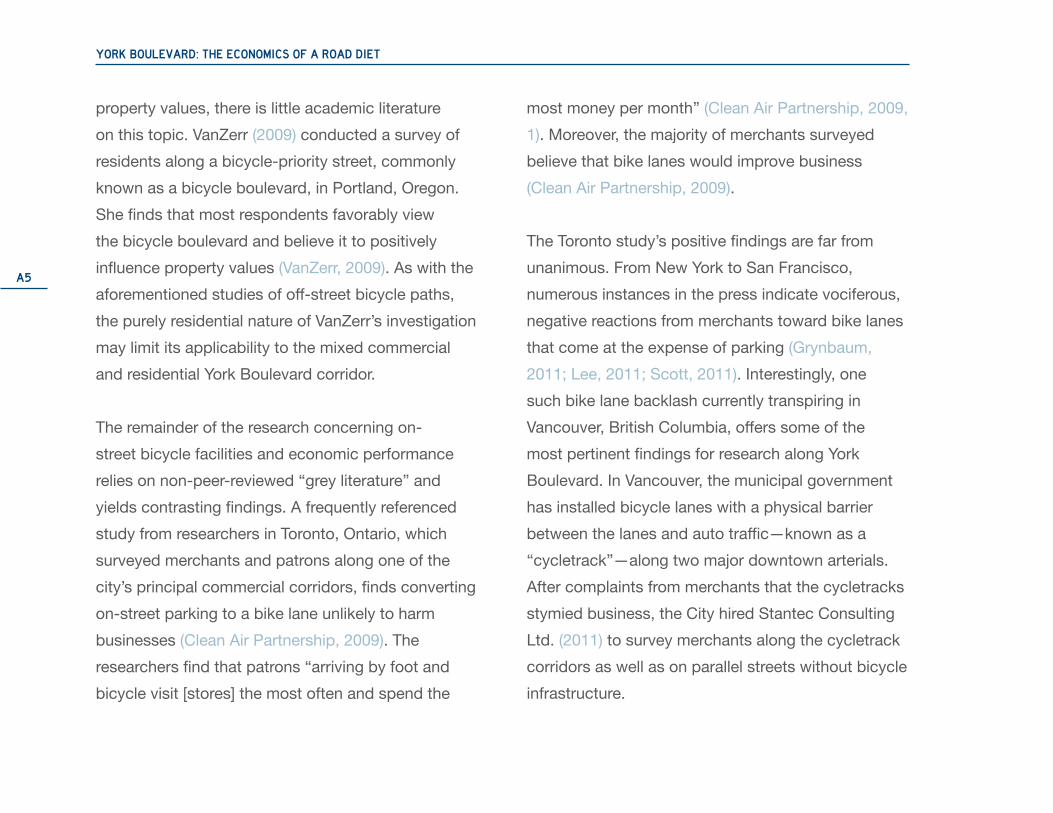
YORK BOULEVARD: THE ECONOMICS OF A ROAD DIET
A5
most money per month” (Clean Air Partnership, 2009, 1). Moreover, the majority of merchants surveyed believe that bike lanes would improve business (Clean Air Partnership, 2009).
The Toronto study’s positive findings are far from unanimous. From New York to San Francisco, numerous instances in the press indicate vociferous, negative reactions from merchants toward bike lanes that come at the expense of parking (Grynbaum, 2011; Lee, 2011; Scott, 2011). Interestingly, one such bike lane backlash currently transpiring in Vancouver, British Columbia, offers some of the most pertinent findings for research along York Boulevard. In Vancouver, the municipal government has installed bicycle lanes with a physical barrier between the lanes and auto traffic—known as a “cycletrack”—along two major downtown arterials. After complaints from merchants that the cycletracks stymied business, the City hired Stantec Consulting Ltd. (2011) to survey merchants along the cycletrack corridors as well as on parallel streets without bicycle infrastructure.
property values, there is little academic literature on this topic. VanZerr (2009) conducted a survey of residents along a bicycle-priority street, commonly known as a bicycle boulevard, in Portland, Oregon. She finds that most respondents favorably view the bicycle boulevard and believe it to positively influence property values (VanZerr, 2009). As with the aforementioned studies of off-street bicycle paths, the purely residential nature of VanZerr’s investigation may limit its applicability to the mixed commercial and residential York Boulevard corridor.
The remainder of the research concerning on-street bicycle facilities and economic performance relies on non-peer-reviewed “grey literature” and yields contrasting findings. A frequently referenced study from researchers in Toronto, Ontario, which surveyed merchants and patrons along one of the city’s principal commercial corridors, finds converting on-street parking to a bike lane unlikely to harm businesses (Clean Air Partnership, 2009). The researchers find that patrons “arriving by foot and bicycle visit [stores] the most often and spend the
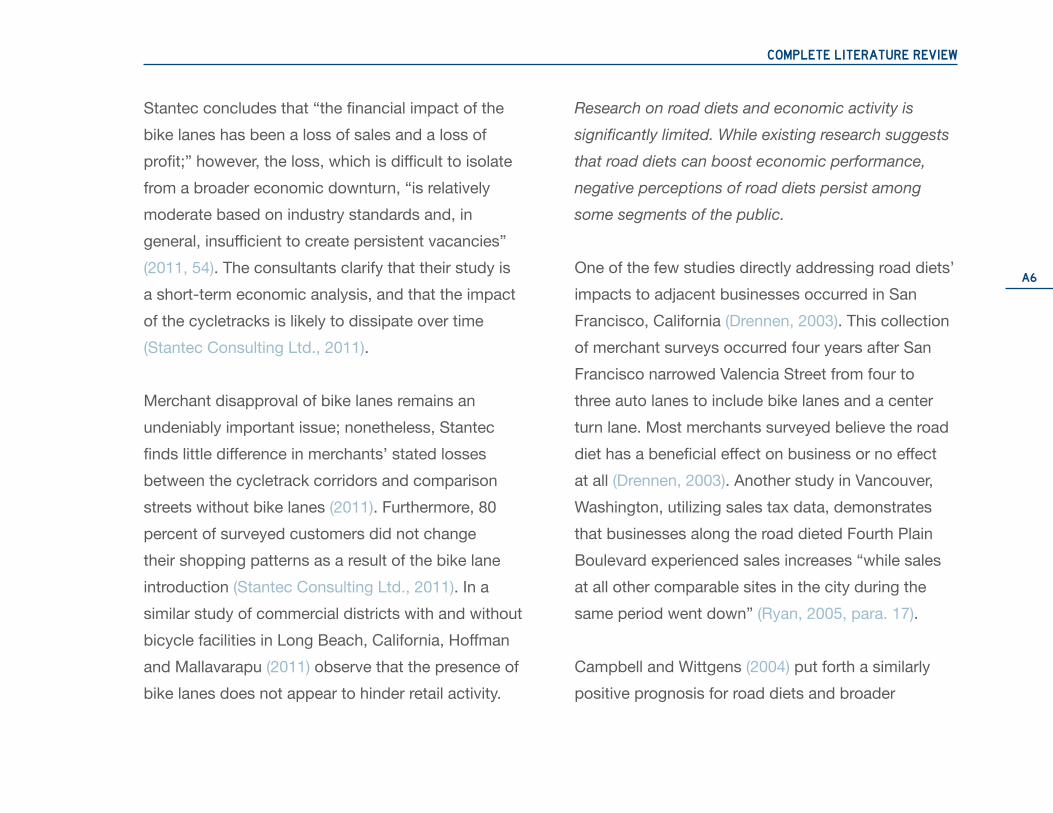
A6
COMPLETE LITERATURE REVIEW
Research on road diets and economic activity is significantly limited. While existing research suggests that road diets can boost economic performance, negative perceptions of road diets persist among some segments of the public.
One of the few studies directly addressing road diets’ impacts to adjacent businesses occurred in San Francisco, California (Drennen, 2003). This collection of merchant surveys occurred four years after San Francisco narrowed Valencia Street from four to three auto lanes to include bike lanes and a center turn lane. Most merchants surveyed believe the road diet has a beneficial effect on business or no effect at all (Drennen, 2003). Another study in Vancouver, Washington, utilizing sales tax data, demonstrates that businesses along the road dieted Fourth Plain Boulevard experienced sales increases “while sales at all other comparable sites in the city during the same period went down” (Ryan, 2005, para. 17).
Campbell and Wittgens (2004) put forth a similarly positive prognosis for road diets and broader
Stantec concludes that “the financial impact of the bike lanes has been a loss of sales and a loss of profit;” however, the loss, which is difficult to isolate from a broader economic downturn, “is relatively moderate based on industry standards and, in general, insufficient to create persistent vacancies” (2011, 54). The consultants clarify that their study is a short-term economic analysis, and that the impact of the cycletracks is likely to dissipate over time (Stantec Consulting Ltd., 2011).
Merchant disapproval of bike lanes remains an undeniably important issue; nonetheless, Stantec finds little difference in merchants’ stated losses between the cycletrack corridors and comparison streets without bike lanes (2011). Furthermore, 80 percent of surveyed customers did not change their shopping patterns as a result of the bike lane introduction (Stantec Consulting Ltd., 2011). In a similar study of commercial districts with and without bicycle facilities in Long Beach, California, Hoffman and Mallavarapu (2011) observe that the presence of bike lanes does not appear to hinder retail activity.
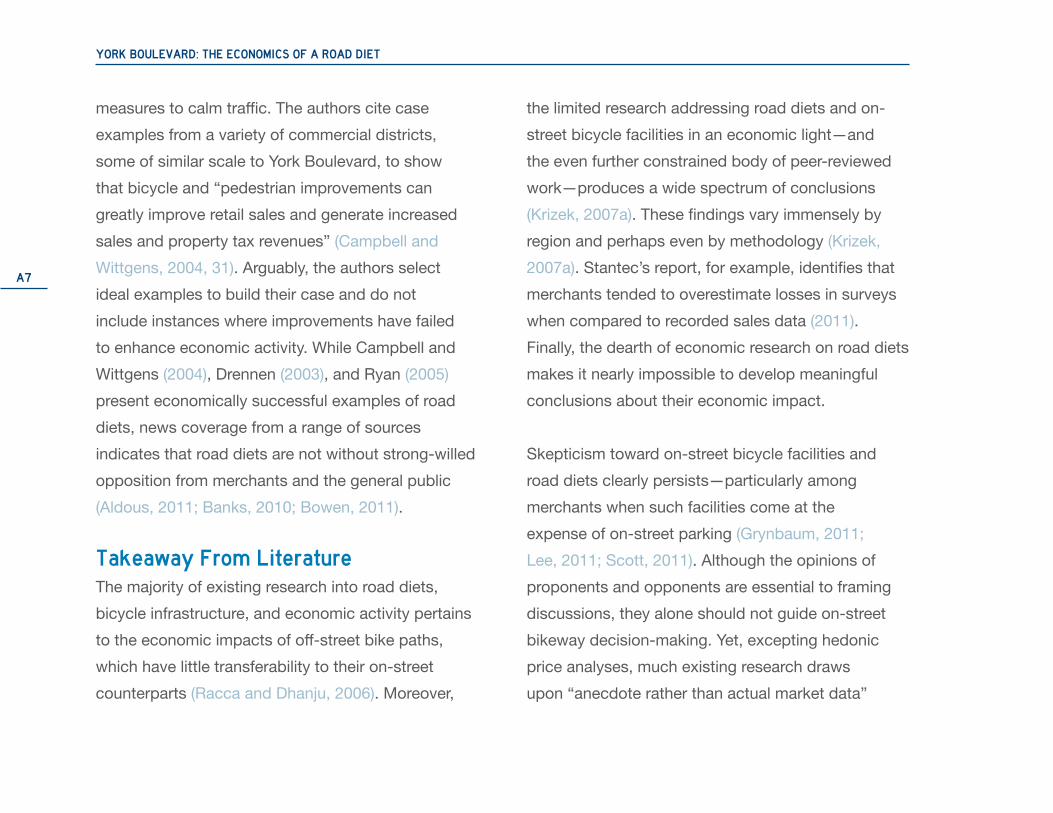
YORK BOULEVARD: THE ECONOMICS OF A ROAD DIET
A7
the limited research addressing road diets and on-street bicycle facilities in an economic light—and the even further constrained body of peer-reviewed work—produces a wide spectrum of conclusions (Krizek, 2007a). These findings vary immensely by region and perhaps even by methodology (Krizek, 2007a). Stantec’s report, for example, identifies that merchants tended to overestimate losses in surveys when compared to recorded sales data (2011). Finally, the dearth of economic research on road diets makes it nearly impossible to develop meaningful conclusions about their economic impact.
Skepticism toward on-street bicycle facilities and road diets clearly persists—particularly among merchants when such facilities come at the expense of on-street parking (Grynbaum, 2011; Lee, 2011; Scott, 2011). Although the opinions of proponents and opponents are essential to framing discussions, they alone should not guide on-street bikeway decision-making. Yet, excepting hedonic price analyses, much existing research draws upon “anecdote rather than actual market data”
measures to calm traffic. The authors cite case examples from a variety of commercial districts, some of similar scale to York Boulevard, to show that bicycle and “pedestrian improvements can greatly improve retail sales and generate increased sales and property tax revenues” (Campbell and Wittgens, 2004, 31). Arguably, the authors select ideal examples to build their case and do not include instances where improvements have failed to enhance economic activity. While Campbell and Wittgens (2004), Drennen (2003), and Ryan (2005) present economically successful examples of road diets, news coverage from a range of sources indicates that road diets are not without strong-willed opposition from merchants and the general public (Aldous, 2011; Banks, 2010; Bowen, 2011).
Takeaway From LiteratureThe majority of existing research into road diets, bicycle infrastructure, and economic activity pertains to the economic impacts of off-street bike paths, which have little transferability to their on-street counterparts (Racca and Dhanju, 2006). Moreover,

A8
COMPLETE LITERATURE REVIEW
residential environments. Examining property sale prices along a mixed commercial and residential corridor such as York Boulevard may yield differing results. Additionally, the contexts of Krizek (2006) and Racca and Dhanju’s (2006) studies—Minneapolis-Saint Paul and Delaware, respectively—may very well be irrelevant to Los Angeles.
Perhaps the most cohesive criteria for future economic studies of road diets and bikeways comes from Krizek et al. (2007b), which establishes that research should:1. Measure effects at a neighborhood, municipal, or
regional scale2. Inform bikeway policy decisions and
implementation3. Utilize stakeholder surveys and existing data4. Employ units that are comparable within the
individual study as well as among related studies5. Quantify effects both for cyclists and the broader
communityThe methodology I employ builds explicitly upon Krizek’s (2007b) five recommendations.
while existing, readily available sources, such as sales tax revenues and property values, go largely untapped (Nicholls and Crompton, 2005, 321). This incongruence calls to a need for research that balances surveys—an excellent mechanism for assessing stakeholder perceptions—with numeric sales and property data, which minimize bias in the conditions they portray. My research fuses surveys with numeric data in just this manner.
The York Boulevard study proffers recommendations to create bicycle facilities that are economically harmonious with their context. Stantec’s report offers a relevant framework for such facilities, including, for example, “allocating scare [road] space to different uses according to the demand at different times” and moving “quickly to meet with the businesses that have been particularly impacted...in order to mitigate sales losses” (2011, vi).
Although Krizek (2006) and Racca and Dhanju (2006) show on-street bikeways to have little effect on property values, these studies investigate only

YORK BOULEVARD: THE ECONOMICS OF A ROAD DIET
B1
Biking in LA. (2012, January 22). Analyzing 2011 SoCal cycling fatalities: Los Angeles—and door zones—may be safer than you think. [Web log comment]. Retrieved May 3, 2012, from http://bikinginla.wordpress.com/2012/01/22/analyzing-2011-socal-cycling-fatalities-los-angeles-and-door-zones-may-be-safer-than-you-think/
Bowen, S. (2011, June 14). Carolina Beach officials end ‘road diet’ plan after complaints, North Carolina StarNews.
California State Board of Equalization. (2009). Bradley-burns uniform local sales and use tax. Retrieved February 9, 2012, from http://www.boe.ca.gov/info/fact_sheets/bradley-burns.htm
Campbell, R. and Wittgens, M. (2004, March). The business case for active transportation: The economic benefits of walking and cycling. Retrieved November 3, 2011, from www.bikewalk.org/2004conference/sessions/2_Business/Business_Case_for_Active_Transportation.pdf
B. ReferencesAarts, L. and Van Schagen, I. (2006, March). Driving speed and the risk of road crashes: A review. Accident Analysis & Prevention, 38 (2), 215–224. doi: 10.1016/j.aap.2005.07.004
Aldous, V. (2011, August 2). Ashland ‘road diet’ meets opposition. Southern Oregon Mail Tribune.
Altshuler, A. (1965). The city planning process: A political analysis. Ithaca, NY: Cornell University Press.
Alwin, D. and Krosnick, J. (1991, August). The reliability of survey attitude measurement: The influence of question and respondent attributes. Sociological Methods Research, 20 (1), 139–181. doi: 10.1177/0049124191020001005
Banks, S. (2010, October 9). Battling over bike lanes. Los Angeles Times.

B2
REFERENCES
2012, from http://lapublichealth.org/wwwfiles/ph/hae/ha/DiabetesTrends05.pdf
Dannenberg, A., Frumkin, H., and Jackson, R. (2011, August 25). Making healthy places: Designing and building for health, well-being, and sustainability. Washington, DC: Island Press.
De Hartog, J. et al. (2010). Do the health benefits of cycling outweigh the risks? Environmental Health Perspectives, 118, 1109–1116 doi: 10.1289/ehp.0901747
Drennen, E. (2003, December). Economic effects of traffic calming on urban small businesses. San Francisco, California: San Francisco State University Department of Public Administration. Retrieved November 3, 2011, from www.emilydrennen.org/TrafficCalming_full.pdf
Frank, L. et al. (2006). Many pathways from land use to health: Associations between neighborhood walkability and active transportation, body mass
City of Los Angeles. (2010). Los Angeles Bicycle Plan. Los Angeles, CA: City of Los Angeles Department of City Planning. Retrieved April 19, 2011, from http://www.labikeplan.org/public_involvement
Clean Air Partnership. (2009). Bike lanes, on-street parking and business: A study of Bloor Street in Toronto’s Annex neighborhood. Toronto, Ontario: Clean Air Partnership. Retrieved August 2, 2011, from http://www.cleanairpartnership.org/pdf/bike-lanes-parking.pdf
County of Los Angeles. (2011, September). Obesity and related mortality in Los Angeles County. Los Angeles, CA: County of Los Angeles Department of Public Health. Retrieved February 1, 2012, from http://publichealth.lacounty.gov/ha/reports/habriefs/2007/Obese_Cities/Obesity_2011Fs.pdf
County of Los Angeles. (2007, August). LA health trends: Diabetes on the rise in Los Angeles County adults. Los Angeles, CA: County of Los Angeles Department of Public Health. Retrieved February 1,

YORK BOULEVARD: THE ECONOMICS OF A ROAD DIET
B3
Governor’s Bicycle Coordinating Council. (2005). The economic impact of bicycling in Wisconsin. Madison, Wisconsin: Governor’s Bicycle Coordinating Council. Retrieved November 3, 2011, from www.dot.wisconsin.gov/business/econdev/docs/impact-bicycling.pdf
Grynbaum, M. (2011, February 7). Shops want back parking lost to Columbus Ave. bike lane [Web log]. Retrieved November 3, 2011, from http://cityroom.blogs.nytimes.com/2011/02/07/shops-want-back-parking-lost-to-columbus-ave-bike-lane
Hoffman, S. and Mallavarapu, B. (2011). Bikeway areas retail study. Retrieved August 2, 2011, from http://www.stanleyrhoffman.com
Huang, H., Stewart, J., and Zegeer, C. (2004, March). Summary report: Evaluation of lane reduction “road diet” measures and their effects on crashes and injuries. Retrieved February 9, 2012, from http://www.fhwa.dot.gov/publications/research/safety/humanfac/04082/index.cfm
index, and air quality. Journal of the American Planning Association, 72 (1), 75–87. doi: 10.1080/01944360608976725
Franklin, J. and Waddell, P. (2002, July 31). A hedonic regression of home prices in King County, Washington, using activity-specific accessibility measures. (Transportation Research Board 82nd Annual Meeting). Washington, DC: Transportation Research Board. Retrieved February 8, 2012, from http://nexus.umn.edu/courses/pa8202/waddell%20-%20hedonic.pdf
Garrett-Peltier, H. (2010, June 20). Pedestrian and bicycle infrastructure: A national study of employment impacts. Amherst, Massachusetts: Political Economy Research Institute of the University of Massachusetts. Retrieved November 3, 2011, from http://www.peri.umass.edu/fileadmin/pdf/published_study/PERI_ABikes_October2011.pdf

B4
REFERENCES
Krizek, K. et al. (2007b, May). Analysing the benefits and costs of bicycle facilities via online guidelines. Planning, Practice & Research, 22 (2), 197–213. doi: 10.1080/02697450701584386
Krizek, K. (2006). Two approaches to valuing some of bicycle facilities’ presumed benefits. Journal of the American Planning Association, 72 (3), 309–320. doi: 10.1080/01944360608976753
Lawrie et al. (2004, April). The economic impact of investments in bicycle facilities: A case study of the North Carolina Northern Outer Banks. Raleigh, North Carolina: North Carolina State University Institute for Transportation Research and Education. Retrieved November 3, 2011, from www.ncdot.org/bikeped/download/bikeped_research_EIAoverview.pdf
Lee, J. (2011, July 22). Bike lanes to stay while data collected. Vancouver Sun.
Institute of Transportation Engineers. (2010). Designing walkable urban thoroughfares: A context sensitive approach. Washington, DC: Institute of Transportation Engineers.
Karadeniz, D. (2008) The impact of the Little Miami Scenic Trail on single family residential property values. Cincinnati, Ohio: University of Cincinnati. Retrieved November 3, 2011, from http://etd.ohiolink.edu/view.cgi?acc_num=ucin1211479716
Klein, G., Reiskin, E., and Sadik-Kahn, J. (2012, January 23). Mobility strategies in the 21st century. Discussion panel presented at the Transportation Research Board 91st Annual Meeting, Washington, DC.
Krizek, K. (2007a). Estimating the economic benefits of bicycling and bicycle facilities: An interpretive review and proposed methods. Contributions to Economics, Part IV, 219–248. doi: 10.1007/978-3-7908-1765-2_14

YORK BOULEVARD: THE ECONOMICS OF A ROAD DIET
B5
international trade bridge in Buffalo, New York. Aerosol Science and Technology, 44 (12), 1096–1104. doi: 10.1080/02786826.2010.512026
National Highway Traffic Safety Administration. (2011). Traffic safety facts, 2009 data: Bicyclists and other cyclists. Retrieved February 9, 2012, from http://www-nrd.nhtsa.dot.gov/Pubs/811386.pdf
Nicholls, S. and Crompton, J. (2005). The impact of greenways on property values: Evidence from Austin, Texas. Journal of Leisure Research, 37 (3), 321–341. Retrieved November 3, 2011, from http://www.beltline.org/Portals/26/Funding/Tiger/Impact of Greenways.pdf
Project for Public Spaces (n.d.). Traffic calming 101. New York, NY: Project for Public Spaces. Retrieved May 3, 2012, from http://www.pps.org/articles/livememtraffic
Li, N. et al. (2010, September). Ambient ultrafine particles provide a strong adjuvant effect in the secondary immune response: Implication for traffic-related asthma flares. American Journal of Physiology Lung Cellular and Molecular Physiology, 299 (3), L374–L383. doi: 10.1152/ajplung.00115.2010
Lindsey et al. (2004). Property values, recreation values, and urban greenways. Journal of Park and Recreation Administration, 22(3), 69–90. Retrieved November 3, 2011, from http://www.activelivingresearch.org/node/10305
Macy, S. and MacDonald, S. (2005, March). The effect of greenways on property values and public safety. Denver, Colorado: Colorado State Parks State Trails Program. Retrieved November 3, 2011, from www.broward.org/Greenways/Documents/coloradostudy.pdf
McAuley, T. et al. (2010). Spatial measurements of ultrafine particles using an engine exhaust particle sizer within a local community downwind of a major

B6
REFERENCES
Schmid, O. et al. (2009, July). Dosimetry and toxicology of inhaled ultrafine particles. Biomarkers, 14 (s1), 67–73. doi: 10.1080/13547500902965617
Scott, J. (2011, April 22). Speed bumps in the path of the bicycle juggernaut. New York Times, p. 21A.
South Coast Air Quality Management District. (n.d.). Dirty air. Diamond Bar, CA: South Coast Air Quality Management District. Retrieved February 1, 2012, from http://www.aqmd.gov/pubinfo/Publications/collaterals/DirtyAir.pdf
Stantec Consulting Ltd. (2011, July 11). Vancouver separated bike lane business impact study. http://vancouver.ca/ctyclerk/cclerk/20110728/documents/penv3-BusinessImpactStudyReportDowntownSeparatedBicycleLanes-StantecReport.pdf
Tan, C. (2011, September/October). Going on a road diet. Public Roads, 75 (2). Retrieved February 9, 2012, from http://www.fhwa.dot.gov/publications/publicroads/11septoct/05.cfm%5C
Pucher, J. et al. (2010, October). Walking and cycling to health: A comparative analysis of city, state, and international data. American Journal of Public Health, 100 (10), 1986–1992. doi: 10.2105/AJPH.2009.189324
Racca, D. and Dhanju, A. (2006). Property value/desirability effects of bike paths adjacent to residential areas. Retrieved August 2, 2011, from http://128.175.63.72/projects/DOCUMENTS/bikepathfinal.pdf
Reynolds, C. et al. (2009, October 21). The impact of transportation infrastructure on bicycling injuries and crashes: A review of the literature. Environmental Health 2009, 8 (47). doi:10.1186/1476-069X-8-47
Ryan, A. (2005, October 6). ‘Road diet’ concept eliminates unnecessary lanes, thereby improving street livability. Daily Journal of Commerce. Retrieved November 4, 2011, from http://www.allbusiness.com/north-america/united-states-oregon/1115787-1.html#ixzz1d09E72O3

YORK BOULEVARD: THE ECONOMICS OF A ROAD DIET
B7
Wachs, M. (2004). Reflections on the planning process. In S. Hanson and G. Giuliano (Eds.), The geography of urban transportation (113-126). New York, NY: Guilford Press.
Yglesias, M. (2011, September 27). Cash-strapped cities struggle to maintain mass transit [Web log message]. Retrieved February 9, 2012, from http://www.theatlanticcities.com/commute/2011/09/cash-stapped-cities-mass-transit/205
Taylor, B. (1995). Public perceptions, fiscal realities, and freeway planning: The California case. Journal of the American Planning Association, 61 (1), 43–56. doi: 10.1080/01944369508975618
Texas Transportation Institute. (2011). National congestion tables. Retrieved February 2, 2012, from http://mobility.tamu.edu/files/2011/09/all-nat-cong-tables.pdf
VanZerr, M. (2009). Resident perceptions of bicycle boulevards: A Portland, Oregon case study (Transportation Research Board 89th Annual Meeting). Washington, DC: Transportation Research Board. Retrieved November 3, 2011, from http://www.ibpi.usp.pdx.edu/boulevardperceptions.php

C1
REFERENCES
C. Survey Instruments1. Oral consent script - English2. Oral consent script - Spanish3. Business owner/manager survey - English4. Business owner/manager survey - Spanish5. Customer intercept survey - English6. Customer intercept survey - Spanish

York Boulevard business interview survey: Oral consent script Thank you for your interest in the York Boulevard Road Diet Economic Impact Study.
Your participation in this research study is voluntary, and there is no penalty if you
refuse to participate or choose to end the survey at any point. The purpose of this
survey is to learn about your feelings toward traffic, road size, and bicycle lanes, and
how these items may affect the number of people who shop in this neighborhood. Your
responses are very important as they will help us gain a better understanding of how
businesses feel about traffic and bicycle lanes.
You have been selected to participate because you were observed shopping or dining
or because your business is located along York Boulevard between Eagle Rock
Boulevard and Figueroa Street, which is the study area for this project. If you agree to
participate, we will ask you 6 to 8 short questions and we will write down your
responses. Your participation should take no more than 15 minutes. We will record no
personal or identifiable information about you and will not mention your name or your
business’ name in any reports. Further, your responses will be held confidentially, and
only a small group of researchers will have access to your responses. For these
reasons, we believe that there is minimal risk in your participation in this study.
Thank you again. If you have any questions, please feel free to contact:
Cullen McCormick, Masters of Urban Planning Candidate, UCLA
4611 La Mirada Ave #3
Los Angeles, CA 90029
408-781-2980

Encuesta de negocios en York Boulevard: Consentimiento oral guión Gracias por su interés en el estudio investigando el impacto económico del dieta en la Boulevard de York. Su participación en este estudio de investigación es voluntaria y no hay ninguna pena si se niegan a participar o elegir poner fin a la encuesta en cualquier momento. El propósito de esta encuesta es conocer sus sentimientos hacia el tráfico, tamaño de la calle y carriles de bicicleta y cómo estos elementos pueden afectar el número de personas que hacen compras en este barrio. Sus respuestas son muy importantes por que nos van a ayudar a obtener una mejor comprensión de cómo los negocios se sienten sobre carriles de tráfico y bicicleta.
Has sido seleccionado para participar porque fue visto comprando o comiendo o porque tu negocio se encuentra por el Boulevard de York entre Eagle Rock Boulevard y Figueroa, que es el área de estudio para este proyecto. Si usted acepta participar, le pediremos 6 o 8 preguntas brevementes y anotamos sus respuestas. Su participación debe durar no más que15 minutos. No registramos ninguna información personal o identificable acerca de usted y no mencionar su nombre o su negocio en los reportes. Además, sus respuestas se realizará de forma confidencial, y sólo un pequeño grupo de investigadores tendrán acceso a sus respuestas. Por estas razones, creemos que hay un riesgo mínimo en su participación en este estudio.
Gracias de nuevo. Si tiene alguna pregunta, no dude en ponerse en contacto con:
Cullen McCormick, Candidato de Maestría Urbanismo, UCLA
4611 La Mirada Ave # 3
Los Angeles, CA 90029
408-781-2980

York Boulevard business interview survey Business information 1. Business name ____________________________________________________________________
2. Business address __________________________________________________________________
3. What type of business is this? ________________________________________________________
Business tenure 4. How many years (or months if less than a year) has the business been at this current location?
_____ YEARS / MONTHS (circle whether the number entered on the line represents months or
years)
5. Does your business own or rent the building? OWN / RENT (circle one)
6. How many employees work here? _____
Business access
7. How would you guess most of your customers come to your business? Do they DRIVE, take PUBLIC
TRANSIT, BICYCLE, or WALK? (circle one)
8. Do you think more people visit your business when cars drive fast past your business or when they
have to drive slowly past your business? Or do you think the speed of vehicles has no effect on your
business? FAST / SLOW / NO EFFECT (circle one)
9. Do you think more, less, or the same number of people would visit your business if there were more
car lanes on the road?
MORE / LESS / NO CHANGE (circle one)
What about if there were fewer lanes?
MORE / LESS / NO CHANGE (circle one)
10. Do you think bicycle lanes hurt your business? YES / NO (circle one)
Why or why not? __________________________________________________________________
________________________________________________________________________________
________________________________________________________________________________
11. Would you support removing car lanes on the road to add bicycle lanes? YES / NO (circle one)
What about removing parking to add bicycle lanes? YES / NO (circle one)
Why or why not? __________________________________________________________________
________________________________________________________________________________
________________________________________________________________________________

Entrevista encuesta de negocios York Boulevard Información del negocio
1. ¿Nombre de Negocio?________________________________________________________
2. ¿Dirección del Negocio? ______________________________________________________
3. ¿Qué tipo de negocio es este? _________________________________________________
Tenencia de negocio
4. ¿Cuántos años tiene (o meses si menos de un año) este negocio aquí en el mismo
ubicación? _____ AÑOS / MESES (círculo si el número especificado en la línea representa
meses o años)
5. ¿Su negocio posea o renta el edificio? POSEA / RENTA (círculo uno)
6. ¿Cuántos empleados trabajan aquí? _____
Acceso empresarial
7. ¿Cómo diría la mayoría de los clientes vienen para su negocio? MANEJAN, usan TRANSITO
PÚBLICO, BICICLETA, o A PIE? (círculo uno)
8. ¿Crees que más gente visite su negocio cuando coches pasan su negocio rápido o cuando
tienen que pasar su negocio lentamente ? O ¿crees que la velocidad de los vehículos no
tiene ningún efecto en su negocio? RÁPIDO / LENTO / SIN EFECTO (círculo uno)
9. ¿Crees que más, menos o el mismo número de personas visitará a su negocio si hubiera
más carriles de automóviles en la calle?
MÁS / MENOS / NO CAMBIO (círculo uno)
¿Qué tal si hubiera menos carriles?
MÁS / MENOS / NO CAMBIO (círculo uno)
10. ¿Crees que carriles para bicicletas dañan su negocio? SÍ / NO (círculo uno)
¿Por qué o por qué no? ______________________________________________________
_______________________________________________________________________________________________________________
__________________________________________________________________________
11. ¿Usted soporta quitar carriles de automóviles en la calle para poner carriles de bicicleta? SÍ /
NO (círculo)
¿ Qué tal quitando espacios de estacionamiento para poner carriles de bicicleta? SÍ / NO
(círculo)
¿Por qué o por qué no? ______________________________________________________
__________________________________________________________________________
_______________________________________________________________________________________________________________
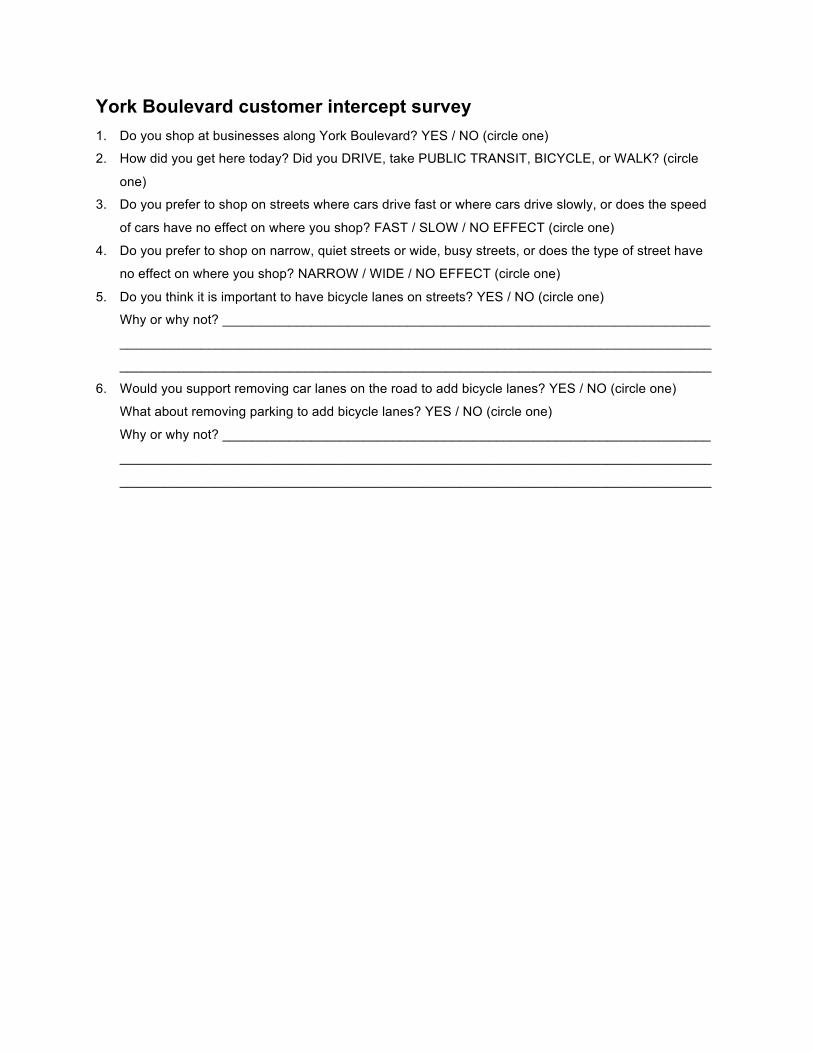
York Boulevard customer intercept survey
1. Do you shop at businesses along York Boulevard? YES / NO (circle one)
2. How did you get here today? Did you DRIVE, take PUBLIC TRANSIT, BICYCLE, or WALK? (circle
one)
3. Do you prefer to shop on streets where cars drive fast or where cars drive slowly, or does the speed
of cars have no effect on where you shop? FAST / SLOW / NO EFFECT (circle one)
4. Do you prefer to shop on narrow, quiet streets or wide, busy streets, or does the type of street have
no effect on where you shop? NARROW / WIDE / NO EFFECT (circle one)
5. Do you think it is important to have bicycle lanes on streets? YES / NO (circle one)
Why or why not? __________________________________________________________________
________________________________________________________________________________
________________________________________________________________________________
6. Would you support removing car lanes on the road to add bicycle lanes? YES / NO (circle one)
What about removing parking to add bicycle lanes? YES / NO (circle one)
Why or why not? __________________________________________________________________
________________________________________________________________________________
________________________________________________________________________________

Estudio de clientes de York Boulevard 1. ¿Haces compras en las tiendas a lo largo del Boulevard de York? SÍ / NO (círculo uno)
2. ¿Cómo llegaste hoy? ¿CONDUJISTE, tomaste TRANSPORTE PÚBLICO, BICICLETA o A
PIE? (círculo uno)
3. ¿Prefieres comprar en las calles donde coches conducen rápido, donde coches conducen
lentamente o la velocidad de los automóviles no tiene ningún efecto en donde
compras? RÁPIDO / LENTO / SIN EFECTO (círculo uno)
4. ¿Prefieres tiendas en calles estrechas, tranquilas o calles amplia, ocupadas, o ¿el tipo de la
calle no tienen ningún efecto sobre donde comprar? ESTRECHO / AMPLIO / SIN EFECTO
(círculo uno)
5. ¿Crees que es importante tener carriles de bicicletas en las calles? SÍ / NO (círculo uno)
¿Por qué o por qué no? ______________________________________________________
__________________________________________________________________________
__________________________________________________________________________
6. ¿Soportaras quitar carriles de automóviles en la carretera para agregar carriles de
bicicleta? SÍ / NO (círculo uno)
¿Cómo quitar parking para agregar carriles de bicicleta? SÍ / NO (círculo uno)
¿Por qué o por qué no? ______________________________________________________
__________________________________________________________________________
__________________________________________________________________________