Ying & Yen
21
Ying & Yen Carson Marries Anthony Mader Mickey Sun Edgar Torres Alex Vicente
description
Ying & Yen. Carson Marries Anthony Mader Mickey Sun Edgar Torres Alex Vicente. Ying & Yen. Carson Moko Anthony Kamakazi Mickey Sumimato Edgar Terriaki Alex Yamamuchi. Data. From 1971 to Present (Monthly) 387 Observations Federal Reserve Bank St Louis (Fred). - PowerPoint PPT Presentation
Transcript of Ying & Yen

Ying & Yen
Carson MarriesAnthony MaderMickey SunEdgar TorresAlex Vicente

Ying & Yen
Carson MokoAnthony KamakaziMickey SumimatoEdgar TerriakiAlex Yamamuchi
Data From 1971 to Present (Monthly) 387 Observations Federal Reserve Bank St Louis
(Fred)
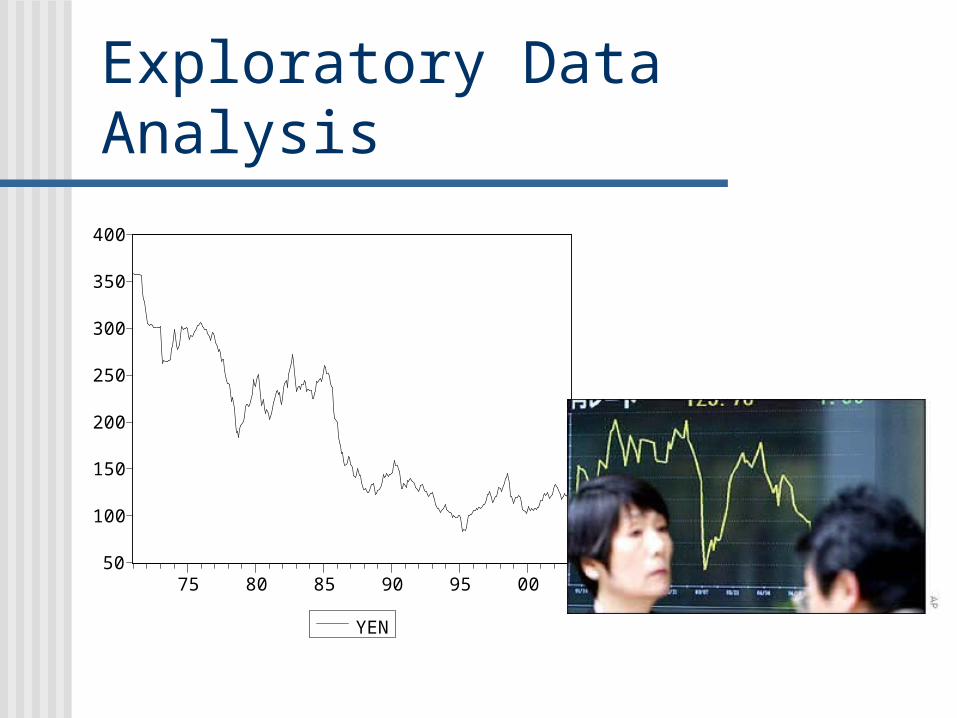
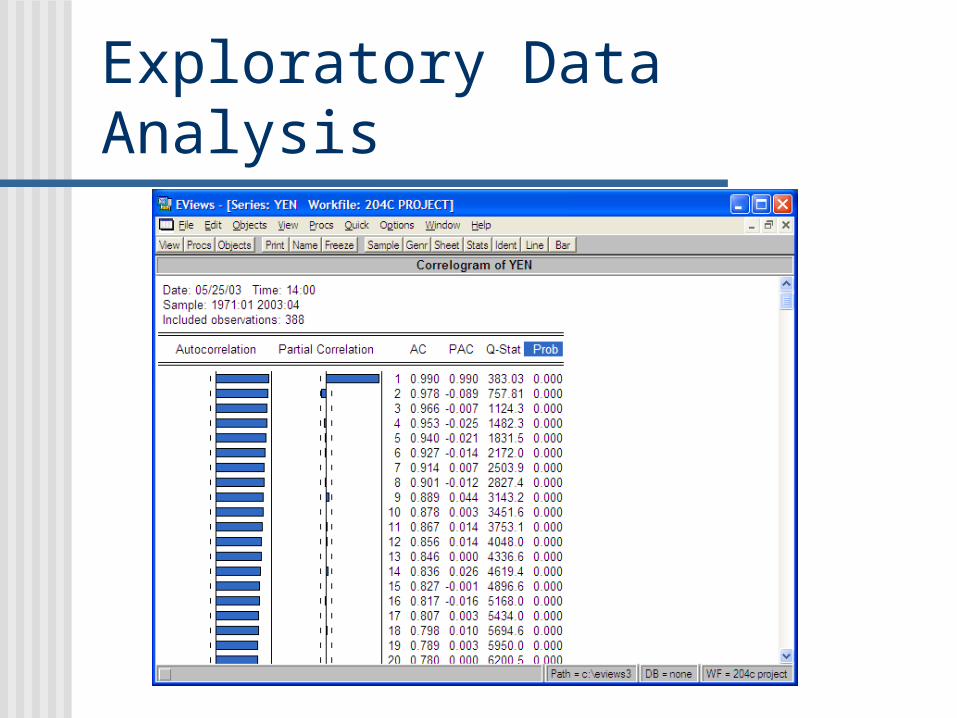
Exploratory Data Analysis
50
100
150
200
250
300
350
400
75 80 85 90 95 00
YEN
Exploratory Data Analysis
0
10
20
30
40
50
60
80 120 160 200 240 280 320 360
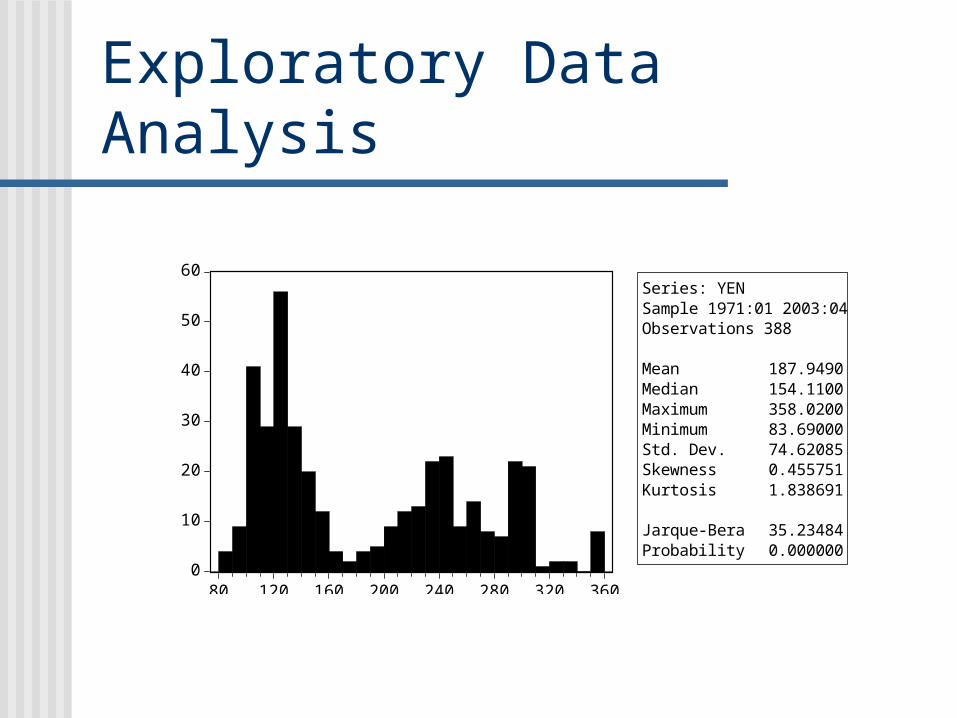
Series: YENSample 1971:01 2003:04Observations 388
Mean 187.9490Median 154.1100Maximum 358.0200Minimum 83.69000Std. Dev. 74.62085Skewness 0.455751Kurtosis 1.838691
Jarque-Bera 35.23484Probability 0.000000
Exploratory Data Analysis
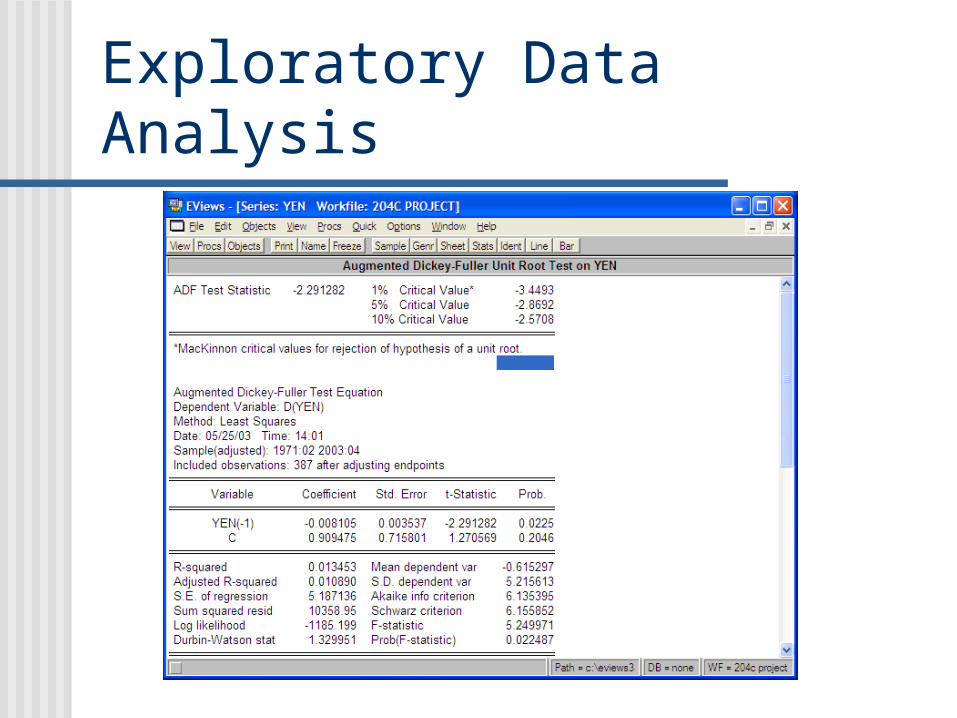
Exploratory Data Analysis
Breaking Yen into Change $ Ln, Difference Fractional Change Pre-Whitening
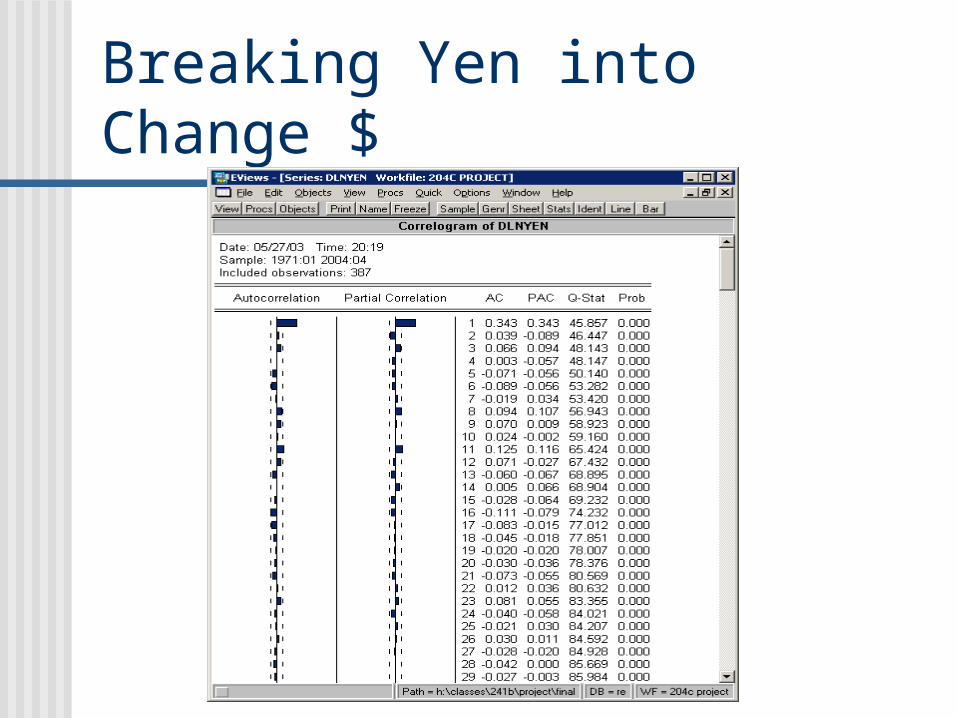
Breaking Yen into Change $
Breaking Yen into Change $
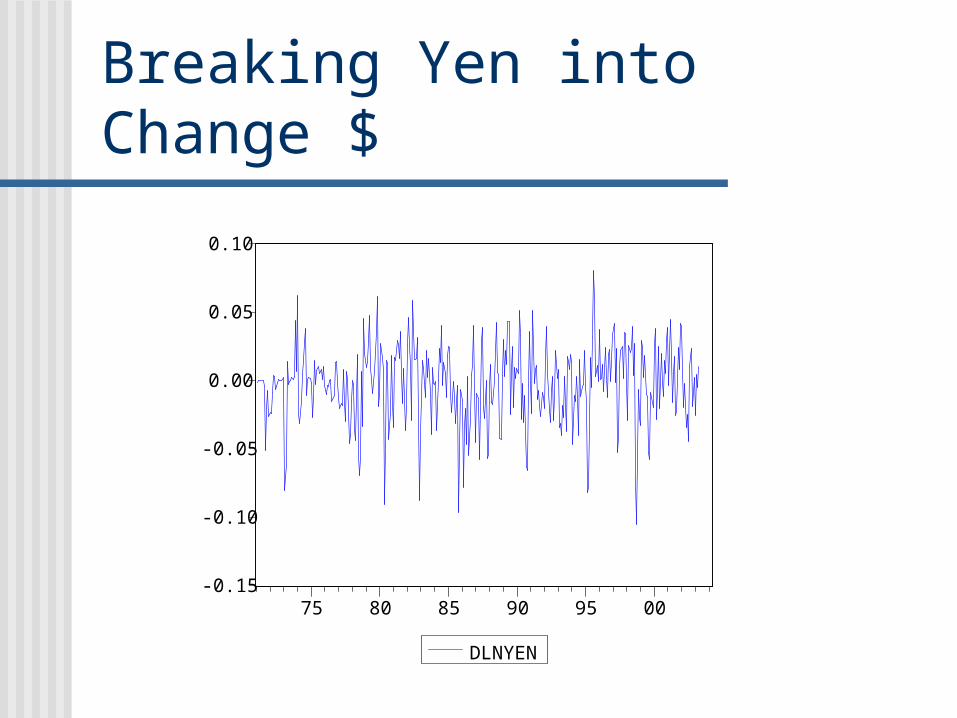
-0.15
-0.10
-0.05
0.00
0.05
0.10
75 80 85 90 95 00
DLNYEN
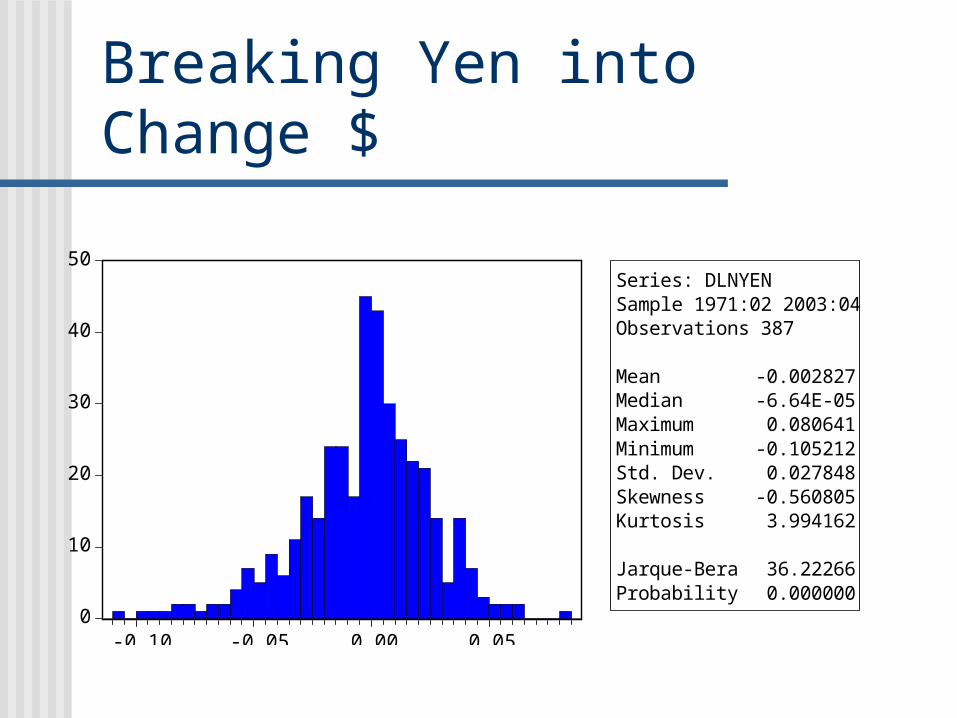
Breaking Yen into Change $
0
10
20
30
40
50
-0.10 -0.05 0.00 0.05
Series: DLNYENSample 1971:02 2003:04Observations 387
Mean -0.002827Median -6.64E-05Maximum 0.080641Minimum -0.105212Std. Dev. 0.027848Skewness -0.560805Kurtosis 3.994162
Jarque-Bera 36.22266Probability 0.000000
Modeling ARMA
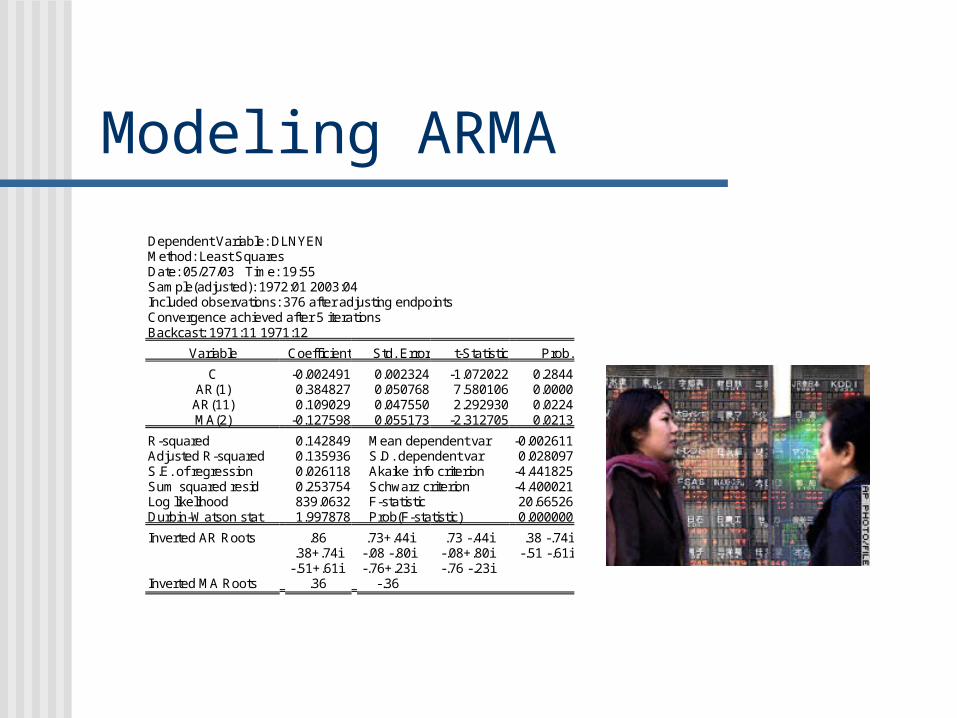
Dependent Variable: DLNYEN Method: Least Squares Date: 05/27/03 Time: 19:55 Sample(adjusted): 1972:01 2003:04 Included observations: 376 after adjusting endpoints Convergence achieved after 5 iterations Backcast: 1971:11 1971:12
Variable Coefficient Std. Error t-Statistic Prob.
C -0.002491 0.002324 -1.072022 0.2844 AR(1) 0.384827 0.050768 7.580106 0.0000 AR(11) 0.109029 0.047550 2.292930 0.0224 MA(2) -0.127598 0.055173 -2.312705 0.0213
R-squared 0.142849 Mean dependent var -0.002611 Adjusted R-squared 0.135936 S.D. dependent var 0.028097 S.E. of regression 0.026118 Akaike info criterion -4.441825 Sum squared resid 0.253754 Schwarz criterion -4.400021 Log likelihood 839.0632 F-statistic 20.66526 Durbin-Watson stat 1.997878 Prob(F-statistic) 0.000000
Inverted AR Roots .86 .73+.44i .73 -.44i .38 -.74i .38+.74i -.08 -.80i -.08+.80i -.51 -.61i -.51+.61i -.76+.23i -.76 -.23i
Inverted MA Roots .36 -.36
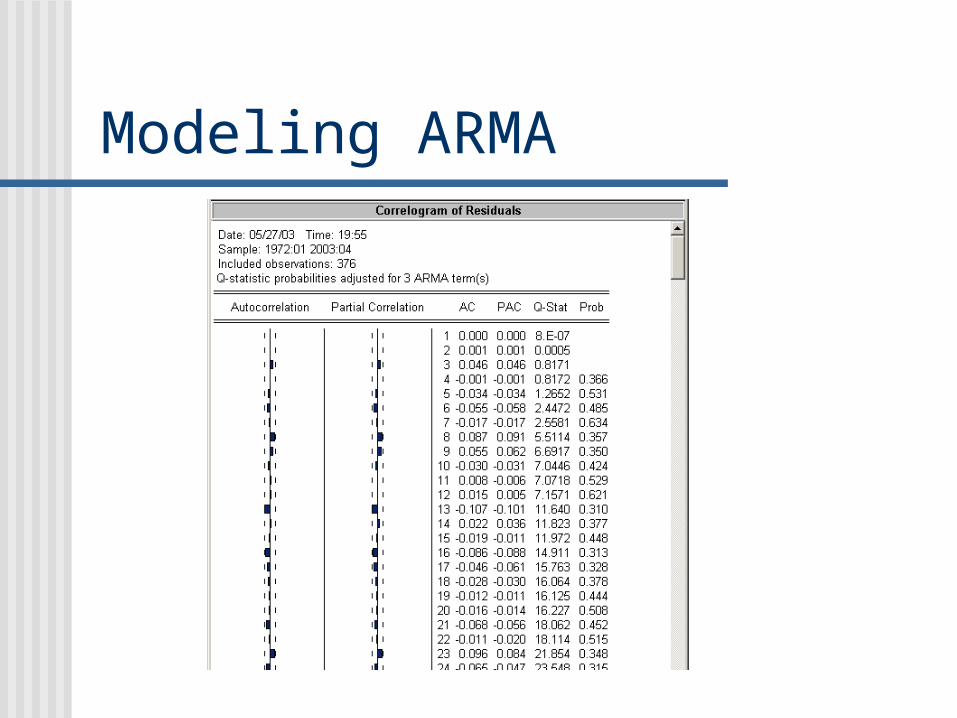
Modeling ARMA
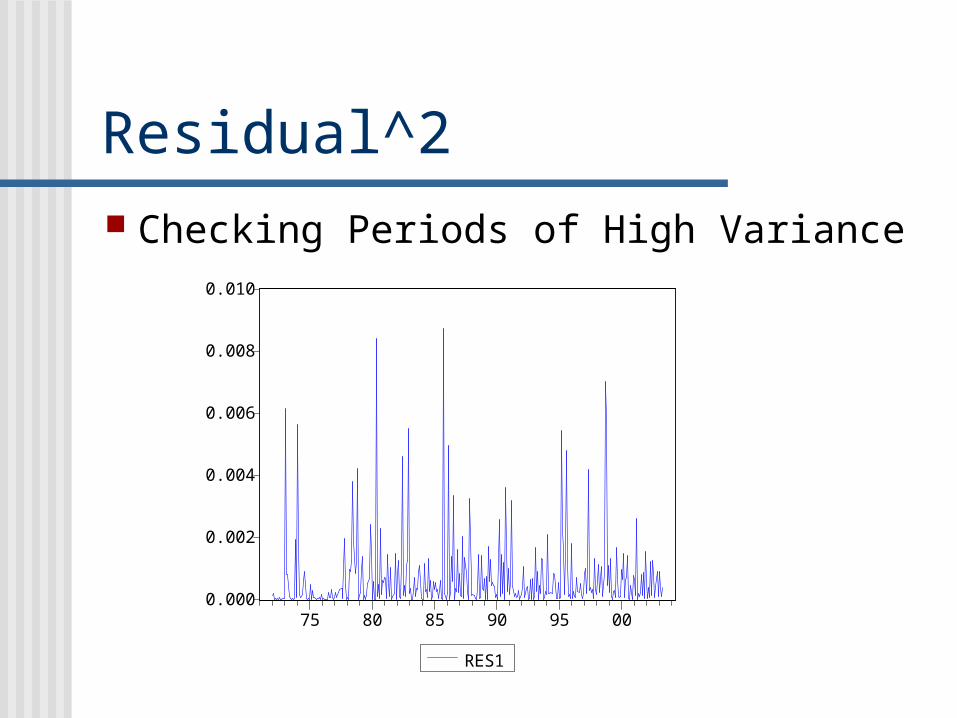
Residual^2 Checking Periods of High Variance
0.000
0.002
0.004
0.006
0.008
0.010
75 80 85 90 95 00
RES1
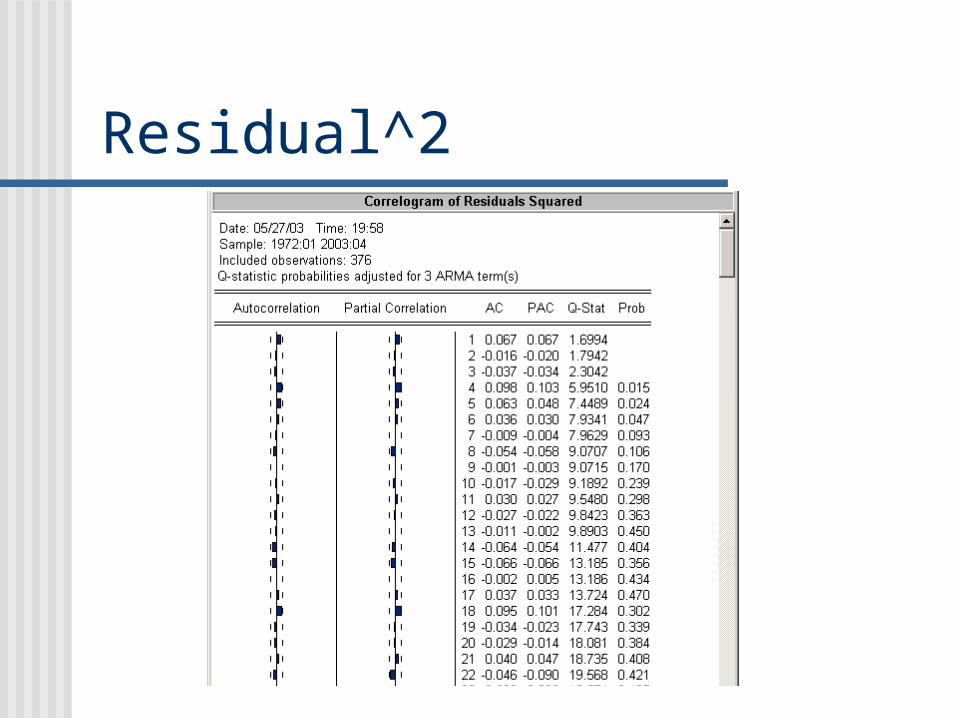
Residual^2
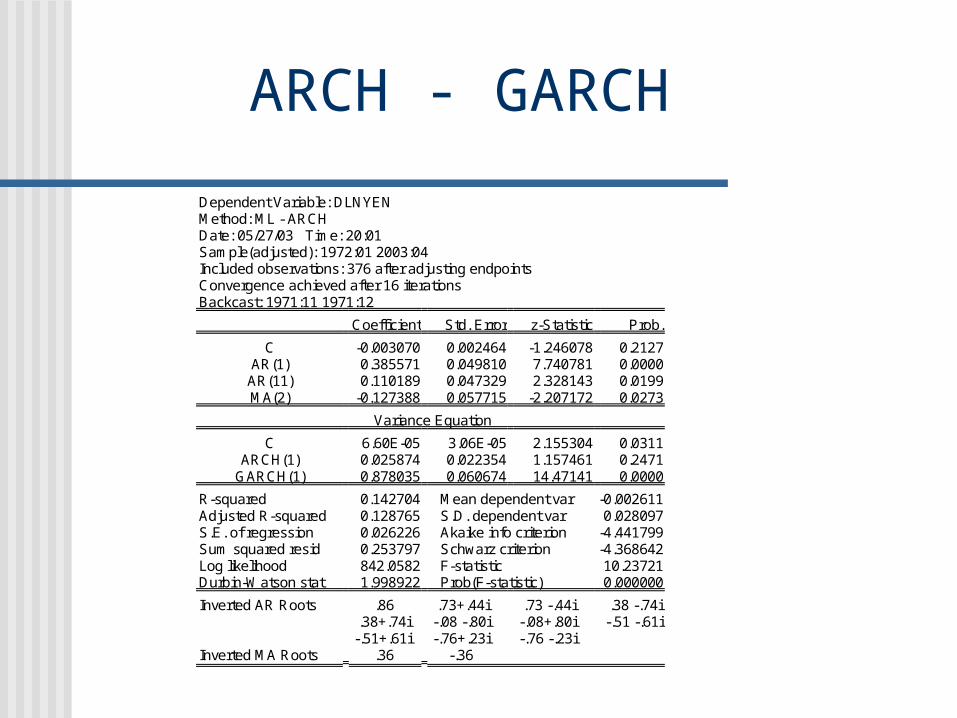
ARCH - GARCH
Dependent Variable: DLNYEN Method: ML - ARCH Date: 05/27/03 Time: 20:01 Sample(adjusted): 1972:01 2003:04 Included observations: 376 after adjusting endpoints Convergence achieved after 16 iterations Backcast: 1971:11 1971:12
Coefficient Std. Error z-Statistic Prob.
C -0.003070 0.002464 -1.246078 0.2127 AR(1) 0.385571 0.049810 7.740781 0.0000 AR(11) 0.110189 0.047329 2.328143 0.0199 MA(2) -0.127388 0.057715 -2.207172 0.0273
Variance Equation
C 6.60E-05 3.06E-05 2.155304 0.0311 ARCH(1) 0.025874 0.022354 1.157461 0.2471
GARCH(1) 0.878035 0.060674 14.47141 0.0000
R-squared 0.142704 Mean dependent var -0.002611 Adjusted R-squared 0.128765 S.D. dependent var 0.028097 S.E. of regression 0.026226 Akaike info criterion -4.441799 Sum squared resid 0.253797 Schwarz criterion -4.368642 Log likelihood 842.0582 F-statistic 10.23721 Durbin-Watson stat 1.998922 Prob(F-statistic) 0.000000
Inverted AR Roots .86 .73+.44i .73 -.44i .38 -.74i .38+.74i -.08 -.80i -.08+.80i -.51 -.61i -.51+.61i -.76+.23i -.76 -.23i
Inverted MA Roots .36 -.36
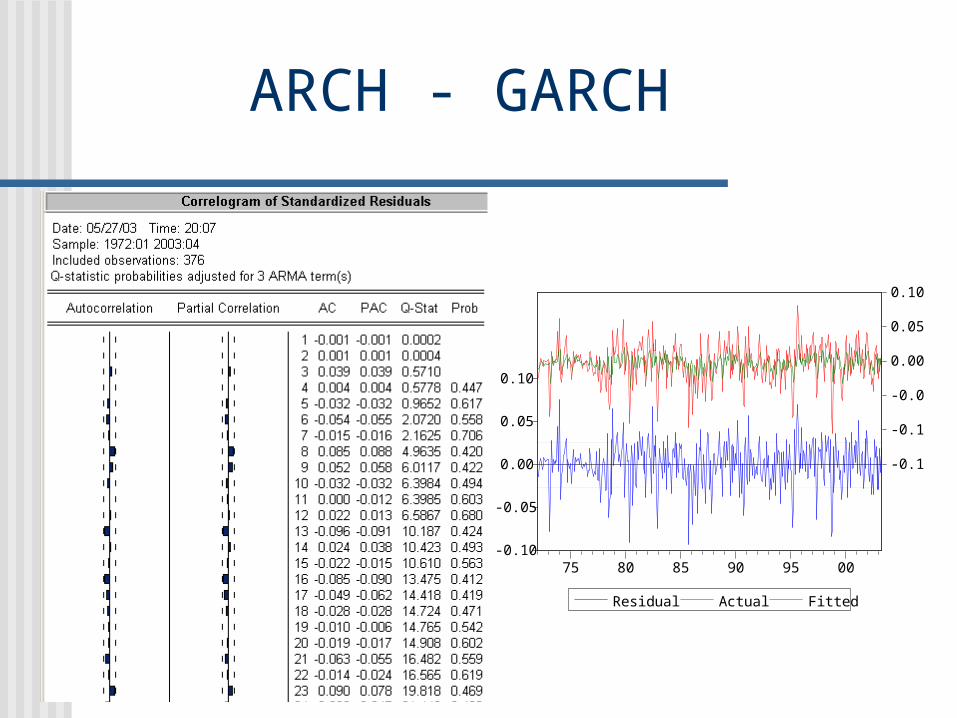
ARCH - GARCH
-0.10
-0.05
0.00
0.05
0.10
-0.15
-0.10
-0.05
0.00
0.05
0.10
75 80 85 90 95 00
Residual Actual Fitted
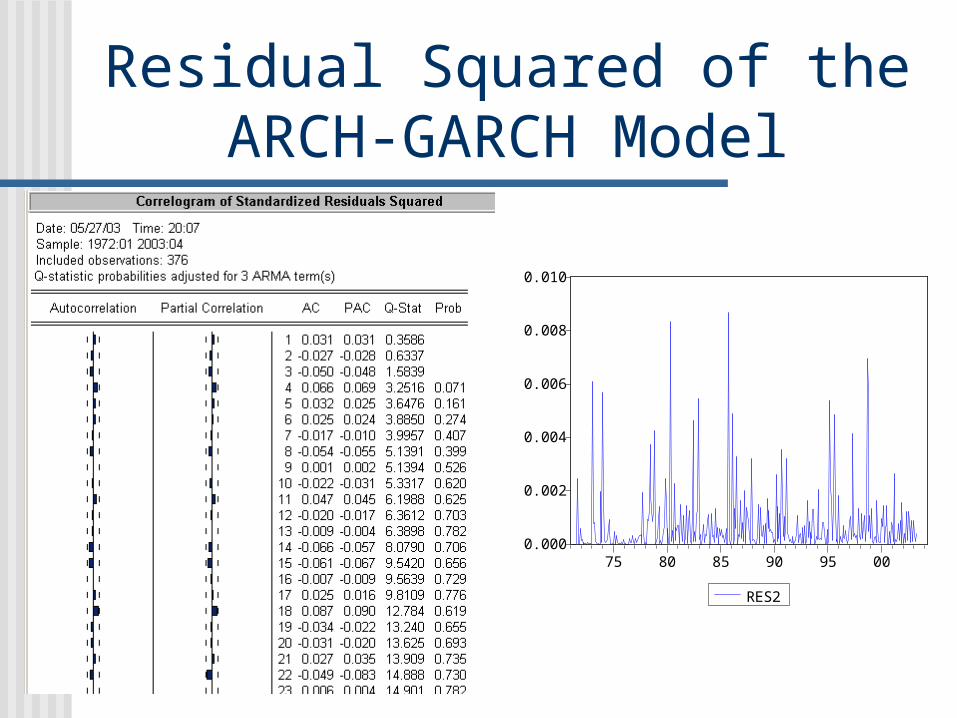
Residual Squared of the ARCH-GARCH Model
0.000
0.002
0.004
0.006
0.008
0.010
75 80 85 90 95 00
RES2
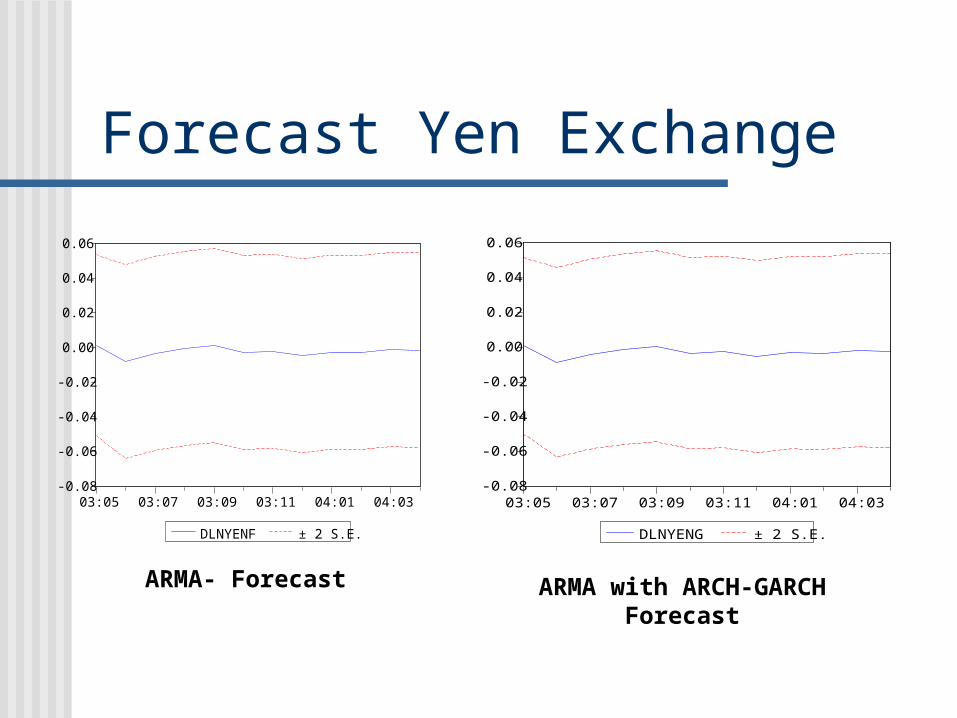
Forecast Yen Exchange
-0.08
-0.06
-0.04
-0.02
0.00
0.02
0.04
0.06
03:05 03:07 03:09 03:11 04:01 04:03
DLNYENF ± 2 S.E.
-0.08
-0.06
-0.04
-0.02
0.00
0.02
0.04
0.06
03:05 03:07 03:09 03:11 04:01 04:03
DLNYENG ± 2 S.E.
0.00064
0.00065
0.00066
0.00067
0.00068
03:05 03:07 03:09 03:11 04:01 04:03
Forecast of Variance
ARMA- Forecast ARMA with ARCH-GARCH Forecast
Conclusion Our model forecasts a relatively flat
fractional change in the ¥/$ over the next twelve months.
We have more confidence in our second model because the ARCH-GARCH terms account for periods of high variance.

Questions?