YEMEN MONTHLY MARKET WATCH - World Food...
6
YEMEN MONTHLY MARKET WATCH MAY 2014 For any comments/enquiries please contact [email protected] or [email protected] Page 1 of 6 Highlights The overall market monitoring information in May 2014 indicates that with the exception of areas directly affected by conflict, the supply of essential food commodities has been normal in most markets. However, fuel shortages have resulted in an increase in the costs of transportation which have, in turn, caused a sharp increase in the prices of staple foods. As household purchasing power weakened during the reporting month, the food security situation of poor households, who mainly depend on food purchases, has deteriorated and may continue to do so in the coming months if supplies of fuel do not return to normal. In April 2014, the general inflation rate was 7.41 percent while the food inflation was 4.46 percent. The general Consumer Price Index (CPI) during the same month was reported at 179.96 while the food CPI was 170.28 and that of cereals stood at 152.58. During the reporting period, the average domestic wholesale prices of wheat and wheat flour have increased by 3.2 percent and 3.8 percent, respectively. Notwithstanding these price rises, the wholesale prices of wheat and wheat flour have been relatively stable since August 2013. Between April and May 2014, the average retail prices of wheat and wheat flour rose by 7 percent and 8 percent, respectively. The rise in the retail prices of was mainly due to overall increases in transportation costs and in some parts of the country, due to deteriorating security. In May 2014, the supply of food commodities continued to be normal in most parts of the country, though the flow of commodities was disrupted in some areas due to local conflicts. The average TOT between the daily unskilled labour wage rate and the retail price of wheat flour was 17.92Kg/day in May 2014 – a fall of 16 percent compared with April 2014, but 14 percent higher than that in May 2013. During the month of reporting, the average TOT between a sheep and wheat flour was 256Kg/sheep – a fall of 7 percent compared with the previous month, but 11 percent higher than that reported in May last year. The FAO Food Price Index averaged 207.8 points in May 2014 which was down by 1.2 percent from April and 3.2 percent down from May 2013. The Cereal Price Index averaged 204.4 points in May 2014, fell by 1.2 percent from April and 13 percent below its value in May 2013. International wheat prices have increased by 3 percent between April and May 2014, and are higher than the prices recorded in May last year – up by 5 percent. A. Inflation and Consumer Price Index (CPI) 1 The general inflation rate in Yemen declined from 7.56 in March 2014 to 7.41 in April 2014 – based on a 12 month moving average. The inflation rate for food also fell - from 4.83 percent in March 2014 to 4.46 in April 2014. In April 2014, the general Consumer Price Index (CPI) was 179.96 while the Food CPI was 170.28 and that of breads and cereals stood at 152.58 (Figure 1). The general CPI was 179.17 in March 2014 while that of Food CPI during the same month was 169.30. The annual inflation rates for most of the non-staple food items showed mixed movements between March and April 2014. The inflation rates in April 2014 ranged from 0.51 percent for spices to 10.36 percent for fish. 1 The CPI is a measure of the average change in the prices of consumer items over time compared with a base year — goods and services that people buy for day-to-day living. The CSO of Yemen uses the 2005/06 Household Budget Survey as a base year. Inflation is the percentage change of the CPI over the period of 12 months – percentage changes in the CPI during current month compared with the same month last year. Figure 1: Trends in Consumer Price Index Source: CSO of Yemen (information released by CSO usually lags by one month)
Transcript of YEMEN MONTHLY MARKET WATCH - World Food...

YEMEN MONTHLY MARKET WATCH MAY 2014
For any comments/enquiries please contact [email protected] or [email protected] Page 1 of 6
Highlights
The overall market monitoring information in May 2014 indicates that with the exception of areas
directly affected by conflict, the supply of essential food commodities has been normal in most
markets. However, fuel shortages have resulted in an increase in the costs of transportation which
have, in turn, caused a sharp increase in the prices of staple foods. As household purchasing power
weakened during the reporting month, the food security situation of poor households, who mainly
depend on food purchases, has deteriorated and may continue to do so in the coming months if
supplies of fuel do not return to normal.
In April 2014, the general inflation rate was 7.41 percent while the food inflation was 4.46 percent.
The general Consumer Price Index (CPI) during the same month was reported at 179.96 while the
food CPI was 170.28 and that of cereals stood at 152.58.
During the reporting period, the average domestic wholesale prices of wheat and wheat flour have
increased by 3.2 percent and 3.8 percent, respectively. Notwithstanding these price rises, the
wholesale prices of wheat and wheat flour have been relatively stable since August 2013.
Between April and May 2014, the average retail prices of wheat and wheat flour rose by 7 percent
and 8 percent, respectively. The rise in the retail prices of was mainly due to overall increases in
transportation costs and in some parts of the country, due to deteriorating security.
In May 2014, the supply of food commodities continued to be normal in most parts of the country,
though the flow of commodities was disrupted in some areas due to local conflicts.
The average TOT between the daily unskilled labour wage rate and the retail price of wheat flour
was 17.92Kg/day in May 2014 – a fall of 16 percent compared with April 2014, but 14 percent higher
than that in May 2013.
During the month of reporting, the average TOT between a sheep and wheat flour was 256Kg/sheep
– a fall of 7 percent compared with the previous month, but 11 percent higher than that reported in
May last year.
The FAO Food Price Index averaged 207.8 points in May 2014 which was down by 1.2 percent from
April and 3.2 percent down from May 2013. The Cereal Price Index averaged 204.4 points in May
2014, fell by 1.2 percent from April and 13 percent below its value in May 2013.
International wheat prices have increased by 3 percent between April and May 2014, and are higher
than the prices recorded in May last year – up by 5 percent.
A. Inflation and Consumer Price Index (CPI)1
The general inflation rate in Yemen declined from 7.56 in March 2014 to 7.41 in April 2014 – based on
a 12 month moving average. The inflation rate for food also fell - from 4.83 percent in March 2014 to
4.46 in April 2014.
In April 2014, the general Consumer Price Index
(CPI) was 179.96 while the Food CPI was 170.28
and that of breads and cereals stood at 152.58
(Figure 1). The general CPI was 179.17 in March
2014 while that of Food CPI during the same month
was 169.30. The annual inflation rates for most of
the non-staple food items showed mixed
movements between March and April 2014. The
inflation rates in April 2014 ranged from 0.51
percent for spices to 10.36 percent for fish.
1 The CPI is a measure of the average change in the prices of consumer items over time compared with a base year — goods and services that people
buy for day-to-day living. The CSO of Yemen uses the 2005/06 Household Budget Survey as a base year. Inflation is the percentage change of the
CPI over the period of 12 months – percentage changes in the CPI during current month compared with the same month last year.
Figure 1: Trends in Consumer Price Index
Source: CSO of Yemen (information released by CSO usually lags by one month)

YEMEN MONTHLY MARKET WATCH MAY 2014
For any comments/enquiries please contact [email protected] or [email protected] Page 2 of 6
B. Wholesale Prices of Wheat and Wheat Flour
During the month of reporting, the average wholesale price of 50Kg wheat grain was 4,850YR while that
of wheat flour was 5,500YR. Between April and May 2014, the average domestic nominal2 wholesale
prices of both wheat and wheat flour increased by 3.2 percent and 3.8 percent, respectively. The
wholesale prices of wheat and wheat flour have been relatively stable since August 2013 (Figure 2 and Figure 3).
The wholesale prices of most of the other food and non-food commodities have generally remained
unchanged between April and May 2014, though prices of cooking oil increased by 2 percent and that
of rice and sugar by about 0.5 percent. However, wholesale prices of most of the food commodities are
expected to rise further during the month of June due to increased transportation costs caused by the
shortages of fuel and higher demand by consumers in preparation for Ramadan.
C. Retail Prices of Wheat and Wheat Flour
In May 2014, the average nominal retail prices of wheat and wheat flour were 128YR/Kg and 144YR/Kg,
respectively. Between April and May 2014, the average retail prices of wheat and wheat flour increased
by 7 percent and 8 percent, respectively (Figures 4 and 5). The rise in the retail prices of both wheat
and wheat flour have mainly been due to increases in transportation costs and in some parts of the
country, due to deteriorating security.
Looking at the pattern of retail prices of wheat and wheat flour across the main markets during the
month of reporting, the highest price of wheat was 130YR/Kg which was reported from Sana’a, Hajja,
Aden and Sa’ada. The lowest price was recorded in Amran market (120YR/Kg). On the other hand,
Sa’ada and Hajja markets had the highest price for wheat flour (150YR/Kg) while Sana’a, Aden and
Amran reported the lowest price (140YR/Kg). (See Table 1 for more details).
2 Nominal prices denote the current monetary value of a good or service i.e. as seen or actually observed by the monitor in the field, in a shop or at
a market stall. Real prices are prices adjusted for inflation using a consumer price index of the corresponding year. The process of adjusting for
inflation is called deflating by a price index in order to determine the real value of some monetary magnitude in reference to a “base period”.
Figure 4: Trends of wheat retail prices (YR/Kg)
Source: WFP sub offices
Figure 5: Trends of wheat flour retail prices (YR/Kg)
Source: WFP sub offices
Figure 3: National average wholesale wheat flour prices (YR/50kg)
Source: Ministry of Industry and Trade of Yemen
Figure 2: National average wholesale wheat prices (YR/50kg)
Source: Ministry of Industry and Trade of Yemen
YEMEN MONTHLY MARKET WATCH MAY 2014
For any comments/enquiries please contact [email protected] or [email protected] Page 3 of 6
D. Food Supply to Markets
During the month of reporting, the supply of essential food commodities has continued to be normal in
most parts of the country. However, the flow of food commodities was disrupted in several parts of the
country due to localized conflicts, which had a negative impact on food availability. Nonetheless, the
volume of imported wheat was enough to cover the consumption requirement of the country and the
supply is expected to remain unchanged in the coming months.
E. Terms of Trade (TOT)3
The TOT are proxy indicators of the purchasing power of households which rely on livestock and/or
casual labour as their main source of income for the purchase of cereals from the market. TOT are
important components of food security analysis. Changes in the terms of trade between wages/livestock
and staple food commodities are indicative of the trends in purchasing power and the impact on the
food security situation of households which are dependent on food purchases through income from daily
wage labour and/or the sale of livestock.
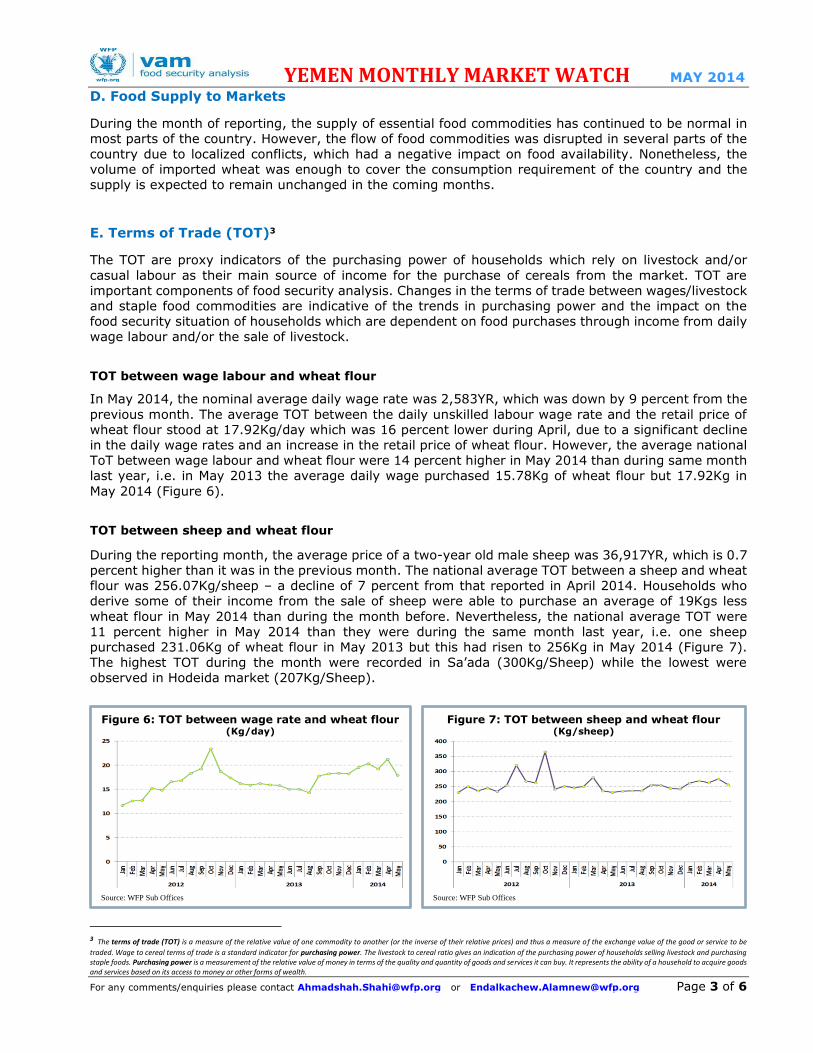
TOT between wage labour and wheat flour
In May 2014, the nominal average daily wage rate was 2,583YR, which was down by 9 percent from the
previous month. The average TOT between the daily unskilled labour wage rate and the retail price of
wheat flour stood at 17.92Kg/day which was 16 percent lower during April, due to a significant decline
in the daily wage rates and an increase in the retail price of wheat flour. However, the average national
ToT between wage labour and wheat flour were 14 percent higher in May 2014 than during same month
last year, i.e. in May 2013 the average daily wage purchased 15.78Kg of wheat flour but 17.92Kg in
May 2014 (Figure 6).
TOT between sheep and wheat flour
During the reporting month, the average price of a two-year old male sheep was 36,917YR, which is 0.7
percent higher than it was in the previous month. The national average TOT between a sheep and wheat
flour was 256.07Kg/sheep – a decline of 7 percent from that reported in April 2014. Households who
derive some of their income from the sale of sheep were able to purchase an average of 19Kgs less
wheat flour in May 2014 than during the month before. Nevertheless, the national average TOT were
11 percent higher in May 2014 than they were during the same month last year, i.e. one sheep
purchased 231.06Kg of wheat flour in May 2013 but this had risen to 256Kg in May 2014 (Figure 7).
The highest TOT during the month were recorded in Sa’ada (300Kg/Sheep) while the lowest were
observed in Hodeida market (207Kg/Sheep).
3 The terms of trade (TOT) is a measure of the relative value of one commodity to another (or the inverse of their relative prices) and thus a measure of the exchange value of the good or service to be
traded. Wage to cereal terms of trade is a standard indicator for purchasing power. The livestock to cereal ratio gives an indication of the purchasing power of households selling livestock and purchasing staple foods. Purchasing power is a measurement of the relative value of money in terms of the quality and quantity of goods and services it can buy. It represents the ability of a household to acquire goods and services based on its access to money or other forms of wealth.
Figure 6: TOT between wage rate and wheat flour (Kg/day)
Source: WFP Sub Offices
Figure 7: TOT between sheep and wheat flour (Kg/sheep)
Source: WFP Sub Offices

YEMEN MONTHLY MARKET WATCH MAY 2014
For any comments/enquiries please contact [email protected] or [email protected] Page 4 of 6
F. Global Food Prices
The FAO Food Price Index averaged 207.8 points in May 2014, down 2.5 points (or 1.2 percent) from
April and nearly 7 points, or 3.2
percent, below May 2013 (Figure
8). After rising to a ten-month high
of 213 points in March, the Index
fell in April and again in May,
pressured by lower dairy, cereal
and vegetable oil prices. However,
sugar made strong gains in May, while meat remained firm.
The FAO Cereal Price Index
averaged 204.4 points in May,
down 2.4 points (or 1.2 percent)
from April and 30 points (or 13
percent) below last year (Figure 8).
The decline in May was mostly
triggered by maize prices, which
fell in response to favourable growing conditions and good supply prospects in 2014/15. Rice prices
were little changed.
International wheat prices have slightly increased by 3 percent between April and May 2014, and are
higher than the prices recorded during the
same month last year – increased by 5
percent (Figure 9). The rise in the
international wheat prices during the
month of reporting may result in price
increases in domestic markets as these are
gradually passed along the supply chain,
although it may take 2-3 months before
the increase is reflected at the retail level.
Historically, the rate of transmission of
international prices to the domestic
markets in Yemen averages only 20
percent4.
The overall market monitoring information in May 2014 indicates that the supply of essential food
commodities generally continued to be
normal in most markets except those
directly affected by conflict. Both
wholesale and retail food prices have risen
due to an increase in transport costs
arising from fuel shortages. Given the
consequent weakening in household
purchasing power during May and the fall
in the ToT for those who depend on wage
labour or the sale of livestock, it can be
expected that the food security situation of
poor households has deteriorated and will
continue to do so in the coming months
unless fuel supplies stabilize and local conflicts are resolved.
4 Source: WFP Yemen Market Study conducted in 2010 and could be accessed at the link: http://www.wfp.org/content/yemen-market-study-december-2010.
Figure 9: Trend in global wheat prices (USD/MT)
Data Source: http://www.indexmundi.com/commodities/?commodity=wheat
Figure 8: Trends of food and cereals price indices
Data Source: http://www.fao.org/worldfoodsituation/wfs-home/foodpricesindex/en/
YEMEN MONTHLY MARKET WATCH MAY 2014
For any comments/enquiries please contact [email protected] or [email protected] Page 5 of 6
G. Food security outlook in anticipation of potential impact of increasing fuel prices Although many Yemenis work in the agricultural sector, very few rely on their own household production
for their household food needs and for over 90% the primary source of household food requirements is
through market purchase. Furthermore, over 90% of wheat and other staples required for national
consumption are imported. Yemeni household food security is therefore directly linked to the
international prices of staple food commodities, the international price of fuel (which determines milling
and transport costs) and the free movement of vehicle transport to markets throughout Yemen.
At present the Government subsidises fuel prices. Unfortunately, current foreign exchange revenues do
not cover all foreign exchange requirements and it is expected that in order to reduce the pressure on
Government revenues, the Government will reduce the current subsidy on fuel prices. By how much and
when remains unknown. In the mean time, shortages of fuel have developed in the market and long
queues have developed at filling stations. It is reported that in some places the prices of fuel on the
black market are several times higher than the current official prices. This has pushed up the cost of
transport which led to an increase in the prices of staple commodities in May (as reported in this bulletin)
and unconfirmed reports indicate that prices in all regions continued to rise during June. A market
survey carried out by Oxfam during June 2014 found that since the fuel crisis hit the western coastal
governorate of Al Hodeidah the price of wheat flour had increased by an average of 49 per cent and the
price of vegetables by 100 per cent in some rural areas.
The increase in transport costs has been exacerbated by other factors including the following (i) conflict,
poor security and social unrest in some areas is forcing transporters and traders to take detours and
incur higher than normal risks in order need to reach some markets; (ii) in June, shortages of fuel
available to the flour mills resulted in lower than normal production levels as Ramadan approached – a
time when demand in markets is typically higher than normal and prices reach short-term seasonal
peaks; and (iii) a rising trend in international wheat prices.
Although it is very difficult to predict how the prices of food commodities may evolve or estimate the
magnitude of the impact of the government’s planned changes in the level of fuel subsidy, the 2011 fuel
crisis experience and its impact on food prices and food security of the population at that time can
provide some indication of what may be expected to happen. We can expect the impact to vary across
governorates and for food prices to be typically very high in the short-term during the period of
uncertainty and then stabilise at lower levels when fuel supplies also stabilise and after local conflicts
have been resolved. Those areas close to ports will probably be less effected and rural areas are likely
to be more affected than urban areas – fuel prices in rural areas are normally about 15% higher than
urban.
Based on the current international food commodity price forecast and assuming that the fuel
subsidy is completely removed (consequent price rise from $USD50cents per litre to US$1
per litre) we can expect that the prices of essential food commodities will increase by
between 10% and 20% depending on the distance and accessibility of market locations. This
will result in a significant deterioration in the food security situation in the country. More
specifically, it is estimated that some 4% of the population who are currently moderately
food insecure (with food consumption score of 28.1 to 30) and who are currently on the edge
of severe food insecurity – over a million people – will probably be at a high risk of falling
into the severe food insecure category.
Moreover, most of the already severely food insecure households will become more destitute and likely
to intensify their consumption related negative coping mechanisms. Findings from Oxfam’s rapid
assessment of the impact of escalating food prices in rural parts of Al Hodeidah and Hajjah in May 2014
found 40 percent of the families using destructive coping strategies such as skipping meals on a daily
basis.
The prices presented in this report do not reflect the most recent situation and WFP is currently compiling
the price information for June 2014. Preliminary June price data from the field reveals continuing increases of food prices in all regions. The June Market Watch Report will be released around mid-July
capturing the most recent price changes and market conditions and will provide a more comprehensive
overview of the situation.

YEMEN MONTHLY MARKET WATCH MAY 2014
For any comments/enquiries please contact [email protected] or [email protected] Page 6 of 6
Important Remark: The market price data contained in the report should be interpreted with caution as they do not capture the impacts
of long term trends in food prices. This approach does not measure or indicate the severity of the likely impact that changes may have on
different households due to different income and food basket variations by wealth, by livelihood groups and households’ capacities to
cope with changes.