YEMEN Market Watch Report -...
8
YEMEN Market Watch Report Issue No. 16 August 2017 ________________________________________________________________________________ 1 Yemen IPC March 2017, TFPM Reports, SWF Reports, WFP Reports, YHRP 2017, and other partners’ reports. Highlights Supply and availability of food commodities further improved in many governorates in August 2017. Better food availability during the past few months is attributed to the good level of imports during the first half of the year. However, availability of fuel remained unchanged or deteriorated from previous month. Prices of basic food items slightly declined but prices of fuel commodities rose in August compared to July 2017, while all persisted to be higher than in pre- crisis period. The cost of the minimum food basket marginally declined in August 2017 compared to July, but 30% higher than it was before the crisis. According to Alert for Price Spikes (ALPS) indicators for August 2017 compared with seasonal trends, wheat flour and sugar remained at alert and crisis status, respectfully, while vegetable oil deteriorated to stress level, and red beans returned to normal. The ALPS indicator for the cost of the minimum food basket marginally went down to alert level. Despite the slight improvements in the availability of essential food commodities with stabilizing prices, millions of poor Yemeni households continue to suffer from lack of economic capacity to buy their minimum food needs. _______________________________________________________________ Contacts Stephen Anderson Country Director [email protected] Endalkachew Alamnew Vulnerability Analysis and Mapping Officer [email protected] Macroeconomic Situaon Yemen, the poorest Arab naon in the middle-east region, connues to suffer from the largest humanitarian emergency situaon due to the prolonged war, widespread cholera outbreak and severe food insecurity. The conflict which connued for nearly two and half years, has led to massive destrucon of essenal infrastructures, huge disrupon of livelihoods and basic socio-economic services including health, educaon, electricity, and water systems. Consequently, millions of Yemeni households are devastated by the multude impacts of the crisis. Over two million IDPs and nearly a million returnees connue to live in hardships, the majority requires humanitarian assistance. Irregularies and disrupon of salaries for government employees persistently distress a quarter of the country’s populaon. Over 1.5 million poorest households connued to suffer from the suspension of the Social Welfare Fund assistance they used to get before the crisis 1 . The dire humanitarian situaon is further worsened by the rapid depreciaon of Yemeni Riyal. August 2017 saw the record highest depreciaon, the worst ever recorded, rapidly eroding the purchasing power of poor Yemenis (Chart 1). Chart 1: Trends in Yemen Exchange Rate (YER/USD): Jan-2015 to Aug-2017 Sources: MoPIC reports, WFP market monitoring, and other Partners’ market informaon.
Transcript of YEMEN Market Watch Report -...
YEMEN Market Watch Report Issue No. 16 August 2017
________________________________________________________________________________
1Yemen IPC March 2017, TFPM Reports, SWF Reports, WFP Reports, YHRP 2017, and other partners’ reports.
Highlights
Supply and availability of food
commodities further improved in
many governorates in August
2017. Better food availability
during the past few months is
attributed to the good level of
imports during the first half of the
year. However, availability of fuel
remained unchanged or
deteriorated from previous month.
Prices of basic food items slightly
declined but prices of fuel
commodities rose in August
compared to July 2017, while all
persisted to be higher than in pre-
crisis period.
The cost of the minimum food
basket marginally declined in
August 2017 compared to July, but
30% higher than it was before the
crisis.
According to Alert for Price Spikes
(ALPS) indicators for August 2017
compared with seasonal trends,
wheat flour and sugar remained at
alert and crisis status, respectfully,
while vegetable oil deteriorated to
stress level, and red beans
returned to normal. The ALPS
indicator for the cost of the
minimum food basket marginally
went down to alert level.
Despite the slight improvements in
the availability of essential food
commodities with stabilizing
prices, millions of poor Yemeni
households continue to suffer
from lack of economic capacity to
buy their minimum food needs.
_______________________________________________________________
Contacts
Stephen Anderson Country Director [email protected]
Endalkachew Alamnew Vulnerability Analysis and Mapping Officer [email protected]
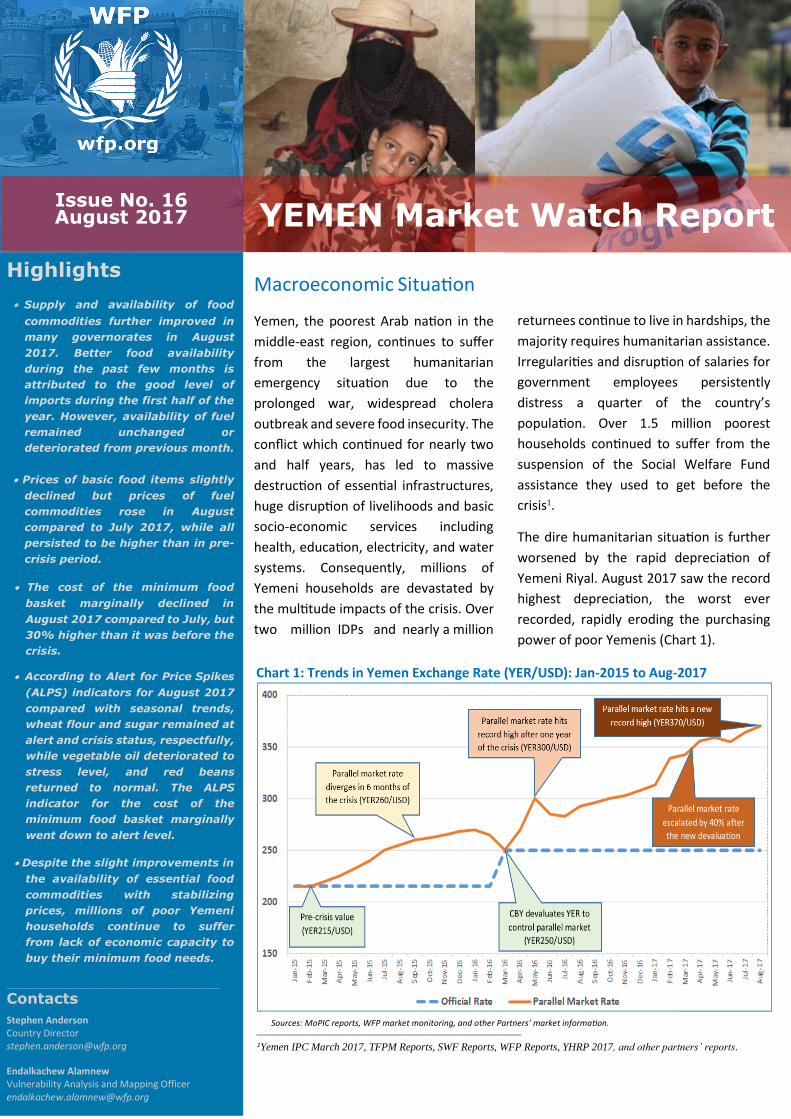
Macroeconomic Situation
Yemen, the poorest Arab nation in the
middle-east region, continues to suffer
from the largest humanitarian
emergency situation due to the
prolonged war, widespread cholera
outbreak and severe food insecurity. The
conflict which continued for nearly two
and half years, has led to massive
destruction of essential infrastructures,
huge disruption of livelihoods and basic
socio-economic services including
health, education, electricity, and water
systems. Consequently, millions of
Yemeni households are devastated by
the multitude impacts of the crisis. Over
two million IDPs and nearly a million
returnees continue to live in hardships, the
majority requires humanitarian assistance.
Irregularities and disruption of salaries for
government employees persistently
distress a quarter of the country’s
population. Over 1.5 million poorest
households continued to suffer from the
suspension of the Social Welfare Fund
assistance they used to get before the
crisis1.
The dire humanitarian situation is further
worsened by the rapid depreciation of
Yemeni Riyal. August 2017 saw the record
highest depreciation, the worst ever
recorded, rapidly eroding the purchasing
power of poor Yemenis (Chart 1).
Chart 1: Trends in Yemen Exchange Rate (YER/USD): Jan-2015 to Aug-2017
Sources: MoPIC reports, WFP market monitoring, and other Partners’ market information.
Yemen Market Watch Report Issue No. 16 August 2017 Page 2
Yem
en
Market
Watc
h R
ep
ort
Is
sue N
o.
4 A
ugust
2016
Chart 1: Price Trend of Main Food Commodities (YER/Unit)
Yem
en
Market
Watc
h R
ep
ort
Is
sue N
o.
4 A
ugust
2016
Yem
en
Market
Watc
h R
ep
ort
I
ssue N
o.
16 A
ugust
2017
National average prices of wheat flour,
sugar, vegetable oil and red beans in
August 2017 were 25%, 24%, 14% and
60% higher than those before the crisis,
respectively. Some governorates
including Taiz, Shabwa, Mareb, Al Jawf,
Hajja and Sa’ada where conflicts still
ongoing, continued to suffer from high
prices of goods. Prices in Soqatra also
rose significantly caused by poor supply
due to the rough waves on the sea
(Annex 2 & 3).
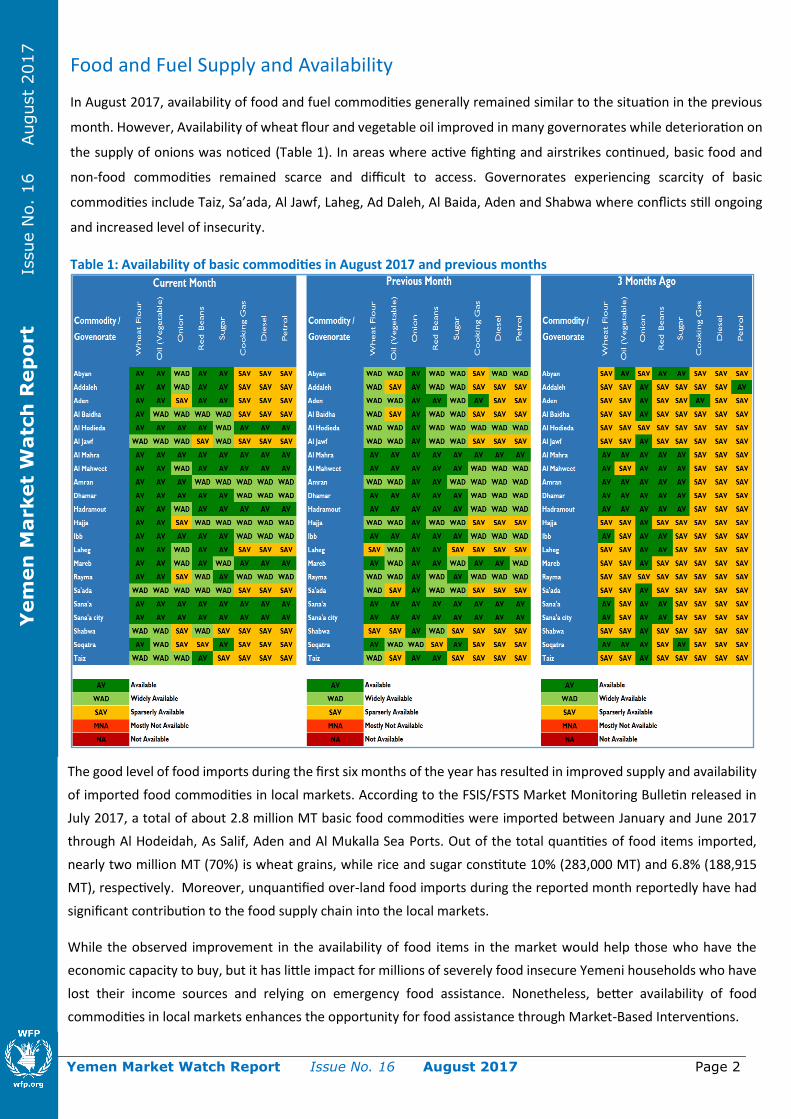
Food and Fuel Supply and Availability
In August 2017, availability of food and fuel commodities generally remained similar to the situation in the previous
month. However, Availability of wheat flour and vegetable oil improved in many governorates while deterioration on
the supply of onions was noticed (Table 1). In areas where active fighting and airstrikes continued, basic food and
non-food commodities remained scarce and difficult to access. Governorates experiencing scarcity of basic
commodities include Taiz, Sa’ada, Al Jawf, Laheg, Ad Daleh, Al Baida, Aden and Shabwa where conflicts still ongoing
and increased level of insecurity.
Table 1: Availability of basic commodities in August 2017 and previous months
The good level of food imports during the first six months of the year has resulted in improved supply and availability
of imported food commodities in local markets. According to the FSIS/FSTS Market Monitoring Bulletin released in
July 2017, a total of about 2.8 million MT basic food commodities were imported between January and June 2017
through Al Hodeidah, As Salif, Aden and Al Mukalla Sea Ports. Out of the total quantities of food items imported,
nearly two million MT (70%) is wheat grains, while rice and sugar constitute 10% (283,000 MT) and 6.8% (188,915
MT), respectively. Moreover, unquantified over-land food imports during the reported month reportedly have had
significant contribution to the food supply chain into the local markets.
While the observed improvement in the availability of food items in the market would help those who have the
economic capacity to buy, but it has little impact for millions of severely food insecure Yemeni households who have
lost their income sources and relying on emergency food assistance. Nonetheless, better availability of food
commodities in local markets enhances the opportunity for food assistance through Market-Based Interventions.
Yemen Market Watch Report Issue No. 16 August 2017 Page 3
Yem
en
Market
Watc
h R
ep
ort
I
ssue N
o.
16 A
ugust
2017
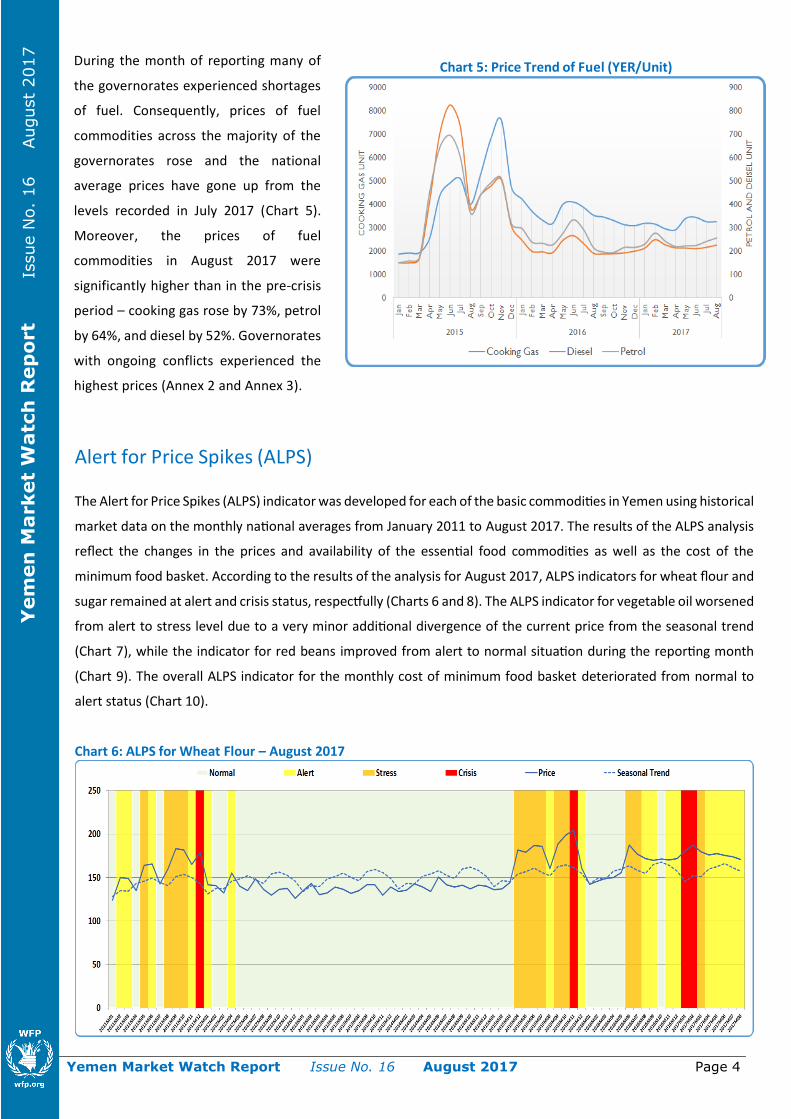
The average per capita cost of minimum food basket in August 2017 estimated at 3,066 YER which slightly
dropped from July (3,107 YER), but 30% higher than it was during the pre-crisis period (Chart 3). The
pattern of the cost of minimum food basket across governorates varies due to food prices variations
(Annex 2).
The minimum and maximum values of the cost of the minimum food basket are used to assess the level of market
integration among the various market locations across all the governorates. The bigger the difference between
the minimum and the maximum values, the lesser the market integration and vice versa. In August 2017, much
better integration of markets noticed compared to the past few months, as the result of the market data analysis
presented in Chart 4 below indicates a narrow difference between the minimum and maximum values of the cost
of the minimum food basket. The enhanced integration of markets could be due to lesser intensity of conflicts
and airstrikes in many parts of the country that improved movements of traders and commodities.
Chart 3: Cost of Minimum Food Basket (in YER/Person)
Chart 4: Min. vs. Max. Cost of Food Basket (in YER)
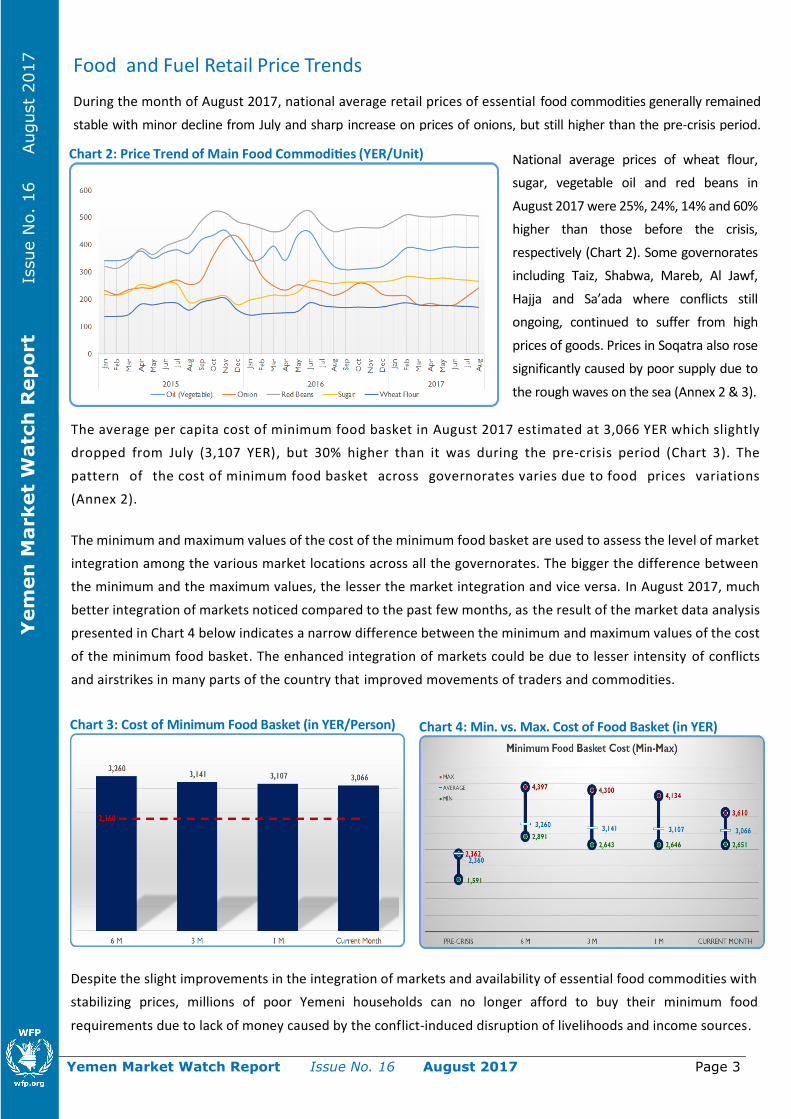
Food and Fuel Retail Price Trends
During the month of August 2017, national average retail prices of essential food commodities generally remained
stable with minor decline from July and sharp increase on prices of onions, but still higher than the pre-crisis period.
Price of wheat flour was 27% higher in Chart 2: Price Trend of Main Food Commodities (YER/Unit)
National average prices of wheat flour,
sugar, vegetable oil and red beans in
August 2017 were 25%, 24%, 14% and 60%
higher than those before the crisis,
respectively (Chart 2). Some governorates
including Taiz, Shabwa, Mareb, Al Jawf,
Hajja and Sa’ada where conflicts still
ongoing, continued to suffer from high
prices of goods. Prices in Soqatra also rose
significantly caused by poor supply due to
the rough waves on the sea (Annex 2 & 3).
Despite the slight improvements in the integration of markets and availability of essential food commodities with
stabilizing prices, millions of poor Yemeni households can no longer afford to buy their minimum food
requirements due to lack of money caused by the conflict-induced disruption of livelihoods and income sources.
Yemen Market Watch Report Issue No. 16 August 2017 Page 4
Yem
en
Market
Watc
h R
ep
ort
Issue N
o.
4 A
ugust
2016
Yem
en
Market
Watc
h R
ep
ort
Is
sue N
o.
16 A
ugust
2017
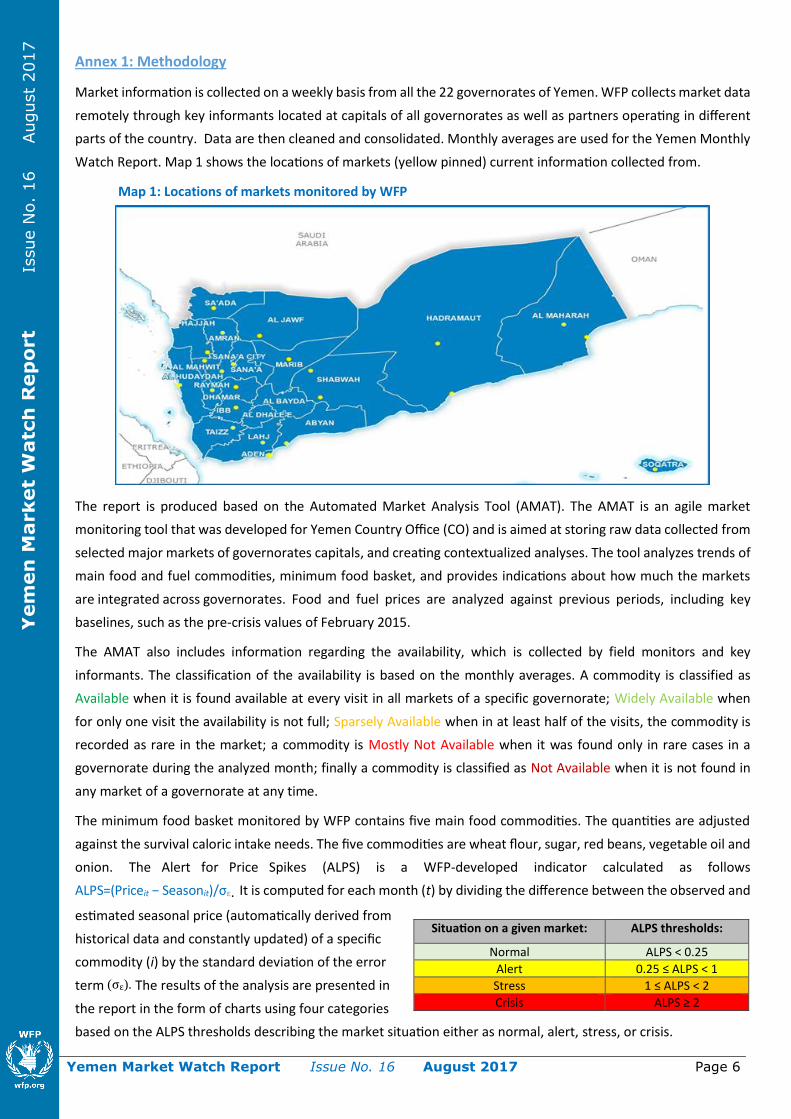
Alert for Price Spikes (ALPS)
The Alert for Price Spikes (ALPS) indicator was developed for each of the basic commodities in Yemen using historical
market data on the monthly national averages from January 2011 to August 2017. The results of the ALPS analysis
reflect the changes in the prices and availability of the essential food commodities as well as the cost of the
minimum food basket. According to the results of the analysis for August 2017, ALPS indicators for wheat flour and
sugar remained at alert and crisis status, respectfully (Charts 6 and 8). The ALPS indicator for vegetable oil worsened
from alert to stress level due to a very minor additional divergence of the current price from the seasonal trend
(Chart 7), while the indicator for red beans improved from alert to normal situation during the reporting month
(Chart 9). The overall ALPS indicator for the monthly cost of minimum food basket deteriorated from normal to
alert status (Chart 10).
Chart 6: ALPS for Wheat Flour – August 2017
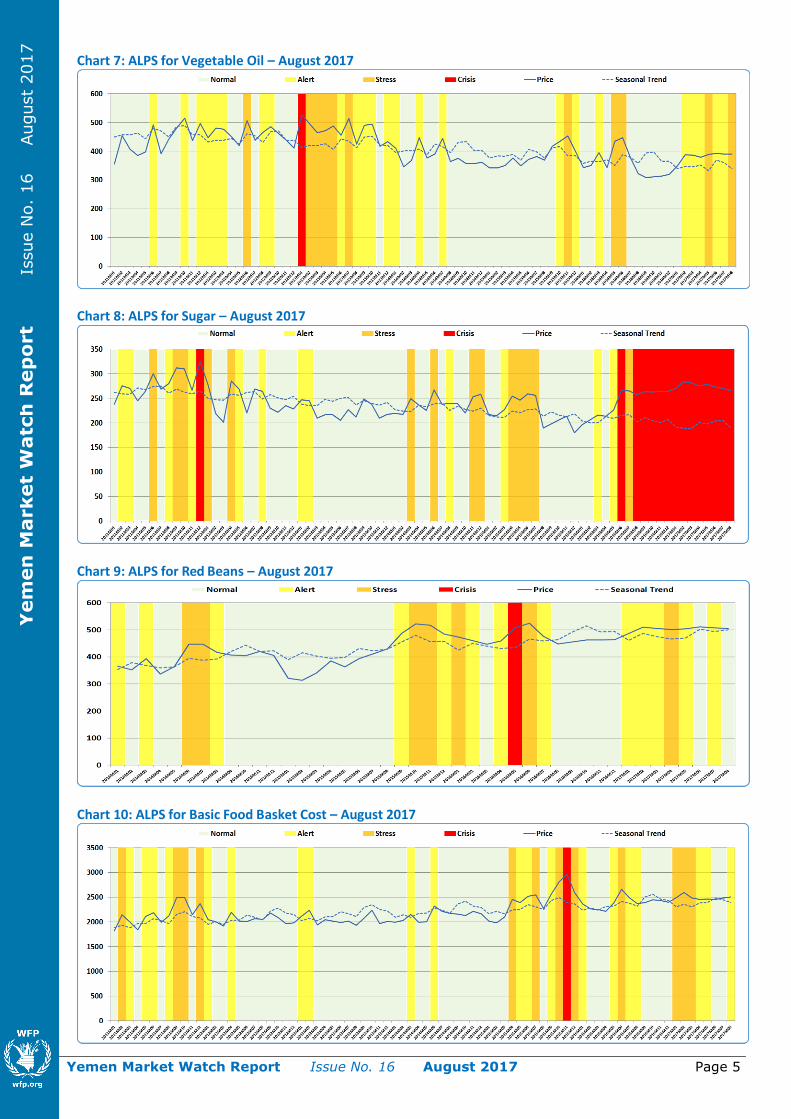
During the month of reporting many of
the governorates experienced shortages
of fuel. Consequently, prices of fuel
commodities across the majority of the
governorates rose and the national
average prices have gone up from the
levels recorded in July 2017 (Chart 5).
Moreover, the prices of fuel
commodities in August 2017 were
significantly higher than in the pre-crisis
period – cooking gas rose by 73%, petrol
by 64%, and diesel by 52%. Governorates
with ongoing conflicts experienced the
highest prices (Annex 2 and Annex 3).
Chart 5: Price Trend of Fuel (YER/Unit)
Yemen Market Watch Report Issue No. 16 August 2017 Page 5
Yem
en
Market
Watc
h R
ep
ort
Is
sue N
o.
4 A
ugust
2016
Yem
en
Market
Watc
h R
ep
ort
I
ssue N
o.
16 A
ugust
2017
Chart 7: ALPS for Vegetable Oil – August 2017
Chart 8: ALPS for Sugar – August 2017
Chart 9: ALPS for Red Beans – August 2017
Chart 10: ALPS for Basic Food Basket Cost – August 2017
Yemen Market Watch Report Issue No. 16 August 2017 Page 6
Yem
en
Market
Watc
h R
ep
ort
Is
sue N
o.
4 A
ugust
2016
Annex 1: Methodology
Market information is collected on a weekly basis from all the 22 governorates of Yemen. WFP collects market data
remotely through key informants located at capitals of all governorates as well as partners operating in different
parts of the country. Data are then cleaned and consolidated. Monthly averages are used for the Yemen Monthly
Watch Report. Map 1 shows the locations of markets (yellow pinned) current information collected from.
Map 1: Locations of markets monitored by WFP
The report is produced based on the Automated Market Analysis Tool (AMAT). The AMAT is an agile market
monitoring tool that was developed for Yemen Country Office (CO) and is aimed at storing raw data collected from
selected major markets of governorates capitals, and creating contextualized analyses. The tool analyzes trends of
main food and fuel commodities, minimum food basket, and provides indications about how much the markets
are integrated across governorates. Food and fuel prices are analyzed against previous periods, including key
baselines, such as the pre-crisis values of February 2015.
The AMAT also includes information regarding the availability, which is collected by field monitors and key
informants. The classification of the availability is based on the monthly averages. A commodity is classified as
Available when it is found available at every visit in all markets of a specific governorate; Widely Available when
for only one visit the availability is not full; Sparsely Available when in at least half of the visits, the commodity is
recorded as rare in the market; a commodity is Mostly Not Available when it was found only in rare cases in a
governorate during the analyzed month; finally a commodity is classified as Not Available when it is not found in
any market of a governorate at any time.
The minimum food basket monitored by WFP contains five main food commodities. The quantities are adjusted
against the survival caloric intake needs. The five commodities are wheat flour, sugar, red beans, vegetable oil and
onion. The Alert for Price Spikes (ALPS) is a WFP-developed indicator calculated as follows
ALPS=(Priceit − Seasonit)/σε. It is computed for each month (t) by dividing the difference between the observed and
estimated seasonal price (automatically derived from
historical data and constantly updated) of a specific
commodity (i) by the standard deviation of the error
term (σε). The results of the analysis are presented in
the report in the form of charts using four categories
based on the ALPS thresholds describing the market situation either as normal, alert, stress, or crisis.
Situation on a given market: ALPS thresholds:
Normal ALPS < 0.25
Alert 0.25 ≤ ALPS < 1
Stress 1 ≤ ALPS < 2
Crisis ALPS ≥ 2
Yem
en
Market
Watc
h R
ep
ort
Issue N
o.
16 A
ugust
2017
Yemen Market Watch Report Issue No. 16 August 2017 Page 7
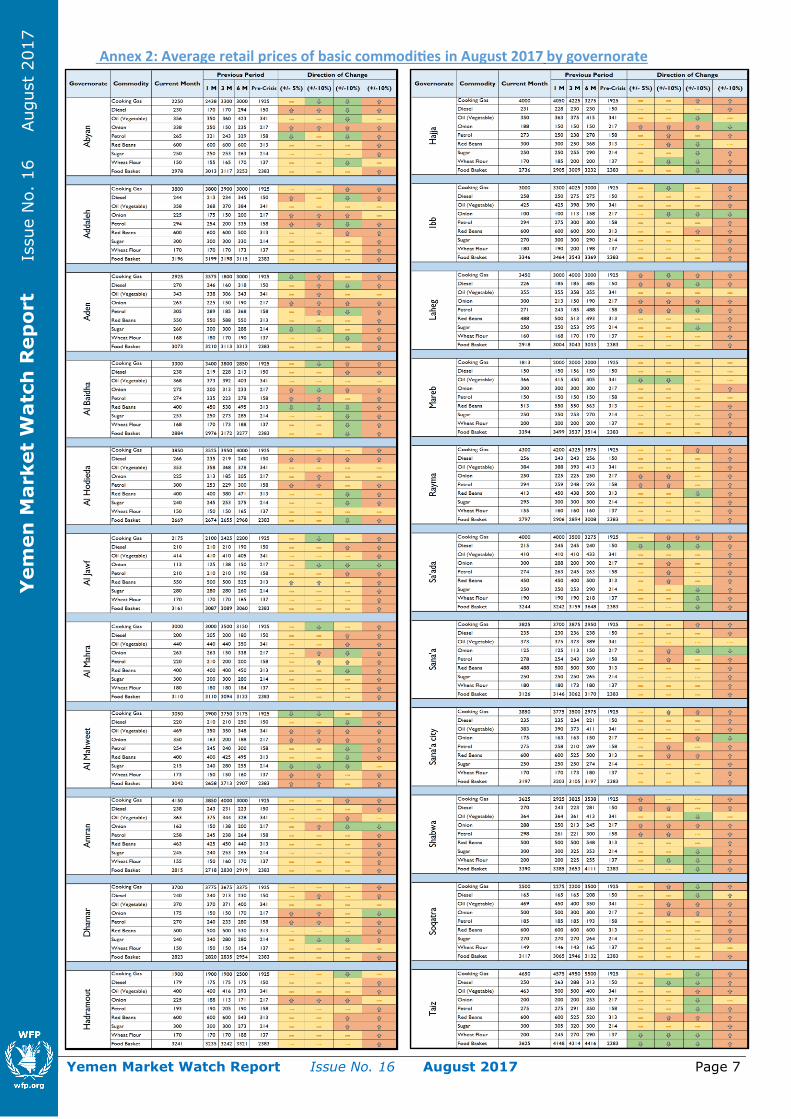
Annex 2: Average retail prices of basic commodities in August 2017 by governorate
Yem
en
Market
Watc
h R
ep
ort
Issue N
o.
16 A
ugust
2017
Yemen Market Watch Report Issue No. 16 August 2017 Page 8
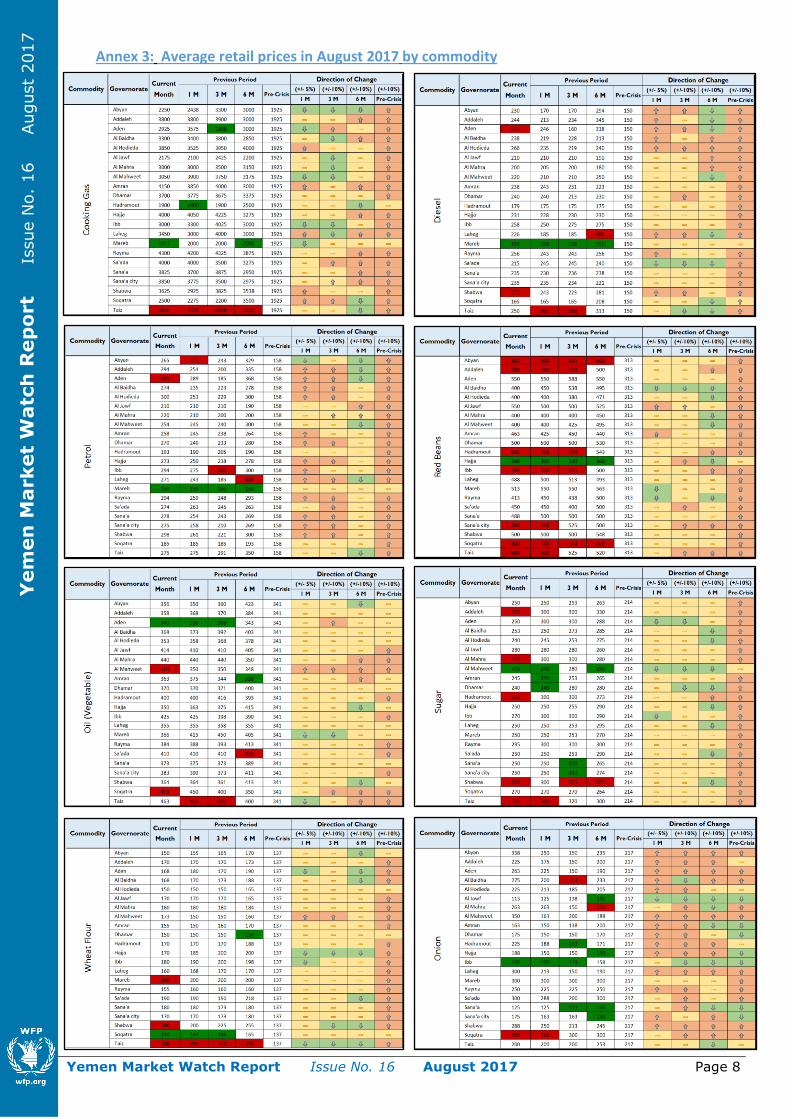
Annex 3: Average retail prices in August 2017 by commodity
Yem
en
Market
Watc
h R
ep
ort
Issue N
o.
9 J
anuary
2017
Yem
en
Market
Watc
h R
ep
ort
Issue N
o.
16 A
ugust
2017