YEARS OF SUCCESS
106
30 YEARS OF SUCCESS NU SKIN ANNUAL REPORT 2013
Transcript of YEARS OF SUCCESS

30 Y
EARS
OF
SUC
CES
SN
U S
KIN
AN
NU
AL
REPO
RT 2
013

“THERE IS POWER IN DREAMS, IN IMAGINATION AND IN THE COURAGE OF THOSE RESOLVED TO MAKE THEIR DREAMS A REALITY.” Truman Hunt

“THERE IS POWER IN DREAMS, IN IMAGINATION AND IN THE COURAGE OF THOSE RESOLVED TO MAKE THEIR DREAMS A REALITY.” Truman Hunt

ANNUAL REVENUE OF PAST SEVEN YEARSIN MILLIONS USD
EARNINGS PER SHARE GROWTH OF PAST SEVEN YEARS
30 YEARS OF SUCCESS—A FOUNDATION FOR SUSTAINED GROWTH
NU
SKIN A
NN
UA
L REPORT
20
13 Dear Shareholder,
As Nu Skin embarks on its thirtieth year, we continue to build on our solid foundation of success, which is anchored in our commitment to innovation, our sound business principles, and our mission to improve people’s lives. As we look ahead, we are fi rmly focused on realizing our long-term goal of becoming the world’s leading direct selling company. In 2013, we made great strides towards this goal, with each geographic region contributing to impressive results that included:• Record annual revenue of $3.177 billion—a 49 percent
improvement over 2012.• Record earnings per share of $5.94—a 69 percent increase
over the prior year.• Record profi tability with a 17.4 percent operating margin— up 145 basis points from 2012.• $530 million in cash from operations—up from $311 million in 2012.• Strong 41 percent growth in actives and 97 percent in sales leaders.• A record $71 million in dividends paid during the year.
In the Greater China region in 2013, we grew revenue by 148 percent to $1.36 billion as a result of strong revenue and sales force growth throughout the region, including signifi cant growth in Mainland China. In the North Asia region in 2013, we grew revenue by 11 percent to $869 million. We also generated solid year-over-year growth rates in other regions including 15 percent in the South Asia/Pacifi c region; 30 percent in the Americas; and 7 percent in the EMEA region.

$2.112010
$2.69**2011
$3.522012
$1.022008
$1.51*2009$0.84*
2007
* Excludes restructuring and impairment of assests and other.** Excludes impact of Japan customs case.
$5.942013
$1,5182010
$1,7202011
$2,1322012
$3,1772013
$1,3142009$1,248
2008$1,158
2007

Yet our success has not been without its challenges. In January 2014, a series of negative media stories in Mainland China resulted in government investigations into our operations in that market. Because Mainland China’s regulatory framework is unique, our business model in this market is di� erent from our other global markets. Early in the process, we elected to take proactive steps to cooperate with regulatory authorities and demonstrate our commitment to operating in compliance with the laws of Mainland China. These actions included the suspension of business promotional meetings and the acceptance of applications for new direct sellers and sales employees. While these actions had, and will have, a negative impact on 2014 results, on May 1, 2014, we began accepting applications and holding corporate-led business meetings again in Mainland China, and we are moving forward to build a foundation for healthy, long-term growth. As we look ahead, we plan to continue our record of success by: • Capitalizing on the strength of our ageLOC® anti-aging brand
through continued product innovation. • Supporting our sales network and consumer group through
channel innovation.• Leveraging our experienced management and global team of
sales leaders to help drive revenue in every geographic region.• Increasing shareholder value by utilizing our balance sheet and
cash fl ow.
PRODUCT INNOVATION Nu Skin has established a legacy of product innovation by delivering highly di� erentiated products that provide exceptional benefi ts to a global consumer base that is anxious to live young. When it comes to anti-aging, Nu Skin is uniquely positioned to provide comprehensive anti-aging solutions that help battle the e� ects of aging on the inside and outside of the body. To this end, Nu Skin o� ers a balanced portfolio of nutrition and personal care products. This strength, in what we believe are the two most important battle grounds against aging, uniquely positions Nu Skin as a market leader in existing and emerging product categories. In recent years, our product development e� orts have been focused on advancing the understanding of the sources that infl uence the aging process, including the science of gene expression. This research has shaped our product development process, allowing us to introduce a comprehensive line of anti-aging products that we have branded as ageLOC. Since launching the ageLOC brand in 2008, we have generated more than $3 billion in sales of ageLOC products, making it a key growth driver for our business.
NU
SKIN A
NN
UA
L REPORT
20
13

In 2013, we added a signifi cant new product system to our ageLOC anti-aging line-up, the ageLOC® TR90® weight management and body shaping system. Formulated with our exclusive anti-aging science, the proprietary TR90 system features four products and a comprehensive nutrition and lifestyle plan. While the initial introduction of the product system was extremely positive, our most recent research and usage results have indicated that there is a need for us to enhance the system by educating consumers on the benefi ts of maintaining lean muscle while reducing fat. Accordingly, we are making enhancements to the nutritional and lifestyle components of the system to help consumers better maximize their weight management and body shaping results. Overall, we believe that weight management and body composition represent a growing product category that has great potential. In terms of anti-aging skin treatments, the at-home skin care device category is relatively new and expanding at a rapid pace. According to a 2012 Kline & Company report, the market for at-home skin care devices has enjoyed signifi cant growth globally. The report points to even greater opportunities for growth in the at-home skin care device market in the future. Nu Skin has been able to gain signifi cant market share with its ageLOC® Galvanic Spa® o� ering in Asia and we continue to see great opportunities to capture additional
THE TR90® WEIGHT MANAGEMENT AND BODY SHAPING SYSTEM LIMITED-TIME OFFER (LTO) GENERATED APPROXIMATELY $550 MILLION IN SALES, MAKING IT THE LARGEST PRODUCT LAUNCHIN OUR COMPANY’S HISTORY.

market share with future product introductions. We’re also looking forward to introducing a new Nu Skin® Facial Spa unit to the U.S. market in the second half of the year. We remain optimistic about our product pipeline beyond 2014 and continue to make progress on two new product o� erings scheduled for launch in 2015. Thanks to our product development team, we enjoy a robust pipeline, which we believe allows us to introduce new and innovative products over the next several years.
CHANNEL INNOVATION Another way that Nu Skin innovates is through our product launch process. We have developed a systematic approach for introducing new products that is designed to align our sales leaders around a process that maximizes their e� ectiveness and productivity and generates strong consumer demand for our products. Since introducing our product launch process in 2009, we have made continual refi nements as we have gained new insights through our application of the process on a global and regional scale. We have developed a systematic marketing cycle where we o� er purchase windows, or limited-time o� ers (LTOs), before making products available on a full-time basis. In the early stages of the launch process, we provide our sales leaders with the training and messaging they can use to create product awareness and demand. Then, we typically execute global and regional LTOs, helping build even greater excitement within the sales network and helping generate signifi cant levels of awareness and product trial among our consumer group. We typically make the new products available on a full-time basis about three to six months following these LTOs. In 2013, we began a new product launch cycle with the limited-time global introduction of ageLOC® TR90® that generated approximately $550 million in sales, making it the largest product launch in our company’s history. The TR90 LTO also helped drive solid results in each of our regions. In 2014, we will continue to introduce the ageLOC TR90 system in the majority of our regions through regional LTO events. In addition, we are planning to introduce our highly successful ageLOC Tru Face®Essence Ultra product in Greater China in the summer of 2014. This daily use anti-aging skin care serum has been very successful outside of the Greater China region. We anticipate introducing the product through a Greater China LTO in the summer of 2014 with the TR90rollout coming later in the year. While this product launch process has added an impressive dynamic to our business, we continue to make
NU
SKIN A
NN
UA
L REPORT
20
13
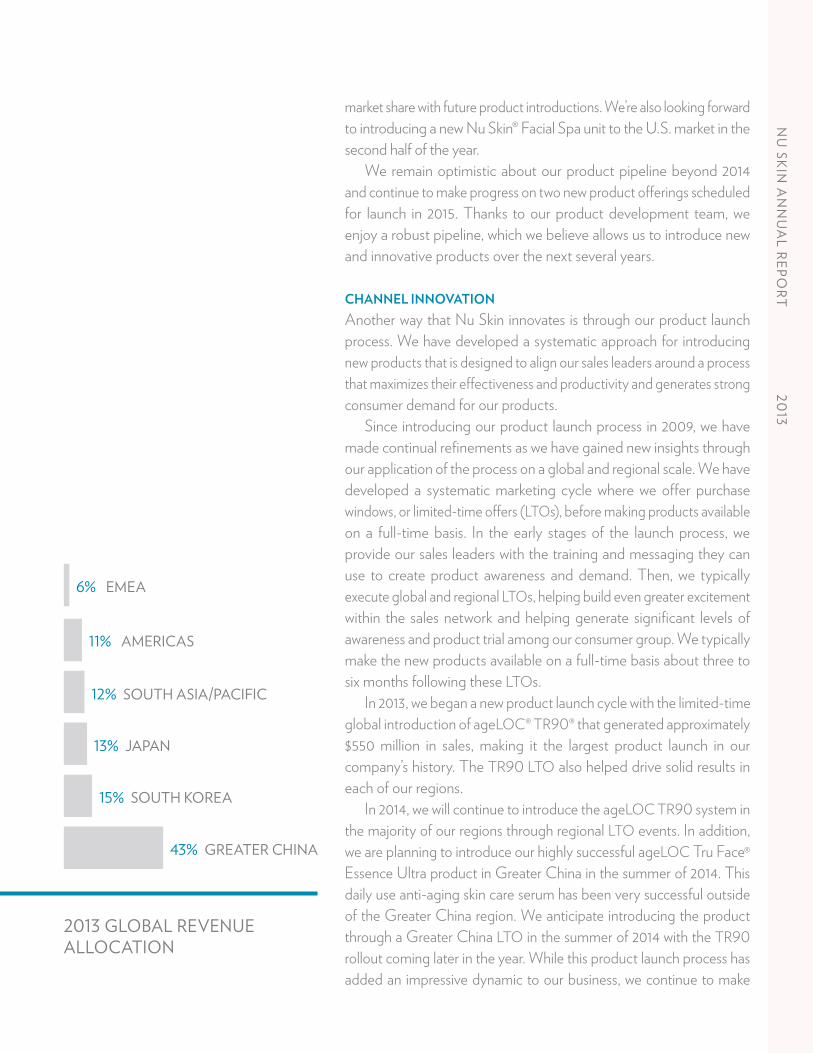
2013 GLOBAL REVENUE ALLOCATION
6% EMEA
11% AMERICAS
12% SOUTH ASIA/PACIFIC
15% SOUTH KOREA
43% GREATER CHINA
13% JAPAN

refi nements to maximize consumer demand and sales leader success. We continue to believe in the market potential for direct selling. For 30 years, Nu Skin has sold its products through this channel, a channel that utilizes person-to-person, word-of-mouth marketing to promote and sell products to consumers. According to the World Federation of Direct Selling Associations, the industry stood at nearly $167 billion in global revenue at the end of 2012, with nearly 90 million individuals involved in some form of direct selling. Demographic trends continue to bode well for us. People are living longer globally, and the two most common concerns people face continue to be health and fi nancial security.
FOR 30 YEARS, NU SKIN HAS SOLD ITS PRODUCTS THROUGH A DIRECT SELLING CHANNEL THAT UTILIZES PERSON-TO-PERSON, WORD-OF-MOUTH MARKETING TO PROMOTE AND SELL PRODUCTS TO CONSUMERS.

While direct selling is fl ourishing globally, growth rates are particularly robust in emerging markets. In some of these markets, to compete e� ectively we must adapt our product o� ering and business model to fi t local economic, regulatory, and social dynamics. For example, we have an 11-year operating history in Mainland China and continue to see tremendous potential. During that time we’ve invested a tremendous amount of resources in the market, and our product o� ering has enjoyed great success. For instance, our ageLOC® Galvanic Spa® has gained signifi cant market share within the home-use skin care treatment device category in the market. We continue to believe that the appetite for high quality anti-aging products is both large and robust. As Mainland China’s regulatory framework is unique, our business model in the market is di� erent than our global business model. We are committed to working cooperatively with the Chinese government to support full compliance with the regulation of direct selling. We are also committed to investing in this important market as demonstrated by the recent completion of our new Innovation Park and regional headquarters in Shanghai, as well as manufacturing facilities and other initiatives unique to Mainland China.
A STRONG GLOBAL SALES FORCE AND MANAGEMENT TEAMThroughout our history, we have infused innovation into everything we do. This e� ort has produced an environment that has attracted many of the best and the fi nest people in the business. We have a strong and seasoned group of sales leaders who understand what it takes to be successful and are committed to our mission of improving people’s lives. These people represent the fi nest leaders in the direct selling industry. They have been a driving force behind our 30 years of success and will continue to play that role in the future. Our sales leaders look to us to help them improve their lives and the lives of their sales teams and customers. We take our responsibility to our sales leaders seriously, and we work hand-in-hand with them to produce the kind of results that have made Nu Skin such a compelling success story for the past three decades.
NU SKIN 2.0 GOALS
$5 BILLION IN ANNUAL REVENUE
$2 BILLION IN COMMISSIONS AND SALES COMPENSATION
NU
SKIN A
NN
UA
L REPORT
20
13

INCREASING SHAREHOLDER VALUE BY INVESTING IN OUR FUTURE AND UTILIZING OUR BALANCE SHEET AND CASH FLOWWe are focused on rewarding our shareholders and have increased our dividend for the thirteenth straight year and purchased more than $141 million of our stock during the year. In 2013, we made signifi cant investments in advancing Nu Skin’s long-term growth prospects with the completion of the Nu Skin Innovation Center and campus expansion at our corporate headquarters. And this year, we recently opened a new Innovation Park in Shanghai that will serve as our regional headquarters for Greater China. These new facilities both include new product development labs that we believe will help us maintain the momentum of our product ideation and development, as well as the appeal of our earnings opportunity going forward. Together, they represent confi dence in our future and commitment to investing our resources to support our long-term growth potential. In our 30 years of operations, we have demonstrated a solid track record of success by exceeding aggressive business targets, providing highly innovative and di� erentiated products, attracting talented and dedicated sales people, and remaining focused on fi scal discipline and our mission to improve people’s lives. We deeply feel our responsibility to all those who put their trust in us. This is the company that has stood the test the time for 30 years, and we are optimistic that we will continue to move the company forward to an even brighter future.
Sincerely,
STEVEN J. LUND TRUMAN HUNTCHAIRMAN PRESIDENT, CEONU SKIN ENTERPRISES NU SKIN ENTERPRISES
NU
SKIN A
NN
UA
L REPORT
20
13
GAAP RECONCILATION 2007 2009 2011
Earnings per share $ 0.67 $ 1.40 $ 2.38
Impact of restructuring $ 0.17 $ 0.11 $ —
Impact of Japan customs ruling $ 0.31
Earnings per share excluding restructuring and Japan customs ruling
$ 0.84 $ 1.51 $ 2.69

ANNUAL REPORT ON FORM 10 K

UNITED STATESSECURITIES AND EXCHANGE COMMISSION
Washington, D.C. 20549
FORM 10-K(Mark One) ANNUAL REPORT PURSUANT TO SECTION 13 OR 15(d) OF THE SECURITIES EXCHANGE
ACT OF 1934
For the fi scal year ended December 31, 2013
or
TRANSITION REPORT PURSUANT TO SECTION 13 OR 15(d) OF THE SECURITIES EXCHANGE ACT OF 1934.
For the transition period from ________ to ________
Commission fi le number: 001-12421
NU SKIN ENTERPRISES, INC.(Exact name of registrant as specifi ed in its charter)
Delaware(State or other jurisdiction
of incorporation or organization)
75 WEST CENTER STREETPROVO UT 84601
(Address of principal executive offi ces, including zip code)
87-0565309(IRS Employer
Identifi cation No.)
Registrant’s telephone number, including area code: (801) 345-1000
Securities registered pursuant to Section 12(b) of the Act:
Title of each classClass A common stock, $.001 par value
Name of exchange on which registered New York Stock Exchange
Securities registered pursuant to Section 12(g) of the Act: None
Indicate by check mark if the registrant is a well-known seasoned issuer, as defi ned in Rule 405 of the Securities Act. Yes No
Indicate by check mark if the registrant is not required to fi le reports pursuant to Section 13 or Section 15(d) of the Act. Yes No
Indicate by check mark whether the Registrant: (1) has fi led all reports required to be fi led by Section 13 or 15(d) of the Securities Exchange Act of 1934 during the preceding 12 months (or for such shorter period that the Registrant was required to fi le such reports), and (2) has been subject to such fi ling requirements for the past 90 days. Yes No

Indicate by check mark whether the Registrant has submitted electronically and posted on its corporate Website, if any, every Interactive Data File required to be submitted and posted pursuant to Rule 405 of Regulation S-T (§232.405 of this chapter) during the preceding 12 months (or for such shorter period that the Registrant was required to submit and post such fi les). Yes No
Indicate by check mark if disclosure of delinquent fi lers pursuant to Item 405 of Regulation S-K(§229.405 of this chapter) is not contained herein, and will not be contained, to the best of the Registrant’s knowledge, in defi nitive proxy or information statements incorporated by reference in Part III of this Form 10-K or any amendment to this Form 10-K.
Indicate by check mark whether the Registrant is a large accelerated fi ler, an accelerated fi ler, a non-accel-erated fi ler, or a smaller reporting company. See the defi nitions of “large accelerated fi ler,” “accelerated fi ler,” and “smaller reporting company” in Rule 12b-2 of the Exchange Act.
Large accelerated fi ler Accelerated fi ler
Non-accelerated fi ler (Do not check if a smaller reporting company) Smaller Reporting Company
Indicate by check mark whether the Registrant is a shell company (as defined in Rule 12b-2 of the Act). Yes No
Based on the closing sales price of the Class A common stock on the New York Stock Exchange on June 28, 2013, the last business day of the Registrant’s second fi scal quarter, the aggregate market value of the voting stock held by non-affi liates of the Registrant was approximately $3.5 billion. All executive offi cers and directors of the Registrant, and all stockholders holding more than 10% of the Registrant’s outstanding voting stock, other than institutional investors, such as registered investment companies, eligible to fi le benefi cial ownership reports on Schedule 13G, have been deemed, solely for the purpose of the foregoing calculation, to be “affi liates” of the Registrant.
As of January 31, 2014, 58,800,356 shares of the Registrant’s Class A common stock, $.001 par value per share, and no shares of the Registrant’s Class B common stock, $.001 par value per share, were outstanding.
Documents incorporated by reference. Portions of the Registrant’s Defi nitive Proxy Statement for the Registrant’s 2014 Annual Meeting of Stockholders to be fi led with the Securities and Exchange Commission within 120 days after the Registrant’s fi scal year end are incorporated by reference in Part III of this report.

PART I
1 ITEM 1 BUSINESS Products Distribution Channel Geographic Regions Regulation Competition Employees Available Information Executive O� cers
13 ITEM 1A RISK FACTORS
28 ITEM 1B UNRESOLVED STAFF COMMENTS
ITEM 2 PROPERTIES
ITEM 3 LEGAL PROCEEDINGS
29 ITEM 4 MINE SAFETY DISCLOSURES
PART II
30 ITEM 5 MARKET FOR REGISTRANT’S COMMON EQUITY, RELATED STOCKHOLDER MATTERS AND ISSUER PURCHASES OF EQUITY SECURITIES
32 ITEM 6 SELECTED FINANCIAL DATA
33 ITEM 7 MANAGEMENT’S DISCUSSION AND ANALYSIS OF FINANCIAL CONDITION AND RESULTS OF OPERATIONS
49 ITEM 7A QUANTITATIVE AND QUALITATIVE DISCLOSURES ABOUT MARKET RISKS
ITEM 8 FINANCIAL STATEMENTS AND SUPPLEMENTARY DATA
79 ITEM 9 CHANGES IN AND DISAGREEMENTS WITH ACCOUNTANTS ON ACCOUNTING AND FINANCIAL DISCLOSURE
ITEM 9A CONTROLS AND PROCEDURES
ITEM 9B OTHER INFORMATION
PART III
80 ITEM 10 DIRECTORS, EXECUTIVE OFFICERS AND CORPORATE GOVERNANCE
ITEM 11 EXECUTIVE COMPENSATION
ITEM 12 SECURITY OWNERSHIP OF CERTAIN BENEFICIAL OWNERS AND MANAGEMENT AND RELATED STOCKHOLDER MATTERS
ITEM 13 CERTAIN RELATIONSHIPS AND RELATED TRANSACTIONS AND DIRECTOR INDEPENDENCE
ITEM 14 PRINCIPAL ACCOUNTANT FEES AND SERVICES
PART IV
80 ITEM 15 EXHIBITS AND FINANCIAL STATEMENT SCHEDULES
84 SIGNATURES
85 BOARD OF DIRECTORS
TABLE OF CONTENTS

FORWARD-LOOKING STATEMENTS
THIS ANNUAL REPORT ON FORM 10-K, IN PARTICULAR “ITEM 7. MANAGEMENT’S DISCUSSION AND ANALYSIS OF FINANCIAL CONDITION AND RESULTS OF OPERATION,” AND “ITEM 1. BUSINESS,” CONTAINS FORWARD-LOOKING STATEMENTS WITHIN THE MEANING OF SECTION 27A OF THE SECURITIES ACT OF 1933, AS AMENDED, AND SECTION 21E OF THE SECURITIES EXCHANGE ACT OF 1934, AS AMENDED THAT REPRESENT THE COMPANY’S CURRENT EXPEC-TATIONS AND BELIEFS. ALL STATEMENTS OTHER THAN STATEMENTS OF HISTORICAL FACT ARE “FORWARD-LOOKING STATEMENTS” FOR PURPOSES OF FEDERAL AND STATE SECURITIES LAWS AND INCLUDE, BUT ARE NOT LIMITED TO, STATEMENTS OF MANAGEMENT’S EXPECTATIONS REGARDING THE COMPANY’S PERFORMANCE, INITIATIVES, STRATEGIES, NEW PRODUCTS, OPPORTUNITIES AND RISKS; STATEMENTS OF PROJECTIONS REGARDING FUTURE OPERATING RESULTS AND OTHER FINANCIAL ITEMS; STATEMENTS OF BELIEF; AND STATEMENTS OF ASSUMPTIONS UNDERLYING ANY OF THE FOREGOING. IN SOME CASES, YOU CAN IDENTIFY THESE STATEMENTS BY FORWARD-LOOKING WORDS SUCH AS “BELIEVE,” “EXPECT,” “PROJECT,” “ANTICIPATE,” “ESTIMATE,” “INTEND,” “PLAN,” “TARGETS,” “LIKELY,” “WILL,” “WOULD,” “COULD,” “MAY,” “MIGHT,” THE NEGATIVE OF THESE WORDS AND OTHER SIMILAR WORDS. WE UNDERTAKE NO OBLIGATION TO PUBLICLY UPDATE OR REVISE ANY FORWARD-LOOKING STATEMENT, WHETHER AS A RESULT OF NEW INFORMATION, FUTURE EVENTS OR OTHERWISE, EXCEPT AS REQUIRED BY LAW. WE CAUTION AND ADVISE READERS THAT THESE STATEMENTS ARE BASED ON CERTAIN ASSUMPTIONS THAT MAY NOT BE REALIZED AND INVOLVE RISKS AND UNCERTAINTIES THAT COULD CAUSE ACTUAL RESULTS TO DIFFER MATERIALLY FROM THE EXPECTATIONS AND BELIEFS CONTAINED HEREIN. FOR A SUMMARY OF CERTAIN RISKS RELATED TO OUR BUSINESS, SEE “ITEM 1A – RISK FACTORS.”
In this Annual Report on Form 10-K, references to “dollars” and “$” are to United States dollars.
Nu Skin, Pharmanex and ageLOC are our trademarks. The italicized product names used in this Annual Report on Form 10-K are product names and also, in certain cases, our trademarks.
1
ITEM 1. BUSINESS
We are a leading global direct selling company with operations in 53 markets worldwide. In 2013, we achieved a record $3.2 billion in revenue, representing year-over-year growth of 49%. From our founding in 1984, we have strived to di� erentiate ourselves through innovation in both our products and our sales channel.
We develop and distribute innovative, premium-quality anti-aging personal care products and nutritional supplements under our Nu Skin and Pharmanex category brands, respectively. Over the last fi ve years, we have introduced new Pharmanex nutritional supplements and Nu Skin personal care products under our ageLOC anti-aging brand.
We operate in the direct selling channel, primarily utilizing person-to-person marketing to market and sell our products. Consumers of our products can purchase products either directly from a member of our sales force or directly from the company.
Approximately 92% of our 2013 revenue came from outside of the United States. Due to the size of our foreign operations, our results, as reported in U.S. dollars, are often impacted by foreign currency fl uc-tuations. In addition, our results are impacted by global economic, po-litical, demographic and business trends and conditions.
Mainland China became our largest revenue market in 2013 and accounted for approximately 32% of our revenue. Direct selling is relatively new to Mainland China and we believe the market holds signifi cant potential. We have implemented a distinct business mod-el in Mainland China to conform with local laws and regulations.
Our business is subject to various laws and regulations globally, particularly with respect to our direct selling business models and our product categories. Voluntary measures we have taken in Mainland China in response to recent media scrutiny and subsequent government reviews of our operations and the activities of our sales force in Mainland China will have a negative impact on our business in that market. See “Business—Regulation” and “Risk Factors” for a more detailed descrip-tion of these matters.
PRODUCTSWe o� er a branded, di� erentiated product platform. We believe our innovative approach to product development provides us with a competitive advantage in anti-aging and direct selling. We develop and distribute innovative, premium-quality anti-aging personal care products and nutritional supplements under our Nu Skin and Phar-manex category brands, respectively. Over the last fi ve years, we have introduced new Pharmanex nutritional supplements and Nu Skin personal care products under our ageLOC anti-aging brand. We have several products in development, including personalized skin care systems and next-generation nutritional supplements. Our research and product development is focused on understanding the sources of aging, including the infl uence of certain ingredients on gene expression, and utilizing that knowledge in our development of anti-aging products. We believe that our acquired and licensed tech-nologies, research collaborations and in-house research expertise en-able us to continue to introduce innovative, proprietary anti-aging products. We source and produce nearly all our proprietary products through trusted third parties, except in Mainland China, where we manufacture our own products.
PRODUCT CATEGORIESWe have two primary product categories, each operating under its own brand. We market our premium-quality personal care products under the Nu Skin category brand and our science-based nutritional supplements under the Pharmanex category brand. Over the last fi ve years, we have introduced new Pharmanex nutritional supple-ments and Nu Skin personal care products under our ageLOC anti-aging brand.
Presented below are the U.S. dollar amounts and associated revenue percentages from the sale of Nu Skin and Pharmanex prod-ucts for the years ended December 31, 2011, 2012, and 2013. This ta-ble should be read in conjunction with the information presented in the section entitled “Management’s Discussion and Analysis of Fi-nancial Condition and Results of Operations,” which discusses the factors impacting revenue trends and the costs associated with gen-erating the aggregate revenue presented.
PART I

2
REVENUE BY PRODUCT CATEGORY(U.S. dollars in millions)(1)
Year Ended December 31,
Product Category 2011 2012 2013Nu Skin . . . . . . . . . . . . . . . . . . . . . . . . . . . . . . . . . . . . . . $ 950.6 55.3% $ 1,158.2 54.3% $ 1,641.6 51.7%
Pharmanex . . . . . . . . . . . . . . . . . . . . . . . . . . . . . . . . . . 759.3 44.2 966.6 45.3 1,529.2 48.1
Other(2) . . . . . . . . . . . . . . . . . . . . . . . . . . . . . . . . . . . . . 9.7 0.5 7.5 0.4 5.9 0.2
$ 1,719.6 100.0% $ 2,132.3 100.0% $ 3,176.7 100.0%
(1) In 2013, 92% of our sales were transacted in foreign currencies that were then con-
verted to U.S. dollars for fi nancial reporting purposes at weighted-average ex-
change rates. Foreign currency fl uctuations negatively impacted reported revenue
by approximately 3% in 2013 compared to 2012. Foreign currency fl uctuations nega-
tively impacted reported revenue by approximately 1% in 2012 compared to 2011.(2) We currently o� er a limited number of other products and services, including
household products and technology services.
Nu Skin. Nu Skin is the brand of our original product line and o� ers premium-quality anti-aging personal care products. Our strat-egy is to leverage our distribution channel to strengthen Nu Skin’s position as an innovative leader in the anti-aging personal care mar-ket. We are committed to continuously improving and evolving our product formulations to develop and incorporate innovative and proven ingredients. Our primary categories in this product line are core skin-care systems and targeted treatment products that address specifi c skin needs. We formulate these products with ingredients that are scientifi cally proven to provide visible results. Products in this category include ageLOC Galvanic Spa System, ageLOC Galvanic Body Spa, and ageLOC Transformation anti-aging skin care system. Our ageLOC skin care products accounted for 22% of our total rev-enue and 42% of Nu Skin sales in 2013. We also o� er a number of other cosmetic, personal care and hair care products.
Pharmanex. We market a variety of products under our Pharmanex brand. Our strategy is to continue to introduce innovative, substanti-ated anti-aging products based on research and development and quality manufacturing. Direct selling has proven to be an e� ective method of marketing our high-quality supplements because our sales force can personally educate consumers on the quality and benefi ts of our products, di� erentiating them from our competitors’ o� erings. This product line includes our recently introduced ageLOC TR90weight management and body shaping system, which includes four products and a comprehensive diet and lifestyle plan designed to promote healthy body composition. TR90 was our largest nutritional product in terms of revenue, representing 18% of our total revenue and 37% of Pharmanex revenue in 2013, as a result of successful limited-time o� ers of this product in the second half of 2013. Other top-selling products in this category include LifePak and ageLOC R.2 We also
o� er a number of other anti-aging nutritional solutions and weight management products.
PRODUCT DEVELOPMENTWe are committed to developing and marketing innovative prod-ucts. We have several products in development, including nutritional supplements and personalized skin care systems. Our research and product development is focused on understanding the sources of aging, including the infl uence of certain ingredients on gene expres-sion, and utilizing that knowledge in our development of anti-aging products.
Our research and product development activities include:
• Internal research, product development and quality testing;
• Joint research projects, collaborations and clinical studies;
• Identifi cation and assessment of technologies for potential licensing arrangements; and
• Acquisition of technologies.
We maintain research and product development facilities at our headquarters in Provo, Utah as well as in Mainland China where we conduct various research and development activities. We also con-tract with third parties for clinical studies and collaborate on basic research projects with researchers from universities and other research institutions in the United States and Asia, whose sta� s include scientists with basic research expertise in natural product chemistry, biochemistry, dermatology, pharmacology and clinical studies. Our expenses for internal research and development activities and joint research projects and collaborations were $13.6 million, $14.9 million and $18.0 million in 2011, 2012 and 2013, respectively.
We also work to identify and assess innovative technologies developed by third parties for potential licensing or supply arrange-ments. Because of the nature of our distribution channel, which allows us to provide a high level of product information on a person-to-person basis, we often have third parties who are interested in licensing

3
innovative technologies for us to incorporate into our products and commercialize through our distribution channel. Licensing arrange-ments allow us to leverage the research activities of third parties that have resulted in demonstrated technologies, without the upfront costs and uncertainty associated with internal development, in exchange for the payment of a royalty on product sales. We have also invested in acquisitions to supplement our research capabilities and to acquire technologies, including our acquisition of Pharmanex in 1998 and the license and acquisition of the technology underlying our BioPhotonic Scanner, a non-invasive tool that measures the level of carotenoid anti-oxidants in body tissue. In 2011 and 2012, respectively, we acquired substantially all of the assets of LifeGen Technologies, LLC for $11.7 million and acquired Nox Technologies, Inc., for $12.6 million, including in each case, the acquisition of patents and previ-ously licensed technology utilized in connection with Nu Skin’s re-search e� orts and incorporated into some of our products. Our ex-pense for royalties and amortization for previous technology related acquisitions were approximately $8.8 million, $8.9 million and $9.7 million in 2011, 2012 and 2013, respectively. These amounts do not include our expenses for acquiring licensed ingredients and other technologies for our Tru Face Essence products, Galvanic Spa systems and other products.
INTELLECTUAL PROPERTY Our major trademarks are registered in the United States and in each country where we operate or have plans to operate, and we consider trademark protection to be very important to our business. Our major trademarks include Nu Skin®, our fountain logos, Pharmanex®, ageLOC®, LifePak® and Galvanic Spa®, and TR90®. In addition, a number of our products, including ageLOC TR90, ageLOC Edition Galvanic Spa System II, ageLOC Galvanic Body Spa, ageLOC Tru Face Essence Ultra and Pharmanex BioPhotonic Scanner, are based on proprietary technologies, some of which are patented or li-censed from third parties. We also rely on patents and trade secret protection to protect our proprietary formulas and other proprietary information for our ageLOC and other products.
SOURCING AND PRODUCTIONNu Skin. For markets other than Mainland China, we acquire
ingredients and contract production of nearly all our Nu Skin personal care products from third-party suppliers and manufacturers. In Mainland China, we operate manufacturing facilities where we produce the majority of our personal care products sold in Mainland China, as well as a limited number of products exported to some of our other markets. We are currently in the process of expanding our personal care manufacturing capacity in Mainland China.
We procure our ageLOC Galvanic Spa systems, including the ageLOC Edition Galvanic Spa System II and ageLOC Galvanic Body Spa, and our Tru Face Essence products from single vendors who own
or control the product formulations, ingredients, or other intellectual property rights associated with these products. We maintain good relationships with these vendors and do not anticipate that either party will terminate this relationship in the near term. However, to continue o� ering these product categories following any termination of our relationship with these vendors, we would need to develop and manufacture alternative products and source them from other vendors. We also acquire ingredients and products from one other supplier that manufactured products representing more than 10% of our Nu Skin personal care purchases in 2013. We maintain a good rela-tionship with this supplier and do not anticipate that either party will terminate this relationship in the near term. In the event we become unable to source any products or ingredients from this supplier, we believe that we would be able to produce or replace those products or substitute ingredients without great di� culty or signifi cant increases to our cost of goods sold. We also have ongoing relationships with secondary and tertiary suppliers. Please refer to “Risk Factors—The loss of suppliers or shortages in ingredients could harm our business” for a discussion of risks and uncertainties associated with our supplier relationships and with the sourcing of raw materials and ingredients.
Pharmanex. For markets other than Mainland China, we source most of our Pharmanex nutritional supplements from third-party suppliers and manufacturers. In Mainland China, we operate manu-facturing facilities where we produce the majority of our nutritional supplements sold in Mainland China and herbal extracts used to pro-duce other products sold globally. We are currently in the process of expanding our nutritional supplement manufacturing capacity in Mainland China.
One of our suppliers manufactured products representing more than 10% of our Pharmanex nutritional supplement purchases in 2013. We maintain a good relationship with this supplier and do not antici-pate that either party will terminate this relationship in the near term. In the event we become unable to source any products or ingredients from this supplier or from our other vendors, we believe that we would be able to produce or replace those products or substitute in-gredients without great di� culty or signifi cant increases to our cost of goods sold. We also have ongoing relationships with secondary and tertiary suppliers. Please refer to “Risk Factors—The loss of suppliers or shortages in ingredients could harm our business” for a discussion of certain risks and uncertainties associated with our supplier relation-ships, as well as with the sourcing of raw materials and ingredients.
DISTRIBUTION CHANNELWe operate in the direct selling channel, primarily utilizing person-to-person marketing to market and sell our products. These personal marketing e� orts are supported by various mediums, including cata-logs, the Internet, and walk-in centers. We believe our distribution channel is an e� ective vehicle to distribute our products because:
4
• our sales force can educate consumers about our products face-to-face, which we believe is more e� ective for di� erentiating our products than using traditional mass-media advertising;
• our distribution channel allows for actual product demonstra-tions and testing by potential consumers;
• our distribution channel allows our sales force to provide per-sonal testimonials of product e� cacy; and
• as compared to other distribution methods, our sales force has the opportunity to provide consumers higher levels of service and encourage repeat purchases.
The manner in which we operate our distribution channel can vary from market to market based on regulatory and socio-economic conditions. While our person-to-person marketing philosophy remains consistent globally, various aspects of our business may di� er from market-to-market, including product mix and pricing, compen-sation structure, access to distribution outlets or product stores, the manner of getting products to consumers, product claims, branding and product formulations. For example, in Mainland China we have implemented a distinct hybrid business model that utilizes retail stores, sales employees, contractual sales promoters and independent direct sellers to market our products.
Given that members of our sales force are independent con-tractors in most markets, we do not control or direct their promo-tional e� orts. We do, however, require that our sales force abide by policies and procedures that require our sales force to act in an ethical and consumer protective manner and in compliance with applicable laws and regulations. As a member of the United States Direct Selling
Association and similar organizations in many of the markets where we do business, we are also subject to the ethical business practices and consumer service standards required by the industry’s code of ethics.
CONSUMERS AND SALES NETWORKOur distribution channel is composed of two primary groups: our consumer group—individuals who buy our products primarily for per-sonal or family consumption; and our sales network—individuals who personally buy, use and resell products, and who also fi nd new con-sumers, and recruit, train and develop new Sales Leaders. We strive to develop both our consumer group and our sales network. Our strategy for growing our consumer group is to o� er high-quality, in-novative products that provide demonstrable benefi ts. Our strategy for growing our sales network is to provide a meaningful business op-portunity for those persons who demonstrate the ability to develop both a consumer group and a team of Sales Leaders.
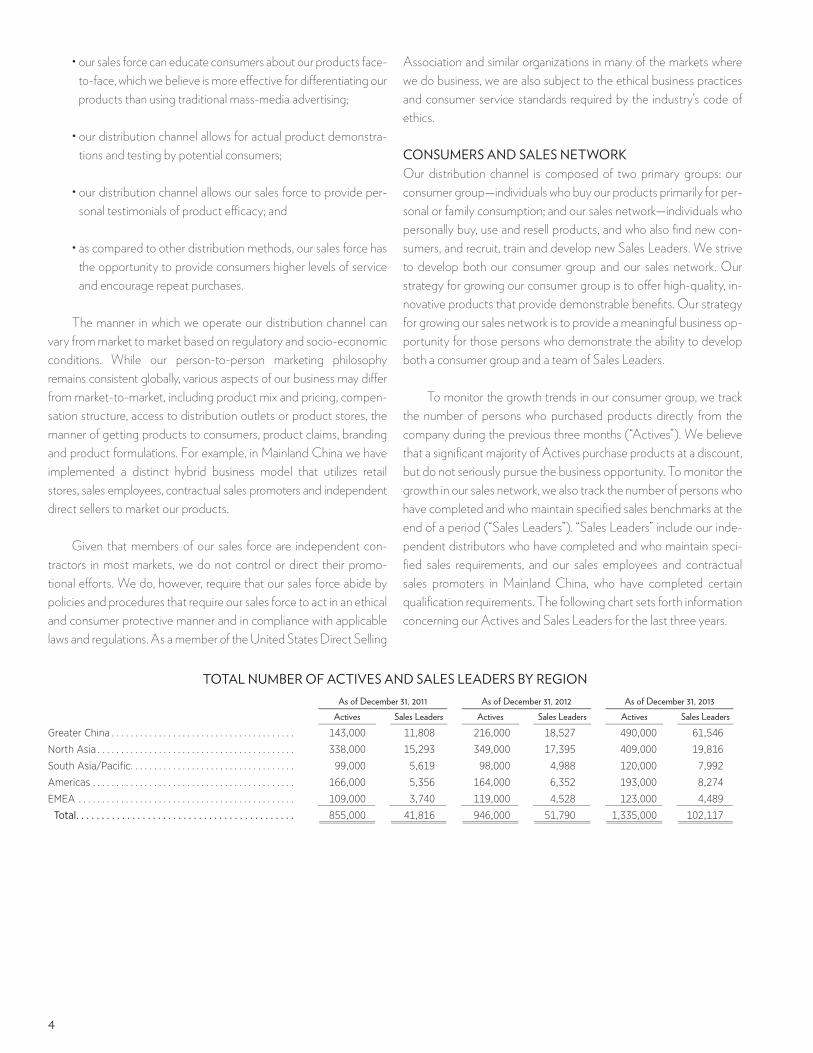
To monitor the growth trends in our consumer group, we track the number of persons who purchased products directly from the company during the previous three months (“Actives”). We believe that a signifi cant majority of Actives purchase products at a discount, but do not seriously pursue the business opportunity. To monitor the growth in our sales network, we also track the number of persons who have completed and who maintain specifi ed sales benchmarks at the end of a period (“Sales Leaders”). “Sales Leaders” include our inde-pendent distributors who have completed and who maintain speci-fi ed sales requirements, and our sales employees and contractual sales promoters in Mainland China, who have completed certain qualifi cation requirements. The following chart sets forth information concerning our Actives and Sales Leaders for the last three years.
TOTAL NUMBER OF ACTIVES AND SALES LEADERS BY REGIONAs of December 31, 2011 As of December 31, 2012 As of December 31, 2013
Actives Sales Leaders Actives Sales Leaders Actives Sales Leaders
Greater China . . . . . . . . . . . . . . . . . . . . . . . . . . . . . . . . . . . . . . . 143,000 11,808 216,000 18,527 490,000 61,546
North Asia . . . . . . . . . . . . . . . . . . . . . . . . . . . . . . . . . . . . . . . . . . 338,000 15,293 349,000 17,395 409,000 19,816
South Asia/Pacific. . . . . . . . . . . . . . . . . . . . . . . . . . . . . . . . . . . 99,000 5,619 98,000 4,988 120,000 7,992
Americas . . . . . . . . . . . . . . . . . . . . . . . . . . . . . . . . . . . . . . . . . . . 166,000 5,356 164,000 6,352 193,000 8,274
EMEA . . . . . . . . . . . . . . . . . . . . . . . . . . . . . . . . . . . . . . . . . . . . . . 109,000 3,740 119,000 4,528 123,000 4,489
Total. . . . . . . . . . . . . . . . . . . . . . . . . . . . . . . . . . . . . . . . . . . 855,000 41,816 946,000 51,790 1,335,000 102,117

5
GLOBAL DIRECT SELLING CHANNELOutside of Mainland China, individuals can elect to participate in our business as follows:
“Distributor-Direct Consumers”—Individuals who purchase products directly from an independent distributor at a price estab-lished by the distributor.
“Company-Direct Consumers”—Individuals who purchase products directly from the company. These consumers are typically referred by a distributor. These consumers generally have the oppor-tunity to purchase at a discount if they participate in our subscription and/or loyalty programs. These individuals do not have the right to build a Nu Skin business by reselling product or by recruiting others.
“Basic Distributors”—Distributors who purchase products at a discount for personal or family use or for resale to other consumers. These individuals are not eligible to receive compensation on a multi-level basis unless they elect to qualify as a Sales Leader under our global compensation plan. We consider these individuals to be part of our consumer group, as we believe a signifi cant majority of these distributors are purchasing products for personal use and not actively recruiting others.
“Sales Leaders and Qualifi ers”—Distributors who have qualifi ed or are trying to qualify as a Sales Leader. These are the distributors who have elected to qualify as a Sales Leader and are actively recruiting consumers and distributors and building a sales network under our global compensation plan, and constitute our sales network.
To become a distributor in most of our markets, an individual must sign a distributor agreement and purchase a not-for-profi t starter-kit for a small fee, which varies from market to market. The starter kit generally consists of documentation concerning the busi-ness, including copies of the sales compensation plan, distributor policies and procedures and other documentation, but does not in-clude products. There are no requirements to purchase products, and no commissions are paid on the purchase of the starter-kit.
We o� er a generous product return policy. With some excep-tions based on local regulations, we o� er a return policy that allows our distributors to return unopened and unused product for up to 12 months subject to a 10% restocking fee. Distributors are not required to terminate their distributorship to return product. Actual product returns have historically been less than 5% of annual revenue. We be-lieve our generous return policy minimizes the fi nancial risks associ-ated with operating a Nu Skin business.
In addition to our product return policy, we strive to be as con-sumer protective as possible. We seek to ensure that those who use our
products or who participate in our business opportunity are treated fairly and are not misled by inappropriate product or earnings claims.
There are two fundamental ways in which our distributors can earn money:
• by reselling products purchased from the company to consumers; and
• through commissions earned on the sale of products under our global sales compensation plan.
We believe that our global sales compensation plan, which has been implemented in each of our markets except Mainland China, is among the most generous compensation plans in the direct selling industry and is one of our competitive advantages. Our Sales Lead-ers can receive commissions under our global sales compensation plan for product sales from the company to their own network of con-sumers as well as for product sales from the company to other Sales Leaders and their consumer groups. This type of sales compensation is often referred to as “multi-level” compensation. Commissions are based on the sale and consumption of our products. Our sales force is not required to recruit or sponsor others, and we do not pay any commissions for recruiting or sponsoring. While all of our distributors can sponsor others at any time, our Sales Leaders and those in quali-fi cation to become Sales Leaders are those who generally are actively sponsoring others. Pursuant to our global sales compensa-tion plan, we pay consolidated monthly commissions in a Sales Lead-er’s home country, in local currency, for product sales in the Sales Leader’s own consumer group and for product sales in the Sales Leader’s organization of Sales Leaders across all geographic markets.
MAINLAND CHINA BUSINESS MODELBecause of restrictions on direct selling and multi-level commissions in Mainland China, we have implemented a business model for that market that is di� erent from the business model we use in our other markets. We have structured our business model in Mainland China based on several factors: our interpretation of applicable regulations, the guidance we have received from government o� cials, our under-standing of the practices of other international direct selling compa-nies operating in Mainland China, and our understanding as to how regulators are interpreting and enforcing the regulations.
In Mainland China, we utilize sales employees and contractual sales promoters, who sell products in similar fashion to our sales em-ployees but act as independent agents, to sell products through our retail stores and through our website. We rely heavily on our ability to attract consumers through our sales employees and contractual sales promoters, to educate consumers about our products through frequent training meetings, and to promote repeat purchases. We

6
currently plan to continue to expand our store count in Mainland China. We also continue to implement a direct sales opportunity that allows us to engage entry-level, non-employee direct sellers who can sell products away from our stores where we have obtained direct sales licenses. We currently have very few direct sellers in Mainland China, but we are in the process of expanding this aspect of our busi-ness. In addition, we currently plan to implement a third distribution structure by adding independent marketers in certain areas. Inde-pendent marketers will be licensed business owners who will be au-thorized to sell our products either at their own approved premises or through our stores. We believe direct sellers and independent mar-keters will complement our retail store model.
Our sales employees, contractual sales promoters, direct sellers and independent marketers in Mainland China do not participate in our global sales compensation plan, but are instead compensated ac-cording to a separate compensation model established for Mainland China. Sales employees, contractual sales promoters, direct sellers and independent marketers all earn commissions on their product sales at established commission rates. Sales employees also receive a salary, which is reviewed and adjusted on a quarterly basis.
Please refer to “Business – Regulation” and “Risk Factors” for a discussion of risks and uncertainties associated with our business in Mainland China.
SALES INCENTIVES, MEETINGS, RECOGNITION AND TRAINING
An important part of our distribution channel is motivating our Sales Leaders and recognizing their achievements. We hold regular meetings and events globally in order to recognize Sales Leaders who have achieved various levels of success in our business. These
meetings also allow the company and key Sales Leaders to provide training to other Sales Leaders. We utilize a variety of sales incentives such as incentive trips to motivate Sales Leaders. In addition to re-warding performance, incentive trips provide Sales Leaders and the company opportunities to share best practices, generate alignment of Sales Leaders around key initiatives, and provide a high level of motivation and team building among Sales Leaders.
PRODUCT LAUNCH PROCESSAlthough our product launch process may vary by market, we
generally introduce new products to our sales force and consumers in all markets where the products are registered, through limited-time o� ers. The limited-time o� ers typically generate signifi cant activity and a high level of purchasing, which may result in a higher than normal increase in revenue during the quarter of the limited-time o� er and skew year-over-year and sequential comparisons. We believe our product launch process attracts new people to our business, driving growth in our Sales Leaders and Actives. For example, limited-time o� ers of our ageLOC TR90 weight management and body shaping system in the second half of 2013 generated revenue of approximately $550 million. In 2014, we currently plan to further introduce ageLOC TR90 and our ageLOC Tru Face Essence Ultra anti-aging skin care serum through limited-time o� ers in certain regions. Please refer to “Risk Factors” for more information on risks related to our product launch process.
GEOGRAPHIC REGIONSWe currently sell and distribute our products in 53 markets. We have divided our markets into fi ve geographic regions: Greater China, North Asia, South Asia/Pacifi c, Americas and EMEA. The following table sets forth the revenue for each of the geographic regions for the years ended December 31, 2011, 2012 and 2013:
Year Ended December 31,
(U.S. dollars in millions) 2011 2012 2013
Greater China . . . . . . . . . . . . . . . . . . . . . . . . . . . . . . . . . . . . . . . . . $ 333.6 19% $ 550.7 26% $ 1,363.2 43%
North Asia . . . . . . . . . . . . . . . . . . . . . . . . . . . . . . . . . . . . . . . . . . . . 741.8 43 785.3 37 869.4 27
South Asia/Pacific . . . . . . . . . . . . . . . . . . . . . . . . . . . . . . . . . . . . . 235.0 14 328.6 15 379.0 12
Americas . . . . . . . . . . . . . . . . . . . . . . . . . . . . . . . . . . . . . . . . . . . . . . 248.2 15 285.3 13 370.1 12
EMEA . . . . . . . . . . . . . . . . . . . . . . . . . . . . . . . . . . . . . . . . . . . . . . . . . 161.0 9 182.4 9 195.0 6
$ 1,719.6 100% $ 2,132.3 100% $ 3,176.7 100%
Additional comparative revenue and related fi nancial information is presented in the tables captioned “Segment Information” in Note 18 to our Consolidated Financial Statements.
REGULATION DIRECT SELLING REGULATIONS
Direct selling is regulated by various national, state and local government agencies in the United States and foreign countries. These laws and regulations are generally intended to prevent fraudu-lent or deceptive schemes, including “pyramid” schemes, which com-
pensate participants primarily for recruiting additional participants without signifi cant emphasis on product sales to consumers. The laws and regulations in our current markets generally:
• require order cancellations and product returns, inventory buy-backs and cooling-o� rights;
• require us, or our sales force, to register with government agencies;
7
• impose caps on the amount of commissions we pay;
• impose reporting requirements; and
• require that we ensure, among other things, that our sales force maintains levels of product sales to qualify to receive commis-sions and that our sales force is compensated for sales of prod-ucts and not for recruiting others.
The laws and regulations governing direct selling may be modi-fi ed or reinterpreted from time to time, which may cause us to change our sales compensation and business models. In almost all of our markets, regulations are subject to discretionary interpretation by regulators and judicial authorities. There is often ambiguity and un-certainty with respect to the state of direct selling and anti-pyramid-ing laws and regulations. In the United States, for example, federal law provides law enforcement agencies, such as the Federal Trade Commission, broad latitude in policing unfair or deceptive trade practices, but does not provide a bright-line test for identifying a pyramid scheme. This can create a level of ambiguity as to the proper interpretation of the law and related court decisions. Recently, there has been signifi cant media and investment community discussion around the law in this area, and some investors and other individuals have advocated for a more restrictive interpretation of the law.
The regulatory environment in Mainland China is particularly complex and continues to evolve. Mainland China’s direct selling and anti-pyramiding regulations contain various restrictions, including re-garding the payment of multi-level compensation. The regulations are subject to discretionary interpretation by provincial and local level regulators as well as local customs and practices.
Regulators continue to act cautiously as they monitor the devel-opment of direct selling in Mainland China. In order to expand our direct selling model into additional provinces we currently must ob-tain a series of approvals from the local Department of Commerce in such provinces, the Shanghai Municipal Commission of Commerce (our supervisory authority), as well as the State Ministry of Com-merce (“MOFCOM”), which is the national governmental authority overseeing direct selling. In the course of obtaining these approvals, the respective authorities under MOFCOM must also consult and seek opinions on our business operations from the Ministry of Public Security and the Administration for Industry and Commerce at both provincial and State levels.
Our operations in Mainland China are subject to signifi cant government and media scrutiny and investigations. At times, investi-gations and other regulatory actions have limited our ability to con-duct business in certain locations in Mainland China, and have re-sulted in a few cases where we have paid fi nes. We face a risk that
future investigations and other regulatory actions may result in fi nes, revocation of licenses or other more signifi cant sanctions.
Following a number of negative media stories published in Jan-uary 2014 by the People’s Daily in Mainland China, we received inqui-ries from various government regulators in Mainland China asking us to respond to a number of allegations relating to our business prac-tices, products and business model. In response to this media and regulatory scrutiny we have voluntarily taken a number of actions in Mainland China, including temporarily suspending our business pro-motional meetings, temporarily suspending acceptance of applica-tions for any new sales representatives, and extending our product refund and return policies. The adverse publicity and suspension of business promotional meetings and acceptance of applications has had a signifi cant negative impact on the number of Sales Leaders and Actives, and our revenue in the short term will be negatively im-pacted by these voluntary actions. Any inability to resume normal business operations in the near term could have a more signifi cant impact on our business. We currently plan to focus our attention dur-ing the next several months on training our sales force with respect to the promotion of both products and the business opportunity we of-fer in Mainland China. It is currently unclear what impact the adverse publicity and our voluntary actions will have on our business in this market in the longer term or whether these voluntary actions will be e� ective in addressing concerns of regulators in Mainland China. Re-gardless, it is likely that we will be fi ned and could potentially face some other form of sanctions from these regulators. These other sanctions could include a formal suspension of our ability to recruit new sales people and direct sellers, a temporary suspension of our ability to sell products in various markets or, in the most extreme cases, loss of existing licenses to operate in various jurisdictions in Mainland China. Any of these actions or outcomes could materially harm our business and fi nancial condition.
In South Korea, regulations limit the amount of commissions we can pay to our distributors. We have implemented various measures to comply with this limit, including adjusting the commissionable value of our products in this market.
The direct selling industry in Japan continues to experience regulatory and media scrutiny. Several direct selling companies in Ja-pan have been penalized for actions of distributors who violated ap-plicable regulations. Over the last few years, we have received warn-ings from local consumer centers in Japan raising concerns about the number of general inquiries and complaints regarding the activities of certain of our distributors. We have implemented additional steps to reinforce our distributor education and training in Japan to help ad-dress these concerns.

8
Please refer to “Risk Factors” for more information on regulatory and other risks associated with our business in Mainland China, South Korea, Japan the United States and other markets.
PRODUCT REGULATIONSOur Nu Skin and Pharmanex products and related promotional and marketing activities are subject to extensive governmental regulation by numerous government agencies and authorities in the United States, including the Food and Drug Administration (the “FDA”), the Federal Trade Commission (the “FTC”), the Consumer Product Safety Commission, the Department of Agriculture, State Attorneys General and other state regulatory agencies in the United States, as well as the Food and Drug Administration in Mainland China, the Ministry of Food and Drug Safety in South Korea, the Ministry of Health, Labour and Welfare in Japan and similar government agen-cies in other markets in which we operate.
Our personal care products are subject to various laws and regula-tions that regulate cosmetic and personal care products and set forth regulations for determining whether a product can be marketed as a “cosmetic” or requires further approval as an over-the-counter drug. In the United States, regulation of cosmetics is under the primary jurisdic-tion of the FDA. Cosmetics are not subject to pre-market approval by the FDA, but the products, their ingredients and their label and labeling content, are regulated by the FDA, and it is the burden of those who sell cosmetics to ensure that they are safe for use as directed. In addition, the labeling of cosmetic products is subject to the requirements of the Federal Food, Drug and Cosmetic Act (“FDCA”), the Fair Packaging Labeling Act and other FDA regulations.
The FDCA defi nes cosmetics by their intended use, as “articles intended to be rubbed, poured, sprinkled, or sprayed on, introduced into, or otherwise applied to the human body . . . for cleansing, beautify-ing, promoting attractiveness, or altering the appearance.” Among the products included in this defi nition are skin moisturizers, perfumes, lip-sticks, fi ngernail polishes, eye and facial makeup preparations, shampoos, permanent waves, hair colors, toothpastes and deodorants, as well as any material intended for use as a component of a cosmetic product. A product may be considered a drug if it is intended for use in the diag-nosis, cure, mitigation, treatment, or prevention of disease, or is intend-ed to a� ect the structure or any function of the body (“structure/func-tion claims”). A product’s intended use can be inferred from marketing or product claims and regulators may consider the marketing claims of our sales force. Structure/function claims are generally prohibited for cosmetic products as are disease prevention and treatment claims. The FDA prohibits certain ingredients from being included in cosmetic products. It is possible that cosmetic product ingredients now com-monly in use that are derived from nanotechnology may be restricted or prohibited in the future.
In 2012, the FDA issued warning letters to several cosmetic companies alleging improper structure/function claims regarding their cosmetic products, including, for example, product claims re-garding gene activity, cellular rejuvenation, and rebuilding collagen. Cosmetic companies confront di� culty in determining whether a claim would be considered by the FDA to be an improper structure/function claim. Given this di� culty, and our research and product de-velopment focus on the sources of aging and the infl uence of certain ingredients on gene expression, there is a risk that we could receive a warning letter, be required to modify our product claims or take other actions to satisfy the FDA if the FDA determines any of our market-ing materials contain improper structure/function claims for our cos-metic products. In addition, plainti� s’ lawyers have fi led class action lawsuits against some of our competitors after our competitors re-ceived these FDA warning letters. There can be no assurance that we will not be subject to governmental actions or lawsuits, which could harm our business.
The other markets in which we operate have similar regulations. In Mainland China, personal care products are placed into one of two categories, “general” and “drug.” Products in both categories require submission of formulas and other information with the health author-ities, and drug products require human clinical studies. The product registration process in Mainland China is unpredictable and gener-ally takes from nine to 18 months to complete. However, in some cases, product registration in Mainland China has taken several years. In Japan, the Ministry of Health, Labour and Welfare regulates the sale and distribution of cosmetics and requires us to have an import business license and to register each personal care product imported into Japan. In Taiwan, all “medicated” cosmetic products require reg-istration. The sale of cosmetic products is regulated in the European Union (the “EU”) under the EU Cosmetics Directive, which requires a uniform application for foreign companies making personal care product sales. Similar regulations in any of our markets may limit our ability to import products and may delay product launches while the registration and approval process is pending.
Our Pharmanex dietary supplement products are also subject to applicable regulations of government agencies in the markets in which we operate. In the United States, we generally market our nu-tritional products as conventional foods or dietary supplements. The FDA has jurisdiction over this regulatory area. The FDA imposes specifi c requirements for the labels and labeling of food and dietary supplements, including the requirements of the Food Allergen La-beling and Consumer Protection Act of 2004 (“FALCPA”), which mandates declaration of the presence of major food allergens. In ad-dition, in June 2002, Congress enacted the Public Health Security and Bioterrorism Preparedness and Response Act of 2002 (the “Bio-terrorism Act”), which contained new requirements with regard to the sale and importation of food products in the United States: manda-

9
tory registration with the FDA of all food manufacturers; prior notice to regulators of inbound food shipments; recordkeeping require-ments, and grant of access to the FDA of applicable records; and grant of detention authority to the FDA of food products in certain circumstances.
The recently enacted FDA Food Safety Modernization Act (“FSMA”) has also increased the FDA’s authority with respect to food safety. FSMA, signed into law by President Obama on January 4, 2011, is considered one of the most signifi cant changes to the FDCA with respect to strengthening the U.S. food safety system. It enables the FDA to focus more on preventing food safety problems rather than relying primarily on reacting to problems after they occur. The law also provides the FDA with new enforcement authorities de-signed to achieve higher rates of compliance with prevention- and risk-based food safety standards and to better respond to and con-tain problems when they do occur. The law also gives the FDA im-portant new tools to hold imported foods to the same standards as domestic foods and directs the FDA to build an integrated national food safety system in partnership with state and local authorities. As the agency begins to implement this law, there will likely be increased regulation and increased regulatory scrutiny with respect to food and nutritional supplements.
The FDA regulates dietary supplements principally under the Dietary Supplement Health and Education Act of 1994 (“DSHEA”). DSHEA formally defi ned what may be sold as a dietary supplement, defi ned statements of nutritional support and the conditions under which they may lawfully be used, and included provisions that permit the FDA to regulate manufacturing practices and labeling claims ap-plicable to dietary supplements. Because our Pharmanex products are regulated under DSHEA, we are generally not required to obtain regulatory approval prior to introducing a dietary supplement into the United States market.
Generally, under DSHEA, dietary ingredients that were on the market before October 15, 1994 may be used in dietary supplements without notifying the FDA. However, a “new” dietary ingredient (i.e., a dietary ingredient that was not marketed in the U.S. before Octo-ber 15, 1994) must be the subject of a new dietary ingredient notifi ca-tion submitted to the FDA unless the ingredient has been “present in the food supply as an article used for food” without having been “chemically altered.” A new dietary ingredient notifi cation must pro-vide the FDA with evidence of a “history of use or other evidence of safety” which establishes that use of the dietary ingredient “will rea-sonably be expected to be safe.” A new dietary ingredient notifi ca-tion must be submitted to the FDA at least 75 days before the new dietary ingredient can be marketed. Under DSHEA, the FDA may remove from the market any new dietary ingredient contained in our Pharmanex products that the FDA determines to be unsafe. In addi-
tion, the FDA may also deem a dietary supplement an unapproved drug where the marketing claims made in connection with the sale or promotion of the product e� ectively place it in the drug category.
In our foreign markets, dietary supplements are generally regu-lated by similar government agencies, such as the Mainland China Food and Drug Administration, the South Korea Ministry of Food and Drug Safety; the Japan Ministry of Health, Labour and Welfare and the Taiwan Department of Health. We typically market our Pharmanex products in international markets as foods or health foods under applicable regulatory regimes. In the event a product, or an ingredient in a product, is classifi ed as a drug or pharmaceutical prod-uct in any market, we will generally not be able to distribute that prod-uct in that market through our distribution channel because of pre-market approvals and strict regulations applicable to drug and pharmaceutical products. Mainland China also has highly restrictive nutritional supplement product regulations. Products marketed as “health foods” are subject to extensive laboratory and clinical analysis by governmental authorities, and the product registration process in Mainland China generally takes one to two years, but may be sub-stantially longer. We market both “health foods” and “general foods” in Mainland China. There is some risk associated with the common practice in Mainland China of marketing a product as a “general food” while seeking “health food” classifi cation. If government o� -cials feel the categorization of our products is inconsistent with prod-uct claims, ingredients or function, this could end or limit our ability to market such products in Mainland China in their current form. In ad-dition, we are not permitted to market or sell “general foods” through our direct sales channel in Mainland China and any e� orts by our di-rect sellers to do so could result in negative publicity, fi nes and other government sanctions being imposed against us.
The markets in which we operate all have varied regulations that distinguish foods and nutritional health supplements from “drugs” or “pharmaceutical products.” Because of the varied regulations, some products or ingredients that are recognized as a “food” in certain markets may be treated as a “pharmaceutical” in other markets. In Ja-pan, for example, if a specifi ed ingredient is not listed as a “food” by the Ministry of Health and Welfare, we must either modify the prod-uct to eliminate or substitute that ingredient, or petition the govern-ment to treat such ingredient as a food. We experience similar issues in our other markets. This is particularly a challenge in Europe, where regulations often still di� er from state to state, despite EU regulations designed to harmonize the laws of EU member states. As a result, we must often modify the ingredients and/or the levels of ingredients in our products for certain markets, or create unique formulations for multiple markets. In some circumstances, the regulations in foreign markets may require us to obtain regulatory approval prior to intro-duction of a new product or limit our use of certain ingredients alto-gether. Because of negative publicity associated with some adulter-

10
ated or misbranded supplements, including pharmaceutical drugs marketed as dietary supplements, there has been an increased move-ment in the United States and other markets to expand the regula-tion of dietary supplements, which could impose additional restric-tions or requirements in the future. In general, the regulatory environment is becoming more complex with increasingly stricter regulations each year.
E� ective June 2008, the FDA established regulations to require current good manufacturing practices for dietary supplements in the United States. The regulations ensure that dietary supplements are produced in a quality manner, do not contain contaminants or impuri-ties, and are accurately labeled. The regulations include requirements for establishing quality control procedures for us and our vendors and suppliers, designing and constructing manufacturing plants, and testing ingredients and fi nished products. The regulations also in-clude requirements for record keeping and handling consumer prod-uct complaints. If dietary supplements contain contaminants or do not contain the type or quantity of dietary ingredient they are repre-sented to contain, the FDA would consider those products to be adulterated or misbranded. Our business is subject to additional FDA regulations, such as new dietary ingredient regulations and ad-verse event reporting regulations that require us to document and track adverse events and report serious adverse events that involve hospitalization or death associated with consumers’ use of our prod-ucts. Compliance with these regulations has increased, and may fur-ther increase, the cost of manufacturing and selling certain of our products as we incur internal costs, oversee and inspect more aspects of third party manufacturing and work with our vendors to assure they are in compliance.
Most of our major markets also regulate advertising and product claims regarding the e� cacy of products and require adequate and reliable scientifi c substantiation of all claims. Accordingly, these regu-lations can limit our ability to inform consumers of the full benefi ts of our products. For example, in the United States, we are unable to claim that any of our nutritional supplements will diagnose, cure, mit-igate, treat or prevent disease. In most of our foreign markets, we are not able to make any “medicinal” claims with respect to our Phar-manex products.
In the United States, the FDA generally prohibits disease diag-nosis, prevention and treatment claims when made for a dietary sup-plement. DSHEA, however, permits substantiated, truthful and non-misleading “statements of nutritional support” to be included in labeling for dietary supplements without FDA pre-approval. Such statements may describe how a particular dietary ingredient a� ects the structure, function or general well-being of the body, or the mechanism of action by which a dietary ingredient may a� ect the structure, function or well-being of the body, but such statements
may not state that a dietary supplement will reduce the risk or inci-dence of a disease unless such claim has been reviewed and ap-proved by the FDA. In addition, the FDA permits companies to use FDA-approved full and qualifi ed health claims for products contain-ing specifi c ingredients that meet stated requirements.
A company that uses a statement of nutritional support in label-ing must possess evidence substantiating that the statement is truth-ful and not misleading. In 2004, the FDA issued guidance, paralleling an earlier guidance from the FTC, defi ning a manufacturer’s obliga-tions to substantiate structure/function claims. Such statements, when used in labeling, must also be submitted to the FDA no later than thirty days after fi rst marketing the product with the statement that they possess the necessary evidence and must be accompanied by an FDA mandated label disclaimer that “This statement has not been evaluated by the FDA. This product is not intended to diag-nose, treat, cure or prevent any disease.” There can be no assurance; however, that the FDA will not determine that a particular statement of nutritional support that we want to use is an unacceptable disease claim or an unauthorized nutrient-disease relationship claim other-wise permitted with FDA approval as a “health claim.” Such a deter-mination might prevent the use of such a claim, or result in additional FDA enforcement.
We are aware of media reports regarding dietary supplements, which call for the repeal or amendment of DSHEA. Individuals or groups that are opposed to supplements or question their safety or e� cacy may attempt to use these media reports to propose legisla-tion intended to amend or repeal DSHEA. Some of the legislative proposals may include variations on premarket approval, enhanced premarket safety or substantiation required and changing the defi ni-tion of a “dietary ingredient” to remove either botanicals or selected classes of ingredients now treated as dietary ingredients.
Most of the other markets in which we operate have not adopt-ed legislation like DSHEA and we may be subject to more restrictive limitations on the claims we can make about our products in these markets. For example, in Japan, our nutritional supplements are mar-keted as food products, which signifi cantly limits our ability to make any claims regarding these products. If marketing materials produced or used by us or our sales force make claims that exceed the scope of allowed claims for dietary supplements the FDA or other regulatory authorities could deem our products to be unapproved drugs. In Mainland China, we also face signifi cant restrictions on our ability to make product claims regarding the e� cacy of our products. In a se-ries of recent articles, the People’s Daily and other media outlets in Mainland China questioned some of the product claims made by our sales people and the scientifi c basis of these claims. This resulted in signifi cant negative media attention for us. Such attention could harm consumers’ perception of our business and our products, and
11
could negatively impact the registration, licensing status and sales of our products.
The FTC, which exercises jurisdiction over the advertising of all of our products in the United States, has in the past several years in-stituted enforcement actions against dietary supplement, food, and cosmetic companies for deceptive advertising. We also face limita-tions on our use of the scientifi c experts who have helped us develop and test some of our products. In the United States, for example, the FTC’s Guides Concerning the Use of Endorsements and Testimo-nials in Advertising restrict marketing to those results obtained by a “typical” consumer and require disclosure of any material connections between an endorser and the company or products they are endors-ing. In Mainland China, some media outlets have questioned the nature and extent of our connections with our Scientifi c Advisory Board and others who have helped in developing our scientifi c ap-proach or testing our products. This negative publicity could harm consumers’ perception of our business and our products, which could negatively impact our revenue. We cannot be sure that the FTC, or comparable foreign agencies, will not question our advertising or other operations in the future.
In the United States, we are also subject to a consent decree with the FTC and various state regulatory agencies arising out of in-vestigations that occurred in the early 1990s of certain alleged unsub-stantiated product and earnings claims made by our distributors. The consent decree requires us to, among other things, supplement our procedures to enforce our policies, not allow our distributors to make earnings representations without making certain average earnings disclosures, and not allow our distributors to make unsubstantiated product claims. The FTC could initiate an enforcement action to the extent the FTC determines that our advertising or promotional prac-tices are deceptive or contrary to the requirements of the consent decree.
We are anticipating selling a newly-cleared medical device in the United States during 2014. The device was cleared for marketing through the 510(k) process with the FDA as a medical device with cosmetic benefi t. Medical devices are highly regulated by the FDA. Manufacturers of medical devices must register and list their prod-ucts with the FDA annually, whether they are located domestically or overseas. Foreign jurisdictions may take note of the fact that we have registered as a medical device in the U.S. and require us to register in their market as well. The FDA has broad regulatory powers in the areas of clinical testing, marketing and advertising of medical devices. Medical devices must be labeled in accordance with the FDA’s gen-eral device labeling requirements and whatever particular label re-quirements the FDA may designate for that type of device.
In addition, medical device manufacturers must adhere to cer-tain “good manufacturing practices” in accordance with the FDA’s Quality System Regulation (“QSR”), which regulates the manufac-ture of medical devices, prescribes record-keeping procedures and provides for the routine inspection of facilities for compliance with such regulations. If in connection with these inspections the FDA be-lieves the manufacturer has failed to comply with applicable regula-tions and/or procedures, it may issue observations that would neces-sitate prompt corrective action. If the FDA inspection observations are not addressed and/or corrective action taken in a timely manner and to the FDA’s satisfaction, the FDA may issue a Warning Letter (which would similarly necessitate prompt corrective action) and/or proceed directly to other forms of enforcement action. Failure to re-spond timely to FDA inspection observations, a Warning Letter or other notice of noncompliance and to promptly come into compli-ance could result in the FDA bringing enforcement action against us, which could include the shutdown of our production facilities, denial of importation rights to the U.S. for products manufactured in over-seas locations and criminal and civil fi nes.
In the United States, FDA regulations on Good Manufacturing Practices and Adverse Event Reporting requirements for the nutri-tional supplement industry require us and our vendors to maintain good manufacturing processes, including stringent vendor qualifi ca-tions, ingredient identifi cation, manufacturing controls and record keeping. The ingredient identifi cation requirement, which requires us to confi rm the levels, identity and potency of ingredients listed on our product labels within a narrow range, is particularly burdensome and di� cult for us. A fi nding of noncompliance may result in administra-tive warnings, penalties or actions impacting our ability to continue selling certain products. In addition, compliance with these regula-tions has increased and may further increase the cost of manufactur-ing certain of our products as we work with our vendors to assure they are qualifi ed and in compliance.
Our Pharmanex BioPhotonic Scanner and our ageLOC Galvanic Spa System are subject to the regulations of various health, consumer protection and other governmental authorities around the world. These regulations vary from market to market and a� ect whether our products are required to be registered as medical devices, the claims that can be made with respect to these products, who can use them, and where they can be used. We have been required to register our ageLOC Galvanic Spa as a medical device in a few markets. We have been subject to regulatory inquiries in the United States, Japan, and other countries with respect to the status of the Pharmanex BioPhotonic Scanner as a non-medical device. Any determination that medical device clearance is required for one of our products, in a market where we currently market and sell such product as a cosmetic or non-medical device, could require us to expend signifi cant time and resources in order to meet the additional stringent standards

12
imposed on medical device companies or prevent us from marketing the product. Please refer to “Risk Factors” for more information on the regulatory risks associated with our Pharmanex BioPhotonic Scanner and our ageLOC Galvanic Spa.
OTHERAs a United States entity operating through subsidiaries in foreign jurisdictions, we are subject to foreign exchange control, transfer pric-ing and customs laws that regulate the fl ow of funds between us and our subsidiaries and for product purchases, management services and contractual obligations, such as the payment of sales commissions.
As is the case with most companies that operate in our product categories, we receive inquiries from time to time from government regulatory authorities regarding the nature of our business and other issues, such as compliance with local direct selling, transfer pricing, customs, taxation, foreign exchange control, securities and other laws. Negative publicity related to government inquiries into our opera-tions in the United States in the early 1990s, in South Korea in the late 1990s and more recently in Mainland China, has negatively impacted our business.
COMPETITION DIRECT SELLING
We compete with other direct selling organizations, some of which have a longer operating history, and greater visibility, name rec-ognition and fi nancial resources than we do. The leading direct selling companies in our existing markets are Amway, Avon Products, Herb-alife and Mary Kay. We compete with these companies to attract and retain our sales force and consumers based on the strength of our product o� erings, sales compensation, multiple business opportuni-ties, management and international operations.
PRODUCTSThe markets for our Nu Skin and Pharmanex products are highly competitive. Our competitors include a broad array of marketers of personal care and nutritional products and pharmaceutical compa-nies, many of which have longer operating histories and greater name recognition and fi nancial resources than we do. We compete in these markets by emphasizing the innovation, value and premium quality of our products and the convenience of our distribution system.
EMPLOYEESAs of December 31, 2013, we had approximately 5,056 full- and part-time employees worldwide. This does not include approximately 11,320 sales employees in our Mainland China operations. Although we have statutory employee representation obligations in certain countries, our employees are generally not represented by labor unions except where expressly required by law. We believe that our
relationship with our employees is good, and we do not foresee a shortage in qualifi ed personnel necessary to operate our business.
AVAILABLE INFORMATIONOur website address is www.nuskinenterprises.com. We make available free of charge on or through our website our annual reports on Form 10-K, quarterly reports on Form 10-Q, current reports on Form 8-K, and amendments to those reports fi led or furnished pursuant to Section 13(a) or 15(d) of the Securities Exchange Act of 1934 as soon as reason-ably practicable after we electronically fi le such material with, or furnish it to, the Securities and Exchange Commission (the “SEC”). The public may read and copy any materials we fi le with the SEC at the SEC’s Public Reference Room at 100 F Street, NE, Washington, DC 20549. The public may obtain information on the operation of the Public Ref-erence Room by calling the SEC at 1–800–SEC–0330. The SEC maintains a website at http://www.sec.gov that contains reports, proxy and information statements, and other information regarding issuers that fi le electronically with the SEC.
EXECUTIVE OFFICERSOur executive o� cers as of January 31, 2014, are as follows:
NAME AGE POSITIONSteven J. Lund 60 Executive Chairman of the BoardM. Truman Hunt 54 President and Chief Executive O� cerRitch N. Wood 48 Chief Financial O� cerJoseph Y. Chang 61 Chief Scientifi c O� cer and Executive
Vice President, Product DevelopmentDaniel R. Chard 49 President, Global Sales and OperationsD. Matthew Dorny 49 General Counsel and SecretaryScott E. Schwerdt 56 President, Americas Region
Steven J. Lund has served as Executive Chairman of our board of directors since May 2012. Mr. Lund previously served as Vice Chairman of our board of directors from September 2006 to May 2012, and as President and Chief Executive O� cer, and as a member of our board of directors from 1996, when we went public, until 2003. Mr. Lund was a founding stockholder of our company. Mr. Lund is a trustee of the Nu Skin Force for Good Foundation, a charitable orga-nization established in 1996 by our company to help encourage and drive the philanthropic e� orts of our company and its sales force and employees to enrich the lives of others. Mr. Lund worked as an at-torney in private practice prior to joining our company as Vice Presi-dent and General Counsel. He received a B.A. degree from Brigham Young University and a J.D. degree from Brigham Young Universi-ty’s J. Reuben Clark Law School.
M. Truman Hunt has served as our President and Chief Execu-tive O� cer since 2003. He also joined our board of directors when he

13
was named Chief Executive O� cer. Mr. Hunt has served in various positions with our company since 1994, including Executive Vice President from 2001 to 2003 and General Counsel from 1996 to 2003. From 2005 until 2008, Mr. Hunt served as Chairman of the World Federation of Direct Selling Associations, a global trade association for the direct selling industry. Mr. Hunt has served as vice-chairman of the United States Direct Selling Association since 2012. He received a B.S. degree from Brigham Young University and a J.D. degree from the University of Utah.
Ritch N. Wood has served as our Chief Financial O� cer since November 2002. Prior to this appointment, Mr. Wood served as Vice President, Finance from July 2002 to November 2002 and Vice President, New Market Development from June 2001 to July 2002. Mr. Wood joined our company in 1993 and has served in various capacities. Prior to joining us, he worked for the accounting fi rm of Grant Thornton LLP. Mr. Wood earned a B.S. and a Master of Ac-countancy degrees from Brigham Young University.
Joseph Y. Chang has served as our Chief Scientifi c O� cer and Executive Vice President of Product Development since February 2006. Dr. Chang served as President of our Pharmanex division from April 2000 to February 2006. Dr. Chang served as Vice President of Clinical Studies and Pharmacology of Pharmanex from 1997 until April 2000. Dr. Chang has nearly 20 years of pharmaceutical experi-ence. He received a B.S. degree from Portsmouth University and a Ph.D. degree from the University of London.
Daniel R. Chard has served as President of Global Sales and Operations since May 2009. Prior to serving in this position, Mr. Chard served as Executive Vice President of Distributor Success from February 2006 to May 2009 and President of Nu Skin Europe from April 2004 to February 2006. Mr. Chard served in various other capacities in our company from 1998 to 2004. Prior to joining us, Mr. Chard worked in a variety of strategic marketing positions in the con-sumer products industry. Mr. Chard holds a B.A. degree in Econom-ics from Brigham Young University and an M.B.A. from the Univer-sity of Minnesota.
D. Matthew Dorny has served as our General Counsel and Sec-retary since January 2003. Mr. Dorny previously served as Assistant General Counsel from May 1998 to January 2003. Prior to joining us, Mr. Dorny was a securities and business attorney in private practice in Salt Lake City, Utah. Mr. Dorny received B.A., M.B.A. and J.D. degrees from the University of Utah.
Scott E. Schwerdt has served as President, Americas Region, since June 2011. Mr. Schwerdt served as the President of the Americas, Europe and Pacifi c from February 2006 to June 2011 and as Regional Vice President of North America and President of Nu Skin Enterprises
United States, Inc. from May 2004 to February 2006. Mr. Schwerdt previously served as the General Manager of our U.S. operations from May 2001 to May 2004. Mr. Schwerdt joined our company in 1988 and has held various positions, including Vice President of North America/South Pacifi c Operations and Vice President of Europe. Mr. Schwerdt received a B.A. degree in International Relations from Brigham Young University.
ITEM 1A. RISK FACTORS We face a number of substantial risks. Our business, fi nancial condition or results of operations could be harmed by any of these risks. The trading price of our common stock could decline due to any of these risks, and they should be considered in connection with the other information con-tained in this Annual Report on Form 10-K. These risk factors should be read together with the other items in this Annual Report on Form 10-K, including Item 1. “Business” and Item 7. “Management’s Discussion and Analysis of Financial Condition and Results of Operation.”
Recent negative news reports in Mainland China have led to inves-tigations by Chinese regulators into our business in Mainland China and caused us to temporarily modify some of our business practices in that market. These modifi cations, any sanctions im-posed on us by the Chinese authorities and any associated adverse publicity may harm our business and fi nancial condition.
In January 2014, a series of articles were published by the People’s Daily in Mainland China, which were subsequently picked up by other media outlets. These articles contained a number of allegations includ-ing that our compensation practices violated Chinese laws against pyramid and multi-level sales organizations, that our recruiting and training techniques were unlawful or inappropriate, that some of our products were not licensed for sale in Mainland China, that certain of our products were causing adverse reactions in some users and that our employees had taken actions to “hush up” these problems, that certain of our sales force had misrepresented the scientifi c e� cacy of our products and the nature and extent of our connections with the scientifi c advisors who have helped in developing or testing our products and that certain of our sales people have falsely claimed endorsement of our products by public fi gures, media outlets and organizations. As a result of these al-legations, a number of Chinese regulatory agencies began investigations or made inquiries regarding our business practices in Mainland China which, to date, have principally focused on our marketing claims and the structure of our sales organizations and compensation and whether they violate applicable Chinese regulations. While this has been the initial focus, there is no assurance that regulators will not extend their inquiries into other aspects of our business including those identifi ed by the People’s Daily.
In response to this media and regulatory scrutiny we have volun-tarily taken a number of actions in Mainland China, including tempo-

14
rarily suspending our business promotional meetings, temporarily suspending acceptance of applications for any new sales representa-tives, and extending our product refund and return policies. The ad-verse publicity and suspension of business promotional meetings and acceptance of applications has had a signifi cant negative impact on the number of Sales Leaders and Actives, and our revenue in the short term will be negatively impacted by these voluntary actions. Any inability to resume normal business operations in the near term could have a more signifi cant impact on our business. We currently plan to focus our attention during the next several months on training our sales force with respect to the promotion of both products and the business opportunity we o� er in Mainland China. It is currently unclear what impact the adverse publicity and our voluntary actions will have on our business in this market in the longer term or whether these voluntary actions will be e� ective in addressing concerns of regulators in Mainland China. Regardless, it is likely that we will be fi ned and could potentially face some other form of sanctions from these regulators. These other sanctions could include a formal sus-pension of our ability to recruit new sales people and direct sellers, a temporary suspension of our ability to sell products in various markets or, in the most extreme cases, loss of existing licenses to operate in various jurisdictions in Mainland China. Furthermore, the negative publicity stemming from the allegations made in the media, these governmental investigations and any potential sanctions could harm our business and operations. Accordingly, these investigations, any sanctions imposed upon us by governmental regulators and the neg-ative media we have already received and could receive in the future could harm our business, operations and fi nancial condition.
We are currently being sued in several purported class action law-suits and a derivative claim relating to the recent negative media and regulatory scrutiny of our business in Mainland China and the associated decline in our stock price.
We have been named as a defendant in fi ve purported class ac-tion complaints relating to the recent negative media and regulatory scrutiny of our business in Mainland China. We have also been named as a nominal defendant in a shareholder derivative suit relat-ing to the same issues. These complaints purport to assert claims on behalf of certain of our stockholders or the company and allege that we made materially false and misleading statements regarding our sales operations in, and fi nancial results derived from, our Mainland China business. These complaints also allege that we are engaged in illegal multi-level marketing activities in Mainland China in violation of local law. These complaints seek substantial monetary damages or make claims for indeterminate amounts of damages. These com-plaints, or others fi led alleging similar facts, could result in monetary or other penalties that may a� ect our operating results and fi nancial condition. Moreover, the negative publicity stemming from these complaints and the allegations they make could harm our business and operations. Accordingly, any adverse determination against us in
these suits, or even the allegations contained in the suits regardless of whether they are ultimately found to be without merit, could harm our business, operations and fi nancial condition.
Di� cult economic conditions could harm our business.Global economic conditions continue to be challenging. Even
with continued growth in many of our markets, di� cult economic conditions could adversely a� ect our business in the future by causing a decline in demand for our products, particularly if the economic conditions are prolonged or worsen. In addition, such economic con-ditions may adversely impact access to capital for us and our suppliers, may decrease the ability of our sales force and consumers to obtain or maintain credit cards, and may otherwise adversely impact our operations and overall fi nancial condition.
Currency exchange rate fl uctuations could impact our fi nancial results.
In 2013, approximately 92% of our sales occurred in markets out-side of the United States in each market’s respective local currency. We purchase inventory primarily in the United States in U.S. dollars. In preparing our fi nancial statements, we translate revenue and ex-penses in our markets outside the United States from their local cur-rencies into U.S. dollars using weighted average exchange rates. If the U.S. dollar strengthens relative to local currencies, our reported rev-enue, gross profi t and net income will likely be reduced. Foreign cur-rency fl uctuations can also result in losses and gains resulting from translation of foreign currency denominated balances on our balance sheet. Although we may engage in transactions intended to reduce our exposure to foreign currency fl uctuations, there can be no assur-ance that these transactions will be e� ective. Given the complex global political and economic dynamics that a� ect exchange rate fl uctuations, it is di� cult to predict future fl uctuations and the e� ect these fl uctuations may have upon future reported results or our overall fi nancial condition.
Improper sales force actions that violate laws or regulations could harm our business.
Sales force activities that violate applicable laws or regulations could result in government or third party actions against us, which could harm our business.
For example, allegations have been made by various media out-lets that certain of our sales representatives in Mainland China have failed to adequately follow and enforce our policies and regulations. In response to these allegations, our Audit Committee commenced an internal review and Chinese regulators have commenced investi-gations into our business in Mainland China. For a further description of these matters, see “– Recent negative news reports in Mainland China have led to investigations by Chinese regulators into our busi-ness in Mainland China and caused us to temporarily modify some of

15
our business practices in that market. These modifi cations, any sanc-tions imposed on us by the Chinese authorities and any associated adverse publicity may harm our business and fi nancial condition.”
For another example, the direct selling industry in Japan contin-ues to experience regulatory and media scrutiny. Several direct sell-ing companies in Japan have been penalized for actions of their dis-tributors that violated applicable regulations, including a prominent international direct selling company and a large Japanese direct sell-ing company that were suspended from sponsoring activities for three months in 2008 and six months in 2009, respectively. Over the last few years, we have received warnings from consumer centers in certain prefectures raising concerns about the number of general in-quiries and complaints regarding us and our distributors. Although we are implementing additional steps to reinforce our distributor compliance, education and training e� orts in Japan, we cannot be sure that such e� orts will be successful. If the current level of inquiries or complaints does not improve, there is an increased likelihood that the government could take action against us, including fi nes, suspen-sions or other sanctions, or that we could receive further negative media attention, any of which could harm our business. Approxi-mately 13% of our 2013 revenue was generated in Japan.
Except in Mainland China, members of our sales force are not employees and act independently of us. The most signifi cant area of risk for such activities relates to improper product claims and claims regarding the business opportunity of joining our sales force. We implement strict policies and procedures to ensure our sales force complies with legal requirements. However, given the size of our sales force, we experience problems from time to time. For example, prod-uct claims made by some of our sales force in 1990 and 1991 led to a United States Federal Trade Commission (“FTC”) investigation that resulted in our entering into a consent decree with the FTC. In addi-tion, rulings by the South Korean Federal Trade Commission and by judicial authorities against us and other companies in South Korea indicate that vicarious liability may be imposed on us for the criminal activity of our sales force. We have also seen an increase in the use of social media by our sales force, and an increase in sales aids and pro-motional material produced by our sales force in some markets, in-creasing the burden on us to monitor compliance of such materials, and increasing the risk that such materials could contain problematic product or marketing claims in violation of our policies and applicable regulations. As we expand internationally, our sales force often at-tempts to anticipate which markets we will open in the future and begin marketing and sponsoring activities in markets where we are not qualifi ed to conduct business. We could face fi nes, suspensions or other legal action if our sales force violates applicable laws and regulations.
If we are unable to retain our existing sales force and recruit addi-tional people to join our sales force, our revenue will not increase and may even decline.
Our products are primarily marketed by our sales force and we depend on them to generate virtually all of our revenue. Our sales force may terminate their services at any time, and, like most direct selling companies, we experience high turnover among our sales force from year to year. People who join our company to purchase our products for personal consumption or for short-term income goals frequently only stay with us for a short time. Sales Leaders who have committed time and e� ort to build a sales organization will generally stay for longer periods. Our sales force has highly variable levels of training, skills and capabilities. To increase our revenue, we must in-crease the number of and/or the productivity of our sales force.
We have experienced periodic declines in both Sales Leaders and Actives in the past and could experience such declines again in the future. If our initiatives do not drive growth in both our Sales Leaders and Actives, our operating results could be harmed. While we take many steps to help train, motivate, and retain our sales force, we cannot accurately predict how the number and productivity of our sales force may fl uctuate because we rely primarily upon our Sales Leaders to fi nd new consumers, and train and develop new Sales Leaders. Our operating results could be harmed if we, and our Sales Leaders, do not generate su� cient interest in our business and its products to retain and motivate our existing sales force and attract new people to join our sales force.
The number and productivity of our sales force could be harmed by several additional factors, including:
• any adverse publicity regarding us, our products, our distribution channel, or our competitors;
• lack of interest in, dissatisfaction with, or the technical failure of, existing or new products;
• lack of a compelling product or income opportunity that generates interest;
• any negative public perception of our products and their ingredients;
• any negative public perception of our sales force and direct selling businesses in general;
• our actions to enforce our policies and procedures;

16
• any regulatory actions or charges against us or others in our industry;
• general economic and business conditions; and
• potential saturation or maturity levels in a given country or market which could negatively impact our ability to attract and retain our sales force in such market.
If direct selling regulations in Mainland China are modifi ed, inter-preted or enforced in a manner that results in negative changes to our business model or the imposition of a range of potential penal-ties, our business would be signifi cantly negatively impacted.
The government of Mainland China has adopted direct selling and anti-pyramiding regulations that impose signifi cant restrictions and limitations on the way we do business. Most notably, the regula-tions include a restriction on the use of multi-level compensation, which is the basis of how we compensate our sales force outside of Mainland China. We have structured our business model in Main-land China based on several factors: our interpretation of applicable regulations, the guidance we have received from government o� -cials, our understanding of the practices of other international direct selling companies operating in Mainland China, and our understand-ing as to how regulators are interpreting and enforcing the regula-tions. In Mainland China, we utilize sales employees and contractual sales promoters to sell products through our retail stores and through our website, and independent direct sellers who can also sell products away from our stores where we have obtained direct sales licenses. We generally compensate our Sales Leaders at a level that is com-petitive with other direct selling companies in the market and refl ec-tive of the compensation of our Sales Leaders globally. The nature of the political, regulatory and legal systems in Mainland China gives regulatory agencies at both the local and central levels of gov-ernment broad discretion to interpret and enforce regulations as they deem appropriate to promote social order. We face a risk that regulators may change the way in which they currently interpret and enforce the direct selling regulations.
As described above, Chinese regulators have initiated investi-gations to review issues raised by recent news reports relating to our business model and operations in Mainland China. For a further description of these matters, see “– Recent negative news reports in Mainland China have led to investigations by Chinese regulators into our business in Mainland China and caused us to temporarily modify some of our business practices in that market. These modifi cations, any sanctions imposed on us by the Chinese authorities and any associated adverse publicity may harm our business and fi nancial condition.” If our business practices are found to be in violation of applicable regulations as they may be interpreted or enforced, in particular our use of the sales productivity of a Sales Leader and the sales representatives that such Sales Leader leads and supervises in
setting his/her salary on a quarterly basis, then we could be sanc-tioned and/or required to change our business model, either of which could signifi cantly harm our business.
Our operations in Mainland China are subject to signifi cant govern-ment scrutiny, and we could be subject to fi nes or other penalties if our sales force engages in activities that violate applicable laws and regulations.
We work diligently to train our sales force in Mainland China on how our Mainland China business model di� ers from our global business model. However, Sales Leaders in Mainland China may attend region-al and global events and foreign Sales Leaders may participate in busi-ness meetings in Mainland China. Because our global model varies signifi cantly from our Mainland China business model, mistakes may be made as to how those working in Mainland China should promote the business in Mainland China. These mistakes by our sales force may lead to governmental reviews and investigations of our operations in Mainland China. For example, as a result of allegations that, among other things, certain of our sales force in Mainland China failed to ad-equately follow and enforce our policies and regulations, Chinese regulators have commenced investigations into our business model and operations in Mainland China. For a further description of these matters, see “– Recent negative news reports in Mainland China have led to investigations by Chinese regulators into our business in Mainland China and caused us to temporarily modify some of our business prac-tices in that market. These modifi cations, any sanctions imposed on us by the Chinese authorities and any associated adverse publicity may harm our business and fi nancial condition.”
The legal system in Mainland China provides governmental au-thorities with broad latitude to conduct investigations and many Chi-nese regulations, including those governing our business, are subject to signifi cant interpretation, which may vary from jurisdiction to juris-diction. We anticipate that our business will continue to attract sig-nifi cant governmental scrutiny, particularly as our business grows and our number of sales representatives continues to increase. At times, investigations and other regulatory actions have limited our ability to conduct business in certain locations in Mainland China, and have resulted in a few cases where we have paid fi nes. We face a risk that future investigations and other regulatory actions may result in fi nes, revocation of licenses or other more signifi cant sanctions.
Our ability to expand our business in Mainland China could be negatively impacted if we are unable to obtain additional necessary national and local government approvals in Mainland China.
We have obtained direct selling licenses in 19 provinces and municipalities in Mainland China. In order to expand our direct selling model into additional provinces, we currently must obtain a series of approvals from district, city, provincial and national government agencies with respect to each province in which we wish to expand. The process for obtaining the necessary government approvals to

17
conduct direct selling continues to evolve and is lengthy, as we are required to work with a large number of provincial, city, district and national government authorities. The complexity of the approval process as well as the government’s continued cautious approach as direct selling develops in Mainland China makes it di� cult to predict the timeline for obtaining these approvals. Furthermore, it is possible that the current government investigations of our business in Mainland China by various regulators may increase the time and dif-fi culty we may face in obtaining additional licenses. If the govern-ment’s evaluation of our direct selling activities results in further delays in obtaining licenses elsewhere, or if the current processes for obtaining approvals are delayed further for any reason or are changed or interpreted di� erently than currently understood, our ability to receive direct selling licenses in Mainland China and our growth prospects in this market, could be negatively impacted.
If we are not able to register products for sale in Mainland China, our business could be harmed.
We face lengthy timelines with respect to product registrations in Mainland China. The process for obtaining product permits and licenses may require extended periods of time that may prevent us from launching new product initiatives in Mainland China on the same timelines as other markets around the world. For example, products marketed in Mainland China as “health foods” are subject to extensive laboratory and clinical analysis by governmental authori-ties, and the product registration process in Mainland China gener-ally takes one to two years, but may be substantially longer. We market both “health foods” and “general foods” in Mainland China. There is some risk associated with the common practice in Mainland China of marketing a product as a “general food” while seeking “health food” classifi cation. If government o� cials feel the categorization of our products is inconsistent with product claims, ingredients or function, this could end or limit our ability to market such products in Mainland China in their current form. In addition, we are not permitted to market or sell “general foods” through our direct sales channel in Mainland China and any e� orts by our direct salespeople to do so could result in negative publicity, fi nes and other government sanctions being imposed against us.
If we are unable to e� ectively manage our rapid growth in Mainland China, our operations could be harmed.
We have experienced rapid growth in Mainland China, which could strain our ability to e� ectively manage our operations. We continue to focus resources to successfully manage the necessary expansion of our management team, labor force, manufacturing operations, government relations e� orts, retail stores and service centers. Insu� cient management of such growth could result in, among other things, product delays or shortages, operating mistakes and errors, inadequate customer service, inappropriate claims or promotions by our sales force, and governmental inquires and inves-
tigations, all of which could harm our revenue and ability to generate sustained growth and result in unanticipated expenses. In addition, we need to continue to attract and develop qualifi ed management personnel to sustain growth in this market. If we are not able to successfully retain existing personnel and identify, hire and integrate new personnel, our business and growth prospects could be harmed.
Our business could be negatively impacted if we fail to execute our product launch process due to increased pressure on our supply chain, information systems and management.
Although our product launch process may vary by market, we generally introduce new products to our sales force and consumers in all markets where the products are registered, through limited-time o� ers. The limited-time o� ers typically generate signifi cant activity and a high level of purchasing, which may result in a higher than nor-mal increase in revenue during the quarter of the limited-time o� er and skew year-over-year and sequential comparisons. We may expe-rience di� culty e� ectively managing growth associated with these limited-time o� ers and may face increased risk of improper sales force activities and related governmental scrutiny. In addition, the size and condensed schedule of these product launches increases pres-sure on our supply chain. If we are unable to accurately forecast sales levels in each market, obtain su� cient ingredients or produce a su� -cient supply to meet demand, we may incur higher expedited ship-ping costs and we may temporarily run out of stock of certain prod-ucts, which could negatively impact the enthusiasm of our sales force and consumers. Conversely, if demand does not meet our expecta-tions for a product launch, we could incur increased inventory write-o� s. For example, given heightened media and regulatory scrutiny in Mainland China and the voluntary measures we have taken in that market, we have adjusted our 2014 product launch plans. This change in plans increases the risk of inventory write-o� s in Mainland China if we are unable to sell the inventory we produced based on our prior plans. Any inventory write-o� would negatively impact our gross margins. In addition, our order processing systems could have di� -culties handling the high volume of orders generated by limited-time o� ers. Although our previous limited-time o� ers have not materially a� ected our product return rate, these events may increase our prod-uct return rate in the future.
If our Galvanic Spa facial unit, ageLOC Body Spa or Pharmanex BioPhotonic Scanner are determined to be medical devices in a particular geographic market or if our sales force uses these products for medical purposes or makes improper medical claims, our ability to continue to market and distribute such tools could be harmed.
One of our strategies is to market unique and innovative products and tools that allow our sales force to distinguish our products, includ-ing our Galvanic Spa facial unit, ageLOC Body Spa or Pharmanex BioPhotonic Scanner. Any determination by regulatory authorities in our markets that these products must receive clearance or be registered

18
as medical devices could restrict our ability to import or sell the prod-uct in such market until registration is obtained. While we have not been required to register our Galvanic Spa facial unit, ageLOC Body Spa or Pharmanex BioPhotonic Scanner as medical devices in most of our markets, we have registered our Galvanic Spa facial unit as a medical device in Indonesia, Thailand and Colombia. In addition, we have received clearance from the United States Food and Drug Adminis-tration to market a facial spa device for over-the-counter use. There have been legislative proposals in Singapore and Malaysia relating to the regulation of medical devices that could a� ect the way we market our Galvanic Spa facial unit, ageLOC Body Spa and Pharmanex BioPhotonic Scanner in these countries. In addition, if our sales force is making medical claims regarding our products or using our products to perform medical diagnoses or other activities limited to licensed professionals or approved medical devices, it could negatively impact our ability to market or sell these products.
Where necessary, obtaining medical device registrations and clearances could require us to provide documentation concerning product manufacturing and clinical utility, to make design, specifi ca-tion and manufacturing process modifi cations to meet standards imposed on medical device companies, and to modify our marketing claims regarding the registered product. While we successfully obtained clearance to market a facial spa device for over-the-counter use in the United States, and registered a facial spa unit as a medical device in Indonesia, Thailand and Colombia, because medical device regulations vary widely from country to country, there can be no assurance we will not face challenges or delays in obtaining clearance in other markets, or that we will be able to make any required modifi -cations or provide documentation necessary to obtain clearance. If we obtain such medical device clearance in order to sell a product in one market, such clearance may be used as precedent for requiring similar approval for the product in another market, or for similar products in the same market. These additional requirements could increase the cost associated with manufacturing and selling these products as non-medical devices in such markets.
Laws and regulations may prohibit or severely restrict direct selling and cause our revenue and profi tability to decline, and regulators could adopt new regulations that harm our business.
Various government agencies throughout the world regulate direct sales practices. Laws and regulations in Japan, South Korea and Mainland China are particularly stringent. These laws and regu-lations are generally intended to prevent fraudulent or deceptive schemes, often referred to as “pyramid” schemes, that compensate participants primarily for recruiting additional participants without signifi cant emphasis on product sales to consumers. The laws and regulations in our current markets often:
• impose order cancellations, product returns, inventory buy-backs and cooling-o� rights for our sales force and consumers;
• require us, or our sales force, to register with government agencies;
• impose caps on the amount of commissions we can pay;
• impose reporting requirements; and
• require that we ensure, among other things, that our sales force maintain levels of product sales to qualify to receive commis-sions and that our sales force is compensated for selling prod-ucts and not for recruiting others.
Complying with these widely varying and sometimes inconsis-tent rules and regulations can be di� cult, time-consuming and ex-pensive, and may require signifi cant resources. The laws and regula-tions governing direct selling are modifi ed from time to time, and, like other direct selling companies, we are subject from time to time to government investigations in our various markets related to our direct selling activities. This can require us to make changes to our business model and aspects of our sales compensation plan in the markets impacted by such changes and investigations. In addition, countries where we currently do business could change their laws or regulations to prohibit direct selling. If we are unable to continue business in existing markets or commence operations in new markets because of these laws, our revenue and profi tability may decline.
Challenges to the form of our network marketing system could harm our business.
We may be subject to challenges by government regulators regarding the form of our network marketing system. Legal and regu-latory requirements concerning the direct-selling industry generally do not include “bright line” rules and are inherently fact-based and subject to interpretation. As a result, regulators and courts have discre-tion in their application of these laws and regulations, and the enforce-ment or interpretation of these laws and regulations by governmental agencies or courts can change. We are aware of pending judicial actions and investigations against other companies in the direct selling industry. Adverse decisions in these cases could impact our business if direct selling laws or anti-pyramid laws are interpreted more narrowly or in a manner that results in additional burdens or restrictions on direct selling companies. We could also be subject to challenges by private parties in civil actions. We are aware of recent civil actions against some of our competitors in the United States, including one involving a sig-nifi cant settlement. Recent allegations by short sellers directed at us and our competitors regarding the legality of multi-level marketing in various markets have also created intense public scrutiny of us and our industry. Our business has also been subject to such formal and informal inquiries from various government regulatory authorities in the past regarding our business and our compliance with local laws and regula-tions. All of these actions and any future governmental scrutiny of us or our industry could generate negative publicity or further regula-

19
tory actions that could result in fi nes, restrict our ability to conduct our business in our various markets, enter into new markets, motivate our sales force and attract consumers.
Government regulations and private party actions relating to the mar-keting and advertising of our products and services may restrict, inhibit or delay our ability to sell our products and harm our business.
Government authorities regulate advertising and product claims regarding the e� cacy and benefi ts of our products. These regulatory authorities typically require adequate and reliable scien-tifi c substantiation to support any marketing claims. What constitutes such reliable scientifi c substantiation can vary widely from market to market and there is no assurance that the research and development e� orts that we undertake to support our claims will be deemed ade-quate for any particular product or claim. If we are unable to show adequate and reliable scientifi c substantiation for our product claims, or our marketing materials or the marketing materials of our sales force make claims that exceed the scope of allowed claims for dietary supplements, cosmetics or tools that we o� er, the FDA or other regulatory authorities could take enforcement action requiring us to revise our marketing materials, amend our claims or stop selling certain products, which could harm our business.
For example, the FDA recently issued warning letters to several cosmetic companies alleging improper structure/function claims regarding their cosmetic products, including, for example, product claims regarding gene activity, cellular rejuvenation, and rebuilding collagen. There is a degree of subjectivity in determining whether a claim is an improper structure/function claim. Given this subjectivity and our research and development focus on the sources of aging and the infl uence of certain ingredients on gene expression, there is a risk that we could receive a warning letter, be required to modify our product claims or take other actions to satisfy the FDA if the FDA determines any of our marketing materials include improper structure/function claims for our cosmetic products. In addition, plainti� s’ lawyers have fi led class action lawsuits against some of our competitors after our competitors received these FDA warning letters. There can be no assurance that we will not be subject to governmental actions or class action lawsuits, which could harm our business.
In the United States, e� ective December 1, 2009, the FTC approved revisions to its Guides Concerning the Use of Endorsements and Testimonials in Advertising, (“Guides”), that require disclosure of material connections between an endorser and the company they are endorsing and generally do not allow marketing using atypical results. Our sales force has historically used testimonials and “before and after” photos to market and sell some of our popular products such as our ageLOC Galvanic Spa systems and ageLOC Transformation anti-aging skin care system. We intend to continue to use testimonials for our popular products, including weight management products. In highly
regulated and scrutinized product categories such as weight manage-ment, if we or our sales force fail to comply with the Guides or make improper product claims, the FTC could bring an enforcement action against us and we could be fi ned and/or forced to alter our marketing materials.
Regulations governing the registration or pre-approval of our products could harm our business.
Our products are subject to numerous domestic and foreign government agencies’ and authorities’ laws and extensive regulations governing the ingredients and products that may be marketed without pre-market approval and/or registration as a drug. Many of these laws and regulations involve a high level of subjectivity, are inherently fact-based and subject to interpretation, and vary signifi -cantly from market to market. These laws and regulations can also limit the claims we can make regarding our products and often restrict our ability to introduce products or ingredients into one or more markets.
At times these laws and regulations may delay or prevent us altogether from launching a product in a market, require us to refor-mulate a product or limit or amend the claims made regarding a product. If these laws and regulations further restrict, inhibit or delay our ability to introduce or market our products or limit the claims we are able to make regarding our products, our business may be harmed.
For example, in the United States some legislators and industry critics have pushed for years to increase regulatory authority by the FDA over nutritional supplements. In 2011, the FDA proposed draft guidance to clarify the FDA’s interpretation of the dietary ingredient notifi cation requirements. This draft guidance is not fi nal yet but appears to indicate that the FDA is expanding its defi nition of what is considered a “new dietary ingredient” in the United States. The industry is providing com-ments and working with the FDA to modify this guidance. If enacted in fi nal form as proposed, however, this guidance could impose new and signifi cant regulatory barriers for our nutritional supplement products or unique ingredients, which could delay or inhibit our ability to formu-late, introduce and sell nutritional supplements as we have in the past.
We face similar pressures in our other markets, including Europe, which is expected to adopt additional regulations setting new limits on acceptable maximum levels of vitamins and minerals. In Europe, for example, we are unable to market supplements that contain ingre-dients that were not marketed in Europe prior to May 1997 (“novel foods”) without going through an extensive registration and pre-market approval process.
Such regulations in any given market can also limit our ability to import products and can delay product launches as we go through

20
the registration and approval process for those products. Further-more, if we fail to comply with these regulations, we could face en-forcement action against us and we could be fi ned, forced to alter or stop selling our products.
New regulations governing the introduction, marketing and sale of our products to consumers could harm our business.
Our operations could be harmed if new laws or regulations are enacted that restrict our ability to market or distribute our products or impose additional burdens or requirements on us in order to continue selling our products. We have observed a general increase in regula-tory activity and activism in the United States and across many mar-kets globally where we operate and the regulatory landscape is be-coming more complex with increasingly strict requirements. If this trend continues, we may fi nd it necessary to alter some of the ways we have traditionally marketed our products in order to stay in com-pliance with a changing regulatory landscape and this could add to the costs of our operations and/or have an adverse impact on our business.
Our operations could be harmed if we are found not to be in com-pliance with Good Manufacturing Practices.
In the United States, FDA regulations on Good Manufacturing Practices and Adverse Event Reporting requirements for the nutri-tional supplement industry require us and our vendors to maintain good manufacturing processes, including stringent vendor qualifi ca-tions, ingredient identifi cation, manufacturing controls and record keeping. The ingredient identifi cation requirement, which requires us to confi rm the levels, identity and potency of ingredients listed on our product labels within a narrow range, is particularly burdensome and di� cult for us with respect to a product like LifePak Nano, which con-tains as many as 36 di� erent ingredients. We are also required to re-port serious adverse events associated with consumer use of our products. Our operations could be harmed if regulatory authorities make determinations that we, or our vendors, are not in compliance with these regulations or public reporting of adverse events harms our reputation for quality and safety. A fi nding of noncompliance may result in administrative warnings, penalties or actions impacting our ability to continue selling certain products. In addition, compli-ance with these regulations has increased and may further increase the cost of manufacturing certain of our products as we work with our vendors to assure they are qualifi ed and in compliance.
The loss of suppliers or shortages in ingredients could harm our business.
We acquire ingredients and products from third-party suppliers and manufacturers. A loss of any of these suppliers and any di� cul-ties in fi nding or transitioning to alternative suppliers could harm our business. In addition, we obtain some of our products, including our ageLOC Galvanic Spa systems and Tru Face Essence products from
sole suppliers that own or control the product formulations, ingredi-ents, or other intellectual property rights associated with such prod-ucts. We also license the right to distribute some of our products from third parties. In the event we are unable to renew these con-tracts, we may need to discontinue some products or develop substi-tute products, which could harm our revenue. In addition, if we expe-rience supply shortages or regulatory impediments with respect to the raw materials and ingredients we use in our products, we may need to seek alternative supplies or suppliers and may experience di� culties in fi nding ingredients that are comparable in quality and price. Some of our nutritional products, including g3 juice, incorpo-rate natural products that are only harvested once a year and may have limited supplies. If demand exceeds forecasts, we may have di� culties in obtaining additional supplies to meet the excess demand until the next growing season. If we are unable to successfully respond to such issues, our business could be harmed.
Product diversion to certain markets, including Mainland China, may have a negative impact on our business.
From time to time, we see our products being sold through online or other distribution channels in certain markets. Although we have taken steps to try to control this activity, particularly for products sold in Mainland China, product diversion continues to be a chal-lenge. Product diversion causes confusion regarding our distribution channels and negatively impacts the ability of our sales force to sell our products. It also creates a negative impression regarding the viability of the business opportunity for our sales force, which can harm our ability to recruit new people to join our sales force. Product diversion schemes may also involve illegal importation, investment or other activities. If we are unable to e� ectively address this issue or if diversion increases, our business could be harmed.
Changes to our sales compensation plans could be viewed nega-tively by some of our sales force, could fail to achieve desired long-term results and have a negative impact on revenue.
Our sales compensation plans include some components that di� er from market to market. We modify components of our sales compensation plans from time to time to keep our sales compensa-tion plans competitive and attractive to our existing sales force and people interested in joining our sales force, to address changing market dynamics, to provide incentives to our sales force that we believe will help grow our business, to conform to local regulations and to address other business needs. Because of the size of our sales force and the complexity of our sales compensation plans, it is di� cult to predict how such changes will be viewed by our sales force and whether such changes will achieve their desired results. For example, certain changes we made to our sales compensation plan in the past, which were successful in several markets, did not achieve anticipated results in certain other markets and negatively impacted our business.

21
In addition, we have been required to modify our compensation plan in South Korea from time to time to stay within the 35% commis-sion cap established by statute in that market. Because commissions, as a percentage of revenue, can fl uctuate as distributor productivity fl uctuates, we may be required to make further changes to stay with-in the cap in this market or may be at risk of exceeding the cap. Changes to reduce commission payout have had a negative impact on the sales force in the past and could in the future. Any failure to keep commission payout within the cap in South Korea could result in fi nes or other sanctions.
Production di� culties, quality control problems and inaccurate forecasting could harm our business.
Production di� culties and quality control problems and our reliance on third party suppliers to deliver quality products in a timely manner could harm our business. Occasionally, we have experienced production di� culties with respect to our products, including the import or export of ingredients and delivery of products that do not meet our specifi ca-tions and quality control standards. These quality problems have in the past, and could in the future, result in stock outages or shortages in our markets with respect to such products, harming our sales and creating inventory write-o� s for unusable products.
Adverse publicity concerning our business, marketing plan, prod-ucts or people could harm our business and reputation.
Growth in our sales force and consumers and our results of operations can be particularly impacted by adverse publicity regard-ing us, the nature of our direct selling business models, our products or the actions of our sales force and employees. Given the nature of our operations and our continuous need to recruit and retain consumers and members of our sales force, we are particularly vulnerable to adverse publicity. Specifi cally, we are susceptible to adverse publicity concerning:
• suspicions about the legality and ethics of network marketing;
• recent negative news reports in Mainland China regarding our business in Mainland China;
• recent reports that Chinese regulators have initiated investiga-tions relating to our business in Mainland China;
• the safety or e� ectiveness of ingredients in our or our com-petitors’ products;
• regulatory investigations of us, our competitors and our respective products;
• the actions of our current or former members of our sales force and employees; and
• public perceptions of the direct selling industry or the nutri-tional or personal care industry generally.
In addition, in the past we have experienced negative publicity that has harmed our business in connection with regulatory investiga-tions and inquiries. Critics of our industry, short sellers and other indi-viduals who want to pursue an agenda have in the past and may in the future utilize the Internet, the press and other means to publish criticisms of the industry, our company and our competitors, or make allegations regarding our business and operations, or the business and operations of our competitors. We or others in our industry may receive similar negative publicity or allegations in the future, and it may harm our business and reputation.
Non-compliance with anti-corruption laws could harm our business.Our international operations are subject to anti-corruption laws,
including the Foreign Corrupt Practices Act (the “FCPA”). Any allegations that we are not in compliance with anti-corruption laws may require us to dedicate time and resources to an internal investi-gation of the allegations or may result in a government investigation. Any determination that our operations or activities are not in compli-ance with existing anti-corruption laws or regulations could result in the imposition of substantial fi nes, and other penalties from U.S. or other regulatory entities. Although we have implemented anti-cor-ruption policies, controls and training globally to protect against violation of these laws, we cannot be certain that these e� orts will be e� ective. We are aware that one of our competitors is under investi-gation in the United States for allegations that its employees violated the FCPA in Mainland China and other markets. If this investigation causes adverse publicity or increased scrutiny of our industry, our business could be harmed.
Our ability to conduct business in international markets may be af-fected by political, legal, tax and regulatory risks.
Our ability to capitalize on growth in new international markets and to maintain the current level of operations in our existing interna-tional markets is exposed to risks associated with our international operations, including:
• the possibility that a foreign government might ban or severely restrict our business method of direct selling, or that local civil unrest, political instability or changes in diplomatic or trade relationships might disrupt our operations in an international market;
• the lack of well-established or reliable legal systems in certain areas where we operate;
• the presence of high infl ation in the economies of international markets in which we operate;

22
• the possibility that a government authority might impose legal, tax or other fi nancial burdens on us or our sales force, due, for example, to the structure of our operations in various markets;
• the possibility that a government authority might challenge the status of our sales force as independent contractors or impose employment or social taxes on our sales force; and
• the possibility that governments may impose currency remit-tance restrictions limiting our ability to repatriate cash.
We depend on our key personnel, and the loss of the services provided by any of our executive o� cers or other key employees could harm our business and results of operations.
Our success depends to a signifi cant degree upon the continued contributions of our senior and regional management, many of whom would be di� cult to replace. We currently have expatriates serving in key management positions in certain markets, including Mainland China, South Korea and Japan. Our senior and regional management employees may voluntarily terminate their employment with us at any time. In addition, we need to continue to attract and develop qualifi ed management personnel to sustain growth in our markets. If we are not able to successfully retain existing personnel and identify, hire and integrate new personnel, our business and growth prospects could be harmed.
Inability of products and other initiatives to gain or maintain sales force and market acceptance could harm our business.
Our operating results could be adversely a� ected if our products, business opportunities, and other initiatives do not generate su� cient enthusiasm and economic benefi t to retain our existing consumers and sales force or to attract new consumers and people interested in joining our sales force. Potential factors a� ecting the attractiveness of our prod-ucts, business opportunities, and other initiatives include, among other items, perceived product quality, product exclusivity or e� ectiveness, economic success in our business opportunity, adverse media attention, or regulatory restrictions on claims.
In addition, our ability to develop and introduce new products could be impacted by, among other items, government regulations, the inability to attract and retain qualifi ed research and development sta� , the termination of third-party research and collaborative arrangements, intellectual property of competitors that may limit our ability to o� er innovative products or that challenge our own intel-lectual property, and di� culties in anticipating changes in consumer tastes and buying preferences.
In the second half of 2013, we introduced our ageLOC TR90weight management and body shaping system globally through lim-ited-time o� ers. Weight management is a challenging product
category. Frequently, consumers have unrealistic product expecta-tions and weight loss goals. There are also wide ranges in the degree of individual compliance with any weight management program, which can signifi cantly impact consumer success and satisfaction.
Our TR90 system consists of shakes and nutritional supple-ments, an eating plan, and exercise recommendations to encourage sustained changes to both eating habits and lifestyle. The TR90 sys-tem is designed to promote healthy weight loss and body composi-tion rather than to rapidly maximize gross weight loss. For example, the TR90 shakes and eating plan promote consumption of lean pro-tein throughout the day to support metabolism and lean body mass, thereby increasing the daily amount of time when the body is burning more calories from fat than muscle for a more healthy overall body composition.
Unrealistic expectations, non-compliance, and misunderstanding of the TR90 approach to healthy weight loss and body composition have contributed to some initial reports of consumer dissatisfaction with the TR90 program. We currently plan to simplify the key com-ponents of the TR90 eating plan and take steps to strengthen the training of our sales force with respect to healthy weight loss and body composition. Our operating results could be adversely impacted if any of our products, including TR90, fail to gain or maintain sales force and market acceptance.
In addition, in our more mature markets, one of the challenges we face is keeping Sales Leaders with established businesses and high income levels motivated and actively engaged in business building activities and in developing new Sales Leaders. There can be no assurance that our initiatives will continue to generate excitement among our sales force in the long-term or that planned initiatives will be successful in maintaining sales force activity and productivity or in motivating Sales Leaders to remain engaged in business building and developing new Sales Leaders. Some initiatives may have unantici-pated negative impacts on our sales force, particularly changes to our sales compensation plans. The introduction of a new product or key initiative can also negatively impact other product lines to the extent our Sales Leaders focus their e� orts on the new product or initiative. In addition, if any of our products fails to gain acceptance, we could see an increase in product returns.
The loss of key Sales Leaders could negatively impact our growth and our revenue.
As of December 31, 2013, we had a global network of approxi-mately 1,335,000 Actives. More than 102,000 of our Actives were Sales Leaders. Less than 1,500 Sales Leaders occupied the highest level under our global sales compensation plan as of that date. These Sales Leaders, together with their extensive sales networks, generate sub-stantially all of our revenue. As a result, the loss of a high-level Sales

23
Leader or a group of leading Sales Leaders, whether by their own choice or through disciplinary actions by us for violations of our policies and procedures, could negatively impact our growth and our revenue.
Government authorities may question our tax positions or transfer pricing policies or change their laws in a manner that could increase our e� ective tax rate or otherwise harm our business.
As a U.S. company doing business in international markets through subsidiaries, we are subject to various tax laws and intercom-pany pricing regulations, including those relating to the fl ow of funds between our corporate entities. From time to time, we are audited by tax regulators in the United States and in our foreign markets. If regu-lators challenge our tax positions, corporate structure, transfer pricing methodologies, or intercompany transfers, we may be subject to penalties, interest, and payment of back taxes. This may increase our e� ective tax rate and our operations may be harmed. Tax rates vary from country to country, and, if a foreign tax authority determines that our profi ts in that jurisdiction need to be increased, we may not be able to fully utilize all foreign tax credits that are generated, which may increase our e� ective tax rate. The various customs, exchange control, and transfer pricing laws are continually changing and are further subject to interpretation by government agencies. We have experienced increased e� orts by customs authorities in some countries to reclassify our products or otherwise increase the level of duties we pay on our products. Despite our best e� orts to be aware of and comply with such laws and changes to and interpretations thereof, there is a risk that we may be out of compliance with such laws. We may need to adjust our operating procedures in response to such changes, and as a result, our business may su� er.
We may be held responsible for certain taxes or assessments relating to the activities of our independent distributors, which could harm our fi nancial condition and operating results.
Our independent distributors are subject to taxation, and in some jurisdictions, governmental agencies impose an obligation on us to collect taxes and to maintain appropriate records. Furthermore, in some jurisdictions, we are subject to the risk of being responsible for social security and similar taxes with respect to our independent distributors. In the event that local laws and regulations, or the inter-pretation of local laws and regulations, change to require us to treat our independent distributors as employees, or that our independent distributors are deemed by local regulatory authorities in one or more of the jurisdictions in which we operate to be our employees rather than independent contractors under existing laws and interpreta-tions, we may be held responsible for social security and related taxes in those jurisdictions, plus any related assessments and penalties, which could harm our fi nancial condition and operating results. If our independent distributors were deemed to be employees rather than independent contractors, we would also face the risk of increased liability for their actions.
The loss of or a disruption in our manufacturing and distribution operations could adversely a� ect our business.
As of December 31, 2013, our principal properties consisted of distribution centers, pick-up locations, our corporate headquarters and other o� ce locations, research and development facilities, manu-facturing facilities, and retail stores and service centers in Mainland China. Additionally, we also use third party manufacturers to manu-facture certain of our products. As a company engaged in manufac-turing, distribution and research and development on a global scale, we are subject to the risks inherent in such activities, including indus-trial accidents, environmental events, fi res, strikes and other labor or industrial disputes, disruptions in logistics or information systems, loss or impairment of key manufacturing or distribution sites, product quality control, safety, licensing requirements and other regulatory or government issues, as well as natural disasters, pandemics, border disputes, acts of terrorism and other external factors over which we have no control. For example, the earthquake and tsunami in 2011 disrupted our operations in Japan and negatively impacted our oper-ating results. These risks may be exacerbated by our e� orts to increase facility consolidation covering our manufacturing, distribu-tion and supply footprints or if we are unable to successfully enhance our disaster recovery planning. The loss of, or damage to, any of our facilities or centers, or that of our third party manufacturers could have a material adverse e� ect on our business, results of operations and fi nancial condition.
Disruptions to transportation channels that we use to distribute our products to international warehouses may adversely a� ect our margins and profi tability in those markets.
We may experience disruptions to the transportation channels used to distribute our products, including increased airport and shipping port congestion, a lack of transportation capacity, increased fuel expenses, and a shortage of manpower. Disruptions in our container shipments may result in increased costs, including the additional use of airfreight to meet demand. Although we have not recently experienced signifi cant shipping disruptions, we continue to watch for signs of upcoming con-gestion. Congestion to ports can a� ect previously negotiated contracts with shipping companies, resulting in unexpected increases in shipping costs and reduction in our profi tability.
Our markets are intensely competitive and market conditions and the strengths of competitors may harm our business.
The markets for our products are intensely competitive. Our results of operations may be harmed by market conditions and competition in the future. Many competitors have much greater name recognition and fi nancial resources than we have, which may give them a competitive advantage. For example, our Nu Skin products compete directly with branded, premium retail products. We also compete with other direct selling organizations. Because of regulatory restrictions concerning claims about the e� cacy of personal care products and dietary supplements,

24
we may have di� culty di� erentiating our products from our competitors’ products, and competing products entering the personal care and nutritional market could harm our revenue.
We also compete with other direct selling companies to attract and retain our sales force and consumers. Some of these competitors have longer operating histories and greater visibility, name recognition and fi nancial resources than we do. Some of our competitors have also adopted and could continue to adopt some of our successful business strategies, including our global sales compensation plan. Consequent-ly, to successfully compete in this industry, and attract and retain our sales force and consumers, we must ensure that our business opportu-nities and sales compensation plans are fi nancially rewarding. We believe we have signifi cant competitive advantages, but we cannot assure that we will be able to continue to successfully compete in this industry.
We may incur product liability claims that could harm our business. We sell products for human consumption and use. Our dietary
supplement products consist of vitamins, minerals, botanicals and other ingredients that are classifi ed as foods or dietary supplements. Our personal care products are cosmetic and other beautifying products intended to be used on the body and skin. These products are not generally subject to pre-market approval or registration pro-cesses so we cannot rely upon a government safety panel to qualify or approve our products for use, and some ingredients may not have long histories of human consumption or use. We rely upon published and unpublished safety information including clinical studies on ingredients used in our products and conduct our own clinical studies on some key ingredients and products, but not all products. A product may be safe for the general population when consumed or used as directed but could cause an adverse reaction for a person who has a health condition or allergies, or who is taking a prescription medication. While we include what we believe are adequate instructions and warnings and we have historically had low numbers of reported reac-tions, previously unknown adverse reactions could occur. Recent media reports in Mainland China included allegations about our products having harmful side e� ects for certain of our consumers. While we believe these are isolated incidents, we are investigating these allegations. If we discover that our products are causing adverse reactions in a large number of individuals, or if we determine that any of our employees have not properly handled reports of adverse reactions, we could su� er further adverse publicity or governmental sanctions.
As a result of the type of products that we sell, we may be subject to various product liability claims, including that the products fail to meet quality or manufacturing specifi cations, contain contami-nants, include inadequate instructions as to their proper use, include inadequate warnings concerning side e� ects and interactions with other substances or for persons with health conditions or allergies, or
cause adverse reactions or side e� ects. Product liability claims could increase our costs, and adversely a� ect our business and fi nancial results. As we continue to o� er an increasing number of new prod-ucts through larger scale limited-time o� ers our product liability risk may increase.
If our sales force or employees provide improper or inappropriate advice regarding our products, their use or safety, we may be subject to additional product liability.
We have elected to self-insure our product liability risks. We continue to periodically evaluate whether we can and should obtain product liability insurance. Based upon our current approach to product liability risk management if any of our products are found to cause any injury or damage or we become subject to product liability claims, we will be subject to the full amount of liability associated with any injuries or damages. This liability could be substantial and may exceed our existing reserves and harm our business.
We are involved, and may become involved in the future, in legal proceedings that, if adversely adjudicated or settled, could adversely a� ect our fi nancial results.
In addition to the securities class action and shareholder deriva-tive litigation described above in “– We are currently being sued in several purported class action lawsuits and a derivative claim relating to the recent negative media and regulatory scrutiny of our business in Mainland China and the associated decline in our stock price,” we are currently, and may in the future become, party to other litigation. In general, litigation claims can be expensive and time consuming to bring or defend against and could result in settlements or damages that could signifi cantly a� ect fi nancial results. We are currently vigor-ously contesting these litigation claims. However, it is not possible to predict the fi nal resolution of the litigation to which we currently are or may in the future become party to, and the impact of certain of these matters on our business, results of operations and fi nancial condition could be material.
We have been involved in two separate disputes with customs authorities in Japan with respect to duty assessments on several of our products. In November 2013, the Supreme Court of Japan declined to hear our appeal regarding a dispute related to additional customs assessments made by Yokohama Customs for the period of October 2002 through July 2005. In 2011, we recorded an expense for the full amount of these disputed assessments. This matter is now closed. The second dispute relates to additional customs assess-ments made by Yokohama Customs for the period of October 2006 through September 2009 in connection with post-importation audits, as well as the disputed portion of our import duties from October 2009 to the present, which we have or will hold in bond or pay under protest. The aggregate amount of these assessments and

25
disputed duties was 4.2 billion Japanese yen as of December 31, 2013 (approximately $40.2 million), net of any recovery of consumption taxes. In addition, we are currently being required to post a bond or make a deposit equal to the di� erence between our declared duties and the amount the customs authorities have determined we should be paying on all current imports. We are now pursuing this matter in Tokyo District Court. Any adverse rulings in these matters could materially impact our results. While we anticipate that additional duty disputes with Japanese authorities will be limited going forward as we have entered into an arrangement to purchase a majority of the a� ected products in Japan from a Japanese company that purchases and imports the products from the manufacturer, there can be no assurance that this arrangement will have the desired e� ect or that such arrangement will not be terminated in the future.
Please refer to Item 3. “Legal Proceedings” for more information regarding these litigation matters.
Our intellectual property may infringe on the rights of others, resulting in costly litigation.
In recent years, there has been signifi cant litigation in the United States involving patents and other intellectual property rights. In particular, there has been an increase in the fi ling of suits alleging infringement of intellectual property rights, which pressure defendants into entering settlement arrangements quickly to dispose of such suits, regardless of their merit. Other companies or individuals may allege that we, or our sales force, consumers, licensees or other parties indemnifi ed by us infringe on their intellectual property rights. Even if we believe that such claims are without merit, defending such intel-lectual property litigation can be costly, distract management’s attention and resources, and the outcome is inherently uncertain. Claims of intel-lectual property infringement also might require us to redesign a� ected products, enter into costly settlement or license agreements, pay costly damage awards, or face a temporary or permanent injunction prohibiting us from marketing or selling certain of our products. Any of these results may adversely a� ect our fi nancial condition.
If we are unable to protect our intellectual property rights, our abil-ity to compete could be negatively impacted.
The market for our products depends to a signifi cant extent upon the value associated with our product innovations and our brand equity. We rely upon patent, copyright, trademark and trade secret laws in the United States and similar laws in other countries, and non-disclosure, confi dentiality and other types of agreements with our employees, sales force, consumers, suppliers and other parties, to establish, maintain and enforce our intellectual property rights. Despite these measures, any of our intellectual property rights could be challenged, invalidated, circumvented or misappropriated, or such intellectual property rights may not be su� cient to permit us
to provide competitive advantages, which could result in costly product redesign e� orts, discontinuance of certain product o� erings or other competitive harm. In addition, the laws of certain foreign countries, including emerging markets such as Mainland China, do not protect our intellectual property rights to the same extent as the laws of the United States. The costs required to protect our patents and trade-marks may be substantial. We have fi led patent applications to protect our intellectual property rights in our new technologies, however, there can be no assurance that our patent applications will be approved, that any patents issued will adequately protect our intel-lectual property, or that such patents will not be challenged by third parties or found by a judicial authority to be invalid or unenforceable. Moreover, many of our products rely on technologies developed or licensed by third parties, and we may not be able to obtain or continue to obtain licenses and technologies from these third parties on reasonable terms or at all.
To enforce and protect our intellectual property rights, we may initiate litigation against third parties, such as patent infringement suits or interference proceedings. Any lawsuits that we initiate could be expensive, take signifi cant time and divert management’s atten-tion from other business concerns. Litigation also puts our patents at risk of being invalidated or interpreted narrowly and our patent applications at risk of not issuing. Additionally, we may provoke third parties to assert claims against us. We may not prevail in any lawsuits that we initiate and the damages or other remedies awarded, if any, may not be commercially valuable. The occurrence of any of these events may adversely a� ect our fi nancial condition.
If we are unable to protect the confi dentiality of our proprietary information and know-how, the value of our products could be adversely a� ected.
In addition to patented technology, we rely on our unpatented proprietary technology, trade secrets, processes and know-how. De-spite these measures, any of our intellectual property rights could be challenged, invalidated, circumvented or misappropriated. We gen-erally seek to protect this information by confi dentiality, non-disclo-sure and assignment of invention agreements with our employees, consultants, scientifi c advisors and third parties. Our employees may leave to work for competitors. These agreements may be breached, and we may not have adequate remedies for any such breach. In ad-dition, our trade secrets may be disclosed to or otherwise become known or be independently developed by competitors. To the extent that our current or former employees, consultants or contractors use intellectual property owned by others in their work for us, disputes may arise as to the rights in related or resulting know-how and inven-tions. If, for any of the above reasons, our intellectual property is dis-closed or misappropriated, it would harm our ability to protect our rights and adversely a� ect our fi nancial condition.

26
We may be subject to claims that we, or our employees, have inad-vertently or otherwise used or disclosed alleged trade secrets or other proprietary information of our employees’ former employers.
We employ individuals who were previously employed at other personal care product or nutritional supplement companies, includ-ing our competitors or potential competitors. To the extent that our employees are involved in research areas that are similar to those in which they were involved with their former employers, we may be subject to claims that such employees have inadvertently or other-wise used or disclosed the alleged trade secrets or other proprietary information of the former employers. Litigation may be necessary to defend against such claims.
Any future acquisitions may expose us to additional risks. From time to time we review acquisition prospects that would
complement our current product o� erings, increase the size and geographic scope of our operations or otherwise o� er growth and operating e� ciency opportunities. The fi nancing for any of these ac-quisitions could dilute the interests of our stockholders, result in an increase in our indebtedness or both. Acquisitions may entail numer-ous risks, including:
• di� culties in assimilating acquired operations or products, in-cluding the loss of key employees from acquired businesses and disruption to our direct selling channel;
• diversion of management’s attention from our core business;
• adverse e� ects on existing business relationships with our sup-pliers, sales force or consumers; and
• risks associated with entering markets in which we have limited or no prior experience.
Our failure to successfully complete the integration of any ac-quired business could have a material adverse e� ect on our business, fi nancial condition and operating results. In addition, there can be no assurance that we will be able to identify suitable acquisition candi-dates or consummate acquisitions on favorable terms.
Any failure of our internal controls over fi nancial reporting or our compliance e� orts could harm our stock price and our fi nancial and operating results or could result in fi nes or penalties.
We have implemented internal controls to help ensure the ac-curacy of our fi nancial reporting and have implemented compliance policies and programs to help ensure that our employees and sales force comply with applicable laws and regulations. Our internal audit team regularly audits our internal controls and various aspects of our business and we regularly assess the e� ectiveness of our internal con-trols. There can be no assurance, however, that these internal or ex-
ternal assessments and audits will identify all signifi cant or material weaknesses in our internal controls. Any failure to correct a weakness in internal controls could result in the disclosure of a material weak-ness. If a material weakness results in a material misstatement in our fi nancial results, we may also have to restate our fi nancial statements.
From time to time, we initiate further investigations into our business operations based on the results of these audits or com-plaints, questions, or allegations made by employees or other parties regarding our business practices and operations. In addition, our business and operations may be investigated by applicable govern-ment authorities. In the event any of these investigations identify ma-terial violations of applicable laws by our employees or our sales force, we could be subject to adverse publicity, fi nes, penalties or loss of li-censes or permits.
System failures could harm our business. With global operations and a complex sales compensation plan,
our business is highly dependent on e� ciently functioning informa-tion technology systems. Our systems may be damaged or disrupted by fi res, fl oods, earthquakes or other natural disasters, telecommuni-cations failures, break-ins, sabotage, intentional acts of vandalism and similar misconduct. We have adopted and implemented a Business Continuity/Disaster Recovery Plan. Our data is archived and stored at third-party secure sites and we have recovery sites for certain criti-cal data and operations. Growth in our business could also strain our systems. There can be no assurance that our systems will not be sig-nifi cantly damaged or disrupted or that our systems will be adequate to meet our future business needs or that a system failure will not signifi cantly damage the Company’s reputation.
Cyber security risks and the failure to maintain the integrity of com-pany, employee, sales force or guest data could expose us to data loss, litigation and liability, and our reputation could be signifi cantly harmed.
We collect and retain large volumes of company, employee, sales force and guest data, including credit card numbers and other personally identifi able information, for business purposes, including for transactional and promotional purposes, and our various informa-tion technology systems enter, process, summarize and report such data. The integrity and protection of this data is critical to our busi-ness. We are subject to signifi cant security and privacy regulations, as well as requirements imposed by the credit card industry. Maintaining compliance with these evolving regulations and requirements could be di� cult and may increase our expenses. In addition, a penetrated or compromised data system or the intentional, inadvertent or negli-gent release or disclosure of data could result in theft, loss or fraudu-lent or unlawful use of company, employee, sales force or guest data which could harm our reputation, disrupt our operations, or result in remedial and other costs, fi nes or lawsuits.

27
Epidemics and other crises could negatively impact our business. Due to the person-to-person nature of direct selling, our results
of operations could be harmed if the fear of a communicable and rapidly spreading disease or other crises such as natural disasters re-sult in travel restrictions or cause people to avoid group meetings or gatherings or interaction with other people. For example, a SARS epidemic in Asia negatively impacted our revenue in 2003. It is di� -cult to predict the impact on our business, if any, of a recurrence of SARS, the emergence of new epidemics, or other crises. In addition, most of our Pharmanex nutritional supplement revenue is generated from products that are encapsulated in bovine- and/or porcine-sourced gel capsules. If we experience production di� culties, quality control problems, or shortages in supply in connection with bovine or porcine related health concerns, this could result in additional risk of product shortages or write-o� s of inventory. We may be unable to introduce our products in some markets if we are unable to obtain the necessary regulatory approvals or if any product ingredients are prohibited, which could harm our business.
The market price of our Class A common stock is subject to signifi -cant fl uctuations due to a number of factors that are beyond our control.
Our Class A common stock closed at $49.95 per share on January 31, 2012 and closed at $85.15 per share on January 31, 2014. During this two-year period, our Class A common stock traded as low as $32.36 per share and as high as $140.50 per share. Many factors, including some we may be unable to control, could cause the market price of our Class A common stock to fall. Some of these factors include:
• fl uctuations in our operating results;
• government investigations of our business;
• adverse publicity related to our business, products, industry or competitors;
• the sale of shares of Class A common stock by signifi cant stockholders;
• general trends in the market for our products;
• acquisitions by us or our competitors;
• economic or currency exchange issues in markets in which we operate;
• changes in estimates of our operating performance or changes in recommendations by securities analysts;
• speculative trading, including short selling and options trading; and
• general business and political conditions.
Broad market fl uctuations could also lower the market price of our Class A common stock regardless of our actual operating perfor-mance.
Some of the markets in which we operate may become highly infl a-tionary, which could negatively impact our fi nancial position, results of operations or cash fl ows.
In some of our markets we face risks associated with high levels of infl ation. High levels of infl ation and currency devaluations in any of our markets could negatively impact our balance sheet and results of operations.
For example, in 2010, Venezuela was designated as a highly infl ationary economy under generally accepted accounting principles in the United States. In February 2013, Venezuela devalued its bolivar fuertes (“bolivar”) against the U.S. dollar, which resulted in an o� cial exchange rate of 6.3. Due to the current political and economic envi-ronment in Venezuela, there is a risk that there could be additional foreign currency devaluations.
The functional currency in highly infl ationary economies is the U.S. dollar and transactions denominated in the local currency are re-measured as if the functional currency were the U.S. dollar. The re-measurement of local currencies into U.S. dollars creates transla-tion adjustments, which are included in the consolidated statements of operations. A country is considered to have a highly infl ationary economy if it has a cumulative infl ation rate of approximately 100% or more over a three-year period as well as other qualitative factors including historical infl ation rate trends (increasing and decreasing), the capital intensiveness of the operation and other pertinent eco-nomic factors. During 2010, Venezuela was considered to be highly infl ationary, as noted above. During the periods ended December 31, 2011, 2012 and 2013, our Venezuelan subsidiary’s net sales revenue represented approximately 0.3%, 0.7% and 1.1% of consolidated net sales revenue, respectively. We did not operate in any country other than Venezuela that was considered to have a highly infl ationary economy during the periods ended December 31, 2011, 2012 and 2013.
Some of the markets in which we operate have currency controls in place, which may restrict our repatriation of cash.
If foreign governments restrict transfers of cash out of their country and control exchange rates, we may be limited as to the timing and amount of cash we can repatriate and may not be able to repatriate cash at benefi cial exchange rates, which could have a material adverse e� ect on our fi nancial position, results of operations or cash fl ows.

28
We typically fund the cash requirements of our operations in the U.S. through intercompany charges for products, license fees and corporate services. However, in some markets such as Mainland China, where we have lower intercompany charges, we may be unable to repatriate cash from current operations in the form of dividends until we fi le the necessary statutory fi nancial statements for the relevant period. As of December 31, 2013, we had approximately $256 million in cash denominated in Chinese yuan.
In addition, as of December 31, 2013, we had approximately $34 million in cash denominated in bolivar. Currency exchange restrictions enacted by the government of Venezuela require approval from the government’s currency control organization for our subsidiary in Venezuela to obtain U.S. dollars at an o� cial exchange rate to pay for imported products or to repatriate dividends to the United States.
ITEM 1B. UNRESOLVED STAFF COMMENTS
None.
ITEM 2. PROPERTIES
Our principal properties consist of the following:
O� ces. We have administrative o� ces at our corporate head-quarters in Provo, Utah, and in various markets, including in Shanghai, China; Seoul, Korea; Tokyo, Japan; Singapore; and Brussels, Belgium:
Distribution Centers. We distribute our products through distri-bution centers and warehouses in many of our markets, including facilities measuring 150,000 square feet or more in Provo, Utah; Shanghai, China; Chungcheong buk-do, Korea; and Tokyo, Japan.
Research and Development Centers. We operate research and development centers in Provo, Utah, and in Shanghai, China.
Manufacturing Facilities. In Mainland China, we operate manu-facturing facilities, totaling approximately 600,000 square feet. We are currently in the process of expanding our manufacturing capacity in Mainland China.
Retail Stores, Service Centers, Walk-in Centers and Pick-up Locations. We operate walk-in centers and pick-up locations in many of our markets. We also operate retail stores and service centers in Mainland China.
We own our corporate headquarters buildings, distribution center and research and development center located in Provo, Utah and a few other minor facilities. We currently lease the other properties described above. We believe that our existing and planned facilities are adequate for our current operations in each of our existing markets.
ITEM 3. LEGAL PROCEEDINGS
SECURITIES CLASS ACTIONSBeginning in January 2014, fi ve purported class action complaints were fi led in the United States District Court for the District of Utah: Freed-man v. Nu Skin Enterprises, Inc.; Bennett v. Nu Skin Enterprises, Inc.; Zapata v. Nu Skin Enterprises, Inc.; Siesser v. Nu Skin Enterprises, Inc.; and Granzow v. Nu Skin Enterprises, Inc. (collectively, the “Class Action Complaints”). The Class Action Complaints purport to assert claims on behalf of certain of our stockholders under Section 10(b) of the Securities Exchange Act of 1934 and Rule 10b-5 thereunder against Nu Skin Enterprises, Ritch N. Wood, and M. Truman Hunt and to assert claims under Section 20(a) of the Securities Exchange Act of 1934 against Messrs. Wood and Hunt. The Class Action Complaints allege that, inter alia, we made materially false and misleading state-ments regarding our sales operations in and fi nancial results derived from Mainland China, including purportedly operating a pyramid scheme based on illegal multi-level marketing activities. The cases are all in their early stages, and we have not yet fi led a response. Nevertheless, we believe that these claims are without merit and intend to vigor-ously defend ourselves against the allegations in these actions.
SHAREHOLDER DERIVATIVE CLAIMOn February 14, 2014, a shareholder derivative complaint was fi led in the United States District Court for the District of Utah: Suderov v. Hunt (the “Derivative Complaint”). The Derivative Complaint purports to assert claims on behalf of Nu Skin Enterprises for breach of fi duciary duties for disseminating false and misleading information and for failing to maintain internal controls, unjust enrichment, abuse of control, and gross mismanagement against M. Truman Hunt, Ritch N. Wood, Steven J. Lund, Nevin N. Andersen, Neil O� en, Daniel W. Campbell, Andrew W. Lipman, Patricia A. Negrón, Thomas R. Pisano, and nominally against Nu Skin Enterprises. The Derivative Complaint also purports to assert claims on behalf of Nu Skin Enter-prises for breach of fi duciary duties for insider selling and misappro-priation of information against Messrs. Wood, Lund, and Campbell. The Derivative Complaint alleges that, inter alia, all of these o� cers and directors allowed materially false and misleading statements to be made regarding our sales operations in and fi nancial results derived from Mainland China, including purportedly operating a pyramid scheme based on illegal multi-level marketing activities, and that certain o� cers and directors sold common stock on the basis of

29
this material, adverse non-public information. The case is in its early stages, and we have not yet fi led a response.
JAPAN CUSTOMSWe have been involved in two separate disputes with customs authorities in Japan with respect to duty assessments on several of our products. In November 2013, the Supreme Court of Japan declined to hear our appeal regarding a dispute related to additional customs assessments made by Yokohama Customs for the period of October 2002 through July 2005. In 2011, we recorded an expense for the full amount of these disputed assessments. This matter is now closed.
The second dispute relates to additional customs assessments made by Yokohama Customs for the period of October 2006 through September 2009 in connection with post-importation audits, as well as the disputed portion of our import duties from October 2009 to the present, which we have or will hold in bond or pay under protest. Additional assessments related to any prior period are barred by applicable statutes of limitations. The aggregate amount of these assessments and disputed duties was 4.2 billion Japanese yen as of December 31, 2013 (approximately $40.2 million), net of any recovery of consumption taxes. The issue in this case is whether a United States entity utilizing a commissionaire agent in Japan to import its products can use the manufacturer’s invoice or must use another valuation method, and, if an alternative method must be used, what the allowable deductions would be in determining the proper valuation. Following our review of the assessments and after consulting with our legal and customs advisors, we believe that the additional assessments are improper and are not supported by applicable customs laws. We fi led letters of protest with Yokohama Customs, which were rejected. We then appealed the matter to the Ministry of Finance in Japan. In the second quarter of 2011, the Ministry of Finance in Japan denied our administrative appeal. We disagree with the Ministry of Finance’s administrative decision. We are now pursuing the matter in Tokyo District Court, which we believe will provide a more independent determination of the matter. In addition, we are currently required to post a bond or make a deposit to secure any additional duties that may be due and payable on these current imports. Because we believe that the assessment of higher duties by the customs authorities is an improper application of the regulations, we are currently expensing the portion of the duties we believe is supported under applicable customs law, and recording the additional deposit or payment as a receivable within long-term assets on our consolidated fi nancial state-ments. If we are unsuccessful in recovering the amounts assessed and paid, we will record a non-cash expense for the full amount of the disputed assessments. We anticipate that additional disputed duties will be limited going forward as we have entered into an arrangement to purchase a majority of the a� ected products in Japan from a
Japanese company that purchases and imports the products from the manufacturer.
LAZERSON, CRAIG & HARPERIn September 2011, Elizabeth Craig (“Craig”) and Brady Harper
(“Harper”) fi led suit against us and our subsidiaries in the Utah Fourth District Court for malicious prosecution, abuse of criminal process, defamation and intentional infl iction of emotional distress. In aggregate, the complaint seeks damages in excess of approximately $42 million and punitive damages in the amount of $200 million. We believe the complaint is without merit and intend to vigorously defend ourselves. In August 2011, we fi led suit in the Utah Fourth District Court against Scott Lazerson (“Lazerson”) and Nu Lite Sales, LLC (“Nu Lite”), an entity owned by Craig and Harper, alleging fraud, negligent misrepre-sentation, conversion and unjust enrichment and seeking declaratory and equitable relief. A counterclaim was fi led by Nu Lite that includes factual allegations similar to those set forth in the complaint fi led on behalf of Craig and Harper. The counterclaim alleges conversion and tortious interference with prospective business relations, and seeks aggregate damages in excess of $2 million and punitive damages in the amount of $20 million. We believe the counterclaim is without merit. In February 2014, Craig and Nu Lite fi led a complaint in the United States District Court for the District of Utah against Provo City and certain of its personnel, and the Company and certain of its personnel, based on substantially the same facts alleged by them in the state court actions described above, and asserting claims for deprivation of constitutional rights. This complaint seeks damages in excess of $3 million and an unspecifi ed amount of punitive damages, attorneys’ fees, costs, and interest. We believe the complaint is without merit and intend to vigor-ously defend ourselves.
OTHER MATTERSFrom time to time, we are involved in legal proceedings arising in the ordinary course of business. We believe that the resolution of these matters will not have a negative material e� ect on our consolidated fi nancial position, results of operations or liquidity.
ITEM 4. MINE SAFETY DISCLOSURES
Not applicable.

30
PART II
ITEM 5. MARKET FOR REGISTRANT’S COMMON EQUITY, RELATED STOCKHOLDER MATTERS AND ISSUER PURCHASES OF EQUITY SECURITIES
Our Class A common stock is listed on the New York Stock Exchange (“NYSE”) and trades under the symbol “NUS.” The following table is based upon the information available to us and sets forth the range of the high and low sales prices for our Class A common stock for the quarterly periods during 2012 and 2013 based upon quotations on the NYSE.
Quarter Ended High LowMarch 31, 2012 . . . . . . . . . . . . . . $ 62.02 $ 45.50
June 30, 2012 . . . . . . . . . . . . . . . 60.14 40.00
September 30, 2012 . . . . . . . . 56.52 36.20
December 31, 2012 . . . . . . . . . 49.01 32.36
Quarter Ended High LowMarch 31, 2013 . . . . . . . . . . . . . . $ 47.36 $ 36.85
June 30, 2013 . . . . . . . . . . . . . . . 63.57 43.00
September 30, 2013 . . . . . . . . 99.60 60.77
December 31, 2013 . . . . . . . . . 139.81 88.80
The market price of our Class A common stock is subject to sig-nifi cant fl uctuations in response to variations in our quarterly operating results, general trends in the market for our products and product can-didates, economic and currency exchange issues in the foreign markets
in which we operate and other factors, many of which are not within our control. In addition, broad market fl uctuations, as well as general eco-nomic, business, regulatory and political conditions may adversely a� ect the market for our Class A common stock, regardless of our actual or projected performance.
The closing price of our Class A common stock on January 31, 2014, was $85.15. The approximate number of holders of record of our Class A common stock as of January 31, 2014 was 378. This number of holders of record does not represent the actual number of benefi cial owners of shares of our Class A common stock because shares are frequently held in “street name” by securities dealers and others for the benefi t of individual owners who have the right to vote their shares.
DIVIDENDSWe declared and paid a $0.20 per share dividend for Class A common stock in March, June, September and December of 2012 and a $0.30 per share dividend for Class A common stock in March, June, September and December of 2013. The board of directors has approved an increased quarterly cash dividend of $0.345 per share of Class A common stock to be paid on March 26, 2014, to stockholders of record on March 14, 2014. Annually, this would increase the dividend to $1.38 from $1.20 in the prior year. Management believes that cash fl ows from operations will be su� cient to fund this and any future dividend payments.
We currently expect to continue to pay dividends on our common stock. However, the declaration of dividends is subject to the discretion of our board of directors and will depend upon various factors, including our net earnings, fi nancial condition, cash requirements, future pros-pects and other factors deemed relevant by our board of directors.
Purchases of Equity Securities by the Issuer (a) (b) (c) (d)
Period
Total Number of Shares
PurchasedAverage Price Paid per Share
Total Number of Shares Purchased as Part of Publicly Announced Plans or Programs
Approximate Dollar Value of Shares that may yet be
Purchased Under the Plans or Programs
(in millions)(1)
October 1 – 31, 2013 . . . . . . . . . . . . . . . . . . 0 N/A 0 $ 444.5
November 1 – 30, 2013 . . . . . . . . . . . . . . . 6,481 $ 123.50 6,481 443.7
December 1 – 31, 2013 . . . . . . . . . . . . . . . . 381,437 128.98 381,437 394.5
Total . . . . . . . . . . . . . . . . . . . . . . . . . . . . . . 387,918 128.89 387,918
(1) In August 1998, our board of directors approved a plan to repurchase $10.0 million of our Class A common stock on the open market or in private transactions. Our board
has from time to time increased the amount authorized under the plan and a total amount of approximately $1,135.0 million was authorized as of December 31, 2013. As of
December 31, 2013, we had repurchased approximately $740.5 million of shares under the plan. In July 2013, our board of directors authorized a $400.0 million extension of
our ongoing share repurchase authorization, which is included in the total authorized. There has been no termination or expiration of the plan since the initial date of approval.

31
STOCK PERFORMANCE GRAPHSet forth below is a line graph comparing the cumulative total stockholder return (stock price appreciation plus dividends) on our Class A Common Stock with the cumulative total return of the S&P 500 Index, a market-weighted index of publicly traded peers (the “Peer Group”) for the period from December 31, 2008 through December 31, 2013. The graph assumes that $100 was invested in each of the Class A Com-mon Stock, the S&P 500 Index, and each of the indexes of publicly traded peers on December 31, 2008 and that all dividends were reinvested. The Peer Group consists of the following companies, which compete in our industry and product categories: Avon Products, Inc., Estee Lauder, Tupperware Corporation, Herbalife LTD., USANA Health Sciences, Inc., Nature’s Sunshine Products, Inc., Weight Watchers Inter-national, Inc., Mannatech, Inc. and Elizabeth Arden, Inc.
COMPARISON OF 5 YEAR CUMULATIVE TOTAL RETURNAmong Nu Skin Enterprises, Inc., the S&P 500 Index, and a Peer Group
12/08 12/09 12/10 12/11 12/12 12/13
$ 1,600
$ 1,400
$ 1,200
$ 1,000
$ 800
$ 600
$ 400
$ 200
$ 0
NU SKIN ENTERPRISES, INC. S&P 500 PEER GROUP
Copyright ©2014 S&P, a division of The McGraw-Hill Companies Inc. All rights reserved.
Measured Period Nu Skin S&P 500 Index Peer Group Index
December 31, 2008 100.00 100.00 100.00
December 31, 2009 265.60 126.46 144.95
December 31, 2010 304.47 145.51 176.34
December 31, 2011 496.27 148.59 188.88
December 31, 2012 385.26 172.37 182.51
December 31, 2013 1,464.01 228.19 256.22

32
ITEM 6. SELECTED FINANCIAL DATA
The following selected consolidated fi nancial data as of and for the years ended December 31, 2009, 2010, 2011, 2012 and 2013 have been derived from the audited consolidated fi nancial statements as revised:
Year Ended December 31,
2009 2010 2011 2012 2013
(U.S. dollars in thousands, except per share data and cash dividends)
Income Statement Data:
Revenue . . . . . . . . . . . . . . . . . . . . . . . . . . . . . . . . . . . . . . . . . . . . . . . . . . . . $ 1,314,258 $ 1,517,759 $ 1,719,588 $ 2,132,257 $ 3,176,718
Cost of sales . . . . . . . . . . . . . . . . . . . . . . . . . . . . . . . . . . . . . . . . . . . . . . . . 243,648 272,431 322,624(1) 353,152 505,806
Gross profit . . . . . . . . . . . . . . . . . . . . . . . . . . . . . . . . . . . . . . . . . . . . . . . . . . 1,070,610 1,245,328 1,396,964 1,779,105 2,670,912
Operating expenses: . . . . . . . . . . . . . . . . . . . . . . . . . . . . . . . . . . . . . . . . .
Selling expenses . . . . . . . . . . . . . . . . . . . . . . . . . . . . . . . . . . . . . . . . . . . . 542,805 626,848 727,045 932,812 1,476,772
General and administrative expenses . . . . . . . . . . . . . . . . . . . . . . . . 369,368 401,418 436,177 505,449 640,028
Restructuring charges . . . . . . . . . . . . . . . . . . . . . . . . . . . . . . . . . . . . . . 10,724 — — — —
Total operating expenses . . . . . . . . . . . . . . . . . . . . . . . . . . . . . . . . . . 922,897 1,028,266 1,163,222 1,438,261 2,116,800
Operating income . . . . . . . . . . . . . . . . . . . . . . . . . . . . . . . . . . . . . . . . . . . . 147,713 217,062 233,742 340,844 554,112
Other income (expense), net . . . . . . . . . . . . . . . . . . . . . . . . . . . . . . . . . . (6,589) (9,449) (6,973) 4,398 2,828
Income before provision for income taxes . . . . . . . . . . . . . . . . . . . . . 141,124 207,613 226,769 345,242 556,940
Provision for income taxes . . . . . . . . . . . . . . . . . . . . . . . . . . . . . . . . . . . . 51,279 71,562 73,439 123,597 192,052
Net income . . . . . . . . . . . . . . . . . . . . . . . . . . . . . . . . . . . . . . . . . . . . . . . . . . $ 89,845 $ 136,051 $ 153,330 $ 221,645 $ 364,888
Net income per share: . . . . . . . . . . . . . . . . . . . . . . . . . . . . . . . . . . . . . . . .
Basic . . . . . . . . . . . . . . . . . . . . . . . . . . . . . . . . . . . . . . . . . . . . . . . . . . . . . . . $ 1.42 $ 2.18 $ 2.47 $ 3.66 $ 6.23
Diluted . . . . . . . . . . . . . . . . . . . . . . . . . . . . . . . . . . . . . . . . . . . . . . . . . . . . . $ 1.40 $ 2.11 $ 2.38 $ 3.52 $ 5.94
Weighted-average common shares outstanding (000s):
Basic . . . . . . . . . . . . . . . . . . . . . . . . . . . . . . . . . . . . . . . . . . . . . . . . . . . . . . . 63,333 62,370 62,066 60,600 58,606
Diluted . . . . . . . . . . . . . . . . . . . . . . . . . . . . . . . . . . . . . . . . . . . . . . . . . . . . . 64,296 64,547 64,546 63,025 61,448
Balance Sheet Data (at end of period):
Cash and cash equivalents and current investments . . . . . . . . . . . $ 158,045 $ 230,337 $ 290,701 $ 333,403 $ 547,127
Working capital . . . . . . . . . . . . . . . . . . . . . . . . . . . . . . . . . . . . . . . . . . . . . . 152,731 206,078 288,916 268,500 341,542
Total assets . . . . . . . . . . . . . . . . . . . . . . . . . . . . . . . . . . . . . . . . . . . . . . . . . . 748,449 892,224 990,956 1,124,807 1,821,062
Current portion of long-term debt . . . . . . . . . . . . . . . . . . . . . . . . . . . . 35,400 27,865 28,608 39,019 67,824
Long-term debt . . . . . . . . . . . . . . . . . . . . . . . . . . . . . . . . . . . . . . . . . . . . . . 121,119 133,013 107,944 154,963 113,852
Stockholders’ equity . . . . . . . . . . . . . . . . . . . . . . . . . . . . . . . . . . . . . . . . . 375,687 471,249 574,236 590,612 858,619
Cash dividends declared . . . . . . . . . . . . . . . . . . . . . . . . . . . . . . . . . . . . . . 0.46 0.50 0.59 0.80 1.20
Supplemental Operating Data (at end of period):
Approximate number of Actives(2) . . . . . . . . . . . . . . . . . . . . . . . . . . . . 761,000 799,000 855,000 946,000 1,335,000
Number of Sales Leaders(3) . . . . . . . . . . . . . . . . . . . . . . . . . . . . . . . . . . . 32,939 35,676 41,816 51,790 102,117
(1) Includes $32.8 million related to an adverse decision in the Japan customs litigation.(2) “Actives” are persons who purchased products directly from the company during the previous three months.(3) “Sales Leaders” include our independent distributors who have completed and who maintain specifi ed sales requirements, and our sales employees and contractual sales
promoters in Mainland China, who have completed certain qualifi cation requirements.

33
ITEM 7. MANAGEMENT’S DISCUSSION AND ANALYSIS OF FINANCIAL CONDITION AND RESULTS OF OPERATIONS
The following discussion of our fi nancial condition and results of operation should be read in conjunction with the Consolidated Financial Statements and related Notes thereto, which are included in this Annual Report on Form 10-K.
BUSINESS OVERVIEWWe are a leading global direct selling company with operations in 53 markets worldwide. In 2013, we achieved a record $3.2 billion in reve-nue, representing year-over-year growth of 49%. From our founding in 1984, we have strived to di� erentiate ourselves through innovation in both our products and our sales channel.
We develop and distribute innovative, premium-quality anti-aging personal care products and nutritional supplements under our Nu Skin and Pharmanex category brands, respectively. Over the last fi ve years, we have introduced new Pharmanex nutritional supple-ments and Nu Skin personal care products under our ageLOC anti-aging brand.
We operate in the direct selling channel, primarily utilizing per-son-to-person marketing to market and sell our products. Consum-ers of our products can purchase products either directly from an in-dividual distributor of our products or directly from the company. As of December 31, 2013, we had approximately 1,335,000 persons who purchased products directly from the company during the previous three months (“Actives”). We believe a signifi cant majority of Actives purchase our products at a preferred price, but are not actively pursu-ing our business opportunity.
Approximately 92% of our 2013 revenue came from outside of the United States. Due to the size of our foreign operations, our results, as reported in U.S. dollars, are often impacted by foreign currency fl uc-tuations. In addition, our results are impacted by global economic, po-litical, demographic and business trends and conditions.
Mainland China became our largest revenue market in 2013 and accounted for approximately 32% of our revenue. Direct selling is relatively new to Mainland China and we believe the market holds signifi cant potential. We have implemented a distinct business mod-el in Mainland China to conform with local laws and regulations.
Our business is subject to various laws and regulations globally, particularly with respect to our direct selling business models and our product categories. For example, following a number of negative media stories published in January 2014 by the People’s Daily in
Mainland China, we received inquiries from various government regulators in Mainland China asking us to respond to a number of allegations relating to our business practices, products and business model. In response to this media and regulatory scrutiny we have vol-untarily taken a number of actions in Mainland China, including tem-porarily suspending our business promotional meetings, temporarily suspending acceptance of applications for any new sales representa-tives, and extending our product refund and return policies. The ad-verse publicity and suspension of business promotional meetings and acceptance of applications has had a signifi cant negative impact on the number of Sales Leaders and Actives, and our revenue in the short term will be negatively impacted by these voluntary actions. Any inability to resume normal business operations in the near term could have a more signifi cant impact on our business. We currently plan to focus our attention during the next several months on training our sales force with respect to the promotion of both products and the business opportunity we o� er in Mainland China. It is currently unclear what impact the adverse publicity and our voluntary actions will have on our business in this market in the longer term or whether these voluntary actions will be e� ective in addressing concerns of regulators in Mainland China. Regardless, it is likely that we will be fi ned and could potentially face some other form of sanctions from these regulators. These other sanctions could include a formal sus-pension of our ability to recruit new sales people and direct sellers, a temporary suspension of our ability to sell products in various mar-kets or, in the most extreme cases, loss of existing licenses to operate in various jurisdictions in Mainland China. Any of these actions or outcomes could materially harm our business and fi nancial condition.
Our revenue depends on the number and productivity of our Actives and Sales Leaders. Sales Leaders include our independent distributors who have completed and who maintain specifi ed sales requirements, and our sales employees and contractual sales pro-moters in Mainland China, who have completed certain qualifi cation requirements. We have been successful in attracting and motivating our sales force by:
• developing and marketing innovative, technologically and sci-entifi cally advanced products;
• providing compelling initiatives and strong support; and
• o� ering attractive incentives that motivate our sales force to build sales organizations.
Our sales force markets and sells our products and recruits others based on the distinguishing benefi ts and innovative characteristics of our products. As a result, it is vital to our business that we continuously leverage our product development resources to develop and introduce innovative products and provide our sales force with an attractive port-

34
folio of products. Since 2008, we have successfully introduced a suite of innovative anti-aging skin care and nutritional products under our ageLOC brand, including our ageLOC Transformation, Galvanic Spa Gels with ageLOC, ageLOC Galvanic Spa Body Shaping Gel and ageLOC Dermatic E� ects Body Contouring Lotion, ageLOC Tru Face Essence Ultra, ageLOC Vitality, ageLOC R2 and ageLOC TR90. We have several products in development, including nutritional supplements and personalized skin care systems. Any delays or di� culties in introducing compelling products or attractive initiatives or tools into our markets may have a negative impact on our revenue and our number of Actives and Sales Leaders.
Although our product launch process may vary by market, we generally introduce new products to our sales force and consumers in all markets where the products are registered, through limited-time o� ers. The limited-time o� ers typically generate signifi cant activity and a high level of purchasing, which may result in a higher than normal increase in revenue during the quarter of the limited-time o� er and skew year-over-year and sequential comparisons. We believe our product launch process attracts new people to our business, driving growth in our Sales Leaders and Actives. For example, limited-time o� ers of our ageLOC TR90 weight management and body shaping system in the second half of 2013 generated revenue of approximately $550 million. In 2014, we currently plan to further intro-duce ageLOC TR90 and our ageLOC Tru Face Essence Ultra anti-aging skin care serum through limited-time o� ers in certain regions. We may experience di� culty e� ectively managing growth associated with these limited-time o� ers and may face increased risk of improper sales force activities and related governmental scrutiny. In addition, the size and condensed schedule of these product launches increases pressure on our supply chain. If we are unable to accurately forecast sales levels in each market, obtain su� cient ingredients or produce a su� cient supply to meet demand, we may incur higher expedited shipping costs and we may temporarily run out of stock of certain products, which could negatively impact the enthusiasm of our sales force and consumers. Conversely, if demand does not meet our expectations for a product launch, we could incur increased inventory write-o� s. For example, given heightened media and regu-latory scrutiny in Mainland China and the voluntary measures we have taken in that market, we have adjusted our 2014 product launch plans. This change in plans increases the risk of inventory write-o� s in Mainland China if we are unable to sell the inventory we produced based on our prior plans. Any inventory write-o� would negatively impact our gross margins. In addition, our order processing systems could have di� culties handling the high volume of orders generated by limited-time o� ers. Although our previous limited-time o� ers have not materially a� ected our product return rate, these events may increase our product return rate in the future.
Our global sales force helps us to rapidly introduce products and penetrate our markets with modest up-front promotional expense. Similar to other companies in our industry, we experience high turnover among our sales force. As a result, it is important that we regularly introduce innovative and compelling products and initiatives in order to maintain a compelling business opportunity that will attract new people to our business. We have also developed, and continue to promote in many of our markets, product subscription and loyalty programs that provide incentives for consumers to commit to purchase a specifi c amount of product on a monthly basis. All purchases under these programs are subject to our standard product payment and return policies. We believe these subscription and loyalty programs have improved consumer retention, have had a stabilizing impact on revenue, and have helped generate recurring sales. Subscription and loyalty programs represented a signifi cant portion of our non-limited-time o� er revenue in 2013.
REVISIONS OF DEFERRED TAXES AND SELLING REBATESCertain amounts applicable to the prior periods have been revised to correct certain classifi cation errors in prior years. Specifi cally, the presentation of our consolidated balance sheets for the year ended December 31, 2012, was revised to decrease short-term deferred tax assets by $10.8 million, long-term deferred tax assets by $17.3 million and long-term deferred tax liabilities by $28.1 million. The revision had no e� ect on our results of operations (net or comprehensive income), fi nancial condition (stockholders’ equity), or cash fl ows in any period presented or in any previously issued fi nancial statements.
Additionally, the presentation of our consolidated statements of income for the years ended December 31, 2011 and 2012, was revised to reduce selling expense and revenue by $24.4 million and $37.4 million related to an error in the classifi cation of selling rebates. The revision had no e� ect on our operating income, net income or com-prehensive income, the consolidated balance sheet or cash fl ows in any period presented or in any previously issued fi nancial statements.
These revisions were not considered to be material, individually or in the aggregate, to the previously issued fi nancial statements.
INCOME STATEMENT PRESENTATIONWe report revenue in fi ve geographic regions and we translate reve-nue from each market’s local currency into U.S. dollars using weight-ed-average exchange rates. The following table sets forth revenue information by region for the periods indicated. This table should be reviewed in connection with the tables presented under “Results of Operations,” which disclose selling expenses and other costs associ-ated with generating the aggregate revenue presented.

35
REVENUE BY REGIONYear Ended December 31,
(U.S. dollars in millions) 2011 2012 2013
Greater China . . . . . . . . . . . . . . . . . . . . . . . . . . . . . . . . . . . . . . . . . . . . . . $ 333.6 19% $ 550.7 26% $ 1,363.2 43%
North Asia . . . . . . . . . . . . . . . . . . . . . . . . . . . . . . . . . . . . . . . . . . . . . . . . . 741.8 43 785.3 37 869.4 27
South Asia/Pacific . . . . . . . . . . . . . . . . . . . . . . . . . . . . . . . . . . . . . . . . . . 235.0 14 328.6 15 379.0 12
Americas . . . . . . . . . . . . . . . . . . . . . . . . . . . . . . . . . . . . . . . . . . . . . . . . . . 248.2 15 285.3 13 370.1 12
EMEA . . . . . . . . . . . . . . . . . . . . . . . . . . . . . . . . . . . . . . . . . . . . . . . . . . . . . . 161.0 9 182.4 9 195.0 6
$ 1,719.6 100% $ 2,132.3 100% $ 3,176.7 100%
Cost of sales primarily consists of:
• cost of products purchased from third-party vendors;
• costs of self-manufactured products;
• cost of adjustments to inventory carry value;
• cost of sales materials which we sell to our sales force at or near cost;
• amortization expenses associated with certain products and services such as the Pharmanex BioPhotonic Scannersthat are leased to our sales force;
• freight cost of shipping products to our sales force and import duties for the products; and
• royalties and related expenses for licensed technologies.
We source the majority of our products from third-party manu-facturers. Under direct selling regulations in Mainland China, we are required to manufacture the products we distribute through direct sellers in Mainland China. Cost of sales and gross profi t, on a consolidated basis, may fl uctuate as a result of changes in the ratio between self-manufactured products and products sourced from third-party suppliers. In addition, because we purchase a signifi cant amount of our goods in U.S. dollars and recognize revenue in local currencies, our gross margin is subject to exchange rate risks. Because our gross margins vary from product to product and due to higher pricing in some markets, changes in product mix and geographic revenue mix can impact our gross margin on a consolidated basis.
Selling expenses are our most signifi cant expense and are classi-fi ed as operating expenses. Selling expenses include sales commis-sions paid to our sales force, special incentives, costs for incentive trips and other rewards, as well as wages, benefi ts, bonuses and other labor and unemployment expenses we pay to our sales force in Main-land China. Selling expenses do not include any amounts we pay to our sales force for personal purchases. Our global sales compensa-
tion plan, which we employ in all our markets, except Mainland China, is an important factor in our ability to attract and retain our Sales Leaders. Under our global sales compensation plan, Sales Leaders can earn “multi-level” compensation, where they earn commissions for product sales to their consumer groups as well as the product sales made through the sales network they have developed and trained. We do not pay commissions on sales materials, which are sold to our sales force at or near cost. Small fl uctuations occur in the amount of commissions paid as the Actives change from month to month. However, with over 1,335,000 Actives and 102,000 Sales Leaders, the fl uctuation in the overall payout is relatively small. Selling expenses as a percentage of revenue typically increase in connection with a limited-time o� er due to growth in the number of Sales Lead-ers qualifying for increased sales compensation and promotional in-centives. From time to time, we make modifi cations and enhance-ments to our global sales compensation plan in an e� ort to help motivate our sales force and develop leadership characteristics, which can have an impact on selling expenses.
Outside of Mainland China, distributors also have the opportu-nity to make profi ts by purchasing products from us at a discount and selling them to consumers with a mark-up. We do not account for nor pay additional commissions on these mark-ups received by distributors. In many markets, we also allow individuals who are not part of our sales force, whom we refer to as “preferred customers,” to buy products directly from us at a discount. We pay commissions on preferred customer purchases to the referring member of our sales force.
General and administrative expenses include:
• wages and benefi ts;
• rents and utilities;
• depreciation and amortization;
• promotion and advertising;
• professional fees;

36
• travel;
• research and development; and
• other operating expenses.
Labor expenses are the most signifi cant portion of our general and administrative expenses. Promotion and advertising expenses include costs of sales force conventions held in various markets worldwide, which we expense in the period in which they are incurred. Because our various sales force conventions are not held during each fi scal year, or in the same period each year, their impact on our general and administrative expenses may vary from year to year and from quarter to quarter. For example, we held our global convention in October 2013 and will have another global convention in the fall of 2015 as we currently plan to hold a global convention every other year. In addition, we hold regional conventions and conventions in our major markets at di� erent times during the year. These conventions have signifi cant expenses associated with them. Because we have not incurred expenses for these conventions during every fi scal year or in comparable interim periods, year-over-year comparisons have been impacted accordingly.
Provision for income taxes depends on the statutory tax rates in each of the jurisdictions in which we operate. For example, statutory tax rates in 2013 were approximately 16.5% in Hong Kong, 17% in Taiwan, 24.2% in South Korea, 42.7% in Japan and 25% in Mainland China. We are subject to taxation in the United States at the statutory corporate federal tax rate of 35% and we pay taxes in multiple states within the United States at various tax rates. Our overall e� ective tax rate was 34.5% for the year ended December 31, 2013.
CRITICAL ACCOUNTING POLICIESThe following critical accounting policies and estimates should be read in conjunction with our audited Consolidated Financial Statements and related Notes thereto. Management considers our critical accounting policies to be the recognition of revenue, accounting for income taxes and accounting for intangible assets. In each of these areas, management makes estimates based on historical results, current trends and future projections.
Revenue. We recognize revenue when products are shipped, which is when title and risk of loss pass to the purchaser of the products. With some exceptions based on local regulations, we o� er a return policy that allows our sales force to return unopened and unused product for up to 12 months subject to a 10% restocking fee. Reported revenue is net of returns, which have historically been less than 5% of annual revenue. A reserve for product returns is accrued based on historical experience. We classify selling discounts as a reduction of revenue.
Through our product subscription and loyalty programs, which vary from market to market, participants who commit to purchase on a monthly basis receive a discount from suggested retail or wholesale prices, as applicable. We apply this discount at the time of each purchase and not through a larger discount on the initial purchase. Participants may cancel their commitment at any time, however some markets charge a one-time early cancellation fee. All purchases under these programs are subject to our standard product payment and return policies. In accordance with ASC 605-50, we classify selling discounts and rebates, as a reduction of revenue at the time the sale is recorded.
Income Taxes. We account for income taxes in accordance with the Income Taxes Topic of the Financial Accounting Standards Codifi cation. These standards establish fi nancial accounting and reporting standards for the e� ects of income taxes that result from an enterprise’s activities during the current and preceding years. We take an asset and liability approach for fi nancial accounting and reporting of income taxes. We pay income taxes in many foreign jurisdictions based on the profi ts realized in those jurisdictions, which can be signifi cantly impacted by the intercompany transactions between Nu Skin a� liates around the world. Deferred tax assets and liabilities are created in this process. As of December 31, 2013, we had net deferred tax assets of $67.2 million. We net these deferred tax assets and deferred tax liabilities by jurisdiction. Valuation allowances are established when necessary to reduce deferred tax assets to the amounts expected to be ultimately realized. These net deferred tax assets assume su� cient future earnings will exist for their realization, and are calculated using anticipated tax rates. In certain foreign juris-dictions valuation allowances have been recorded against the deferred tax assets specifi cally related to use of net operating losses. When we determine that there is su� cient taxable income to utilize the net operating losses, the valuation allowances will be released. In the event we were to determine that we would not be able to realize all or part of our net deferred tax assets in the future, an adjustment to the deferred tax assets would be charged to earnings in the period such determination was made.
We evaluate our indefi nite reinvestment assertions with respect to foreign earnings for each period. Other than earnings we intend to reinvest indefi nitely, we accrue for the U.S. federal, state and foreign income taxes applicable to the earnings. During 2013, we determined that $40.0 million of our non-US subsidiaries’ earnings will be indefi -nitely reinvested. We intend to utilize the o� shore earnings to fund foreign investments, specifi cally capital expenditures. Undistributed earnings that we will indefi nitely reinvest, and for which no federal income taxes in the U.S. have been provided, aggregate to $10.0 million and $50.0 million at December 2012 and 2013, respectively. In the event that all non-U.S. subsidiaries’ undistributed earnings, which we have designated as indefi nitely reinvested, were remitted to the

37
United States to fund operating and capital plans, regulatory capital requirements, parent company fi nancing or cash fl ow needs, the amount of incremental taxes would be approximately $5.5 million.
We fi le income tax returns in the U.S. federal jurisdiction, and in various state and foreign jurisdictions. In 2013, we entered into a clos-ing agreement with the United States Internal Revenue Service (the “IRS”) for all adjustments for the 2009 and 2010 tax years. As a result of entering into the closing agreement, we are no longer subject to tax examinations from the IRS for all years for which tax returns have been fi led except for 2011. With a few exceptions, we are no longer subject to state and local income tax examination by tax authorities for the years before 2008. In 2009, we entered into a voluntary pro-gram with the IRS called Compliance Assurance Process (“CAP”). The objective of CAP is to contemporaneously work with the IRS to achieve federal tax compliance and resolve all or most of the issues prior to fi ling of the tax return. We have elected to participate in the CAP program for 2014 and may elect to continue participating in CAP for future tax years; we may withdraw from the program at any time. In major foreign jurisdictions, we are no longer subject to in-come tax examinations for years before 2007. Along with the IRS examination of 2011, we are currently under examination in certain foreign jurisdictions; however, the outcomes of those reviews are not yet determinable.
At December 31, 2013, we had $7.5 million in unrecognized tax benefi ts of which $2.1 million, if recognized, would a� ect the e� ective tax rate. In comparison, at December 31, 2012, we had $9.0 million in unrecognized tax benefi ts of which $3.8 million, if recognized, would a� ect the e� ective tax rate. We recognized approximately $0.3 million and ($0.1) million in interest and penalties expenses (benefi ts), during each of the years ended December 31, 2012 and 2013, respec-tively. We had approximately $0.8 million, $1.1 million and $0.9 million of accrued interest and penalties related to uncertain tax positions at December 31, 2011, 2012 and 2013, respectively. Interest and penalties related to uncertain tax positions are recognized as a component of income tax expense.
We are subject to regular audits by federal, state and foreign tax authorities. These audits may result in additional tax liabilities. We account for such contingent liabilities in accordance with relevant accounting standards and believe we have appropriately provided for income taxes for all years. Several factors drive the calculation of our tax reserves. Some of these factors include: (i) the expiration of vari-ous statutes of limitations; (ii) changes in tax law and regulations; (iii) issuance of tax rulings; and (iv) settlements with tax authorities. Changes in any of these factors may result in adjustments to our re-serves, which would impact our reported fi nancial results.
Intangible Assets. Acquired intangible assets may represent in-defi nite-lived assets, determinable-lived intangibles, or goodwill. Of these, only the costs of determinable-lived intangibles are amortized to expense over their estimated life. The value of indefi nite-lived in-tangible assets and residual goodwill is not amortized, but is tested at least annually for impairment. Our impairment testing for goodwill is performed separately from our impairment testing of indefi nite-lived intangibles. We test goodwill for impairment, at least annually, by re-viewing the book value compared to the fair value at the reportable unit level. Beginning in 2011, we had the option to perform a qualita-tive assessment to determine whether further impairment testing is necessary or to perform a quantitative assessment by comparing the fair value of a reporting unit to its carrying amount, including good-will. Under the qualitative assessment, an entity is not required to calculate the fair value of a reporting unit unless the entity determines that it is more likely than not that its fair value is less than its carrying amount. If under the quantitative assessment the fair value of a re-porting unit is less than its carrying amount, then the amount of the impairment loss, if any, must be measured. We used the quantitative assessment for all periods presented. Considerable management judgment is necessary to measure fair value. We did not recognize any impairment charges for goodwill or intangible assets during the periods presented.

38
RESULTS OF OPERATIONSThe following table sets forth our operating results as a percentage of revenue for the periods indicated:
Year Ended December 31,
2011 2012 2013
Revenue . . . . . . . . . . . . . . . . . . . . . . . . . . . . . . . . . . . . . . . . . . . . . . . . . . . . . . . . . . . . . . . . . . . . . . . . . . . . . 100.0% 100.0% 100.0%
Cost of sales . . . . . . . . . . . . . . . . . . . . . . . . . . . . . . . . . . . . . . . . . . . . . . . . . . . . . . . . . . . . . . . . . . . . . . . . . 18.8* 16.6 15.9
Gross profit . . . . . . . . . . . . . . . . . . . . . . . . . . . . . . . . . . . . . . . . . . . . . . . . . . . . . . . . . . . . . . . . . . . . . . . . . . 81.2 83.4 84.1
Operating expenses:
Selling expenses . . . . . . . . . . . . . . . . . . . . . . . . . . . . . . . . . . . . . . . . . . . . . . . . . . . . . . . . . . . . . . . . . . . . . 42.3 43.7 46.5
General and administrative expenses . . . . . . . . . . . . . . . . . . . . . . . . . . . . . . . . . . . . . . . . . . . . . . . . . 25.3 23.7 20.2
Total operating expenses . . . . . . . . . . . . . . . . . . . . . . . . . . . . . . . . . . . . . . . . . . . . . . . . . . . . . . . . . . . . . . 67.6 67.4 66.7
Operating income . . . . . . . . . . . . . . . . . . . . . . . . . . . . . . . . . . . . . . . . . . . . . . . . . . . . . . . . . . . . . . . . . . . . 13.6 16.0 17.4
Other income (expense), net . . . . . . . . . . . . . . . . . . . . . . . . . . . . . . . . . . . . . . . . . . . . . . . . . . . . . . . . . . (0.4) 0.2 0.1
Income before provision for income taxes . . . . . . . . . . . . . . . . . . . . . . . . . . . . . . . . . . . . . . . . . . . . . 13.2 16.2 17.5
Provision for income taxes . . . . . . . . . . . . . . . . . . . . . . . . . . . . . . . . . . . . . . . . . . . . . . . . . . . . . . . . . . . . 4.3 5.8 6.0
Net income . . . . . . . . . . . . . . . . . . . . . . . . . . . . . . . . . . . . . . . . . . . . . . . . . . . . . . . . . . . . . . . . . . . . . . . . . . . 8.9% 10.4% 11.5%
*Includes $32.8 million related to an adverse decision in the Japan customs litigation.
2013 COMPARED TO 2012
OVERVIEWRevenue in 2013 increased 49% to $3.2 billion from $2.1 billion in 2012. This increase refl ects growth in each of our regions with signifi cant growth in Greater China, South Asia/Pacifi c, the Americas and South Korea. Sustained interest in our innovative product portfolio and our business opportunity continued to drive year-over-year growth in our Sales Leaders and Actives. In 2012, limited-time o� ers of ageLOC R2 and ageLOC Body Spa and related products in con-nection with a series of regional events generated approximately $116 million in our Greater China region and $68 million in our South Asia/Pacifi c region. In the second half of 2013, the successful limited-time o� ers of ageLOC TR90 generated approximately $550 million in revenue with over half of this volume coming from the Greater China region. In 2014, we currently plan to further introduce ageLOC TR90and our ageLOC Tru Face Essence Ultra anti-aging skin care serum through limited-time o� ers in certain regions. We continue to assess the fi nancial and operational impact of the introduction of ageLOC TR90, including factors such as the timing of product deliveries, the amount of product returns and the cannibalization of sales of our other products.
Foreign currency exchange fl uctuations had a negative 3% im-pact on revenue in 2013 compared to 2012. Globally, our Sales Lead-ers and Actives grew 97% and 41%, respectively, compared to the pri-or-year period.
Earnings per share in 2013 increased to $5.94, compared to $3.52 in 2012. The increase in earnings is largely the result of increased rev-enue, as discussed above, coupled with improved margins and con-trolled expenses.
REVENUEGreater China. The following table sets forth revenue for the
Greater China region and its principal markets (U.S. dollars in millions):
2012 2013 Change
Mainland China . . . . . . . . . . $ 256.8 $ 1,005.4 292%
Taiwan . . . . . . . . . . . . . . . . . . 134.6 199.2 48%
Hong Kong . . . . . . . . . . . . . . 159.3 158.6 —
Greater China total . . . . . . . $ 550.7 $ 1,363.2 148%
Foreign currency exchange rate fl uctuations positively impacted revenue in the Greater China region by 5% in 2013.
Strong revenue and sales force growth in the Greater China re-gion, including signifi cant growth in Mainland China, was driven by continued interest in our business opportunity and our strong product portfolio, including successful limited-time o� ers of our ageLOC TR90. This limited-time o� er generated approximately $327 million in revenue in the second half of 2013. Revenue for 2012 included approximately $116 million of limited-time o� er revenue of our ageLOC R2 and our ageLOC Galvanic Body Spa and related products, with most of the sales recorded in Hong Kong in connec-tion with our Greater China regional convention.

39
Local currency revenue in Mainland China and Taiwan was up 280% and 49%, respectively, in 2013 compared to 2012. Local cur-rency revenue in Hong Kong remained level when comparing 2013 to 2012. Mainland China reported a 187% and 285% increase in Actives and number of Sales Leaders, respectively, compared to the prior-year period. Sales Leaders and Actives in Taiwan increased 89% and 21% compared to the prior-year period. Sales Leaders and Actives in Hong Kong were up 168% and 67% compared to 2012.
Our rapid growth in Greater China put pressure on our supply chain and other systems and resources in this region, causing us to take measures to help alleviate this pressure, including staging the limited-time o� er of ageLOC TR90 over several months in the Greater China region. We, along with our management team in the Greater China region, continue to focus resources to successfully manage the expansion of our management team, labor force, sales force, manufacturing operations, systems, government relations ef-forts, retail stores and service centers.
Voluntary measures we have taken in Mainland China in response to recent media scrutiny and subsequent government reviews of our operations and the activities of our sales force in Mainland China will have a negative impact on our revenue. See “—Business Overview” for a more detailed description of these matters.
North Asia. The following table sets forth revenue for the North Asia region and its principal markets (U.S. dollars in millions):
2012 2013 Change
South Korea . . . . . . . . . . . . . $ 296.0 $ 466.8 58%
Japan . . . . . . . . . . . . . . . . . . . 489.3 402.6 (18%)
North Asia total . . . . . . . . . . $ 785.3 $ 869.4 11%
Foreign currency fl uctuations negatively impacted revenue 10% in this region compared to the prior-year period.
Local currency revenue in Japan increased 1% in 2013, compared to 2012. During 2013, the Japanese yen weakened against the U.S. dol-lar, negatively impacting our revenue in this market by 19% compared to 2012. Japan’s 2013 revenue was positively impacted by the limited-time o� er of our ageLOC TR90 in the second half of 2013, which generated approximately $34 million. Japan’s revenue in 2012 included approxi-mately $34 million from the regional limited-time o� er of our ageLOC R2 and ageLOC Galvanic Body Spa and related products. As a result of concerns from a regional Japanese regulatory authority in 2013, we implemented additional steps to further reinforce our distributor education, training and compliance e� orts. These issues also led us to be cautious in our promotional activities. We believe these steps negatively impacted our revenue in this market during the latter-half of 2013, with local-currency revenue in Japan down 9% in the fourth quarter of 2013, compared to the same prior-year period. In 2013, Sale Leaders and Actives in Japan decreased 13% and 5%, respectively, compared to the prior year, refl ect-
ing challenges related to the di� cult direct selling environment in Japan and our focus on distributor education, training and compliance.
Local currency growth of 53% in South Korea in 2013, compared to the prior year, refl ects continued growth in Actives and Sales Leaders, interest generated by our ageLOC products and alignment with our product launch process. We introduced our ageLOC TR90and related products in South Korea through a limited-time o� er in the second half of 2013, which generated approximately $70 million. South Korea’s revenue in 2012 included approximately $25 million from the regional limited-time o� er of our ageLOC R2 and ageLOC Galvanic Body Spa and related products. In 2013, our Sales Leaders and Actives in South Korea increased 46% and 40%, respectively, compared to the prior year, driven by strong interest in our innovative anti-aging portfolio and business opportunity.
South Asia/Pacifi c. The following table sets forth revenue for the South Asia/Pacifi c region (U.S. dollars in millions):
2012 2013 Change
South Asia/Pacific . . . . . . . . $ 328.6 $ 379.0 15%
Foreign currency exchange rate fl uctuations negatively impacted revenue in South Asia/Pacifi c by 3% in 2013, compared to the prior year. Strong growth in our revenue in this region refl ects continued interest in our strong product portfolio, including a limited-time o� er of ageLOC TR90, which generated approximately $64 million in revenue in the second half of 2013. In 2012, a regional limited-time o� er generated approximately $68 million in revenue in the second and third quarters of 2012. Sales Leaders and Actives in the region increased 60% and 22% in 2013, compared to the prior year.
Americas. The following table sets forth revenue for the Americas region (U.S. dollars in millions):
2012 2013 Change
Americas . . . . . . . . . . . . . . . . $ 285.3 $ 370.1 30%
Revenue in the Americas increased 30% in 2013 compared to 2012, refl ecting strong Sales Leader growth and continued interest in our ageLOC anti-aging products including the limited-time o� er of our ageLOC TR90. Year-over-year revenue growth in the region was positively impacted by strong growth in Canada and Latin America. In the United States, revenue was up 18% over 2012. We believe our inability to market our facial spa in the United States lim-ited revenue growth in this market. In the third quarter of 2013, we received clearance from the United States Food and Drug Adminis-tration to market a facial spa device for over-the-counter use. We currently expect that the facial spa will become available for sale in the United States in the second half of 2014. Revenue in the second half of 2013 for the region was positively impacted by the limited-time o� er of ageLOC TR90. In the second half of 2012, we introduced our new ageLOC Tru Face Essence Ultra through a limited-time o� er in

40
connection with the Americas regional convention. Sales Leaders and Actives in the region increased 30% and 18% in 2013, compared to the prior-year period.
EMEA. The following table sets forth revenue for the Europe, Middle East and Africa (“EMEA”) region (U.S. dollars in millions):
2012 2013 Change
EMEA . . . . . . . . . . . . . . . . . . . $ 182.4 $ 195.0 7%
Foreign currency exchange rate fl uctuations positively impacted revenue in the EMEA region by 3% in 2013 compared to the prior year. Local currency revenue growth of 4% in EMEA during 2013 refl ects continued interest in our strong product portfolio, including our ageLOC products. We introduced ageLOC TR90 in the majority of our markets in the EMEA region through limited-time-o� ers in the second half of 2013. Our Sales Leaders in EMEA decreased by 1% and our Actives increased by 3% when compared to 2012.
GROSS PROFITGross profi t as a percentage of revenue in 2013 increased to 84.1% compared to 83.4% in 2012. This increase refl ects strong gross margins on a consolidated basis for our ageLOC TR90 products. Similarly, revenue growth in Mainland China, where our gross margin on a con-solidated basis benefi ts from our self-manufactured products, also continued to positively impact our gross profi t as a percentage of revenue. Decreased utilization of our manufacturing operations in Mainland China due to voluntary measures we have taken in Mainland China could have a small negative impact on our gross profi t as a percentage of revenue.
SELLING EXPENSESSelling expenses as a percentage of revenue increased to 46.5% in 2013 compared to 43.7% in 2012. This increase was largely due to growth in the number of Sales Leaders qualifying for increased sales compensa-tion and promotional incentives in connection with our limited-time o� ers in the second half of 2013. Because the salaries of our sales employees in Mainland China are adjusted on a quarterly basis, we currently expect that the negative revenue impact of voluntary measures we have taken in Mainland China will increase our selling expenses as a percentage of revenue in the near to intermediate term.
GENERAL AND ADMINISTRATIVE EXPENSESAlthough our general and administrative expenses increased by $134.6 million, compared to the prior-year, as we grew our operations to support the growth of our business, general and administrative ex-penses as a percentage of revenue decreased to 20.2% in 2013 from 23.7% in 2012. This improvement was due to our signifi cant revenue growth, particularly from the large amount of limited-time-o� er sales of ageLOC TR90. We currently anticipate that the negative revenue impact of voluntary measures we have taken in Mainland China will
increase our general and administrative expenses as a percentage of revenue in 2014.
OTHER INCOME (EXPENSE), NETOther income (expense), net was $2.8 million of income in 2013 com-pared to $4.4 million of income in 2012. The decrease in income was due primarily to the impact of changes in foreign currency exchange rates. Because it is impossible to predict foreign currency fl uctua-tions, we cannot estimate the degree to which our other income (expense) will be impacted in the future.
PROVISION FOR INCOME TAXESProvision for income taxes increased to $192.1 million in 2013 from $123.6 million in 2012. The e� ective tax rate decreased to 34.5% in 2013 from 35.8% of pre-tax income in 2012. The decrease in our e� ec-tive tax rate is primarily due to a portion of our non-U.S. earnings being indefi nitely reinvested outside the U.S. in connection with the build-out of our regional headquarters and other infrastructure in Mainland China. We anticipate our tax rate will be approximately 34.0% to 35.5% in 2014.
NET INCOMEAs a result of the foregoing factors, net income in 2013 increased to $364.9 million, compared to $221.6 million in 2012.
2012 COMPARED TO 2011
OVERVIEWRevenue in 2012 increased 24% to $2.1 billion from $1.7 billion in 2011. Our revenue growth in 2012 was driven by sustained interest in our product portfolio, including our ageLOC anti-aging products, as well as growth in our Sales Leaders and Actives. Limited-time o� ers of ageLOC R2 and ageLOC Body Spa and related products in connec-tion with a series of regional events generated approximately $116 million in our Greater China region and approximately $68 million in our South Asia/Pacifi c region during the second and third quarters of 2012. Foreign currency exchange fl uctuations had a 1% negative im-pact on revenue in 2012 compared to 2011. Globally, our Sales Leaders and Actives grew 24% and 11%, respectively, compared to the prior-year period.
Earnings per share in 2012 increased to $3.52, compared to $2.38 in 2011, or $2.69 excluding charges of $32.8 million associated with the 2011 Japan customs ruling, discussed below under Gross Profi t, on a diluted basis. Earnings per share excluding Japan customs expense is a non-GAAP fi nancial measure. See “Non-GAAP Financial Measures” below. The increase in earnings is largely the result of increased revenue, as discussed above, coupled with improved margins and controlled expenses.
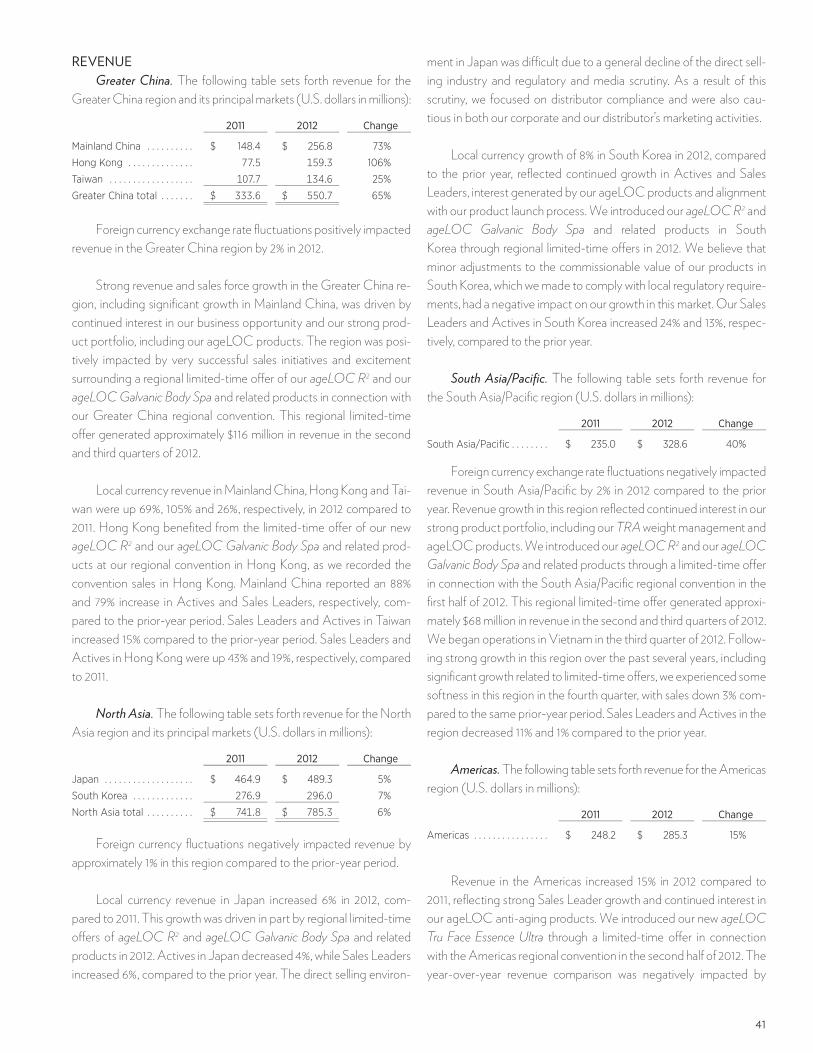
41
REVENUEGreater China. The following table sets forth revenue for the
Greater China region and its principal markets (U.S. dollars in millions):
2011 2012 Change
Mainland China . . . . . . . . . . $ 148.4 $ 256.8 73%
Hong Kong . . . . . . . . . . . . . . 77.5 159.3 106%
Taiwan . . . . . . . . . . . . . . . . . . 107.7 134.6 25%
Greater China total . . . . . . . $ 333.6 $ 550.7 65%
Foreign currency exchange rate fl uctuations positively impacted revenue in the Greater China region by 2% in 2012.
Strong revenue and sales force growth in the Greater China re-gion, including signifi cant growth in Mainland China, was driven by continued interest in our business opportunity and our strong prod-uct portfolio, including our ageLOC products. The region was posi-tively impacted by very successful sales initiatives and excitement surrounding a regional limited-time o� er of our ageLOC R2 and our ageLOC Galvanic Body Spa and related products in connection with our Greater China regional convention. This regional limited-time o� er generated approximately $116 million in revenue in the second and third quarters of 2012.
Local currency revenue in Mainland China, Hong Kong and Tai-wan were up 69%, 105% and 26%, respectively, in 2012 compared to 2011. Hong Kong benefi ted from the limited-time o� er of our new ageLOC R2 and our ageLOC Galvanic Body Spa and related prod-ucts at our regional convention in Hong Kong, as we recorded the convention sales in Hong Kong. Mainland China reported an 88% and 79% increase in Actives and Sales Leaders, respectively, com-pared to the prior-year period. Sales Leaders and Actives in Taiwan increased 15% compared to the prior-year period. Sales Leaders and Actives in Hong Kong were up 43% and 19%, respectively, compared to 2011.
North Asia. The following table sets forth revenue for the North Asia region and its principal markets (U.S. dollars in millions):
2011 2012 Change
Japan . . . . . . . . . . . . . . . . . . . $ 464.9 $ 489.3 5%
South Korea . . . . . . . . . . . . . 276.9 296.0 7%
North Asia total . . . . . . . . . . $ 741.8 $ 785.3 6%
Foreign currency fl uctuations negatively impacted revenue by approximately 1% in this region compared to the prior-year period.
Local currency revenue in Japan increased 6% in 2012, com-pared to 2011. This growth was driven in part by regional limited-time o� ers of ageLOC R2 and ageLOC Galvanic Body Spa and related products in 2012. Actives in Japan decreased 4%, while Sales Leaders increased 6%, compared to the prior year. The direct selling environ-
ment in Japan was di� cult due to a general decline of the direct sell-ing industry and regulatory and media scrutiny. As a result of this scrutiny, we focused on distributor compliance and were also cau-tious in both our corporate and our distributor’s marketing activities.
Local currency growth of 8% in South Korea in 2012, compared to the prior year, refl ected continued growth in Actives and Sales Leaders, interest generated by our ageLOC products and alignment with our product launch process. We introduced our ageLOC R2 and ageLOC Galvanic Body Spa and related products in South Korea through regional limited-time o� ers in 2012. We believe that minor adjustments to the commissionable value of our products in South Korea, which we made to comply with local regulatory require-ments, had a negative impact on our growth in this market. Our Sales Leaders and Actives in South Korea increased 24% and 13%, respec-tively, compared to the prior year.
South Asia/Pacifi c. The following table sets forth revenue for the South Asia/Pacifi c region (U.S. dollars in millions):
2011 2012 Change
South Asia/Pacific . . . . . . . . $ 235.0 $ 328.6 40%
Foreign currency exchange rate fl uctuations negatively impacted revenue in South Asia/Pacifi c by 2% in 2012 compared to the prior year. Revenue growth in this region refl ected continued interest in our strong product portfolio, including our TRA weight management and ageLOC products. We introduced our ageLOC R2 and our ageLOC Galvanic Body Spa and related products through a limited-time o� er in connection with the South Asia/Pacifi c regional convention in the fi rst half of 2012. This regional limited-time o� er generated approxi-mately $68 million in revenue in the second and third quarters of 2012. We began operations in Vietnam in the third quarter of 2012. Follow-ing strong growth in this region over the past several years, including signifi cant growth related to limited-time o� ers, we experienced some softness in this region in the fourth quarter, with sales down 3% com-pared to the same prior-year period. Sales Leaders and Actives in the region decreased 11% and 1% compared to the prior year.
Americas. The following table sets forth revenue for the Americas region (U.S. dollars in millions):
2011 2012 Change
Americas . . . . . . . . . . . . . . . . $ 248.2 $ 285.3 15%
Revenue in the Americas increased 15% in 2012 compared to 2011, refl ecting strong Sales Leader growth and continued interest in our ageLOC anti-aging products. We introduced our new ageLOC Tru Face Essence Ultra through a limited-time o� er in connection with the Americas regional convention in the second half of 2012. The year-over-year revenue comparison was negatively impacted by
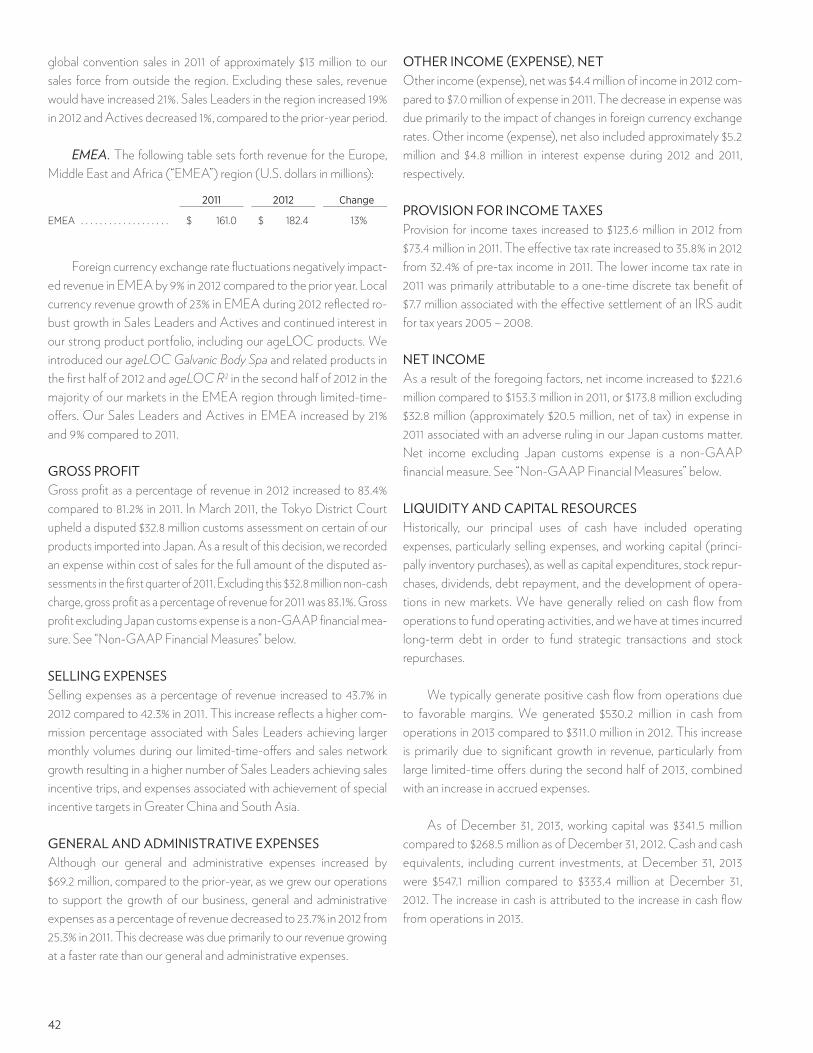
42
global convention sales in 2011 of approximately $13 million to our sales force from outside the region. Excluding these sales, revenue would have increased 21%. Sales Leaders in the region increased 19% in 2012 and Actives decreased 1%, compared to the prior-year period.
EMEA. The following table sets forth revenue for the Europe, Middle East and Africa (“EMEA”) region (U.S. dollars in millions):
2011 2012 Change
EMEA . . . . . . . . . . . . . . . . . . . $ 161.0 $ 182.4 13%
Foreign currency exchange rate fl uctuations negatively impact-ed revenue in EMEA by 9% in 2012 compared to the prior year. Local currency revenue growth of 23% in EMEA during 2012 refl ected ro-bust growth in Sales Leaders and Actives and continued interest in our strong product portfolio, including our ageLOC products. We introduced our ageLOC Galvanic Body Spa and related products in the fi rst half of 2012 and ageLOC R2 in the second half of 2012 in the majority of our markets in the EMEA region through limited-time-o� ers. Our Sales Leaders and Actives in EMEA increased by 21% and 9% compared to 2011.
GROSS PROFITGross profi t as a percentage of revenue in 2012 increased to 83.4% compared to 81.2% in 2011. In March 2011, the Tokyo District Court upheld a disputed $32.8 million customs assessment on certain of our products imported into Japan. As a result of this decision, we recorded an expense within cost of sales for the full amount of the disputed as-sessments in the fi rst quarter of 2011. Excluding this $32.8 million non-cash charge, gross profi t as a percentage of revenue for 2011 was 83.1%. Gross profi t excluding Japan customs expense is a non-GAAP fi nancial mea-sure. See “Non-GAAP Financial Measures” below.
SELLING EXPENSESSelling expenses as a percentage of revenue increased to 43.7% in 2012 compared to 42.3% in 2011. This increase refl ects a higher com-mission percentage associated with Sales Leaders achieving larger monthly volumes during our limited-time-o� ers and sales network growth resulting in a higher number of Sales Leaders achieving sales incentive trips, and expenses associated with achievement of special incentive targets in Greater China and South Asia.
GENERAL AND ADMINISTRATIVE EXPENSESAlthough our general and administrative expenses increased by $69.2 million, compared to the prior-year, as we grew our operations to support the growth of our business, general and administrative expenses as a percentage of revenue decreased to 23.7% in 2012 from 25.3% in 2011. This decrease was due primarily to our revenue growing at a faster rate than our general and administrative expenses.
OTHER INCOME (EXPENSE), NETOther income (expense), net was $4.4 million of income in 2012 com-pared to $7.0 million of expense in 2011. The decrease in expense was due primarily to the impact of changes in foreign currency exchange rates. Other income (expense), net also included approximately $5.2 million and $4.8 million in interest expense during 2012 and 2011, respectively.
PROVISION FOR INCOME TAXESProvision for income taxes increased to $123.6 million in 2012 from $73.4 million in 2011. The e� ective tax rate increased to 35.8% in 2012 from 32.4% of pre-tax income in 2011. The lower income tax rate in 2011 was primarily attributable to a one-time discrete tax benefi t of $7.7 million associated with the e� ective settlement of an IRS audit for tax years 2005 – 2008.
NET INCOMEAs a result of the foregoing factors, net income increased to $221.6 million compared to $153.3 million in 2011, or $173.8 million excluding $32.8 million (approximately $20.5 million, net of tax) in expense in 2011 associated with an adverse ruling in our Japan customs matter. Net income excluding Japan customs expense is a non-GAAP fi nancial measure. See “Non-GAAP Financial Measures” below.
LIQUIDITY AND CAPITAL RESOURCESHistorically, our principal uses of cash have included operating expenses, particularly selling expenses, and working capital (princi-pally inventory purchases), as well as capital expenditures, stock repur-chases, dividends, debt repayment, and the development of opera-tions in new markets. We have generally relied on cash fl ow from operations to fund operating activities, and we have at times incurred long-term debt in order to fund strategic transactions and stock repurchases.
We typically generate positive cash fl ow from operations due to favorable margins. We generated $530.2 million in cash from operations in 2013 compared to $311.0 million in 2012. This increase is primarily due to signifi cant growth in revenue, particularly from large limited-time o� ers during the second half of 2013, combined with an increase in accrued expenses.
As of December 31, 2013, working capital was $341.5 million compared to $268.5 million as of December 31, 2012. Cash and cash equivalents, including current investments, at December 31, 2013 were $547.1 million compared to $333.4 million at December 31, 2012. The increase in cash is attributed to the increase in cash fl ow from operations in 2013.

43
Capital expenditures in 2013 totaled $185.1 million, and we an-ticipate capital expenditures of approximately $180.0 million for 2014. The capital expenditures in 2014 will be primarily related to:
• a new Greater China regional headquarters in Shanghai, China and continued development projects related to our recently constructed innovation center on our Provo campus;
• expansion of manufacturing facilities in Mainland China;
• the build-out and upgrade of leasehold improvements in our various markets, including retail stores and service centers in Mainland China; and
• purchases of computer systems and software, including equipment and development costs.

44
We currently have debt pursuant to various credit facilities and other borrowings. Our book value for both the individual and consoli-dated debt included in the table below approximates fair value. The estimated fair value of our debt is based on interest rates available for debt with similar terms and remaining maturities. We have classifi ed these instruments as Level 2 in the fair value hierarchy. The following table summarizes our long-term debt arrangements:
Facility or Arrangement
Original Principal Amount
Balance as of December 31,
2013(1)
Interest Rate Repayment terms
Multi-currency uncommittedshelf facility:
U.S. dollar denominated: $40.0 million $17.1 million 6.2% Notes due July 2016 with annual principal payments that began in July 2010.
$20.0 million $11.4 million 6.2% Notes due January 2017 with annual principal payments that began in January 2011.
Japanese yen denominated: 3.1 billion yen 0.4 billion yen ($4.1 million as of December 31, 2013)
1.7% Notes due April 2014 with annual principal payments that began in April 2008.
2.3 billion yen 1.3 billion yen ($12.3 million as of December 31, 2013)
2.6% Notes due September 2017 with annual principal payments that began in September 2011.
2.2 billion yen 1.2 billion yen ($11.8 million as of December 31, 2013)
3.3% Notes due January 2017 with annual principal payments that began in January 2011.
8.0 billion yen 8.0 billion yen($75.8 million as of December 31, 2013)
1.7% Notes due May 2022 with annual principal payments that begin in May 2016.
Committed loan:U.S. dollar denominated $30.0 million $0 N/A N/A
Revolving credit facilities2010 $35.0 million $35.0 million Variable
30 day: 0.670%
Revolving line of credit
2013(2) $14.0 million $14.0 million Variable 30 day:
0.5933%
Revolving line of credit
(1) The current portion of our long-term debt (i.e. becoming due in the next 12 months) includes $10.2 million of the balance of our Japanese yen-denominated debt under the
multi-currency uncommitted shelf facility, $8.6 million of the balance on our U.S. dollar denominated debt under the multi-currency uncommitted shelf facility and $49.0
million of our revolving loans. (2) On September 5, 2013, we entered into a loan agreement with Bank of America, N.A. for a 364 day revolving line of credit with a commitment amount of $50.0 million. The
interest rate is equal to 1 month LIBOR plus 42.5 basis points.
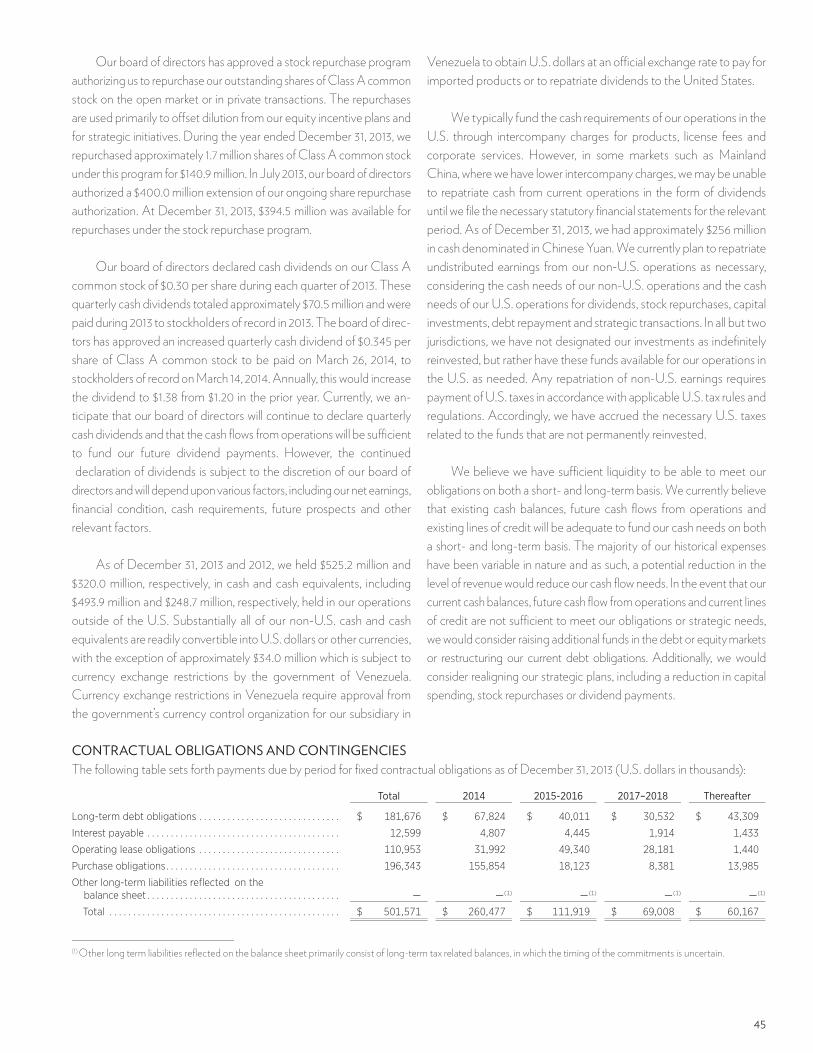
45
Our board of directors has approved a stock repurchase program authorizing us to repurchase our outstanding shares of Class A common stock on the open market or in private transactions. The repurchases are used primarily to o� set dilution from our equity incentive plans and for strategic initiatives. During the year ended December 31, 2013, we repurchased approximately 1.7 million shares of Class A common stock under this program for $140.9 million. In July 2013, our board of directors authorized a $400.0 million extension of our ongoing share repurchase authorization. At December 31, 2013, $394.5 million was available for repurchases under the stock repurchase program.
Our board of directors declared cash dividends on our Class A common stock of $0.30 per share during each quarter of 2013. These quarterly cash dividends totaled approximately $70.5 million and were paid during 2013 to stockholders of record in 2013. The board of direc-tors has approved an increased quarterly cash dividend of $0.345 per share of Class A common stock to be paid on March 26, 2014, to stockholders of record on March 14, 2014. Annually, this would increase the dividend to $1.38 from $1.20 in the prior year. Currently, we an-ticipate that our board of directors will continue to declare quarterly cash dividends and that the cash fl ows from operations will be su� cient to fund our future dividend payments. However, the continued declaration of dividends is subject to the discretion of our board of directors and will depend upon various factors, including our net earnings, fi nancial condition, cash requirements, future prospects and other relevant factors.
As of December 31, 2013 and 2012, we held $525.2 million and $320.0 million, respectively, in cash and cash equivalents, including $493.9 million and $248.7 million, respectively, held in our operations outside of the U.S. Substantially all of our non-U.S. cash and cash equivalents are readily convertible into U.S. dollars or other currencies, with the exception of approximately $34.0 million which is subject to currency exchange restrictions by the government of Venezuela. Currency exchange restrictions in Venezuela require approval from the government’s currency control organization for our subsidiary in
Venezuela to obtain U.S. dollars at an o� cial exchange rate to pay for imported products or to repatriate dividends to the United States.
We typically fund the cash requirements of our operations in the U.S. through intercompany charges for products, license fees and corporate services. However, in some markets such as Mainland China, where we have lower intercompany charges, we may be unable to repatriate cash from current operations in the form of dividends until we fi le the necessary statutory fi nancial statements for the relevant period. As of December 31, 2013, we had approximately $256 million in cash denominated in Chinese Yuan. We currently plan to repatriate undistributed earnings from our non-U.S. operations as necessary, considering the cash needs of our non-U.S. operations and the cash needs of our U.S. operations for dividends, stock repurchases, capital investments, debt repayment and strategic transactions. In all but two jurisdictions, we have not designated our investments as indefi nitely reinvested, but rather have these funds available for our operations in the U.S. as needed. Any repatriation of non-U.S. earnings requires payment of U.S. taxes in accordance with applicable U.S. tax rules and regulations. Accordingly, we have accrued the necessary U.S. taxes related to the funds that are not permanently reinvested.
We believe we have su� cient liquidity to be able to meet our obligations on both a short- and long-term basis. We currently believe that existing cash balances, future cash fl ows from operations and existing lines of credit will be adequate to fund our cash needs on both a short- and long-term basis. The majority of our historical expenses have been variable in nature and as such, a potential reduction in the level of revenue would reduce our cash fl ow needs. In the event that our current cash balances, future cash fl ow from operations and current lines of credit are not su� cient to meet our obligations or strategic needs, we would consider raising additional funds in the debt or equity markets or restructuring our current debt obligations. Additionally, we would consider realigning our strategic plans, including a reduction in capital spending, stock repurchases or dividend payments.
CONTRACTUAL OBLIGATIONS AND CONTINGENCIESThe following table sets forth payments due by period for fi xed contractual obligations as of December 31, 2013 (U.S. dollars in thousands):
Total 2014 2015-2016 2017–2018 Thereafter
Long-term debt obligations . . . . . . . . . . . . . . . . . . . . . . . . . . . . . . $ 181,676 $ 67,824 $ 40,011 $ 30,532 $ 43,309
Interest payable . . . . . . . . . . . . . . . . . . . . . . . . . . . . . . . . . . . . . . . . . 12,599 4,807 4,445 1,914 1,433
Operating lease obligations . . . . . . . . . . . . . . . . . . . . . . . . . . . . . . 110,953 31,992 49,340 28,181 1,440
Purchase obligations . . . . . . . . . . . . . . . . . . . . . . . . . . . . . . . . . . . . . 196,343 155,854 18,123 8,381 13,985
Other long-term liabilities reflected on the balance sheet . . . . . . . . . . . . . . . . . . . . . . . . . . . . . . . . . . . . . . . . . — —(1) —(1) —(1) —(1)
Total . . . . . . . . . . . . . . . . . . . . . . . . . . . . . . . . . . . . . . . . . . . . . . . . . $ 501,571 $ 260,477 $ 111,919 $ 69,008 $ 60,167
(1) Other long term liabilities refl ected on the balance sheet primarily consist of long-term tax related balances, in which the timing of the commitments is uncertain.

46
CONTINGENT LIABILITIESWe are currently involved in a dispute with customs authorities in Japan related to additional customs assessments on several of our products made by Yokohama Customs for the period of October 2006 through September 2009 in connection with post-importation audits, as well as the disputed portion of our import duties from Oc-tober 2009 to the present, which we have or will hold in bond or pay under protest. Additional assessments related to any prior period are barred by applicable statutes of limitations. The aggregate amount of these assessments and disputed duties was 4.2 billion Japanese yen as of December 31, 2013 (approximately $40.2 million), net of any recovery of consumption taxes. In addition, we are currently being required to post a bond or make a deposit equal to the di� erence between our declared duties and the amount the customs authorities have determined we should be paying on all current imports. We an-ticipate that additional disputed duties will be limited going forward as we have entered into an arrangement to purchase a major-ity of the a� ected products in Japan from a Japanese company that purchases and imports the products from the manufacturer. We are now pursuing this matter in Tokyo District Court. This dispute is separate and distinct from the dispute related to customs assess-ments on certain of the Company’s products imported into Japan during the period of October 2002 through July 2005.
Following a number of negative media stories published in Janu-ary 2014 by the People’s Daily in Mainland China, we received inquiries from various government regulators in Mainland China asking us to respond to a number of allegations relating to our business practices, products and business model. In response to this media and regula-tory scrutiny we have voluntarily taken a number of actions in Mainland China, including temporarily suspending our business promotional meetings, temporarily suspending acceptance of applications for any new sales representatives, and extending our product refund and return policies. The adverse publicity and suspension of business promo-tional meetings and acceptance of applications has had a signifi cant negative impact on the number of Sales Leaders and Actives, and our revenue in the short term will be negatively impacted by these voluntary actions. Any inability to resume normal business operations in the near term could have a more signifi cant impact on our business. Our Audit Committee also commenced an internal review of our business prac-tices in Mainland China, which is ongoing. Based upon the results of the internal review to date, we currently plan to focus our attention during the next several months on training our sales force and reinforcing or enhancing our existing sales and other policies in Mainland China. It is currently unclear what impact the adverse publicity and our volun-tary actions will have on our business in this market in the longer term or whether these voluntary actions will be e� ective in addressing con-cerns of regulators in Mainland China. Regardless, it is likely that we will be fi ned and could potentially face some other form of sanctions from these regulators. These other sanctions could include a formal suspen-
sion of our ability to recruit new sales people and direct sellers, a tem-porary suspension of our ability to sell products in various markets or, in the most extreme cases, loss of existing licenses to operate in various jurisdictions in Mainland China. While any of these actions or outcomes could materially harm our business and fi nancial condition, we have not accrued for any related costs as of December 31, 2013.
In addition, we are currently being sued in several purported class action lawsuits and a derivative claim relating to this recent negative media and regulatory scrutiny and the associated decline in our stock price. These lawsuits, or others fi led alleging similar facts, could result in monetary or other penalties that may a� ect our operating results and fi nancial condition.
Please refer to Item 1A. “Risk Factors” and Item 3. “Legal Proceedings” for more information regarding these matters.
SEASONALITY AND CYCLICALITYIn addition to general economic factors, we are impacted by seasonal factors and trends such as major cultural events and vacation patterns. For example, most Asian markets celebrate their respective local New Year in the fi rst quarter, which generally has a negative im-pact on that quarter. We believe that direct selling in Japan, the United States and Europe is also generally negatively impacted during the third quarter, when many individuals, including our sales force, traditionally take vacations.
We have experienced rapid revenue growth in certain new markets following commencement of operations. This initial rapid growth has often been followed by a short period of stable or declining revenue, then followed by renewed growth fueled by product introductions, an increase in the number of Actives and increased sales force productivity. The contraction following initial rapid growth has been more pronounced in certain new markets, due to other factors such as business or eco-nomic conditions or sales force distractions outside the market.
Although our product launch process may vary by market, we generally introduce new products to our sales force and consumers in all markets where the products are registered, through limited-time o� ers. The limited-time o� ers typically generate signifi cant activity and a high level of purchasing, which may result in a higher than normal increase in revenue during the quarter of the limited-time o� er and skew year-over-year and sequential comparisons.
ACTIVES AND SALES LEADERSThe following table provides information concerning the number of Actives and Sales Leaders as of the dates indicated. “Actives” are per-sons who have purchased products directly from the company during the three months ended as of the date indicated. “Sales Leaders” include our independent distributors who have completed and who maintain

47
specifi ed sales requirements, and our sales employees and contractual sales promoters in Mainland China, who have completed certain qualifi cation requirements.
As of December 31, 2011 As of December 31, 2012 As of December 31, 2013
Actives Sales Leaders Actives Sales Leaders Actives Sales Leaders
Greater China . . . . . . . . . . . . . . . . . . . . . 143,000 11,808 216,000 18,527 490,000 61,546
North Asia . . . . . . . . . . . . . . . . . . . . . . . . 338,000 15,293 349,000 17,395 409,000 19,816
South Asia/Pacific . . . . . . . . . . . . . . . . . 99,000 5,619 98,000 4,988 120,000 7,992
Americas . . . . . . . . . . . . . . . . . . . . . . . . . . 166,000 5,356 164,000 6,352 193,000 8,274
EMEA . . . . . . . . . . . . . . . . . . . . . . . . . . . . . 109,000 3,740 119,000 4,528 123,000 4,489
Total . . . . . . . . . . . . . . . . . . . . . . . . . . . . . 855,000 41,816 946,000 51,790 1,335,000 102,117
QUARTERLY RESULTSThe following table sets forth selected unaudited quarterly data for the periods shown as revised (U.S. dollars in millions, except per share amounts):
2012 2013
1st
Quarter2nd
Quarter3rd
Quarter4th
Quarter1st
Quarter2nd
Quarter3rd
Quarter4th
Quarter
Revenue . . . . . . . . . . . . . . . . $ 456.2 $ 577.2 $ 519.7 $ 579.2 $ 541.3 $ 671.3 $ 908.3 $ 1,055.8
Gross profit . . . . . . . . . . . . . 380.4 481.6 433.0 484.1 451.3 560.0 768.5 891.1
Operating income . . . . . . . 71.6 97.9 82.4 88.9 82.6 114.6 168.3 188.6
Net income . . . . . . . . . . . . . . 47.8 60.4 54.2 59.2 54.3 74.4 110.9 125.3
Net income per share:
Basic . . . . . . . . . . . . . . . . . . 0.77 0.98 0.90 1.01 0.93 1.27 1.89 2.13
Diluted. . . . . . . . . . . . . . . . . 0.74 0.94 0.87 0.97 0.90 1.22 1.80 2.02
RECENT ACCOUNTING PRONOUNCEMENTSIn February 2013, the FASB issued ASU No. 2013-02, Reporting of Amounts Reclassifi ed Out of Accumulated Other Comprehensive Income. This pronouncement was issued to improve the reporting of reclassifi cations out of accumulated other comprehensive income. The amendments in this update seek to attain that objective by requiring an entity to report the e� ect of signifi cant reclassifi cations out of accumulated other comprehensive income on the respective line items in net income if the amount being reclassifi ed is required under U.S. GAAP to be reclassifi ed in its entirety to net income. For other amounts that are not required under U.S. GAAP to be reclas-sifi ed in their entirety to net income in the same reporting period, an entity is required to cross-reference other disclosures required under U.S. GAAP that provide additional detail about those amounts. This would be the case when a portion of the amount reclassifi ed out of accumulated other comprehensive income is reclassifi ed to a balance sheet account (i.e. inventory) instead of directly to income or expense in the same reporting period. This pronouncement is e� ective pro-spectively for reporting periods beginning after December 15, 2012. The adoption of ASU 2013-02 did not have a material impact on our consolidated fi nancial position, results of operations or cash fl ows.
In July 2013, the FASB issued ASU No. 2013-11, Income Taxes (Topic 740): Presentation of an Unrecognized Tax Benefi t When a Net Operating Loss Carryforward, a Similar Tax Loss, or a Tax Credit Carry-forward Exists (a consensus of the Emerging Issues Task Force). This ASU
addresses when unrecognized tax benefi ts should be presented as reductions to deferred tax assets for net operating loss carryforwards in the fi nancial statements. This ASU is e� ective prospectively for fi s-cal years, and interim periods within those years, beginning after De-cember 15, 2013. Early adoption and retrospective application is permit-ted. The Company did not early adopt and does not anticipate the adoption of ASU 2013-11 to have a material impact to the consolidated fi nancial position, results of operations or cash fl ows.
CURRENCY RISK AND EXCHANGE RATE INFORMATIONA majority of our revenue and many of our expenses are recognized outside of the United States, except for inventory purchases, which are primarily transacted in U.S. dollars from vendors in the United States. The local currency of each of our subsidiaries’ primary markets is considered the functional currency. All revenue and expenses are translated at weighted-average exchange rates for the periods re-ported. Therefore, our reported revenue and earnings will be posi-tively impacted by a weakening of the U.S. dollar and will be nega-tively impacted by a strengthening of the U.S. dollar. Given the large portion of our business derived from Mainland China, Japan and South Korea, any weakening of these currencies negatively impacts reported revenue and profi ts, whereas a strengthening of these cur-rencies positively impacts our reported revenue and profi ts. Given the uncertainty of exchange rate fl uctuations, it is di� cult to predict the e� ect of these fl uctuations on our future business, product pric-ing and results of operations or fi nancial condition.

48
Foreign exchange risk is managed in certain jurisdictions through the use of foreign currency debt. Portions of our Japanese yen borrow-ings have been designated, and are e� ective as, economic hedges of the net investment in a foreign operation. Accordingly, foreign cur-rency transaction gains or losses due to spot rate fl uctuations on these debt instruments are included in foreign currency translation adjustment within other comprehensive income. Included in the cumulative trans-lation adjustment are $0.9 million of pretax net losses, $7.3 million of pretax net gains and $10.5 million of pretax net gains for the years ended December 31, 2011, 2012 and 2013, respectively from Japanese yen borrowings.
Additionally, we may seek to reduce our exposure to fl uctuations in foreign currency exchange rates through the use of foreign currency exchange contracts and through intercompany loans of foreign cur-rency. We do not use derivative fi nancial instruments for trading or
speculative purposes. We regularly monitor our foreign currency risks and periodically take measures to reduce the impact of foreign exchange fl uctuations on our operating results. We held forward contracts des-ignated as foreign currency cash fl ow hedges with notional amounts totaling approximately 2.5 billion Japanese yen ($23.7 million as of December 31, 2013) and 12 million euros ($16.5 million as of December 31, 2013) to hedge forecasted foreign-currency-denominated intercom-pany transactions; and at December 31, 2012, we held approximately 1.9 billion Japanese yen ($21.9 million as of December 31, 2012) and no euros. Because of our foreign exchange contracts at December 31, 2013, the impact of a 10% appreciation or 10% depreciation of the U.S. dollar against the Japanese yen would not represent a material potential loss in fair value, earnings or cash fl ows against these contracts. This poten-tial loss does not consider the underlying foreign currency transaction or translation exposures to which we are subject.
Following are the weighted-average currency exchange rates of U.S. $1 into local currency for each of our international or foreign markets in which revenue exceeded U.S. $5.0 million for at least one of the quarters listed::
2012 2013
1st Quarter 2nd Quarter 3rd Quarter 4th Quarter 1st Quarter 2nd Quarter 3rd Quarter 4th Quarter
Japan(1) . . . . . . . . . . . . . . . 79.3 80.1 78.6 81.1 92.6 98.7 98.9 100.1
Taiwan. . . . . . . . . . . . . . . . 29.7 29.6 29.9 29.1 29.5 29.9 29.9 29.6
Hong Kong . . . . . . . . . . . . 7.8 7.8 7.8 7.8 7.8 7.8 7.8 7.8
South Korea . . . . . . . . . . 1,131.1 1,152.3 1,132.8 1,093.2 1,086.2 1,122.7 1,108.4 1,063.6
Malaysia . . . . . . . . . . . . . . 3.0 3.1 3.1 3.1 3.1 3.1 3.2 3.2
Thailand . . . . . . . . . . . . . . 30.9 31.3 31.4 30.7 29.8 29.9 31.5 31.8
Mainland China . . . . . . . . 6.3 6.3 6.4 6.3 6.2 6.2 6.1 6.1
Singapore . . . . . . . . . . . . . 1.3 1.3 1.2 1.2 1.2 1.2 1.3 1.2
Canada . . . . . . . . . . . . . . . 1.0 1.0 1.0 1.0 1.0 1.0 1.0 1.0
Philippines . . . . . . . . . . . . 43.0 42.7 41.8 41.2 40.7 41.9 43.7 43.6
Australia/New Zealand . 0.9 1.0 1.0 1.0 1.0 1.0 1.1 1.1
Venezuela . . . . . . . . . . . . . 4.35 4.35 4.35 4.35 5.7 6.3 6.3 6.3
Indonesia . . . . . . . . . . . . . 9,087 9,292 9,491 9,491 9,679 9,793 10,589 11,559
(1) As of January 31, 2014, the exchange rate of U.S. $1 into the Japanese yen was approximately 102.04.
NON-GAAP FINANCIAL MEASURES Regulation G, Conditions for Use of Non-GAAP Financial Measures, and other SEC regulations defi ne and prescribe the conditions for use of certain non-GAAP fi nancial information. Our measures of earnings per share, gross profi t and net income, each excluding the Japan customs expense, meet the defi nition of non-GAAP fi nancial measures. Earnings per share, gross profi t and net income, each excluding the Japan customs expense, are used in addition to and in conjunction with results pre-
sented in accordance with GAAP and should not be relied upon to the exclusion of GAAP fi nancial measures.
Management believes these non-GAAP fi nancial measures as-sist management and investors in evaluating, and comparing from period to period, results from ongoing operations in a more meaning-ful and consistent manner while also highlighting more meaningful trends in the results of operations.

49
The following is a reconciliation of gross profi t, as reported, to gross profi t excluding Japan customs expense for the years ended December 31, 2011 and 2012 (in thousands):
Year Ended December 31,
2011 2012
Revenue as reported . . . . . . . . . . . . . . . . . . . . . . . . . . . . . . . . . . . . . . . . . . . . . . . . . . . . . . . . . . . . . . . . . . . . . . . . . . . . . . . . . . . $ 1,719,588 $ 2,132,257
Gross profit as reported . . . . . . . . . . . . . . . . . . . . . . . . . . . . . . . . . . . . . . . . . . . . . . . . . . . . . . . . . . . . . . . . . . . . . . . . . . . . . . . . $ 1,396,964 $ 1,779,105
Japan customs expense . . . . . . . . . . . . . . . . . . . . . . . . . . . . . . . . . . . . . . . . . . . . . . . . . . . . . . . . . . . . . . . . . . . . . . . . . . . . . . . . 32,754 −
Gross profit excluding Japan customs expense . . . . . . . . . . . . . . . . . . . . . . . . . . . . . . . . . . . . . . . . . . . . . . . . . . . . . . . . . . $ 1,429,718 $ 1,779,105
Gross profit as a percent of revenue as reported . . . . . . . . . . . . . . . . . . . . . . . . . . . . . . . . . . . . . . . . . . . . . . . . . . . . . . . . . 81.2% 83.4%
Gross profit as a percent of revenue excluding Japan customs expense . . . . . . . . . . . . . . . . . . . . . . . . . . . . . . . . . . . 83.1%
The following is a reconciliation of net income and diluted earnings per share, as reported, to net income and diluted earnings per share excluding Japan customs expense for the years ended December 31, 2011 and 2012 (in thousands, except per share amounts):
Year Ended December 31,
2011 2012
Net income as reported . . . . . . . . . . . . . . . . . . . . . . . . . . . . . . . . . . . . . . . . . . . . . . . . . . . . . . . . . . . . . . . . . . . . . . . . . . . . . . . . $ 153,330 $ 221,645
Japan customs expense . . . . . . . . . . . . . . . . . . . . . . . . . . . . . . . . . . . . . . . . . . . . . . . . . . . . . . . . . . . . . . . . . . . . . . . . . . . . . . . . 32,754 −
Tax effect of Japan customs expense . . . . . . . . . . . . . . . . . . . . . . . . . . . . . . . . . . . . . . . . . . . . . . . . . . . . . . . . . . . . . . . . . . . (12,275) −
Net income excluding Japan customs expense . . . . . . . . . . . . . . . . . . . . . . . . . . . . . . . . . . . . . . . . . . . . . . . . . . . . . . . . . . $ 173,809 $ 221,645
Diluted earnings per share as reported . . . . . . . . . . . . . . . . . . . . . . . . . . . . . . . . . . . . . . . . . . . . . . . . . . . . . . . . . . . . . . . . . . $ 2.38 $ 3.52
Diluted earnings per share, excluding Japan customs expense . . . . . . . . . . . . . . . . . . . . . . . . . . . . . . . . . . . . . . . . . . . . $ 2.69
ITEM 7A. QUANTITATIVE AND QUALITATIVE DISCLOSURES ABOUT MARKET RISKThe information required by Item 7A of Form 10-K is incorporated herein by reference from the information contained in Item 7. “Management’s Discussion and Analysis of Financial Condition and Results of Operation - Currency Risk and Exchange Rate Information” and Note 16 to the Consolidated Financial Statements.
ITEM 8. FINANCIAL STATEMENTS AND SUPPLEMENTARY DATA
1. Financial Statements. Set forth below is the index to the Financial Statements included in this Item 8:
Page
Consolidated Balance Sheets at December 31, 2012 and 2013 51
Consolidated Statements of Income for the years ended 52December 31, 2011, 2012 and 2013
Consolidated Statements of Comprehensive Income for the years ended 53December 31, 2011, 2012 and 2013
Consolidated Statements of Stockholders’ Equity for the years ended 54December 31, 2011, 2012 and 2013
Consolidated Statements of Cash Flows for the years ended 55December 31, 2011, 2012 and 2013
Notes to Consolidated Financial Statements 56
Report of Independent Registered Public Accounting Firm 79
2. Financial Statement Schedules: Financial statement schedules have been omitted because they are not required or are not applicable, or because the required information is shown in the financial statements or notes thereto.
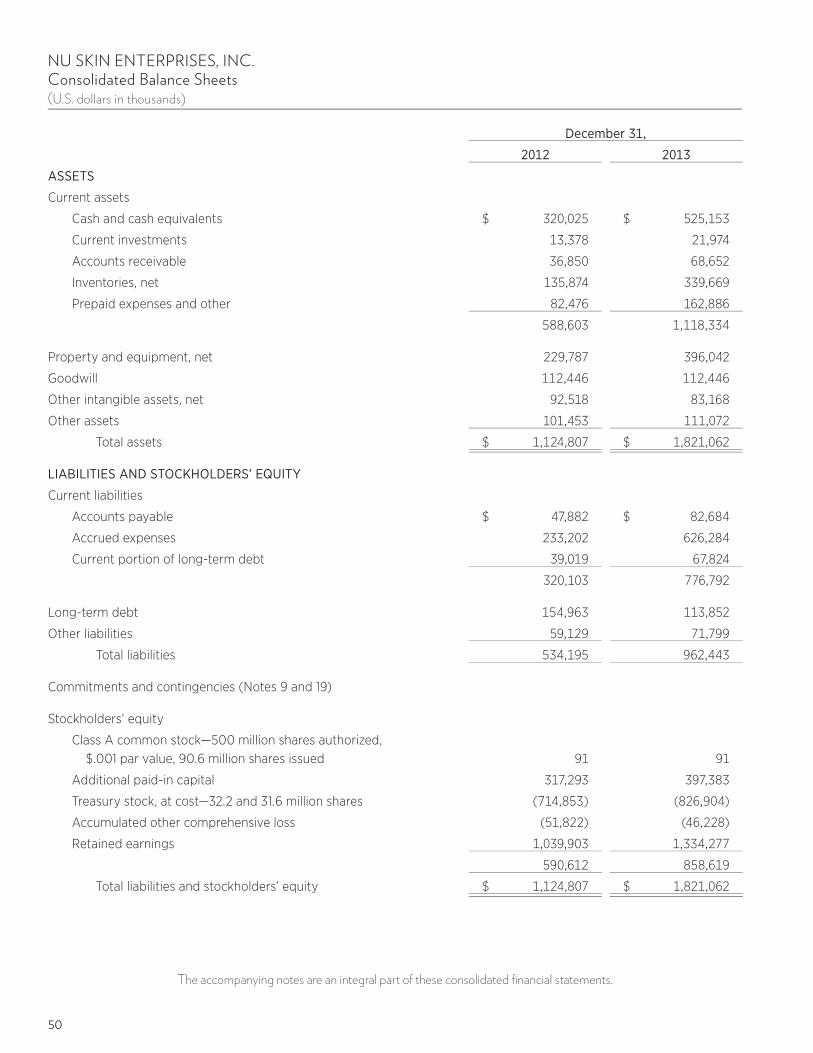
50
December 31,
2012 2013
ASSETS
Current assets
Cash and cash equivalents $ 320,025 $ 525,153
Current investments 13,378 21,974
Accounts receivable 36,850 68,652
Inventories, net 135,874 339,669
Prepaid expenses and other 82,476 162,886
588,603 1,118,334
Property and equipment, net 229,787 396,042
Goodwill 112,446 112,446
Other intangible assets, net 92,518 83,168
Other assets 101,453 111,072
Total assets $ 1,124,807 $ 1,821,062
LIABILITIES AND STOCKHOLDERS’ EQUITY
Current liabilities
Accounts payable $ 47,882 $ 82,684
Accrued expenses 233,202 626,284
Current portion of long-term debt 39,019 67,824
320,103 776,792
Long-term debt 154,963 113,852
Other liabilities 59,129 71,799
Total liabilities 534,195 962,443
Commitments and contingencies (Notes 9 and 19)
Stockholders’ equity
Class A common stock—500 million shares authorized, $.001 par value, 90.6 million shares issued 91 91
Additional paid-in capital 317,293 397,383
Treasury stock, at cost—32.2 and 31.6 million shares (714,853) (826,904)
Accumulated other comprehensive loss (51,822) (46,228)
Retained earnings 1,039,903 1,334,277
590,612 858,619
Total liabilities and stockholders’ equity $ 1,124,807 $ 1,821,062
NU SKIN ENTERPRISES, INC.Consolidated Balance Sheets(U.S. dollars in thousands)
The accompanying notes are an integral part of these consolidated fi nancial statements.

51
NU SKIN ENTERPRISES, INC.Consolidated Statements of Income(U.S. dollars in thousands, except per share amounts)
Year Ended December 31,
2011 2012 2013
Revenue $ 1,719,588 $ 2,132,257 $ 3,176,718
Cost of sales 322,624 353,152 505,806
Gross profit 1,396,964 1,779,105 2,670,912
Operating expenses:
Selling expenses 727,045 932,812 1,476,772
General and administrative expenses 436,177 505,449 640,028
Total operating expenses 1,163,222 1,438,261 2,116,800
Operating income 233,742 340,844 554,112
Other income (expense), net (Note 22) (6,973) 4,398 2,828
Income before provision for income taxes 226,769 345,242 556,940
Provision for income taxes 73,439 123,597 192,052
Net income $ 153,330 $ 221,645 $ 364,888
Net income per share:
Basic $ 2.47 $ 3.66 $ 6.23
Diluted $ 2.38 $ 3.52 $ 5.94
Weighted-average common shares outstanding (000s):
Basic 62,066 60,600 58,606
Diluted 64,546 63,025 61,448
The accompanying notes are an integral part of these consolidated fi nancial statements.

52
Year Ended December 31,
2011 2012 2013
Net income $ 153,330 $ 221,645 $ 364,888
Other comprehensive income, net of tax:
Foreign currency translation adjustment (2,985) 7,843 6,251
Net unrealized gains/(losses) on foreign currency cash flow hedges (1,954) 3,299 2,650
Less: Reclassification adjustment for realizedlosses/(gains) in current earnings 913 (399) (3,307)
(4,026) 10,743 5,594
Comprehensive income $ 149,304 $ 232,388 $ 370,482
The accompanying notes are an integral part of these consolidated fi nancial statements.
NU SKIN ENTERPRISES, INC.Consolidated Statements of Comprehensive Income (U.S. dollars in thousands)

53
Class A
Common
Stock
Additional
Paid-in
Capital
Treasury
Stock
Accumulated
Other
Comprehensive
Loss
Retained
Earnings Total
Balance at January 1, 2011 $ 91 $ 256,505 $ (476,748) $ (58,539) $ 749,940 $ 471,249
Net income — — — — 153,330 153,330
Other comprehensive income, net of tax — — — (4,026) — (4,026)
Repurchase of Class A common stock (Note 10) — — (67,149) — — (67,149)
Exercise of employee stock options (2.1 million shares)/vesting
of stock awards — 7,978 21,735 — — 29,713
Excess tax benefit from equity awards — 12,657 — — — 12,657
Stock-based compensation — 15,100 — — — 15,100
Cash dividends — — — — (36,638) (36,638)
Balance at December 31, 2011 91 292,240 (522,162) (62,565) 866,632 574,236
Net income — — — — 221,645 221,645
Other comprehensive income, net of tax — — — 10,743 — 10,743
Repurchase of Class A common stock (Note 10) — — (201,471) — — (201,471)
Exercise of employee stock options (0.8 million shares)/vesting
of stock awards — (4,214) 8,780 — — 4,566
Excess tax benefit from equity awards — 7,909 — — — 7,909
Stock-based compensation — 21,358 — — — 21,358
Cash dividends — — — — (48,374) (48,374)
Balance at December 31, 2012 91 317,293 (714,853) (51,822) 1,039,903 590,612
Net income — — — — 364,888 364,888
Other comprehensive income, net of tax — — — 5,594 — 5,594
Repurchase of Class A common stock (Note 10) — — (140,865) — — (140,865)
Exercise of employee stock options (2.2 million shares)/vesting
of stock awards — 5,556 28,814 — — 34,370
Excess tax benefit from equity awards — 41,914 — — — 41,914
Stock-based compensation — 32,620 — — — 32,620
Cash dividends — — — — (70,514) (70,514)
Balance at December 31, 2013 $ 91 $ 397,383 $ (826,904) $ (46,228) $ 1,334,277 $ 858,619
The accompanying notes are an integral part of these consolidated fi nancial statements.
NU SKIN ENTERPRISES, INC.Consolidated Statements of Stockholders’ Equity(U.S. dollars in thousands)

54
NU SKIN ENTERPRISES, INC.Consolidated Statements of Cash Flows(U.S. dollars in thousands)
Year Ended December 31,2011 2012 2013
Cash flows from operating activities: Net income $ 153,330 $ 221,645 $ 364,888 Adjustments to reconcile net income to net cash provided
by operating activities: Depreciation and amortization 32,850 33,412 34,923 Japan customs expense 32,754 — — Foreign currency (gains)/losses 4,162 (3,874) (1,077) Stock-based compensation 15,450 21,358 32,620 Deferred taxes 108 4,692 (41,748) Changes in operating assets and liabilities: Accounts receivable (5,890) (7,884) (34,304) Inventories, net 2,415 (22,605) (207,436) Prepaid expenses and other (4,690) (2,358) (23,317) Other assets (16,809) (11,579) (22,619) Accounts payable 6,077 15,831 32,643 Accrued expenses 1,624 62,056 389,093 Other liabilities 2,934 282 6,510
Net cash provided by operating activities 224,315 310,976 530,176
Cash flows from investing activities: Purchase of property and equipment (41,809) (96,645) (185,103) Proceeds on investment sales 6,634 20,086 13,075 Purchases of investments (24,361) (15,737) (21,671) Acquisitions (Note 23) (11,663) (12,562) —
Net cash used in investing activities (71,199) (104,858) (193,699)
Cash flows from financing activities: Payment of cash dividends (36,638) (48,374) (70,514) Repurchase of shares of common stock (67,149) (201,471) (140,865) Exercise of employee stock options and taxes paid
related to the net shares settlement of stock awards 29,713 4,565 34,370 Income tax benefit of equity awards 12,059 7,750 45,187 Payments on long-term debt (28,001) (28,279) (37,903) Related party payment (16,995) — — Proceeds from long-term debt — 101,922 49,000
Net cash used in financing activities (107,011) (163,887) (120,725)
Effect of exchange rate changes on cash (3,468) 4,820 (10,624)
Net increase in cash and cash equivalents 42,637 47,051 205,128
Cash and cash equivalents, beginning of period 230,337 272,974 320,025
Cash and cash equivalents, end of period $ 272,974 $ 320,025 $ 525,153
The accompanying notes are an integral part of these consolidated fi nancial statements.

55
NU SKIN ENTERPRISES, INC.Notes to Consolidated Financial Statements
1. THE COMPANYNu Skin Enterprises, Inc. (the “Company”) is a leading, global direct selling company that develops and distributes premium-quality, in-novative personal care products and nutritional supplements that are sold worldwide under the Nu Skin and Pharmanex brands and a small number of other products and services. Over the last fi ve years, the Company has introduced new Pharmanex nutritional supplements and Nu Skin personal care products under its ageLOC anti-aging brand. The Company reports revenue from fi ve geographic regions: Greater China, which consists of Mainland China, Hong Kong, Macau and Taiwan; North Asia, which consists of Japan and South Korea; South Asia/Pacifi c, which consists of Australia, Brunei, French Poly-nesia, Indonesia, Malaysia, New Caledonia, New Zealand, the Philip-pines, Singapore, Thailand and Vietnam; Americas, which consists of the United States, Canada and Latin America; and EMEA, which consists of several markets in Europe as well as Israel, Russia and South Africa (the Company’s subsidiaries operating in these countries are collectively referred to as the “Subsidiaries”).
2. SUMMARY OF SIGNIFICANT ACCOUNTING POLICIES
CONSOLIDATIONThe consolidated fi nancial statements include the accounts
of the Company and the Subsidiaries. All signifi cant intercompany accounts and transactions are eliminated in consolidation.
USE OF ESTIMATESThe preparation of these fi nancial statements, in conformity with
accounting principles generally accepted in the United States of America, required management to make estimates and assumptions that a� ected the reported amounts of assets and liabilities, and disclo-sure of contingent assets and liabilities, at the date of the fi nancial state-ments and the reported amounts of revenue and expenses during the reporting period. Actual results may di� er from these estimates.
REVISIONSCertain amounts applicable to the prior periods have been re-
vised to correct certain classifi cation errors in prior years. Specifi cally, the presentation of the Company’s consolidated balance sheets for the year ended December 31, 2012, was revised to decrease short-term deferred tax assets by $10.8 million, long-term deferred tax as-sets by $17.3 million and long-term deferred tax liabilities by $28.1 mil-lion. The revision had no e� ect on the results of operations (net or comprehensive income), fi nancial condition (stockholders’ equity), or
cash fl ows in any period presented or in any previously issued fi nancial statements.
Additionally, the presentation of the Company’s consolidated statements of income for the years ended December 31, 2011 and 2012, was revised to reduce selling expense and revenue by $24.4 mil-lion and $37.4 million related to an error in the classifi cation of selling rebates. The revision had no e� ect on the operating income, net in-come or comprehensive income, the consolidated balance sheet or cash fl ows in any period presented or in any previously issued fi nancial statements.
These revisions were not considered to be material, individually or in the aggregate, to the previously issued fi nancial statements.
CASH AND CASH EQUIVALENTSCash equivalents are short-term, highly liquid instruments with
original maturities of 90 days or less.
INVENTORIESInventories consist primarily of merchandise purchased for resale
and are stated at the lower of cost or market, using the fi rst-in, fi rst-out method. The Company had adjustments to its inventory carry value totaling $5.5 million and $5.9 million as of December 31, 2012 and 2013, respectively.
Inventories consist of the following (U.S. dollars in thousands):
December 31,
2012 2013
Raw materials . . . . . . . . . . . . . $ 32,332 $ 117,982
Finished goods . . . . . . . . . . . . 103,542 221,687
$ 135,874 $ 339,669
PROPERTY AND EQUIPMENTProperty and equipment are recorded at cost and depreci-
ated using the straight-line method over the following estimated useful lives:
Buildings . . . . . . . . . . . . . . . . . . . . . . . . . . . . . . 39 yearsFurniture and fi xtures . . . . . . . . . . . . . . . . . 5 – 7 yearsComputers and equipment . . . . . . . . . . 3 – 5 yearsLeasehold improvements . . . . . . . . . . . . Shorter of estimated
useful life or lease termScanners . . . . . . . . . . . . . . . . . . . . . . . . . . . . . . 3 yearsVehicles . . . . . . . . . . . . . . . . . . . . . . . . . . . . . . . 3 – 5 years
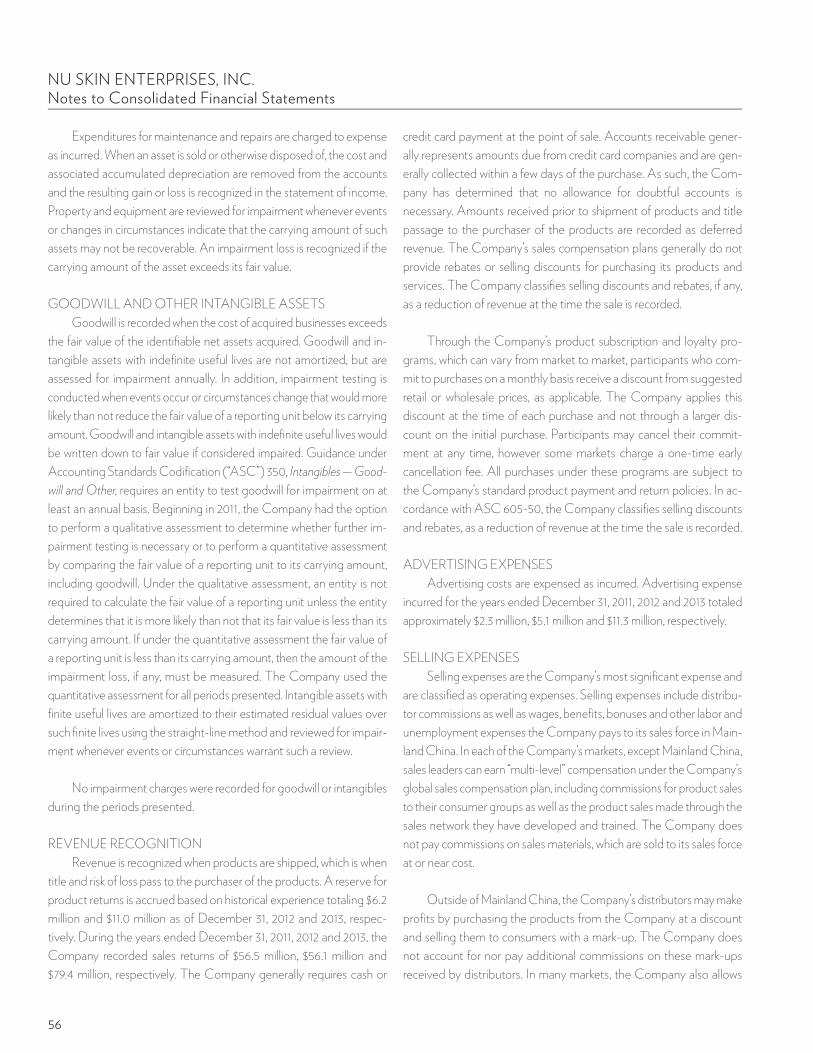
56
NU SKIN ENTERPRISES, INC.Notes to Consolidated Financial Statements
Expenditures for maintenance and repairs are charged to expense as incurred. When an asset is sold or otherwise disposed of, the cost and associated accumulated depreciation are removed from the accounts and the resulting gain or loss is recognized in the statement of income. Property and equipment are reviewed for impairment whenever events or changes in circumstances indicate that the carrying amount of such assets may not be recoverable. An impairment loss is recognized if the carrying amount of the asset exceeds its fair value.
GOODWILL AND OTHER INTANGIBLE ASSETS Goodwill is recorded when the cost of acquired businesses exceeds
the fair value of the identifi able net assets acquired. Goodwill and in-tangible assets with indefi nite useful lives are not amortized, but are assessed for impairment annually. In addition, impairment testing is conducted when events occur or circumstances change that would more likely than not reduce the fair value of a reporting unit below its carrying amount. Goodwill and intangible assets with indefi nite useful lives would be written down to fair value if considered impaired. Guidance under Accounting Standards Codifi cation (“ASC”) 350, Intangibles — Good-will and Other, requires an entity to test goodwill for impairment on at least an annual basis. Beginning in 2011, the Company had the option to perform a qualitative assessment to determine whether further im-pairment testing is necessary or to perform a quantitative assessment by comparing the fair value of a reporting unit to its carrying amount, including goodwill. Under the qualitative assessment, an entity is not required to calculate the fair value of a reporting unit unless the entity determines that it is more likely than not that its fair value is less than its carrying amount. If under the quantitative assessment the fair value of a reporting unit is less than its carrying amount, then the amount of the impairment loss, if any, must be measured. The Company used the quantitative assessment for all periods presented. Intangible assets with fi nite useful lives are amortized to their estimated residual values over such fi nite lives using the straight-line method and reviewed for impair-ment whenever events or circumstances warrant such a review.
No impairment charges were recorded for goodwill or intangibles during the periods presented.
REVENUE RECOGNITIONRevenue is recognized when products are shipped, which is when
title and risk of loss pass to the purchaser of the products. A reserve for product returns is accrued based on historical experience totaling $6.2 million and $11.0 million as of December 31, 2012 and 2013, respec-tively. During the years ended December 31, 2011, 2012 and 2013, the Company recorded sales returns of $56.5 million, $56.1 million and $79.4 million, respectively. The Company generally requires cash or
credit card payment at the point of sale. Accounts receivable gener-ally represents amounts due from credit card companies and are gen-erally collected within a few days of the purchase. As such, the Com-pany has determined that no allowance for doubtful accounts is necessary. Amounts received prior to shipment of products and title passage to the purchaser of the products are recorded as deferred revenue. The Company’s sales compensation plans generally do not provide rebates or selling discounts for purchasing its products and services. The Company classifi es selling discounts and rebates, if any, as a reduction of revenue at the time the sale is recorded.
Through the Company’s product subscription and loyalty pro-grams, which can vary from market to market, participants who com-mit to purchases on a monthly basis receive a discount from suggested retail or wholesale prices, as applicable. The Company applies this discount at the time of each purchase and not through a larger dis-count on the initial purchase. Participants may cancel their commit-ment at any time, however some markets charge a one-time early cancellation fee. All purchases under these programs are subject to the Company’s standard product payment and return policies. In ac-cordance with ASC 605-50, the Company classifi es selling discounts and rebates, as a reduction of revenue at the time the sale is recorded.
ADVERTISING EXPENSESAdvertising costs are expensed as incurred. Advertising expense
incurred for the years ended December 31, 2011, 2012 and 2013 totaled approximately $2.3 million, $5.1 million and $11.3 million, respectively.
SELLING EXPENSESSelling expenses are the Company’s most signifi cant expense and
are classifi ed as operating expenses. Selling expenses include distribu-tor commissions as well as wages, benefi ts, bonuses and other labor and unemployment expenses the Company pays to its sales force in Main-land China. In each of the Company’s markets, except Mainland China, sales leaders can earn “multi-level” compensation under the Company’s global sales compensation plan, including commissions for product sales to their consumer groups as well as the product sales made through the sales network they have developed and trained. The Company does not pay commissions on sales materials, which are sold to its sales force at or near cost.
Outside of Mainland China, the Company’s distributors may make profi ts by purchasing the products from the Company at a discount and selling them to consumers with a mark-up. The Company does not account for nor pay additional commissions on these mark-ups received by distributors. In many markets, the Company also allows

57
NU SKIN ENTERPRISES, INC.Notes to Consolidated Financial Statements
individuals who are not members of its sales force, referred to as “pre-ferred customers,” to buy products directly from the Company at a discount. The Company pays commissions on preferred customer purchases to the referring member of its sales force.
RESEARCH AND DEVELOPMENTResearch and development costs are included in general and
administrative expenses in the accompanying consolidated statements of income and are expensed as incurred and totaled $13.6 million, $14.9 million and $18.0 million in 2011, 2012 and 2013, respectively.
DEFERRED TAX ASSETS AND LIABILITIESThe Company accounts for income taxes in accordance with the
Income Taxes Topic of the Financial Accounting Standards Codifi cation. These standards establish fi nancial accounting and reporting standards for the e� ects of income taxes that result from an enterprise’s activities during the current and preceding years. The Company takes an asset and liability approach for fi nancial accounting and reporting of income taxes. The Company pays income taxes in many foreign jurisdictions based on the profi ts realized in those jurisdictions, which can be signifi -cantly impacted by terms of intercompany transactions between the Company and its foreign a� liates. Deferred tax assets and liabilities are created in this process. The Company has netted these deferred tax assets and deferred tax liabilities by jurisdiction. Valuation allowances
are established when necessary to reduce deferred tax assets to the amounts expected to be ultimately realized.
UNCERTAIN TAX POSITIONSThe Company fi les income tax returns in the U.S. federal juris-
diction, and in various state and foreign jurisdictions. In 2013, the Company entered into a closing agreement with the United States Internal Revenue Service (the “IRS”) for all adjustments for the 2009 and 2010 tax years. As a result of entering into the closing agreement, the Company is no longer subject to tax examinations from the IRS for all years for which tax returns have been fi led except for 2011. With a few exceptions, the Company is no longer subject to state and local income tax examination by tax authorities for the years before 2008. In 2009, the Company entered into a voluntary program with the IRS called Compliance Assurance Process (“CAP”). The objective of CAP is to contemporaneously work with the IRS to achieve federal tax compliance and resolve all or most of the issues prior to fi ling of the tax return. The Company has elected to participate in the CAP program for 2014 and may elect to continue participating in CAP for future tax years; the Company may withdraw from the program at any time. In major foreign jurisdictions, the Company is no longer subject to income tax examinations for years before 2007. Along with the IRS examination of 2011, the Company is currently under exami-nation in certain foreign jurisdictions; however, the outcomes of those reviews are not yet determinable. �
A reconciliation of the beginning and ending amount of unrecognized tax benefi ts included in other liabilities is as follows (U.S. dollars in thousands):
2011 2012 2013Gross balance at January 1 . . . . . . . . . . . . . . . . . . . . . . . . . . . . . . . . . . . . . . . . $ 14,821 $ 7,387 $ 9,045Decreases related to prior year tax positions . . . . . . . . . . . . . . . . . . . . . . . . (7,138) — —Increases related to current year tax positions . . . . . . . . . . . . . . . . . . . . . . 1,415 2,430 1,188Settlements . . . . . . . . . . . . . . . . . . . . . . . . . . . . . . . . . . . . . . . . . . . . . . . . . . . . . . (499) — (1,671)Decreases due to lapse of statutes of limitations . . . . . . . . . . . . . . . . . . . . (1,255) (854) (1,086)Currency adjustments . . . . . . . . . . . . . . . . . . . . . . . . . . . . . . . . . . . . . . . . . . . . 43 82 8Gross balance at December 31 . . . . . . . . . . . . . . . . . . . . . . . . . . . . . . . . . . . . $ 7,387 $ 9,045 $ 7,484
At December 31, 2013, the Company had $7.5 million in unrec-ognized tax benefi ts of which $2.1 million, if recognized, would a� ect the e� ective tax rate. In comparison, at December 31, 2012, the Com-pany had $9.0 million in unrecognized tax benefi ts of which $3.8 million, if recognized, would a� ect the e� ective tax rate. The Company’s unrecognized tax benefi ts relate to multiple foreign and domestic ju-risdictions. Due to potential increases in unrecognized tax benefi ts from the multiple jurisdictions in which the Company operates, as well
as the expiration of various statutes of limitation, it is reasonably pos-sible that the Company’s gross unrecognized tax benefi ts, net of foreign currency adjustments, may decrease within the next 12 months by a range of approximately $2 to $3 million.
During each of the years ended December 31, 2011, 2012 and 2013, the Company recognized approximately ($0.8) million, $0.3 million and ($0.1) million, respectively in interest and penalties expenses/(benefi ts).

58
NU SKIN ENTERPRISES, INC.Notes to Consolidated Financial Statements
The Company had approximately $0.8 million, $1.1 million and $0.9 mil-lion of accrued interest and penalties related to uncertain tax positions at December 31, 2011, 2012 and 2013, respectively. Interest and penalties related to uncertain tax positions are recognized as a component of income tax expense.
NET INCOME PER SHARENet income per share is computed based on the weighted-average
number of common shares outstanding during the periods presented. Additionally, diluted earnings per share data gives e� ect to all poten-tially dilutive common shares that were outstanding during the periods presented (Note 10).
FOREIGN CURRENCY TRANSLATIONA signifi cant portion of the Company’s business operations
occur outside of the United States. The local currency of each of the Company’s Subsidiaries is considered its functional currency, except for NSEAP in Singapore where the U.S. dollar is used. All assets and liabilities are translated into U.S. dollars at exchange rates existing at the balance sheet dates, revenue and expenses are translated at weighted-average exchange rates and stockholders’ equity is recorded at historical exchange rates. The resulting foreign currency translation adjustments are recorded as a separate component of stockholders’ equity in the consolidated balance sheets and transaction gains and losses are included in other income and expense in the consolidated fi nancial statements. Net of tax the accumulated other comprehen-sive income related to the foreign currency translation adjustments are $61.5 million, $54.7 million and $47.6 million at December 31, 2011, 2012 and 2013, respectively.
CLASSIFICATION OF VENEZUELA AS A HIGHLY INFLATIONARY ECONOMY AND DEVALUATION OF ITS CURRENCY
Since January 1, 2010, Venezuela has been designated as a high-ly infl ationary economy. Highly infl ationary accounting requires all gains and losses resulting from the re-measurement of its fi nancial statements to be determined using o� cial rates.
Currency exchange restrictions enacted by the government of Venezuela require approval from the government’s currency control agency organization in order for the Company’s subsidiary in Venezu-ela to obtain U.S. dollars at the o� cial exchange rate to pay for im-ported products or to repatriate dividends back to the Company. The government of Venezuela enacted additional currency exchange re-strictions, which e� ectively replaced the market rate with the System for Foreign Currency Denominated Securities (“SITME”), which is
administered by the Venezuela Central Bank. Under SITME, entities domiciled in Venezuela can obtain U.S. dollar denominated securities in limited quantities each month through banking institutions approved by the government.
As of December 31, 2013, the Company had approximately $34.0 million of cash in Venezuela, which is subject to the currency exchange restrictions by the government of Venezuela. At this time, the Company is not able to reasonably estimate the future state of exchange controls in Venezuela and its availability of U.S. dollars at the o� cial exchange rate or at the SITME rate. On February 12, 2013, the Venezuelan government announced the devaluation of the bo-livar o� cial rate to 6.3.
During 2011, 2012 and 2013, the Company’s Venezuelan subsid-iary’s net sales revenue represented approximately 0.3%, 0.7% and 1.1% of consolidated net sales revenue, respectively. The Company’s Venezuelan subsidiary held total assets of $15.6 million and $38.8 million (which includes intercompany receivables denominated in U.S. dollars of $15.6 million and $37.9 million) at December 31, 2012 and 2013, respectively.
FAIR VALUE OF FINANCIAL INSTRUMENTSThe carrying value of fi nancial instruments including cash and
cash equivalents, accounts receivable and accounts payable approximate fair values due to the short-term nature of these instruments. The Company’s current investments as of December 31, 2013 include cer-tifi cates of deposits and pre-refunded municipal bonds that are clas-sifi ed by management as held-to-maturity as the Company had the positive intent and ability to hold to maturity. The carrying value of these current investments approximate fair values due to the short-term nature of these instruments. As of December 31, 2012 and 2013, the long-term debt fair value is $199.5 million and $188.3 million, respec-tively. The estimated fair value of the Company’s debt is based on interest rates available for debt with similar terms and remaining ma-turities. The Company has classifi ed these instruments as Level 2 in the fair value hierarchy. Fair value estimates are made at a specifi c point in time, based on relevant market information.
The FASB Codifi cation defi nes fair value as the price that would be received to sell an asset or paid to transfer a liability in the principal or most advantageous market for the asset or liability in an orderly transaction between market participants at the measurement date. On a quarterly basis, the Company measures at fair value certain fi nancial assets, including cash equivalents. Accounting standards specify a hierarchy of valuation techniques based on whether the inputs to those

59
NU SKIN ENTERPRISES, INC.Notes to Consolidated Financial Statements
valuation techniques are observable or unobservable. Observable inputs refl ect data obtained from independent sources, while unobserv-able inputs refl ect the Company’s market assumptions. These two types of inputs have created the following fair-value hierarchy:
• Level 1—quoted prices in active markets for identical assets or liabilities;
• Level 2—inputs, other than the quoted prices in active markets, that are observable either directly or indirectly;
• Level 3—unobservable inputs based on the Company’s own assumptions.
Accounting standards permit companies, at their option, to choose to measure many fi nancial instruments and certain other items at fair value. The Company has elected to not fair value existing eligible items.
STOCK-BASED COMPENSATIONAll share-based payments, including grants of stock options and
restricted stock units, are required to be recognized in our fi nancial statements based upon their respective grant date fair values. The Black-Scholes option pricing model is used to estimate the fair value of stock options. The determination of the fair value of stock options is a� ected by our stock price and a number of assumptions, including expected volatility, expected life, risk-free interest rate and expected dividends. We use historical volatility as the expected volatility as-sumption required in the Black-Scholes model. The expected life of the stock options is based on historical data trended into the future. The risk-free interest rate assumption is based on observed interest rates appropriate for the expected terms of our stock options. The fair value of our restricted stock units is based on the closing market price of our stock on the date of grant less our expected dividend yield. We recognize stock-based compensation net of any estimated forfeitures over the requisite service period of the award.
The total compensation expense related to equity compensation plans was approximately $15.5 million, $21.4 million and $32.6 million for the years ended December 31, 2011, 2012 and 2013. For the years end-ed December 31, 2011, 2012 and 2013, all stock-based compensation expense was recorded within general and administrative expenses.
REPORTING COMPREHENSIVE INCOMEComprehensive income is defi ned as the change in equity of a
business enterprise during a period from transactions and other events and circumstances from non-owner sources, and it includes all
changes in equity during a period except those resulting from invest-ments by owners and distributions to owners.
ACCOUNTING FOR DERIVATIVE INSTRUMENTS AND HEDGING ACTIVITIES
The Company recognizes all derivatives as either assets or liabilities, with the instruments measured at fair value.
The Company manages foreign exchange risk in certain jurisdic-tions through the use of foreign currency debt. Portions of the Company’s Japanese yen borrowings have been designated, and are e� ective, as economic hedges of the net investment in its foreign op-erations. Accordingly, foreign currency transaction gains or losses due to spot rate fl uctuations on these debt instruments are included in foreign currency translation adjustment within other comprehensive income. Included in the cumulative translation adjustment are $0.9 million of pretax net losses, $7.3 million of pretax net gains and $10.5 million of pretax net losses for the years ended December 31, 2011, 2012 and 2013, respectively from Japanese yen borrowings.
Additionally, the Company’s Subsidiaries enter into signifi cant transactions with each other and third parties that may not be denom-inated in the respective Subsidiaries’ functional currencies. The Com-pany regularly monitors its foreign currency risks and seeks to reduce its exposure to fl uctuations in foreign exchange rates using foreign currency exchange contracts and through certain intercompany loans of foreign currency.
Hedge e� ectiveness is assessed at inception and throughout the life of the hedge to ensure the hedge qualifi es for hedge accounting treatment. Changes in fair value associated with hedge ine� ective-ness, if any, are recorded in the results of operations currently. In the event that an anticipated transaction is no longer likely to occur, the Company recognizes the change in fair value of the derivative in its results of operations currently.
Changes in the fair value of derivatives are recorded in current earnings or accumulated other comprehensive loss, depending on the intended use of the derivative and its resulting designation. The gains and losses in accumulated other comprehensive loss stemming from these derivatives will be reclassifi ed into earnings in the period during which the hedged forecasted transaction a� ects earnings. The fair value of the receivable and payable amounts related to these unreal-ized gains and losses is classifi ed as other current assets and liabilities. The Company does not use such derivative fi nancial instruments for trading or speculative purposes. Gains and losses on certain intercom-

60
NU SKIN ENTERPRISES, INC.Notes to Consolidated Financial Statements
pany loans of foreign currency are recorded as other income and ex-pense in the consolidated statements of income.
RECENT ACCOUNTING PRONOUNCEMENTSIn February 2013, the FASB issued ASU No. 2013-02, Reporting
of Amounts Reclassifi ed Out of Accumulated Other Comprehensive Income. This pronouncement was issued to improve the reporting of reclassifi cations out of accumulated other comprehensive income. The amendments in this update seek to attain that objective by requiring an entity to report the e� ect of signifi cant reclassifi cations out of accumu-lated other comprehensive income on the respective line items in net income if the amount being reclassifi ed is required under U.S. GAAP to be reclassifi ed in its entirety to net income. For other amounts that are not required under U.S. GAAP to be reclassifi ed in their entirety to net income in the same reporting period, an entity is required to cross-reference other disclosures required under U.S. GAAP that provide additional detail about those amounts. This would be the case when a portion of the amount reclassifi ed out of accumulated other compre-hensive income is reclassifi ed to a balance sheet account (i.e. inventory)
instead of directly to income or expense in the same reporting period. This pronouncement is e� ective prospectively for reporting periods beginning after December 15, 2012. The adoption of ASU 2013-02 did not have a material impact on the Company’s consolidated fi nancial position, results of operations or cash fl ows.
In July 2013, the FASB issued ASU No. 2013-11, Income Taxes (Topic 740): Presentation of an Unrecognized Tax Benefi t When a Net Operating Loss Carryforward, a Similar Tax Loss, or a Tax Credit Car-ryforward Exists (a consensus of the Emerging Issues Task Force). This ASU addresses when unrecognized tax benefi ts should be presented as reductions to deferred tax assets for net operating loss carryforwards in the fi nancial statements. This ASU is e� ective prospectively for fi scal years, and interim periods within those years, beginning after December 15, 2013. Early adoption and retrospective application is permitted. The Company did not early adopt and does not anticipate the adoption of ASU 2013-11 to have a material impact to the consolidated fi nancial position, results of operations or cash fl ows.
3. PREPAID EXPENSES AND OTHER
Prepaid expenses and other consist of the following (U.S. dollars in thousands):
December 31,2012 2013
Deferred tax assets . . . . . . . . . . . . . . . . . . . . . . . . . . . . . . . . . . . . . . . . . $ 25,420 $ 75,979Intercompany deferred charges . . . . . . . . . . . . . . . . . . . . . . . . . . . . . . 4,255 12,585Prepaid income taxes . . . . . . . . . . . . . . . . . . . . . . . . . . . . . . . . . . . . . . . 14,752 —Prepaid inventory . . . . . . . . . . . . . . . . . . . . . . . . . . . . . . . . . . . . . . . . . . . 6,586 41,350Prepaid rent and insurance . . . . . . . . . . . . . . . . . . . . . . . . . . . . . . . . . . 4,428 6,576Prepaid other taxes and duties . . . . . . . . . . . . . . . . . . . . . . . . . . . . . . . 3,851 5,745Forward contracts . . . . . . . . . . . . . . . . . . . . . . . . . . . . . . . . . . . . . . . . . . 2,968 1,939Deposits . . . . . . . . . . . . . . . . . . . . . . . . . . . . . . . . . . . . . . . . . . . . . . . . . . . 6,584 7,459Other . . . . . . . . . . . . . . . . . . . . . . . . . . . . . . . . . . . . . . . . . . . . . . . . . . . . . . 13,632 11,253
$ 82,476 $ 162,886

61
NU SKIN ENTERPRISES, INC.Notes to Consolidated Financial Statements
4. PROPERTY AND EQUIPMENT
Property and equipment are comprised of the following (U.S. dollars in thousands):
December 31,
2012 2013
Land . . . . . . . . . . . . . . . . . . . . . . . . . . . . . . . . . . . . . . . . . . . . . . . . . . . . . . . $ 30,411 $ 34,442Buildings . . . . . . . . . . . . . . . . . . . . . . . . . . . . . . . . . . . . . . . . . . . . . . . . . . . 38,723 156,734Construction in progress . . . . . . . . . . . . . . . . . . . . . . . . . . . . . . . . . . . . 85,584 78,556Furniture and fixtures . . . . . . . . . . . . . . . . . . . . . . . . . . . . . . . . . . . . . . . 49,062 56,160Computers and equipment . . . . . . . . . . . . . . . . . . . . . . . . . . . . . . . . . 99,804 115,551Leasehold improvements . . . . . . . . . . . . . . . . . . . . . . . . . . . . . . . . . . . 49,027 87,635Scanners . . . . . . . . . . . . . . . . . . . . . . . . . . . . . . . . . . . . . . . . . . . . . . . . . . . 17,290 18,408Vehicles . . . . . . . . . . . . . . . . . . . . . . . . . . . . . . . . . . . . . . . . . . . . . . . . . . . . 2,229 2,226
372,130 549,712
Less: accumulated depreciation (142,343) (153,670)$ 229,787 $ 396,042
Depreciation of property and equipment totaled $25.7 million, $25.5 million and $27.1 million for the years ended December 31, 2011, 2012 and 2013.
5. GOODWILL AND OTHER INTANGIBLE ASSETS
Goodwill and other intangible assets consist of the following (U.S. dollars in thousands):
Carrying Amount at December 31,
Goodwill and indefinite life intangible assets: 2012 2013 Goodwill . . . . . . . . . . . . . . . . . . . . . . . . . . . . . . . . . . . . . . . $ 112,446 $ 112,446 Trademarks and trade names . . . . . . . . . . . . . . . . . . . . 24,599 24,599
$ 137,045 $ 137,045
December 31, 2012 December 31, 2013
Finite life intangible assets:Gross Carrying
Amount Accumulated Amortization
Gross Carrying Amount
Accumulated Amortization
Weighted-average Amortization Period
Scanner technology . . . . . . . . . . . . . . . . $ 46,482 $ 24,490 $ 46,482 $ 27,533 18 years Developed technology . . . . . . . . . . . . . . 22,500 15,085 22,500 15,909 20 years Distributor network . . . . . . . . . . . . . . . . . 11,598 9,591 11,598 10,093 15 years Trademarks . . . . . . . . . . . . . . . . . . . . . . . . 13,784 10,925 14,086 11,660 15 years Other . . . . . . . . . . . . . . . . . . . . . . . . . . . . . . 55,416 21,770 53,540 24,442 8 years
$ 149,780 $ 81,861 $ 148,206 $ 89,637 15 years

62
NU SKIN ENTERPRISES, INC.Notes to Consolidated Financial Statements
Amortization of fi nite-life intangible assets totaled $7.1 million, $7.9 million and $7.8 million for the years ended December 31, 2011, 2012 and 2013, respectively. Annual estimated amortization expense is expected to approximate $7.0 million for each of the fi ve succeeding fi scal years.
All of the Company’s goodwill is based in the U.S. Goodwill and indefi nite life intangible assets are not amortized, rather they are subject to annual impairment tests. Annual impairment tests were completed resulting in no impairment charges for any of the periods shown. Finite life intangibles are amortized over their useful lives unless circumstances occur that cause the Company to revise such lives or review such assets for impairment.
6. OTHER ASSETS
Other assets consist of the following (U.S. dollars in thousands):
December 31,2012 2013
Deferred taxes . . . . . . . . . . . . . . . . . . . . . . . . . . . . . . . . . . . . . . . . . . . . . . . . . . . . . . . . . . . . . $ 9,002 $ 5,174Deposits for noncancelable operating leases . . . . . . . . . . . . . . . . . . . . . . . . . . . . . . . . . 15,189 24,406Deposit for customs assessment (Note 19) . . . . . . . . . . . . . . . . . . . . . . . . . . . . . . . . . . 46,653 40,181Cash surrender value for life insurance policies . . . . . . . . . . . . . . . . . . . . . . . . . . . . . . 18,605 23,172Other . . . . . . . . . . . . . . . . . . . . . . . . . . . . . . . . . . . . . . . . . . . . . . . . . . . . . . . . . . . . . . . . . . . . . . 12,004 18,139
$ 101,453 $ 111,072
7. ACCRUED EXPENSES
Accrued expenses consist of the following (U.S. dollars in thousands):
December 31,
2012 2013
Accrued sales force commissions and other payments . . . . . . . . . . . . . . . . . . . . . . . . $ 110,950 $ 330,870Other taxes payable . . . . . . . . . . . . . . . . . . . . . . . . . . . . . . . . . . . . . . . . . . . . . . . . . . . . . . . . 23,558 109,829Accrued payroll and payroll taxes . . . . . . . . . . . . . . . . . . . . . . . . . . . . . . . . . . . . . . . . . . . . 21,381 38,243Accrued payable to vendors . . . . . . . . . . . . . . . . . . . . . . . . . . . . . . . . . . . . . . . . . . . . . . . . 6,717 42,447Deferred revenue . . . . . . . . . . . . . . . . . . . . . . . . . . . . . . . . . . . . . . . . . . . . . . . . . . . . . . . . . . . 4,608 13,596Other accrued employee expenses . . . . . . . . . . . . . . . . . . . . . . . . . . . . . . . . . . . . . . . . . . 30,285 30,452Other . . . . . . . . . . . . . . . . . . . . . . . . . . . . . . . . . . . . . . . . . . . . . . . . . . . . . . . . . . . . . . . . . . . . . . 35,703 60,847
$ 233,202 $ 626,284

63
NU SKIN ENTERPRISES, INC.Notes to Consolidated Financial Statements
8. LONG-TERM DEBT
The Company currently has debt pursuant to various credit facilities and other borrowings. The Company’s book value for both the in-dividual and consolidated debt included in the table below approximates fair value. The estimated fair value of the Company’s debt is based on interest rates available for debt with similar terms and remaining maturities. The Company has classifi ed these instruments as Level 2 in the fair value hierarchy. The following tables summarize the Company’s long-term debt arrangements as of December 31, 2013:
Facility or Arrangement
Original Principal Amount
Balance as of December 31, 2012
Balance as of December 31,
2013(1) Interest Rate Repayment terms
Multi-currency uncommittedshelf facility:
U.S. dollar denominated:
$40.0 million $22.9 million $17.1 million 6.2% Notes due July 2016 with annual princi-pal payments that began in July 2010.
$20.0 million $14.3 million $11.4 million 6.2% Notes due January 2017 with annual principal payments that began in Janu-ary 2011.
Japanese yen denominated:
3.1 billion yen 0.9 billion yen ($10.2 million as of December 31, 2012)
0.4 billion yen ($4.1 million as of Decem-ber 31, 2013)
1.7% Notes due April 2014 with annual princi-pal payments that began in April 2008.
2.3 billion yen 1.6 billion yen ($18.7 million as of December 31, 2012)
1.3 billion yen ($12.3 million as of December 31, 2013)
2.6% Notes due September 2017 with annual principal payments that began in Sep-tember 2011.
2.2 billion yen 1.6 billion yen ($17.9 million as of December 31, 2012)
1.2 billion yen ($11.8 million as of December 31, 2013)
3.3% Notes due January 2017 with annual principal payments that began in Janu-ary 2011.
8.0 billion yen 8.0 billion yen ($92.0 million as of December 31, 2012)
8.0 billion yen ($75.8 million as of December 31, 2013)
1.7% Notes due May 2022 with annual princi-pal payments that begin in May 2016.
Committed loan:
U.S. dollar denominated:
$30.0 million $18.0 million $0 N/A N/A
Revolving credit facilities
2010 $35.0 million N/A $35.0 million Variable 30 day: 0.670%
Revolving line of credit
2013(2) $14.0 million N/A $14.0 million Variable 30 day: 0.5933%
Revolving line of credit
(1) The current portion of the Company’s long-term debt (i.e. becoming due in the next 12 months) includes $10.2 million of the balance of its Japanese yen-denominated
debt under the multi-currency uncommitted shelf facility, $8.6 million of the balance on its U.S. dollar denominated debt under the multi-currency uncommitted shelf
facility and $49.0 million of the Company’s revolving loans. (2) On September 5, 2013, the Company entered into a loan agreement with Bank of America, N.A. for a 364 day revolving line of credit with a commitment amount of
$50.0 million. The interest rate is equal to 1 month LIBOR plus 42.5 basis points.

64
NU SKIN ENTERPRISES, INC.Notes to Consolidated Financial Statements
Interest expense relating to debt totaled $4.8 million, $5.2 million and $3.0 million for the years ended December 31, 2011, 2012 and 2013, respectively.
The notes and shelf facility contain other terms and conditions and a� rmative and negative fi nancial covenants customary for credit fa-cilities of this type, including a requirement to maintain a minimum cash balance of $65.0 million. As of December 31, 2013, the Company is in compliance with all fi nancial covenants.
Maturities of all long-term debt at December 31, 2013, based on the year-end exchange rate, are as follows (U.S. dollars in thousands):
Year Ending December 31,
2014 . . . . . . . . . . . . . . . . . . . . . . . . . . . . . . . . . . . . . . . . . $ 67,8242015 . . . . . . . . . . . . . . . . . . . . . . . . . . . . . . . . . . . . . . . . . 14,5922016 . . . . . . . . . . . . . . . . . . . . . . . . . . . . . . . . . . . . . . . . . 25,4192017 . . . . . . . . . . . . . . . . . . . . . . . . . . . . . . . . . . . . . . . . . 19,7052018 . . . . . . . . . . . . . . . . . . . . . . . . . . . . . . . . . . . . . . . . . 10,827Thereafter . . . . . . . . . . . . . . . . . . . . . . . . . . . . . . . . . . . . 43,309 Total . . . . . . . . . . . . . . . . . . . . . . . . . . . . . . . . . . . . . . . $ 181,676
9. LEASE OBLIGATIONS
The Company leases o� ce space and computer hardware under noncancelable long-term operating leases. Most leases include renewal options of at least three years. Minimum future operating lease obligations at December 31, 2013 are as follows (U.S. dollars in thousands):
Year Ending December 31,
2014 . . . . . . . . . . . . . . . . . . . . . . . . . . . . . . . . . . . . . . . . . $ 31,9922015 . . . . . . . . . . . . . . . . . . . . . . . . . . . . . . . . . . . . . . . . . 28,1832016 . . . . . . . . . . . . . . . . . . . . . . . . . . . . . . . . . . . . . . . . . 21,1572017 . . . . . . . . . . . . . . . . . . . . . . . . . . . . . . . . . . . . . . . . . 15,3032018 . . . . . . . . . . . . . . . . . . . . . . . . . . . . . . . . . . . . . . . . . 12,878Thereafter . . . . . . . . . . . . . . . . . . . . . . . . . . . . . . . . . . . . 1,440 Total . . . . . . . . . . . . . . . . . . . . . . . . . . . . . . . . . . . . . . . $110,953
Rental expense for operating leases totaled $25.8 million, $27.7 million and $34.6 million for the years ended December 31, 2011, 2012 and 2013, respectively.

65
NU SKIN ENTERPRISES, INC.Notes to Consolidated Financial Statements
10. CAPITAL STOCK
The Company’s authorized capital stock consists of 25 million shares of preferred stock, par value $.001 per share, 500 million shares of Class A common stock, par value $.001 per share, and 100 million shares of Class B common stock, par value $.001 per share. The shares of Class A common stock and Class B common stock are identical in all respects, except for voting rights and certain conversion rights and transfer restrictions, as follows: (1) each share of Class A common stock entitles the holder to one vote on matters submitted to a vote of the Company’s stockholders and each share of Class B common stock entitles the holder to ten votes on each such matter; (2) stock dividends of Class A common stock may be paid only to holders of Class A common stock and stock dividends of Class B common stock may be paid only to holders of Class B common stock; (3) if a holder of Class B common stock transfers such shares to a person other than a permitted transferee, as defi ned in the Company’s Certifi cate of Incorporation, such shares will be converted automatically into shares of Class A com-mon stock; and (4) Class A common stock has no conversion rights; however, each share of Class B common stock is convertible into one share of Class A common stock, in whole or in part, at any time at the option of the holder. All outstanding Class B shares have been con-verted to Class A shares. As of December 31, 2012 and 2013, there were no preferred or Class B common shares outstanding.
WEIGHTED-AVERAGE COMMON SHARES OUTSTANDINGThe following is a reconciliation of the weighted-average common shares outstanding for purposes of computing basic and diluted net
income per share (in thousands):
Year Ended December 31,2011 2012 2013
Basic weighted-average common shares outstanding . . . . . . . . . . . . . . . . . . . . . . . 62,066 60,600 58,606Effect of dilutive securities: Stock awards and options . . . . . . . . . . . . . . . . . . . . . . . . . . . . . . . . . . . . . . . . . . . . . . . 2,480 2,425 2,842Diluted weighted-average common shares outstanding . . . . . . . . . . . . . . . . . . . . . 64,546 63,025 61,448
For the years ended December 31, 2011, 2012 and 2013, other stock options totaling none, 0.1 million and 1.2 million, respectively, were excluded from the calculation of diluted earnings per share be-cause they were anti-dilutive.
REPURCHASES OF COMMON STOCKThe board of directors has approved a stock repurchase program
authorizing the Company to repurchase the Company’s outstanding shares of Class A common stock on the open market or in private transactions. The repurchases are used primarily to o� set dilution from the Company’s equity incentive plans and for strategic initiatives. During the years ended December 31, 2011, 2012 and 2013, the Company repurchased approximately 1.9 million, 4.6 million and 1.7 million shares of Class A common stock for an aggregate price of approximately $67.1 million, $201.5 million and $140.9 million, respectively. In May 2012 and July 2013, the Company’s board of directors authorized an increase of $250.0 million and $400.0 million, respectively, in the amount available under the Company’s ongoing stock repurchase program. At December 31, 2013, $394.5 million was available for repurchases under the stock repurchase program.
11. STOCK–BASED COMPENSATION
At December 31, 2013, the Company had the following stock-based employee compensation plans:
EQUITY INCENTIVE PLANSIn April 2010, the Company’s Board of Directors approved the
Nu Skin Enterprises, Inc. 2010 Omnibus Incentive Plan (the “2010 Omnibus Incentive Plan”). This plan was approved by the Compa-ny’s stockholders at the Company’s 2010 Annual Meeting of Stock-holders held in May of 2010. The 2010 Omnibus Incentive Plan pro-vides for granting of a variety of equity based awards including stock options, stock appreciation rights, restricted stock, restricted stock units, other share based awards, performance cash, performance shares and performance units to executives, other employees, inde-pendent consultants and directors of the Company and its subsidiar-ies. Options granted under the 2010 Omnibus Incentive Plan are generally non-qualifi ed stock options, but the 2010 Omnibus Incen-tive Plan permits some stock options granted to qualify as “incentive stock options” under the U.S. Internal Revenue Code. The exercise
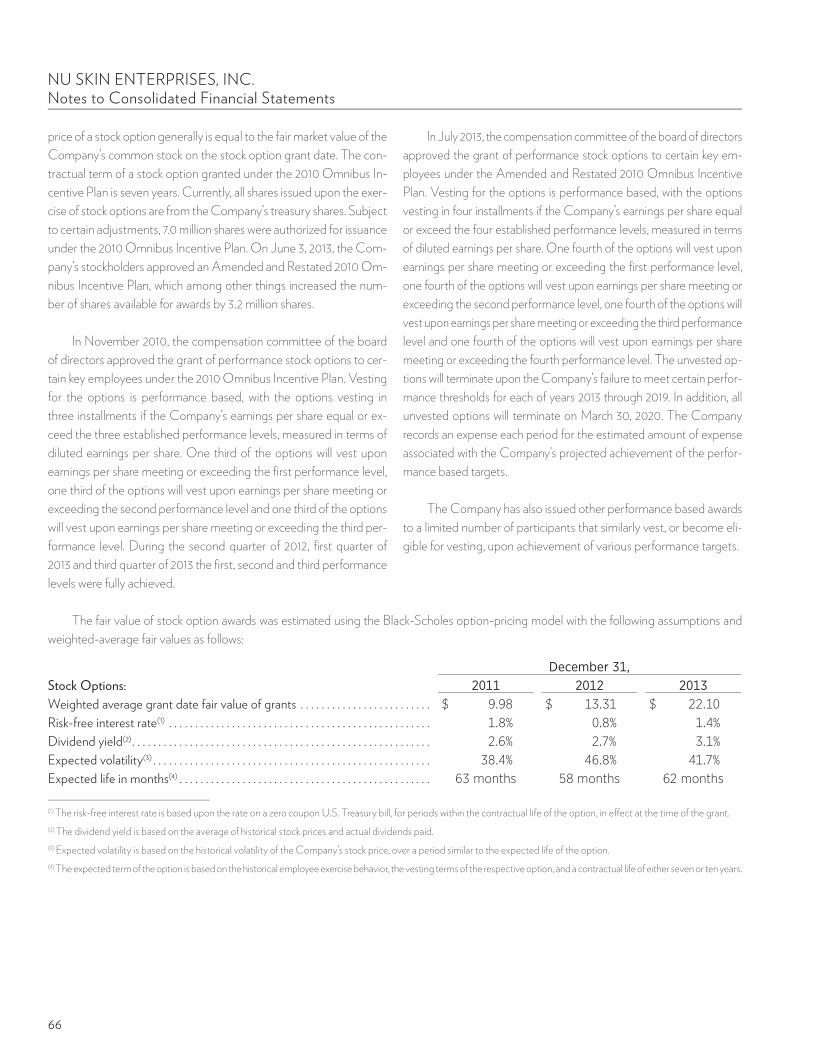
66
NU SKIN ENTERPRISES, INC.Notes to Consolidated Financial Statements
price of a stock option generally is equal to the fair market value of the Company’s common stock on the stock option grant date. The con-tractual term of a stock option granted under the 2010 Omnibus In-centive Plan is seven years. Currently, all shares issued upon the exer-cise of stock options are from the Company’s treasury shares. Subject to certain adjustments, 7.0 million shares were authorized for issuance under the 2010 Omnibus Incentive Plan. On June 3, 2013, the Com-pany’s stockholders approved an Amended and Restated 2010 Om-nibus Incentive Plan, which among other things increased the num-ber of shares available for awards by 3.2 million shares.
In November 2010, the compensation committee of the board of directors approved the grant of performance stock options to cer-tain key employees under the 2010 Omnibus Incentive Plan. Vesting for the options is performance based, with the options vesting in three installments if the Company’s earnings per share equal or ex-ceed the three established performance levels, measured in terms of diluted earnings per share. One third of the options will vest upon earnings per share meeting or exceeding the fi rst performance level, one third of the options will vest upon earnings per share meeting or exceeding the second performance level and one third of the options will vest upon earnings per share meeting or exceeding the third per-formance level. During the second quarter of 2012, fi rst quarter of 2013 and third quarter of 2013 the fi rst, second and third performance levels were fully achieved.
In July 2013, the compensation committee of the board of directors approved the grant of performance stock options to certain key em-ployees under the Amended and Restated 2010 Omnibus Incentive Plan. Vesting for the options is performance based, with the options vesting in four installments if the Company’s earnings per share equal or exceed the four established performance levels, measured in terms of diluted earnings per share. One fourth of the options will vest upon earnings per share meeting or exceeding the fi rst performance level, one fourth of the options will vest upon earnings per share meeting or exceeding the second performance level, one fourth of the options will vest upon earnings per share meeting or exceeding the third performance level and one fourth of the options will vest upon earnings per share meeting or exceeding the fourth performance level. The unvested op-tions will terminate upon the Company’s failure to meet certain perfor-mance thresholds for each of years 2013 through 2019. In addition, all unvested options will terminate on March 30, 2020. The Company records an expense each period for the estimated amount of expense associated with the Company’s projected achievement of the perfor-mance based targets.
The Company has also issued other performance based awards to a limited number of participants that similarly vest, or become eli-gible for vesting, upon achievement of various performance targets.
The fair value of stock option awards was estimated using the Black-Scholes option-pricing model with the following assumptions and weighted-average fair values as follows:
December 31,Stock Options: 2011 2012 2013Weighted average grant date fair value of grants . . . . . . . . . . . . . . . . . . . . . . . . . $ 9.98 $ 13.31 $ 22.10Risk-free interest rate(1) . . . . . . . . . . . . . . . . . . . . . . . . . . . . . . . . . . . . . . . . . . . . . . . . . . 1.8% 0.8% 1.4%Dividend yield(2) . . . . . . . . . . . . . . . . . . . . . . . . . . . . . . . . . . . . . . . . . . . . . . . . . . . . . . . . . 2.6% 2.7% 3.1%Expected volatility(3) . . . . . . . . . . . . . . . . . . . . . . . . . . . . . . . . . . . . . . . . . . . . . . . . . . . . . 38.4% 46.8% 41.7%Expected life in months(4) . . . . . . . . . . . . . . . . . . . . . . . . . . . . . . . . . . . . . . . . . . . . . . . . 63 months 58 months 62 months
(1) The risk-free interest rate is based upon the rate on a zero coupon U.S. Treasury bill, for periods within the contractual life of the option, in e� ect at the time of the grant. (2) The dividend yield is based on the average of historical stock prices and actual dividends paid. (3) Expected volatility is based on the historical volatility of the Company’s stock price, over a period similar to the expected life of the option.(4) The expected term of the option is based on the historical employee exercise behavior, the vesting terms of the respective option, and a contractual life of either seven or ten years.

67
NU SKIN ENTERPRISES, INC.Notes to Consolidated Financial Statements
Options under the plans as of December 31, 2013 and changes during the year ended December 31, 2013 were as follows:
Shares(in thousands)
Weighted-average
Exercise Price
Weighted- average
Remaining Contractual
Term(in years)
Aggregate Intrinsic Value(in thousands)
Options activity – service based Outstanding at December 31, 2012 . . . . . . . . . . . . . . . . . . . 3,235.2 $ 18.55Granted . . . . . . . . . . . . . . . . . . . . . . . . . . . . . . . . . . . . . . . . . . . . 172.5 94.53Exercised . . . . . . . . . . . . . . . . . . . . . . . . . . . . . . . . . . . . . . . . . . . (1,244.0) 16.16Forfeited/cancelled/expired . . . . . . . . . . . . . . . . . . . . . . . . . . (3.9) 13.45Outstanding at December 31, 2013 . . . . . . . . . . . . . . . . . . . 2,159.8 26.01 2.82 $242,347Exercisable at December 31, 2013 . . . . . . . . . . . . . . . . . . . . . 1,763.0 17.55 2.17 212,740
Options activity – performance basedOutstanding at December 31, 2012 . . . . . . . . . . . . . . . . . . . 2,727.0 $ 28.06Granted . . . . . . . . . . . . . . . . . . . . . . . . . . . . . . . . . . . . . . . . . . . . 2,605.5 77.51Exercised . . . . . . . . . . . . . . . . . . . . . . . . . . . . . . . . . . . . . . . . . . . (794.4) 25.10Forfeited/cancelled/expired . . . . . . . . . . . . . . . . . . . . . . . . . . (55.0) 33.89Outstanding at December 31, 2013 . . . . . . . . . . . . . . . . . . . 4,483.1 57.25 5.26 $ 362,975Exercisable at December 31, 2013 . . . . . . . . . . . . . . . . . . . . . 1,826.7 28.72 3.47 200,034
Options activity – all optionsOutstanding at December 31, 2012 . . . . . . . . . . . . . . . . . . . 5,962.2 $ 22.90Granted . . . . . . . . . . . . . . . . . . . . . . . . . . . . . . . . . . . . . . . . . . . . 2,778.0 78.57Exercised . . . . . . . . . . . . . . . . . . . . . . . . . . . . . . . . . . . . . . . . . . . (2,038.4) 19.65Forfeited/cancelled/expired . . . . . . . . . . . . . . . . . . . . . . . . . . (58.9) 32.54Outstanding at December 31, 2013 . . . . . . . . . . . . . . . . . . . 6,642.9 47.10 4.47 $ 605,322Exercisable at December 31, 2013 . . . . . . . . . . . . . . . . . . . . . 3,589.7 23.23 2.83 412,774
The aggregate intrinsic value in the table above represents the total pretax intrinsic value (the di� erence between the Company’s closing stock price on the last trading day of the respective years and the exercise price, multiplied by the number of in-the-money options) that would have been received by the option holders had all option holders exercised their options on December 31, 2013. This amount varies based on the fair market value of the Company’s stock. The total fair value of options vested and expensed was $13.2 million, net of tax, for the year ended December 31, 2013.

68
NU SKIN ENTERPRISES, INC.Notes to Consolidated Financial Statements
Cash proceeds, tax benefi ts, and intrinsic value related to total stock options exercised during 2011, 2012 and 2013, were as follows (in millions):
December 31,2011 2012 2013
Cash proceeds from stock options exercised . . . . . . . . . . . . . . . . . . . . . . $ 29.7 $ 8.0 $ 37.9Tax benefit realized for stock options exercised . . . . . . . . . . . . . . . . . . . 17.4 6.3 41.9Intrinsic value of stock options exercised . . . . . . . . . . . . . . . . . . . . . . . . . . 61.6 10.6 241.7
Nonvested restricted stock awards as of December 31, 2013 and changes during the year ended December 31, 2013 were as follows:
Number of Shares (in thousands)
Weighted-average Grant Date Fair
ValueNonvested at December 31, 2012 . . . . . . . . . . . . . . . . . . . . . . . . . . . . . . . . . . . . . . . . . 729.0 $ 39.68
Granted . . . . . . . . . . . . . . . . . . . . . . . . . . . . . . . . . . . . . . . . . . . . . . . . . . . . . . . . . . . . . . . . . . 315.8 41.59Vested . . . . . . . . . . . . . . . . . . . . . . . . . . . . . . . . . . . . . . . . . . . . . . . . . . . . . . . . . . . . . . . . . . . (305.4) 34.88Forfeited . . . . . . . . . . . . . . . . . . . . . . . . . . . . . . . . . . . . . . . . . . . . . . . . . . . . . . . . . . . . . . . . . (9.8) 42.10
Nonvested at December 31, 2013 . . . . . . . . . . . . . . . . . . . . . . . . . . . . . . . . . . . . . . . . . 729.6 42.48
As of December 31, 2013, there was $16.4 million of unrecognized stock-based compensation expense related to nonvested restricted stock awards. That cost is expected to be recognized over a weighted-average period of 2.2 years. As of December 31, 2013, there was $58.4 million of unrecognized stock-based compensation expense related to nonvested stock option awards. That cost is expected to be recognized over a weighted-average period of 4.0 years.
12. FAIR VALUE
Assets and liabilities recorded at fair value in the consolidated balance sheets are categorized based upon the level of judgment associ-ated with the inputs used to measure their fair value.
The following tables present the fair value hierarchy for those assets and liabilities measured at fair value on a recurring basis as of December 31, 2012 and December 31, 2013 (U.S. dollars in thousands):
Fair Value at December 31, 2012Level 1 Level 2 Level 3 Total
Financial assets (liabilities):Cash equivalents and current investments . . . . . . $ 76,006 $ — $ — $ 76,006Forward contracts . . . . . . . . . . . . . . . . . . . . . . . . . . . . . — 2,969 — 2,969Insurance company contracts . . . . . . . . . . . . . . . . . . — — 18,605 18,605 Total . . . . . . . . . . . . . . . . . . . . . . . . . . . . . . . . . . . . . . . $ 76,006 $ 2,969 $ 18,605 $ 97,580

69
NU SKIN ENTERPRISES, INC.Notes to Consolidated Financial Statements
Fair Value at December 31, 2013Level 1 Level 2 Level 3 Total
Financial assets (liabilities):Cash equivalents and current investments . . . . . . . $ 61,136 — $ — $ 61,136Forward contracts . . . . . . . . . . . . . . . . . . . . . . . . . . . . . — 1,939 — 1,939Insurance company contracts. . . . . . . . . . . . . . . . . . . — — 23,172 23,172 Total . . . . . . . . . . . . . . . . . . . . . . . . . . . . . . . . . . . . . $ 61,136 $ 1,939 $ 23,172 $ 86,247
The following methods and assumptions were used to determine the fair value of each class of assets and liabilities recorded at fair value in the consolidated balance sheets:
Cash equivalents and current investments: Cash equivalents and current investments primarily consist of highly rated money market funds with maturities of three months or less, and are purchased daily at par value with specifi ed yield rates. Due to the high ratings and short-term nature of the funds, the Company considers all cash equivalents and current investments as Level 1. Current investments include $22.0 million that is restricted for the Company’s voluntary participation in a consumer protection cooperative in South Korea.
Forward contracts: : To hedge foreign currency risks, the Company uses foreign currency exchange forward contracts, where possible and practical. These forward contracts are valued using standard valuation formulas with assumptions about foreign currency exchange rates derived from existing exchange rates.
Insurance Company Contracts: ASC 820 preserves practicability exceptions to fair value measurements provided by other applicable GAAP. The guidance in ASC 715-30-35-60 allows a reporting entity, as a practical expedient, to use cash surrender value or conversion value as an expedient for fair value when it is present. Accordingly, the Company determines the fair value of its insurance company contracts as the cash-surrender value of life insurance policies held in its Rabbi Trust as disclosed in Note 15 “Executive Deferred Compensation Plan.”
The following table provides a summary of changes in fair value of the Company’s Level 3 marketable securities (U.S. dollars in thousands):
Insurance Company Contracts 2012 2013Beginning balance at January 1 $ 14,925 $ 18,605 Actual return on plan assets: Relating to assets still held at the reporting date . . . . . . . . . . . . . . . . . 1,560 2,568 Purchases and issuances . . . . . . . . . . . . . . . . . . . . . . . . . . . . . . . . . . . . . . . 2,970 3,408 Sales and settlements . . . . . . . . . . . . . . . . . . . . . . . . . . . . . . . . . . . . . . . . . . (850) (1,409) Transfers into Level 3 . . . . . . . . . . . . . . . . . . . . . . . . . . . . . . . . . . . . . . . . . . — —Ending balance at December 31 $ 18,605 $ 23,172

70
NU SKIN ENTERPRISES, INC.Notes to Consolidated Financial Statements
13. INCOME TAXES
Consolidated income before provision for income taxes consists of the following for the years ended December 31, 2011, 2012 and 2013 (U.S. dollars in thousands):
2011 2012 2013U.S. . . . . . . . . . . . . . . . . . . . . . . . . . . . . . . . . . . . . . . . . . . . . . . . $ 142,929 $ 259,309 $ 307,994Foreign . . . . . . . . . . . . . . . . . . . . . . . . . . . . . . . . . . . . . . . . . . . 83,840 85,933 248,946 Total . . . . . . . . . . . . . . . . . . . . . . . . . . . . . . . . . . . . . . . . . . . . $ 226,769 $ 345,242 $ 556,940
The provision for current and deferred taxes for the years ended December 31, 2011, 2012 and 2013 consists of the following (U.S. dollars in thousands):
2011 2012 2013Current Federal . . . . . . . . . . . . . . . . . . . . . . . . . . . . . . . . . . . . . . . . $ 14,723 $ 70,727 $ 84,394 State . . . . . . . . . . . . . . . . . . . . . . . . . . . . . . . . . . . . . . . . . . 2,245 2,425 361 Foreign . . . . . . . . . . . . . . . . . . . . . . . . . . . . . . . . . . . . . . . . 56,973 45,851 148,310
73,941 119,003 233,065Deferred Federal . . . . . . . . . . . . . . . . . . . . . . . . . . . . . . . . . . . . . . . . 17,756 12,918 (5,354) State . . . . . . . . . . . . . . . . . . . . . . . . . . . . . . . . . . . . . . . . . . 582 656 551 Foreign . . . . . . . . . . . . . . . . . . . . . . . . . . . . . . . . . . . . . . . . (18,840) (8,980) (36,210)
(502) 4,594 (41,013)Provision for income taxes . . . . . . . . . . . . . . . . . . . . . . . . . $ 73,439 $ 123,597 $ 192,052
The Company’s foreign taxes paid are high relative to foreign operating income and the Company’s U.S. taxes paid are low relative to U.S. operating income due largely to the fl ow of funds among the Company’s Subsidiaries around the world. As payments for services, man-agement fees, license arrangements and royalties are made from the Company’s foreign a� liates to its U.S. corporate headquarters, these payments often incur withholding and other forms of tax that are generally creditable for U.S. tax purposes. Therefore, these payments lead to increased foreign e� ective tax rates and lower U.S. e� ective tax rates. Variations occur in the Company’s foreign and U.S. e� ective tax rates from year to year depending on several factors. These factors include the impact of global transfer prices, the timing and level of remittances from foreign a� liates, profi ts and losses in various markets, the valuation of deferred tax assets or liabilities, or changes in tax laws, regulations, accounting principles, or interpretations thereof.

71
NU SKIN ENTERPRISES, INC.Notes to Consolidated Financial Statements
The principal components of deferred taxes are as follows (U.S. dollars in thousands):
Year Ended December 31,2012 2013
Deferred tax assets: Inventory differences . . . . . . . . . . . . . . . . . . . . . . . . . . . . . . . . . . . . . . . . . . . $ 3,490 $ 2,927 Foreign tax credit and other foreign benefits . . . . . . . . . . . . . . . . . . . . . 42,128 120,534 Stock-based compensation . . . . . . . . . . . . . . . . . . . . . . . . . . . . . . . . . . . . . 13,772 18,132 Accrued expenses not deductible until paid . . . . . . . . . . . . . . . . . . . . . . 45,003 88,465 Foreign currency exchange . . . . . . . . . . . . . . . . . . . . . . . . . . . . . . . . . . . . . 10,947 13,734 Net operating losses . . . . . . . . . . . . . . . . . . . . . . . . . . . . . . . . . . . . . . . . . . . . 10,561 10,808 Capitalized research and development . . . . . . . . . . . . . . . . . . . . . . . . . . . 10,535 6,202 Other . . . . . . . . . . . . . . . . . . . . . . . . . . . . . . . . . . . . . . . . . . . . . . . . . . . . . . . . . . 648 739 Gross deferred tax assets . . . . . . . . . . . . . . . . . . . . . . . . . . . . . . . . . . . . 137,084 261,541Deferred tax liabilities: Exchange gains and losses . . . . . . . . . . . . . . . . . . . . . . . . . . . . . . . . . . . . . . 7,504 9,924 Intangibles step-up . . . . . . . . . . . . . . . . . . . . . . . . . . . . . . . . . . . . . . . . . . . . . 18,379 16,375 Amortization of intangibles . . . . . . . . . . . . . . . . . . . . . . . . . . . . . . . . . . . . . 15,840 17,360 Foreign outside basis in controlled foreign corporation . . . . . . . . . . . 32,592 76,470 Other . . . . . . . . . . . . . . . . . . . . . . . . . . . . . . . . . . . . . . . . . . . . . . . . . . . . . . . . . . 20,867 63,409 Gross deferred tax liabilities . . . . . . . . . . . . . . . . . . . . . . . . . . . . . . . . . 95,182 183,538Valuation allowance . . . . . . . . . . . . . . . . . . . . . . . . . . . . . . . . . . . . . . . . . . . . . . . . (10,522) (10,803)Deferred taxes, net . . . . . . . . . . . . . . . . . . . . . . . . . . . . . . . . . . . . . . . . . . . . . . . . $ 31,380 $ 67,200
At December 31, 2013, the Company had foreign operating loss carryforwards of approximately $49.4 million for tax purposes, which will be available to o� set future taxable income. If not used, $12.6 million of carryforwards will expire between 2014 and 2023, while $36.8 million do not expire. A valuation allowance has been placed on foreign operating loss carryforwards of approximately $41.6 million.
The valuation allowance primarily represents amounts for foreign operating loss carryforwards for which it is more likely than not some portion or all of the deferred tax asset will not be realized. In making such determination, the Company considers all available positive and negative evidence, including future reversals of existing taxable temporary di� erence, projected future taxable income, tax planning strategies and recent fi nancial operations. When the Company determines that there is su� cient taxable income to utilize the net operating losses, the valuation will be released which would reduce the provision for income taxes.

72
NU SKIN ENTERPRISES, INC.Notes to Consolidated Financial Statements
The components of deferred taxes, net on a jurisdiction basis are as follows (U.S. dollars in thousands):
Year Ended December 31,2012 2013
Net current deferred tax assets . . . . . . . . . . . . . . . . . . . . . . . . . . . . . . . . . . . . . $ 25,420 $ 75,979Net noncurrent deferred tax assets . . . . . . . . . . . . . . . . . . . . . . . . . . . . . . . . . 9,002 5,174 Total net deferred tax assets . . . . . . . . . . . . . . . . . . . . . . . . . . . . . . . . . . . . 34,422 81,153
Net current deferred tax liabilities . . . . . . . . . . . . . . . . . . . . . . . . . . . . . . . . . . 2 1Net noncurrent deferred tax liabilities . . . . . . . . . . . . . . . . . . . . . . . . . . . . . . . 3,040 13,952 Total net deferred tax liabilities . . . . . . . . . . . . . . . . . . . . . . . . . . . . . . . . . 3,042 13,953Deferred taxes, net . . . . . . . . . . . . . . . . . . . . . . . . . . . . . . . . . . . . . . . . . . . . . . . . $ 31,380 $ 67,200
The Company is subject to regular audits by federal, state and foreign tax authorities. These audits may result in proposed assessments that may result in additional tax liabilities.
The actual tax rate for the years ended December 31, 2011, 2012 and 2013 compared to the statutory U.S. Federal tax rate is as follows:
Year Ended December 31,2011 2012 2013
Income taxes at statutory rate . . . . . . . . . . . . . . . . . . . . . . . . . 35.00% 35.00% 35.00%Indefinitely invested earnings of non-U.S. subsidiaries . . — — (.76)Non-deductible expenses . . . . . . . . . . . . . . . . . . . . . . . . . . . . . .16 .12 .12Extraterritorial income tax credit . . . . . . . . . . . . . . . . . . . . . . (3.39) — —Other . . . . . . . . . . . . . . . . . . . . . . . . . . . . . . . . . . . . . . . . . . . . . . . . .62 .68 .12
32.39% 35.80% 34.48%
The lower e� ective tax rate in 2013 compared to 2012 was primar-ily attributable to indefi nitely invested earnings of non-U.S. Subsidiaries.
The cumulative amount of undistributed earnings of the Com-pany’s non-U.S. Subsidiaries held for indefi nite reinvestment is ap-proximately $50.0 million at December 31, 2013. In the event that all non-U.S. undistributed earnings were remitted to the United States, the amount of incremental taxes would be approximately $5.5 million.
14. EMPLOYEE BENEFIT PLAN
The Company has a 401(k) defi ned contribution plan which permits participating employees to defer up to a maximum of 100% of their compensation, subject to limitations established by the Internal Revenue Service. Employees age 18 and older are eligible to contribute to the plan starting the fi rst day of employment. After completing at least one day of service, employees are eligible to receive matching contributions from the Company. In 2011, 2012, and 2013 the Company matched
employees’ base pay up to 4% each year. The Company’s matching contributions cli� vest after two years of service. The Company re-corded compensation expense of $2.3 million, $2.4 million and $2.7 mil-lion for the years ended December 31, 2011, 2012 and 2013, respec-tively, related to its contributions to the plan. The Company may make an additional discretionary contributions to the plan of up to 10% of employees’ base pay. The Company’s discretionary contributions vest 20% per year for an employee’s fi rst fi ve years of service. For the years ended December 31, 2011 (the fi rst year of this “retire ready” contribution) and 2012, the Company made additional discretionary contributions of approximately $2.1 million and $3.5 million. For the year ended Decem-ber 31, 2013, the Company plans to make an additional discretionary contribution of approximately $6.1 million.
The Company has a defi ned benefi t pension plan for its employ-ees in Japan. All employees of Nu Skin Japan, after certain years of service, are entitled to pension plan benefi ts when they terminate em-ployment with Nu Skin Japan. The accrued pension liability was $8.4 million, $7.6 million and $6.2 million as of December 31, 2011, 2012 and
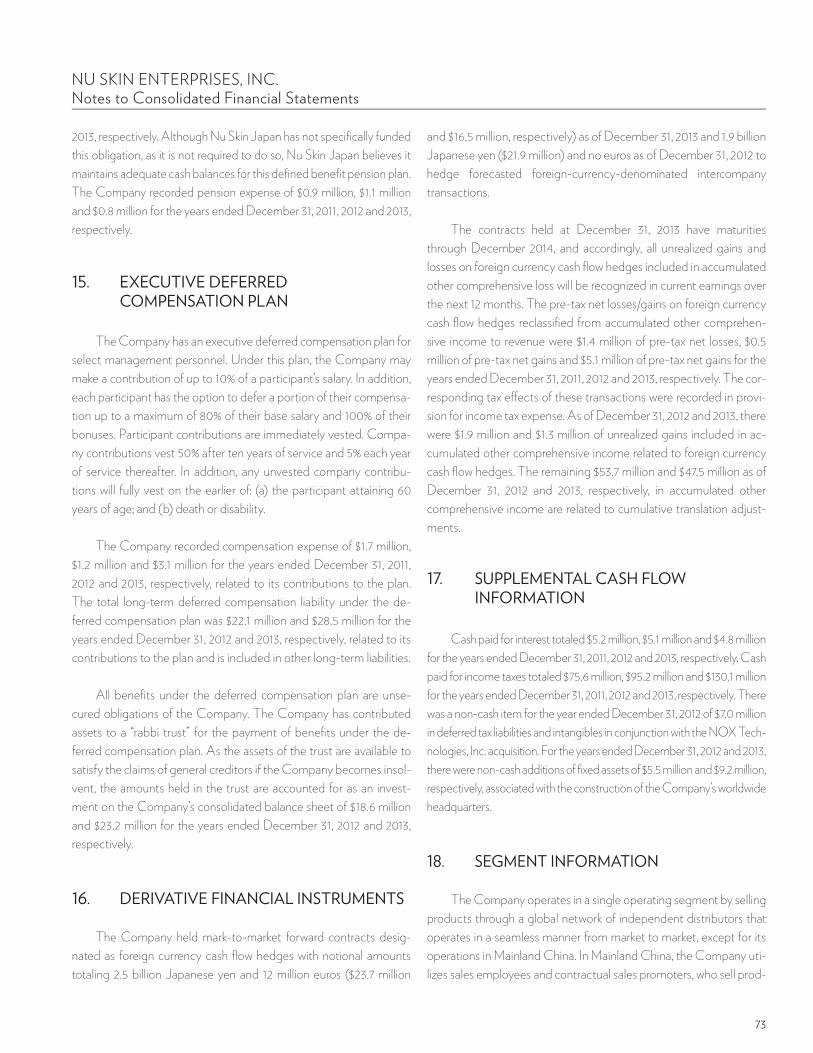
73
NU SKIN ENTERPRISES, INC.Notes to Consolidated Financial Statements
2013, respectively. Although Nu Skin Japan has not specifi cally funded this obligation, as it is not required to do so, Nu Skin Japan believes it maintains adequate cash balances for this defi ned benefi t pension plan. The Company recorded pension expense of $0.9 million, $1.1 million and $0.8 million for the years ended December 31, 2011, 2012 and 2013, respectively.
15. EXECUTIVE DEFERRED COMPENSATION PLAN
The Company has an executive deferred compensation plan for select management personnel. Under this plan, the Company may make a contribution of up to 10% of a participant’s salary. In addition, each participant has the option to defer a portion of their compensa-tion up to a maximum of 80% of their base salary and 100% of their bonuses. Participant contributions are immediately vested. Compa-ny contributions vest 50% after ten years of service and 5% each year of service thereafter. In addition, any unvested company contribu-tions will fully vest on the earlier of: (a) the participant attaining 60 years of age; and (b) death or disability.
The Company recorded compensation expense of $1.7 million, $1.2 million and $3.1 million for the years ended December 31, 2011, 2012 and 2013, respectively, related to its contributions to the plan. The total long-term deferred compensation liability under the de-ferred compensation plan was $22.1 million and $28.5 million for the years ended December 31, 2012 and 2013, respectively, related to its contributions to the plan and is included in other long-term liabilities.
All benefi ts under the deferred compensation plan are unse-cured obligations of the Company. The Company has contributed assets to a “rabbi trust” for the payment of benefi ts under the de-ferred compensation plan. As the assets of the trust are available to satisfy the claims of general creditors if the Company becomes insol-vent, the amounts held in the trust are accounted for as an invest-ment on the Company’s consolidated balance sheet of $18.6 million and $23.2 million for the years ended December 31, 2012 and 2013, respectively.
16. DERIVATIVE FINANCIAL INSTRUMENTS
The Company held mark-to-market forward contracts desig-nated as foreign currency cash fl ow hedges with notional amounts totaling 2.5 billion Japanese yen and 12 million euros ($23.7 million
and $16.5 million, respectively) as of December 31, 2013 and 1.9 billion Japanese yen ($21.9 million) and no euros as of December 31, 2012 to hedge forecasted foreign-currency-denominated intercompany transactions.
The contracts held at December 31, 2013 have maturities through December 2014, and accordingly, all unrealized gains and losses on foreign currency cash fl ow hedges included in accumulated other comprehensive loss will be recognized in current earnings over the next 12 months. The pre-tax net losses/gains on foreign currency cash fl ow hedges reclassifi ed from accumulated other comprehen-sive income to revenue were $1.4 million of pre-tax net losses, $0.5 million of pre-tax net gains and $5.1 million of pre-tax net gains for the years ended December 31, 2011, 2012 and 2013, respectively. The cor-responding tax e� ects of these transactions were recorded in provi-sion for income tax expense. As of December 31, 2012 and 2013, there were $1.9 million and $1.3 million of unrealized gains included in ac-cumulated other comprehensive income related to foreign currency cash fl ow hedges. The remaining $53.7 million and $47.5 million as of December 31, 2012 and 2013, respectively, in accumulated other comprehensive income are related to cumulative translation adjust-ments.
17. SUPPLEMENTAL CASH FLOW INFORMATION
Cash paid for interest totaled $5.2 million, $5.1 million and $4.8 million for the years ended December 31, 2011, 2012 and 2013, respectively. Cash paid for income taxes totaled $75.6 million, $95.2 million and $130.1 million for the years ended December 31, 2011, 2012 and 2013, respectively. There was a non-cash item for the year ended December 31, 2012 of $7.0 million in deferred tax liabilities and intangibles in conjunction with the NOX Tech-nologies, Inc. acquisition. For the years ended December 31, 2012 and 2013, there were non-cash additions of fi xed assets of $5.5 million and $9.2 million, respectively, associated with the construction of the Company’s worldwide headquarters.
18. SEGMENT INFORMATION
The Company operates in a single operating segment by selling products through a global network of independent distributors that operates in a seamless manner from market to market, except for its operations in Mainland China. In Mainland China, the Company uti-lizes sales employees and contractual sales promoters, who sell prod-

74
NU SKIN ENTERPRISES, INC.Notes to Consolidated Financial Statements
ucts in similar fashion to our sales employees but act as independent agents, to sell products through its retail stores and through its web-site, and independent direct sellers who can sell away from the Com-pany’s stores where the Company has obtained a direct sales license. Selling expenses are the Company’s largest expense comprised of the commissions paid to its worldwide independent distributors
as well as remuneration to its sales force in Mainland China. The Company manages its business primarily by managing its sales force. The Company does not use profi tability reports on a regional or divi-sional basis for making business decisions. However, the Company does report revenue in fi ve geographic regions: Greater China, North Asia, South Asia/Pacifi c, Americas and EMEA.
Revenue generated in each of these regions is set forth below (U.S. dollars in thousands):
Year Ended December 31,Revenue: 2011 2012 2013Greater China . . . . . . . . . . . . . . . . . . . . . . $ 333,569 $ 550,690 $ 1,363,182North Asia . . . . . . . . . . . . . . . . . . . . . . . . . 741,857 785,302 869,400South Asia/Pacific . . . . . . . . . . . . . . . . . . 235,000 328,597 378,988Americas . . . . . . . . . . . . . . . . . . . . . . . . . . . 248,180 285,283 370,087EMEA . . . . . . . . . . . . . . . . . . . . . . . . . . . . . . 160,982 182,385 195,061 Total . . . . . . . . . . . . . . . . . . . . . . . . . . . . $ 1,719,588 $ 2,132,257 $ 3,176,718
Revenue generated by each of the Company’s product lines is set forth below (U.S. dollars in thousands):
Year Ended December 31,Revenue: 2011 2012 2013Nu Skin . . . . . . . . . . . . . . . . . . . . . . . . . . . . $ 950,639 $ 1,158,213 $ 1,641,618Pharmanex . . . . . . . . . . . . . . . . . . . . . . . . . 759,280 966,572 1,529,211Other . . . . . . . . . . . . . . . . . . . . . . . . . . . . . 9,669 7,472 5,889 Total . . . . . . . . . . . . . . . . . . . . . . . . . . . . $ 1,719,588 $ 2,132,257 $ 3,176,718
Additional information as to the Company’s operations in the most signifi cant geographical areas is set forth below (U.S. dollars in thousands): :
Year Ended December 31,Revenue: 2011 2012 2013Mainland China . . . . . . . . . . . . . . . . . . . . . $ 148,388 $ 256,833 $ 1,005,395South Korea . . . . . . . . . . . . . . . . . . . . . . . . 276,923 296,000 466,820Japan . . . . . . . . . . . . . . . . . . . . . . . . . . . . . . 464,934 489,302 402,580United States . . . . . . . . . . . . . . . . . . . . . . . 208,246 227,872 268,232Taiwan . . . . . . . . . . . . . . . . . . . . . . . . . . . . . 107,716 134,592 199,161Hong Kong . . . . . . . . . . . . . . . . . . . . . . . . . 77,465 159,265 158,626Malaysia . . . . . . . . . . . . . . . . . . . . . . . . . . . 65,411 65,998 128,656

75
NU SKIN ENTERPRISES, INC.Notes to Consolidated Financial Statements
December 31,Long-lived assets: 2012 2013Mainland China . . . . . . . . . . . . . . . . . . . . . . . . . . . . . . . . . . . . . . . . $ 30,199 $ 82,726South Korea . . . . . . . . . . . . . . . . . . . . . . . . . . . . . . . . . . . . . . . . . . . 14,030 14,345Japan . . . . . . . . . . . . . . . . . . . . . . . . . . . . . . . . . . . . . . . . . . . . . . . . . 8,441 9,970United States . . . . . . . . . . . . . . . . . . . . . . . . . . . . . . . . . . . . . . . . . . 163,137 273,388Taiwan . . . . . . . . . . . . . . . . . . . . . . . . . . . . . . . . . . . . . . . . . . . . . . . . 1,945 1,928Hong Kong . . . . . . . . . . . . . . . . . . . . . . . . . . . . . . . . . . . . . . . . . . . . 559 2,497Malaysia . . . . . . . . . . . . . . . . . . . . . . . . . . . . . . . . . . . . . . . . . . . . . . — 1,463
19. COMMITMENTS AND CONTINGENCIES
The Company is subject to governmental regulations pertaining to product formulation, labeling and packaging, product claims and advertising and to the Company’s direct selling system. The Com-pany is also subject to the jurisdiction of numerous foreign tax and customs authorities. Any assertions or determination that either the Company or the Company’s sales force is not in compliance with exist-ing statutes, laws, rules or regulations could potentially have a material adverse e� ect on the Company’s operations. In addition, in any coun-try or jurisdiction, the adoption of new statutes, laws, rules or regulations or changes in the interpretation of existing statutes, laws, rules or regu-lations could have a material adverse e� ect on the Company and its operations. Although management believes that the Company is in compliance in all material respects with the statutes, laws, rules and regulations of every jurisdiction in which it operates, no assurance can be given that the Company’s compliance with applicable statutes, laws, rules and regulations will not be challenged by foreign authorities or that such challenges will not have a material adverse e� ect on the Com-pany’s fi nancial position or results of operations or cash fl ows. The Company and its Subsidiaries are defendants in litigation and proceed-ings involving various matters. Except as noted below, in the opinion of the Company’s management, based upon advice of its counsel handling such litigation and proceedings, adverse outcomes, if any, will not likely result in a material e� ect on the Company’s consolidated fi nancial condition, results of operations or cash fl ows.
The Company is subject to regular audits by federal, state and foreign tax authorities. These audits may result in additional tax liabili-ties. The Company believes it has appropriately provided for income taxes for all years. Several factors drive the calculation of its tax re-serves. Some of these factors include: (i) the expiration of various stat-utes of limitations; (ii) changes in tax law and regulations; (iii) issuance of tax rulings; and (iv) settlements with tax authorities. Changes in any
of these factors may result in adjustments to the Company’s reserves, which would impact its reported fi nancial results.
The Company is currently involved in a dispute related to customs assessments on several of the Company’s products made by Yokohama Customs for the period of October 2006 through September 2009 in connection with post-importation audits, as well as the disputed portion of the Company’s import duties from October 2009 to the present, which the Company has or will hold in bond or pay under protest. Additional assessments related to any prior period are barred by appli-cable statutes of limitations. The aggregate amount of these assessments and disputed duties was approximately 4.2 billion Japanese yen as of December 31, 2013 (approximately $40.2 million), net of any recovery of consumption taxes. The issue in this case is whether a United States entity utilizing a commissionaire agent in Japan to import its products can use the manufacturer’s invoice or must use another valuation method, and, if an alternative method must be used, what the allowable deductions would be in determining the proper valuation. Following the Company’s review of the assessments and after consulting with the Company’s legal and customs advisors, the Company believes that the additional assess-ments are improper and are not supported by applicable customs laws. The Company fi led letters of protest with the applicable Customs au-thorities, which were rejected. The Company then appealed the matter to the Ministry of Finance in Japan. In the second quarter of 2011, the Ministry of Finance in Japan denied the Company’s administrative ap-peal. The Company disagrees with the Ministry of Finance’s administra-tive decision. The Company is now pursuing the matter in Tokyo District Court, which the Company believes will provide a more independent determination of the matter. In addition, the Company is currently being required to post a bond or make a deposit to secure any additional duties that may be due and payable on these current imports. Because the Company believes that the assessment of higher duties by the customs authorities is an improper application of the regulations, the Company is currently expensing the portion of the duties the Company believes is supported under applicable customs law, and recording the addi-

76
NU SKIN ENTERPRISES, INC.Notes to Consolidated Financial Statements
tional deposit or payment as a receivable within long-term assets on its consolidated fi nancial statements. If the Company is unsuccessful in recovering the amounts assessed and paid, the Company will record a non-cash expense for the full amount of the disputed assessments. The Company anticipates that additional disputed duties will be limited go-ing forward as the Company has entered into an arrangement to purchase a majority of the a� ected products in Japan from a Japanese company that purchases and imports the products from the manufacturers.
Following a number of negative media stories published in Janu-ary 2014 by the People’s Daily in Mainland China, the Company re-ceived inquiries from various government regulators in Mainland China asking the Company to respond to a number of allegations re-lating to its business practices, products and business model. In re-sponse to this media and regulatory scrutiny the Company has volun-tarily taken a number of actions in Mainland China, including temporarily suspending its business promotional meetings, temporar-ily suspending acceptance of applications for any new sales represen-tatives, and extending its product refund and return policies. The ad-verse publicity and suspension of business promotional meetings and acceptance of applications has had a signifi cant negative impact on the number of Sales Leaders and Actives, and the Company’s reve-nue in the short term will be negatively impacted by these voluntary actions. Any inability to resume normal business operations in the near term could have a more signifi cant impact on our business. The Com-pany’s Audit Committee also commenced an internal review of its business practices in Mainland China, which is ongoing. Based upon the results of the internal review to date, the Company currently plans to focus its attention during the next several months on training the Company’s sales force and reinforcing or enhancing our existing sales and other policies in Mainland China. It is currently unclear what im-
pact the adverse publicity and the Company’s voluntary actions will have on its business in this market in the longer term or whether these voluntary actions will be e� ective in addressing concerns of regulators in Mainland China. Regardless, it is likely that the Company will be fi ned and could potentially face some other form of sanctions from these regulators. These other sanctions could include a formal sus-pension of the Company’s ability to recruit new sales people and di-rect sellers, a temporary suspension of the Company’s ability to sell products in various markets or, in the most extreme cases, loss of exist-ing licenses to operate in various jurisdictions in Mainland China. While any of these actions or outcomes could materially harm the Company’s business and fi nancial condition, the Company has not accrued for any related costs as of December 31, 2013.
In addition, the Company is currently being sued in several pur-ported class action lawsuits and a derivative claim relating to this re-cent negative media and regulatory scrutiny and the associated de-cline in the Company’s stock price. These lawsuits, or others fi led alleging similar facts, could result in monetary or other penalties that may a� ect the Company’s operating results and fi nancial condition.
20. DIVIDENDS PER SHARE
Quarterly cash dividends for the years ended December 31, 2012 and 2013 totaled $48.4 million and $70.5 million or $0.20 per share in all quarters of 2012 and $0.30 for all quarters of 2013. The board of direc-tors has declared a quarterly cash dividend of $0.345 per share for all classes of common stock to be paid on March 26, 2014 to stockholders of record on March 14, 2014.
21. QUARTERLY RESULTS
The following table sets forth selected unaudited quarterly data for the periods shown as revised (U.S. dollars in millions, except per share amounts):
2012 20131st
Quarter2nd
Quarter3rd
Quarter4th
Quarter1st
Quarter2nd
Quarter3rd
Quarter4th
QuarterRevenue . . . . . . . . . . . . . . . . . . . . . . . . . . . $ 456.2 $ 577.2 $ 519.7 $ 579.2 $ 541.3 $ 671.3 $ 908.3 $ 1,055.8Gross profit . . . . . . . . . . . . . . . . . . . . . . . . . 380.4 481.6 433.0 484.1 451.3 560.0 768.5 891.1Operating income . . . . . . . . . . . . . . . . . . 71.6 97.9 82.4 88.9 82.6 114.6 168.3 188.6Net income . . . . . . . . . . . . . . . . . . . . . . . . . 47.8 60.4 54.2 59.2 54.3 74.4 110.9 125.3Net income per share: Basic . . . . . . . . . . . . . . . . . . . . . . . . . . . 0.77 0.98 0.90 1.01 0.93 1.27 1.89 2.13 Diluted . . . . . . . . . . . . . . . . . . . . . . . . . 0.74 0.94 0.87 0.97 0.90 1.22 1.80 2.02

77
NU SKIN ENTERPRISES, INC.Notes to Consolidated Financial Statements
22. OTHER INCOME (EXPENSE), NET
Other income (expense), net was $7.0 million of expense in 2011, $4.4 million of income in 2012 and $2.8 million of income in 2013. The Company recorded foreign currency transaction losses with respect to its intercompany receivables and payables with certain of its interna-tional a� liates, including markets that are newly opened or have remained in a loss position since inception. Generally, foreign currency transaction losses with these a� liates would be o� set by gains related to the foreign currency transactions of the Company’s yen-based bank debt. Other income (expense), net also includes approximately $4.8 million, $5.2 million and $3.0 million in interest expense during 2011, 2012 and 2013, respectively. The Company cannot estimate the degree to which its operations will be impacted in the future, but it remains subject to these currency risks. However, the majority of these transaction losses are non-cash, non-operating losses.
23. ACQUISITIONS
In the fourth quarter of 2012, a subsidiary of the Company acquired NOX Technologies, Inc. (“NOX”), a biotechnology and biodiagnostic company based in Malvern, Pennsylvania, for approximately $12.6 mil-lion in cash. The NOX acquisition included patents and previously licensed technology utilized in connection with the Company’s research e� orts and incorporated into some of the Company’s products. As the acqui-sition was deemed to be an asset acquisition, the Company has allo-cated the purchase price to the patents and will amortize the patents over their remaining lives, which were approximately 8 years.
In the fourth quarter of 2011, a subsidiary of the Company acquired substantially all of the assets of LifeGen Technologies, LLC (“LifeGen”), a genomics company based in Madison, Wisconsin for approximately $11.7 million in cash. The LifeGen acquisition included LifeGen’s pro-prietary tissue bank and gene expression database, patents and other intellectual property related to anti-aging gene research. The Com-pany has allocated the purchase price primarily to the patents and will amortize the patents over their remaining lives, which were approxi-mately 17 years.

78
NU SKIN ENTERPRISES, INC.Notes to Consolidated Financial Statements
Report of Independent Registered Public Accounting Firm
To the Board of Directors and Shareholders of Nu Skin Enterprises, Inc.:
In our opinion, the accompanying consolidated balance sheets and the related consolidated statements of income, comprehensive income, stockholders’ equity, and cash fl ows present fairly, in all material respects, the fi nancial position of Nu Skin Enterprises, Inc. and its subsidiaries at December 31, 2013 and December 31, 2012, and the results of their operations and their cash fl ows for each of the three years in the period ended December 31, 2013 in conformity with accounting principles generally accepted in the United States of America. Also in our opinion, the Company maintained, in all material respects, e� ective internal control over fi nancial reporting as of December 31, 2013, based on criteria established in Internal Control—Integrated Framework (1992) issued by the Committee of Sponsoring Organizations of the Treadway Commission (COSO). The Company’s management is responsible for these fi nancial state-ments, for maintaining e� ective internal control over fi nancial reporting and for its assessment of the e� ectiveness of internal control over fi nancial reporting, included in Management’s Report on Internal Control over Financial Reporting appearing in Item 9A. Our respon-sibility is to express opinions on these fi nancial statements and on the Company’s internal control over fi nancial reporting based on our integrated audits. We conducted our audits in accordance with the standards of the Public Company Accounting Oversight Board (United States). Those standards require that we plan and perform the audits to obtain reasonable assurance about whether the fi nancial statements are free of material misstatement and whether e� ective internal control over fi nancial reporting was maintained in all material respects. Our audits of the fi nancial statements included examining, on a test basis, evidence supporting the amounts and disclosures in the fi nancial statements, assessing the accounting principles used and signifi cant estimates made by management, and evaluating the overall fi nancial statement presentation. Our audit of internal control over fi nancial reporting included obtaining an understanding of internal control over fi nancial reporting, assessing the risk that a material weakness exists, and testing and evaluating the design and operating e� ectiveness of internal control based on the assessed risk. Our audits also included performing such other procedures as we consid-ered necessary in the circumstances. We believe that our audits provide a reasonable basis for our opinions.
A company’s internal control over fi nancial reporting is a process designed to provide reasonable assurance regarding the reliability of
fi nancial reporting and the preparation of fi nancial statements for external purposes in accordance with generally accepted accounting principles. A company’s internal control over fi nancial reporting includes those policies and procedures that (i) pertain to the maintenance of records that, in reasonable detail, accurately and fairly refl ect the trans-actions and dispositions of the assets of the company; (ii) provide reasonable assurance that transactions are recorded as necessary to permit preparation of fi nancial statements in accordance with gener-ally accepted accounting principles, and that receipts and expenditures of the company are being made only in accordance with authorizations of management and directors of the company; and (iii) provide reason-able assurance regarding prevention or timely detection of unauthor-ized acquisition, use, or disposition of the company’s assets that could have a material e� ect on the fi nancial statements.
Because of its inherent limitations, internal control over fi nancial reporting may not prevent or detect misstatements. Also, projections of any evaluation of e� ectiveness to future periods are subject to the risk that controls may become inadequate because of changes in conditions, or that the degree of compliance with the policies or procedures may deteriorate.
/s/ PricewaterhouseCoopers LLP
Salt Lake City, UtahMarch 18, 2014

79
ITEM 9. CHANGES IN AND DISAGREEMENTS WITH ACCOUNTANTS ON ACCOUNTING AND FINANCIAL DISCLOSURE
None.
ITEM 9A. CONTROLS AND PROCEDURESEvaluation of Disclosure Controls and Procedures. Under the supervi-sion and with the participation of our management, including our Chief Executive O� cer and Chief Financial O� cer, we evaluated the e� ectiveness of the design and operation of our disclosure controls and procedures (as such term is defi ned in Rule 13a-15(e) under the Securi-ties Exchange Act of 1934 (the “Exchange Act”)). Disclosure controls and procedures are the controls and other procedures that we designed to ensure that we record, process, summarize and report in a timely manner the information we must disclose in reports that we fi le with or submit to the Securities and Exchange Commission under the Exchange Act. Based on this evaluation, our Chief Executive O� cer and our Chief Financial O� cer concluded that our disclosure controls and procedures were e� ective as of the end of the period covered by this report.
Changes in Internal Control over Financial Reporting. During the fourth quarter of 2013, there was no change in our internal control over fi nancial reporting (as such term is defi ned in Rule 13a-15(f) under the Exchange Act) that has materially a� ected, or is reasonably likely to materially a� ect, our internal control over fi nancial reporting.
Management’s Report on Internal Control over Financial Reporting.Our management is responsible for establishing and maintaining adequate internal control over fi nancial reporting. Internal control over fi nancial reporting is defi ned in Rule 13a-15(f) under the Exchange Act as a process designed by, or under the supervision of, our principal executive and principal fi nancial o� cers and e� ected by our board of directors, management and other personnel, to provide reasonable assurance regarding the reliability of fi nancial reporting and the prep-aration of fi nancial statements for external purposes in accordance with accounting principles generally accepted in the United States of America and includes those policies and procedures that:
• pertain to the maintenance of records that, in reasonable detail, accurately and fairly refl ect the transactions and dispositions of our assets;
• provide reasonable assurance that transactions are recorded as necessary to permit preparation of fi nancial statements in ac-cordance with accounting principles generally accepted in the United States of America, and that our receipts and expendi-tures are being made only in accordance with authorization of management and directors; and
• provide reasonable assurance regarding prevention or timely detection of unauthorized acquisition, use or disposition of our assets that could have a material e� ect on the fi nancial statements.
Because of its inherent limitations, internal control over fi nancial reporting may not prevent or detect misstatements. Also, projections of any evaluation of e� ectiveness to future periods are subject to the risk that controls may become inadequate because of changes in conditions, or that the degree of compliance with the policies or pro-cedures may deteriorate.
Under the supervision and with the participation of our man-agement, including our principal executive and principal fi nancial of-fi cers, we assessed, as of December 31, 2013, the e� ectiveness of our internal control over fi nancial reporting. This assessment was based on criteria established in the framework in Internal Control-Integrated Framework (1992) issued by the Committee of Sponsoring Organi-zations of the Treadway Commission. Based on our assessment, our management concluded that our internal control over fi nancial reporting was e� ective at a reasonable assurance level as of December 31, 2013.
The e� ectiveness of our internal control over fi nancial reporting as of December 31, 2013, has been audited by PricewaterhouseCoopers LLP, an independent registered public accounting fi rm, as stated in their report, which appears herein.
ITEM 9B. OTHER INFORMATION
None.

80
ITEM 15. EXHIBITS AND FINANCIAL STATEMENT SCHEDULES
Documents fi led as part of this Form 10-K:
1. Financial Statements. See Index to Consolidated Financial Statements under Item 8 of Part II.
2. Financial Statement Schedules. N/A
3. Exhibits. References to the “Company” shall mean Nu Skin Enterprises, Inc. Unless otherwise noted, the SEC fi le number for exhibits incorporated by reference is 001-12421.
2.1 LifeGen Asset Purchase Agreement, dated as of Decem-ber 13, 2011 between LifeGen Technologies, LLC and Nu Skin International, Inc. (incorporated by reference to Exhibit 2.1 to the Company’s Annual Report on Form 10-K for the year ended December 31, 2011; the Company undertakes to furnish a copy of any omitted schedule or similar attach-ments to the Securities and Exchange Commission upon request).
3.1 Amended and Restated Certifi cate of Incorporation of the Company (incorporated by reference to Exhibit 3.1 to the Company’s Registration Statement on Form S-1 (File No. 333-12073) (the “Form S-1”)).
3.2 Certifi cate of Amendment to the Amended and Restated Certifi cate of Incorporation (incorporated by reference to Exhibit 3.2 to the Company’s Annual Report on Form 10-K for the year ended December 31, 2009).
3.3 Certifi cate of Designation, Preferences and Relative Partici-pating, Optional and Other Special Rights of Preferred Stock and Qualifi cations, Limitations and Restrictions Thereof (incorporated by reference to Exhibit 3.3 to the Company’s Annual Report on Form 10-K for the year end-ed December 31, 2004).
3.4 Second Amended and Restated Bylaws of Nu Skin Enter-prises, Inc. (incorporated by reference to Exhibit 3.1 to the Company’s Quarterly Report on Form 10-Q for the quar-ter ended June 30, 2011).
4.1 Specimen Form of Stock Certifi cate for Class A Common Stock (incorporated by reference to Exhibit 4.1 to the Com-pany’s Registration Statement on Form S-3 (File No. 333-90716)).
4.2 Specimen Form of Stock Certifi cate for Class B Common Stock (incorporated by reference to Exhibit 4.2 to the Com-pany’s Form S-1).
10. 1 Credit Agreement, dated as of December 29, 2010, among the Company and JPMorgan Chase Bank, N.A. (incorpo-rated by reference to Exhibit 10.12 to the Company’s Annu-al Report on Form 10-K for the year ended December 31, 2010).
10.2 Amended and Restated Credit Agreement, dated as of May 25, 2012, among the Company, various fi nancial insti-tutions, and JPMorgan Chase Bank, N.A. as administrative agent (incorporated by reference to Exhibit 10.1 to the Company’s Quarterly Report on Form 10-Q fi led August 7, 2012).
*10.3 First Amendment of the Amended and Restated Credit Agreement, dated as of May 25, 2012, among the Compa-ny, various fi nancial institutions, and JPMorgan Chase Bank, N.A. as administrative agent, dated as of August 7, 2012.
10.4 Second Amendment of the Amended and Restated Credit Agreement, dated as of May 25, 2012, among the Compa-ny, various fi nancial institutions, and JPMorgan Chase Bank, N.A. as administrative agent, dated as of February 5, 2013 (incorporated by reference to Exhibit 10.1 to the Company’s Quarterly Report on Form 10-Q fi led May 3, 2013.)
The information required by Items 10, 11, 12, 13 and 14 of Part III is hereby incorporated by reference to our Defi nitive Proxy Statement fi led or to be fi led with the Securities and Exchange Commission for our 2014 Annual Meeting of Stockholders except for certain information required by Item 10 with respect to our executive o� cers which is set forth under Item 1. “Business”, of this Annual Report on Form 10-K, and is incor-porated herein by reference.
PART III
PART IV

81
*10.5 Third Amendment of the Amended and Restated Credit Agreement, dated as of May 25, 2012, among the Compa-ny, various fi nancial institutions, and JPMorgan Chase Bank, N.A. as administrative agent, dated as of December 11, 2013.
10.6 Amended and Restated Note Purchase and Private Shelf Agreement (Multi-Currency), dated as of May 25, 2012, among the Company, Prudential Investment Management, Inc. and certain other purchasers (incorporated by reference to Exhibit 10.2 to the Company’s Quarterly Report on Form 10-Q fi led August 7, 2012).
*10.7 First Amendment to the Amended and Restated Note Purchase and Private Shelf Agreement (Multi-Currency), dated as of May 25, 2012, among the Company, Prudential Investment Management, Inc. and certain other purchasers, dated as of August 7, 2012.
*10.8 Second Amendment to the Amended and Restated Note Purchase and Private Shelf Agreement (Multi-Currency), dated as of May 25, 2012, among the Company, Prudential Investment Management, Inc. and certain other purchasers, dated as of December 5, 2013.
10.9 Series C Senior Notes Nos. C-1 and C-2 issued February 7, 2005 by the Company to Prudential Investment Manage-ment, Inc. and/or its a� liates pursuant to the Private Shelf Agreement (incorporated by reference to Exhibit 99.2 to the Company’s Current Report on Form 8-K fi led February 8, 2005).
10.10 Series D Senior Notes Nos. D-1, D-2, D-3 and D-4 issued October 3, 2006 by the Company to Prudential Investment Management, Inc. and/or its a� liates pursuant to the Pri-vate Shelf Agreement (incorporated by reference to Exhibit 99.4 to the Company’s Current Report on Form 8-K fi led October 10, 2006).
10.11 Series E Senior Notes Nos. E-1, E-2, E-3, E-4 and E-5 issued January 19, 2007 by the Company to Prudential Investment Management, Inc. and/or its a� liates pursuant to the Pri-vate Shelf Agreement (incorporated by reference to Exhibit 99.1 to the Company’s Current Report on Form 8-K fi led January 25, 2007).
10.12 Series EE Senior Note EE-1, issued January 8, 2008, by the Company to Prudential Insurance Company of America pursuant to the Private Shelf Agreement (incorporated by
reference to Exhibit 99.2 to the Company’s Current Report on 8-K fi led January 14, 2008).
10.13 Series F Senior Notes Nos. F-1 and F-2 issued September 28, 2007 by the Company to Prudential Investment Man-agement, Inc. and/or its a� liates pursuant to the Private Shelf Agreement (incorporated by reference to Exhibit 10.1 to the Company’s Quarterly Report on Form 10-Q for the quarter ended September 30, 2007).
10.14 Series G Senior Notes Nos. G-1, G-2 and G-3, issued May 31, 2012, by the Company to The Prudential Insurance Company of America, Pruco Life Insurance Company and Prudential Retirement Insurance and Annuity Company (incorporated by reference to Exhibit 10.3 to the Company’s Quarterly Report on Form 10-Q fi led August 7, 2012).
10.15 Design and Construction Agreements e� ective March 10, 2011, between Nu Skin International, Inc. and each of Bolin Cywinski Jackson and Okland Construction Company, Inc. (incorporated by reference to Exhibit 10.1 to the Company’s Quarterly Report on Form 10-Q for the quarter ended March 31, 2011).
#10.16 Form of Indemnifi cation Agreement to be entered into be-tween the Company and certain of its o� cers and directors (incorporated by reference to Exhibit 10.48 to the Compa-ny’s Annual Report on Form 10-K for the year ended De-cember 31, 2008).
#10.17 Amended and Restated Deferred Compensation Plan, ef-fective as of January 1, 2008 (incorporated by reference to Exhibit 10.5 to the Company’s Quarterly Report on Form 10-Q for the quarter ended September 30, 2007).
#10.18 Amendment to the Deferred Compensation Plan, e� ective as of January 1, 2009 (incorporated by reference to Exhibit 10.50 to the Company’s Annual Report on Form 10-K for the year ended December 31, 2008).
#10.19 Nu Skin Enterprises, Inc. Nonqualifi ed Deferred Compen-sation Trust dated December 14, 2005 (incorporated by ref-erence to Exhibit 99.2 to the Company’s Current Report on Form 8-K fi led December 19, 2005).
#10.20 Second Amended and Restated Nu Skin Enterprises, Inc. 1996 Stock Incentive Plan (incorporated by reference to Ex-hibit 10.28 to the Company’s Annual Report on Form 10-K for the year ended December 31, 2005).
82
#10.21 Amendment to the Second Amended and Restated Nu Skin Enterprises, Inc. 1996 Stock Incentive Plan (incorporat-ed by reference to Exhibit 10.2 to the Company’s Quarterly Report on Form 10-Q for the quarter ended June 30, 2013).
#10.22 Form of Master Stock Option Agreement (1996 Plan) (in-corporated by reference to Exhibit 10.49 to the Company’s Annual Report on Form 10-K for the year ended Decem-ber 31, 2007).
#10.23 Form of Stock Option Agreement for Directors (1996 Plan) (incorporated by reference to Exhibit 10.48 to the Compa-ny’s Annual Report on Form 10-K for the year ended De-cember 31, 2006).
#10.24 Nu Skin Enterprises, Inc. 2006 Stock Incentive Plan (incor-porated by reference to Exhibit 10.1 to the Company’s Cur-rent Report on Form 8-K fi led on June 1, 2006).
#10.25 Amendment to the 2006 Stock Incentive Plan (incorporat-ed by reference to Exhibit 10.3 to the Company’s Quarterly Report on Form 10-Q for the quarter ended June 30, 2013).
#10.26 Form of Master Stock Option Agreement (2006 Plan) (in-corporated by reference to Exhibit 10.10 to the Company’s Quarterly Report on Form 10-Q for the quarterly period ended September 30, 2006).
#10.27 Form of Master Stock Option Agreement (2006 Plan Per-formance Option (U.S.)) (incorporated by reference to Ex-hibit 10.54 to the Company’s Annual Report on Form 10-K for the year ended December 31, 2007).
#10.28 Form of Master Stock Option Agreement for Directors (2006 Plan) (incorporated by reference to Exhibit 10.59 to the Company’s Annual Report on Form 10-K for the year ended December 31, 2008).
#10.29 Form of Director Restricted Stock Unit Agreement (2006 Plan) (incorporated by reference to Exhibit 10.4 to the Company’s Quarterly Report on Form 10-Q for the quar-ter ended June 30, 2007).
#10.30 Form of Master Restricted Stock Unit Agreement (2006 Plan) (incorporated by reference to Exhibit 10.11 to the Company’s Quarterly Report on Form 10-Q for the quar-terly period ended September 30, 2006).
#10.31 Amended and Restated Nu Skin Enterprises, Inc. 2010 Omnibus Incentive Plan (incorporated by reference to Exhibit 10.1 to the Company’s Current Report on Form 8-K fi led on June 7, 2013).
#10.32 Form of 2010 Plan U.S. Stock Option Master Agreement and Grant Notice (incorporated by reference to Exhibit 10.1 to the Company’s Current Report on Form 8-K fi led on July 2, 2010).
#10.33 Form of 2010 Plan U.S. Restricted Stock Unit Master Agreement and Grant Notice (incorporated by reference to Exhibit 10.3 to the Company’s Current Report on Form 8-K fi led on July 2, 2010).
#10.34 Form of 2010 Plan U.S. Performance Stock Option Master Agreement and Grant Notice (incorporated by reference to Exhibit 10.54 to the Company’s Annual Report on Form 10-K for the year ended December 31, 2010).
#10.35 Form of 2010 Plan U.S. Performance Restricted Stock Unit Master Agreement and Grant Notice (incorporated by ref-erence to Exhibit 10.2 to the Company’s Current Report on Form 8-K fi led on July 2, 2010).
#10.36 Form of 2010 Plan Director Stock Option Master Agree-ment and Grant Notice (incorporated by reference to Ex-hibit 10.7 to the Company’s Quarterly Report on Form 10-Q for the quarterly period ended June 30, 2010).
#10.37 Form of 2010 Plan Director Restricted Stock Unit Master Agreement and Grant Notice (incorporated by reference to Exhibit 10.8 to the Company’s Quarterly Report on Form 10-Q for the quarterly period ended June 30, 2010).
#10.38 Form of Amended & Restated 2010 Plan Director Stock Option Grant Agreement (incorporated by reference to Exhibit 10.4 to the Company’s Quarterly Report on Form 10-Q for the quarterly period fi led on August 5, 2013).
#10.39 Form of Amended & Restated 2010 Plan Director Restrict-ed Stock Unit Grant Agreement (incorporated by reference to Exhibit 10.5 to the Company’s Quarterly Report on Form 10-Q for the quarterly period fi led on August 5, 2013).
#10.40 Form of Amended & Restated 2010 Plan Performance Stock Option Grant Agreement (incorporated by reference to Exhibit 10.1 to the Company’s Quarterly Report on Form 10-Q for the quarterly period fi led on November 6, 2013).

83
#10.41 Nu Skin Enterprises, Inc. 2009 Key Employee Death Bene-fi t Plan (incorporated by reference to Exhibit 10.58 to the Company’s Annual Report on Form 10-K for the year end-ed December 31, 2010).
#10.42 Joseph Y. Chang Employment Agreement dated Novem-ber 9, 2009, between Mr. Chang and the Company (incor-porated by reference to Exhibit 10.2 to the Company’s Quarterly Report on Form 10-Q for the quarter ended September 30, 2009).
#10.43 Employment Agreement, e� ective as of August 1, 2012, between the Company and M. Truman Hunt (incorporated by reference to Exhibit 10.4 to the Company’s Quarterly Report on Form 10-Q fi led August 7, 2012).
#10.44 Form of Employment Agreement, with schedule of material di� erences, e� ective as of August 1, 2012, between the Company and Ritch N. Wood, Daniel R. Chard, D. Mat-thew Dorny and Scott E. Schwerdt (incorporated by refer-ence to Exhibit 10.5 to the Company’s Quarterly Report on Form 10-Q fi led August 7, 2012).
#10.45 Form of Key Employee Covenants (incorporated by refer-ence to Exhibit 10.2 to the Company’s Quarterly Report on Form 10-Q for the quarter ended June 30, 2007).
*21.1 Subsidiaries of the Company.
*23.1 Consent of PricewaterhouseCoopers LLP.
*31.1 Certifi cation by M. Truman Hunt, President and Chief Ex-ecutive O� cer, pursuant to Rule 13a-14(a) of the Securities Exchange Act of 1934, as adopted pursuant to Section 302 of the Sarbanes-Oxley Act of 2002.
*31.2 Certifi cation by Ritch N. Wood, Chief Financial O� cer, pursuant to Rule 13a-14(a) of the Securities Exchange Act of 1934, as adopted pursuant to Section 302 of the Sar-banes-Oxley Act of 2002.
*32.1 Certifi cation by M. Truman Hunt, President and Chief Ex-ecutive O� cer, pursuant to Section 1350, Chapter 63 of Ti-tle 18, United States Code, as adopted pursuant to Section 906 of the Sarbanes-Oxley Act of 2002.
*32.2 Certifi cation by Ritch N. Wood, Chief Financial O� cer, pursuant to Section 1350, Chapter 63 of Title 18, United States Code, as adopted pursuant to Section 906 of the Sarbanes-Oxley Act of 2002.
*101.INS XBRL Instance Document
*101.SCH XBRL Taxonomy Extension Schema Document
*101.CAL XBRL Taxonomy Extension Calculation Linkbase Document
*101.DEF XBRL Taxonomy Extension Defi nition Linkbase Document
*101.LAB XBRL Taxonomy Extension Label Linkbase Document
*101.PRE XBRL Taxonomy Extension Presentation Linkbase Document
* Filed herewith. # Management contract or compensatory plan or arrangement.
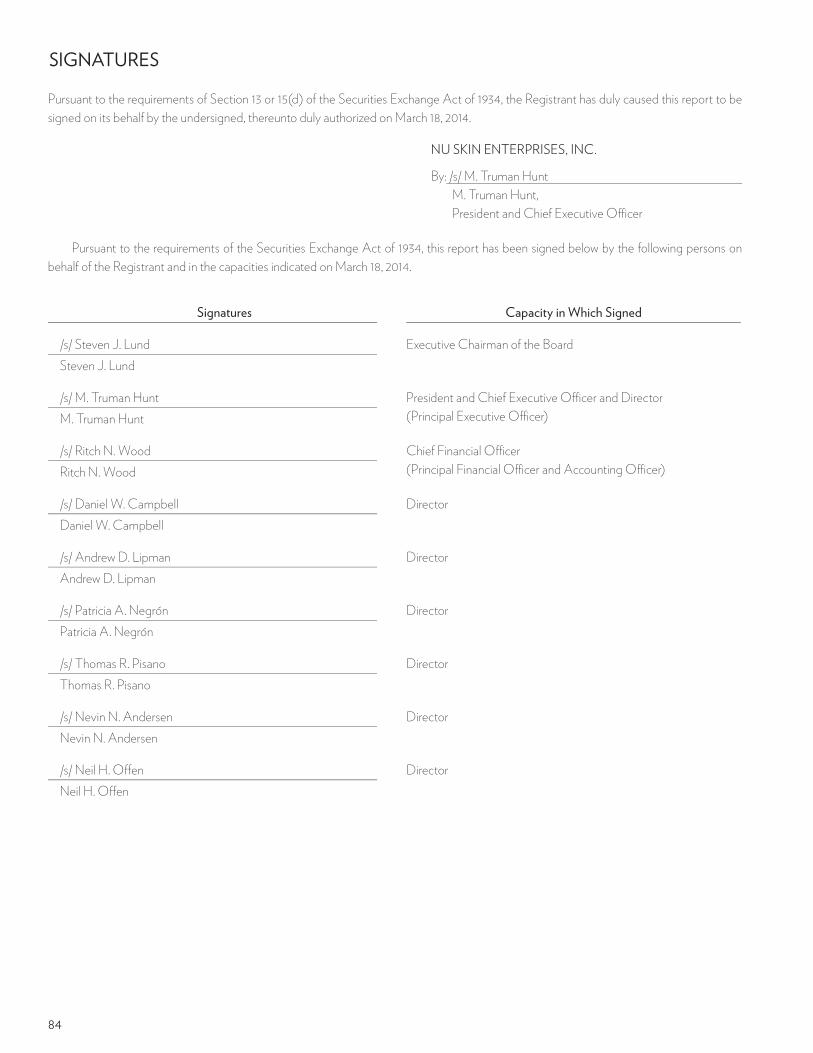
84
Signatures Capacity in Which Signed
/s/ Steven J. LundSteven J. Lund
Executive Chairman of the Board
/s/ M. Truman HuntM. Truman Hunt
President and Chief Executive O� cer and Director (Principal Executive O� cer)
/s/ Ritch N. WoodRitch N. Wood
Chief Financial O� cer(Principal Financial O� cer and Accounting O� cer)
/s/ Daniel W. CampbellDaniel W. Campbell
Director
/s/ Andrew D. LipmanAndrew D. Lipman
Director
/s/ Patricia A. NegrónPatricia A. Negrón
Director
/s/ Thomas R. PisanoThomas R. Pisano
Director
/s/ Nevin N. AndersenNevin N. Andersen
Director
/s/ Neil H. O� enNeil H. O� en
Director
SIGNATURES
Pursuant to the requirements of Section 13 or 15(d) of the Securities Exchange Act of 1934, the Registrant has duly caused this report to be signed on its behalf by the undersigned, thereunto duly authorized on March 18, 2014.
NU SKIN ENTERPRISES, INC.
By: /s/ M. Truman Hunt M. Truman Hunt, President and Chief Executive O� cer
Pursuant to the requirements of the Securities Exchange Act of 1934, this report has been signed below by the following persons on behalf of the Registrant and in the capacities indicated on March 18, 2014.

85
BOARD OF DIRECTORS
Steven J. LundExecutive Chairman of the Board
M. Truman HuntPresident, Chief Executive O� cer
Nevin N. AndersenRetiredAudit Committee ChairNominating and Corporate Governance Committee Member
Daniel W. CampbellManaging General Partner, EsNet, Ltd.Executive Compensation Committee ChairAudit Committee Member
Andrew D. LipmanPartner, Bingham McCutchen, LLPNominating and Corporate Governance Committee ChairExecutive Compensation Committee Member
Patricia A. NegrónIndependent Consultant, AuthorAudit Committee MemberExecutive Compensation Committee Member
Neil O� enRetiredNominating and Corporate Governance Committee MemberExecutive Compensation Committee Member
Thomas R. PisanoRetiredNominating and Corporate Governance Committee MemberAudit Committee Member
CORPORATE INFORMATION
TRANSFER AGENTInquiries regarding lost stock certifi cates, consolidation of accounts, and changes in address, name, or ownership should be addressed to: American Stock Transfer & Trust Co. LLC, 6201 15th Avenue, Brooklyn, NY 11219. Toll Free: 800-937-5449. International Shareholders: 718-921-8124, Email: [email protected]
CORPORATE HEADQUARTERSNu Skin Enterprises 75 West Center Street Provo, Utah 84601 Telephone: 801-345-1000
COMPANY WEBSITEnuskinenterprises.com
ADDITIONAL STOCKHOLDER INFORMATION Additional information and news is available at www.nuskinenter-prises.com. For investor information, inquiries, annual reports and SEC fi lings, call 801-345-1000, email [email protected], or write Investor Relations at the corporate headquarters.
FORWARD-LOOKING STATEMENTSThis annual report contains forward-looking statements within the meaning of Section 27A of the Securities Act of 1933, as amended, and Section 21E of the Securities Exchange Act of 1934, as amended, that represent the company’s current expectations and beliefs. All statements other than statements of historical fact are “forward-looking statements” for purposes of federal and state securities laws and include, but are not limited to, statements of management’s expectations regarding the company’s performance, initiatives, strategies, new products, opportu-nities and risks; statements of projections regarding future operating results and other fi nancial items; statements of belief; and statements of assumptions underlying any of the foregoing. In some cases, you can identify these statements by forward-looking words such as “believe,” “expect,” “project,” “anticipate,” “estimate,” “intend
,
” “plan,” “targets,” “likely,” “will,” “would,” “could,” “may,” “might,” the negative of these words and other similar words. We undertake no obligation to publicly update or revise any forward-looking statement, whether as a result of new information, future events or otherwise, except as required by law. We caution and advise readers that these statements are based on certain assumptions that may not be realized and involve risks and uncertainties that could cause actual results to di� er materially from the expectations and beliefs contained herein. For a summary of certain risks related to our business, see the company’s Annual Report on Form 10-K fi led on March 18, 2013, and other documents fi led by the company with the Securities and Exchange Commission.

86

“THERE IS POWER IN DREAMS, IN IMAGINATION AND IN THE COURAGE OF THOSE RESOLVED TO MAKE THEIR DREAMS A REALITY.” Truman Hunt
Cert no. XXX-XXX-XXXX

NU
SKIN A
NN
UA
L REPORT 2013
NU SKIN ENTERPRISES, INC. 75 WEST CENTER STREET PROVO, UTAH 84601 01 008099