
YEARBOOK 2013 - Jamaica Stock Exchange · 1969 2014 ... YEARBOOK 2013. 1 “Providing A Fair,...
84
“Providing A Fair, Efficient and Transparent Stock Market” R Y A S R E V I N A N “Providing A Fair, Efficient and Transparent Stock Market” 1969 2014 th 45 “From Productivity to Prosperity: Regional Survival & Growth through Investments” YEARBOOK 2013 YEARBOOK 2013
Transcript of YEARBOOK 2013 - Jamaica Stock Exchange · 1969 2014 ... YEARBOOK 2013. 1 “Providing A Fair,...

“Providing A Fair, Efficient and Transparent Stock Market”
RYASREVINAN
“Providing A Fair, Efficient and Transparent Stock Market”
1969 2014th45
“From Productivity to Prosperity: Regional Survival & Growth through Investments”
YEARBOOK 2013
YEARBOOK 2013


1
“Providing A Fair, Efficient and Transparent Stock Market”
YEARBOOK 2013
JAMAICA STOCK EXCHANGE YEAR BOOK 2013

2JAMAICA STOCK EXCHANGE YEAR BOOK 2013

3
TABLE OF CONTENTS
The Jamaica Stock Exchange Yearbook is published annually by the Jamaica Stock Exchange, 40 Harbour Street, P.O.Box 1084, Kingston, Jamaica. Telephone: (876) 967-3271/Fax: 924-9090. Visit us at: www.jamstockex.com
Copies of the Book may be obtained by contacting the Jamaica Stock Exchange.Editor: Neville Ellis, Cover Design & Book Layout: Richard Paisley
“Providing A Fair, Efficient and Transparent Stock Market”
JAMAICA STOCK EXCHANGE YEAR BOOK 2013
TABLE OF CONTENTSTABLE OF CONTENTS
STOCK 47 Monthly Volumes and ValuesMARKET 49 Monthly Index DATA 50 Trading Averages 51 Top Twenty Companies: By Market Capitalization, Volume and Value 52 Top Ten Companies: By Volume and Value 53 Twenty Most Active Stocks for 2013 & Block Transactions for 2013 54 A Five-Year History of Dividend Summary 55 Bonuses, Splits and New Issues: A Five Year History
COMPANY 56 Corporate Data: Issued Capital, Par Value and Due Dates PROFILES & 59 Top Twenty Companies: By Sales, Pre-Tax Profit and After-Tax ProfitPERFORMANCE 61 Corporate Profit Profile: 2013 vs. 2012 62 Monthly Trading Volumes and Values 71 Understanding Terms and References 72 Corporate Information and Financial Data
JSE DATA 141 Listing Fees and Trading Charges for Main Market and Junior Market 143 JSE Statement of Corporate Governance Principles and Practices 147 JSE Stockbrokerages & Contact Information 148 Index to Advertisers 149 JSE Board Members’ Profile 155 JSE’s Manangement Team 160 Acknowledgement
STOCK 32 A Five Year History of Trading ActivityMARKET 38 Month-End Stock Price QuotationsACTIVITY 43 Year-End Stock Price Quotations 45 Annual High & Low Stock Prices
MESSAGES 4 Welcome Message From the Chairman of the JSE 5 Message - General Manager - JSE 7 Historical Points of the JSE over the last 44 Years 8 JSE Corporate Highlights
Year in Review 2013 24 Stock Market Review - Economic Overview and Stock Market Performance
14 GM's Report - Economic Highlights and Market Performance
22 RMOD's Report

4
Welcome Message
Mr. Donavon Perkins- ChairmanJamaica Stock Exchange
“Providing A Fair, Efficient and Transparent Stock Market”
Chairman, Jamaica Stock Exchange
JAMAICA STOCK EXCHANGE YEAR BOOK 2013
Chairman, Jamaica Stock ExchangeChairman, Jamaica Stock Exchangethhe Jamaica Stock Exchange is on the cusp of celebrating its 45 Year
Anniversary and we are delighted to have served you over the years. As an institution we have become entrenched in the Jamaican society, as not only businesses, investors and researchers look to the Stock Exchange for
information, but the Government also uses the market as an indication of economic performance and the overall health of the economy. The market over the years has assisted in the country'scapital formation and wealth creation.
Wealth creation is very important especially in today's economy. We have been in a very difficult economic situation since the global economic down turn in 2009. In thisdifficult economic climate, the importance of saving and investments takes on addedsignificance. To ensure that one gets the best from their hard earned resources, it is important to do your research, and the JSE Year Book provides a very valuable source of information to you, the investing public. The Year Book gives information on all Listed Companies on the Main, Junior, Bond and the US Denominated markets. Information such as: 1. Dividend Paid by each company (if any)
2. Total trades on each company's shares, by value and volume
3. Annual High & Low
4. Bonus
5. Stock Splits, among other things
In 2013, the JSE brand continued to be very strong and we are working assiduously to ensure that it remains as such and becomes even stronger. To achieve this in 2014 and beyond, we will be:
Developing new products for the market,
Sharpening existing ones and
Continuingto use technology to drive the processes.
We could not have accomplished all that we have without our hardworking Management Team, Staff and Board of Directors who work together to ensure that the company is moving in the right direction.
Please continue to use our Year Book to make your investment decision and that you will reap even greater economic success from the market. For those who use this medium to do your research, we can assure you that we have made every effort to provide you with the best available data on our Listed Companies. For those who use this medium just for information and knowledge, we continue to do our best to ensure that this publication meets your expectation. As always please continue to enjoy the JSE Yearbook.

5
Welcome Message -
Mrs. Marlene Street Forrest - General Manager Jamaica Stock Exchange
“Providing A Fair, Efficient and Transparent Stock Market”
ear Readers,D
General Manager, Jamaica Stock Exchange
JAMAICA STOCK EXCHANGE YEAR BOOK 2013
General Manager, Jamaica Stock Exchange General Manager, Jamaica Stock Exchange
thThe Jamaica Stock Exchangeis on the eve of celebrating its 45 anniversary and it is
with a sense of pride and accomplishment that I pen my message to you. We have
remained steadfast in our commitment to providing you with information both current
and relevant that will enable you to understand the issues and effectively use them in
your decision making, advisory or educational pursuits. The Stock Exchange has still
remained the single largest provider of information on the equity market and the only
central point where you can receive up-to-date information on all companies listed on
the market.
Based on your continuous feedback we are aware that through our Yearbook you are
able to analyse the information on the stock market and the companies that are listed
on our Main, Junior, US Denominated and Bond Markets.
The Jamaica Stock Exchange's Year Book continues to evolve due to your feedback.
The inclusion of the report from the JSE Chief Regulatory Officer provides an element
of improvement in the area of transparency. The summary of the activities on the
Exchange as well via the Stock Market Review is just another new feature that provides
readers with a quick overview of market activities before launching into in-depth
company-by-company analyses. Please continue to give us your feedback, as this will
serve to keep this publication fresh and relevant to you our readers and serve to attract
potential readers to this publication.
We are happy to have served you over the last 44 years and look forward to serving you
for many years into the future. I would like to take this opportunity to thank our outgoing
Chairman for his support for this publication,the team from the Market Operations and
Trading Department and the Marketing Department for their hard word in compiling the
data and other information, thereby creating another valuable keepsake- the JSE Year
Book 2013.

6
Historical Points of the JSE
April 2008Establishment of RMOC & RMOD.
April 2008The JSE fully demutualized on April 1, 2008 and it is the only demutualized Exchange in the caribbean.
September 2009Launch of RMOD’s Automated Market Surveillance System, the first such electronic system in the region.
2008The Company’s subsidiary JCSD introducedtrustee services.In September 2008 the JSE celebrated its first National Investor Education Week and launched its Stock Market Game for High Schools.
2005JSE revamped its website and re-launched a ‘new look’ website in July.
June 3, 2005A historic note was sounded when Representatives of the Jamaica Stock Exchange attended the New York Stock Exchange as Prime Minister the Rt. Hon. P.J. Patterson rang the Opening bell.
Recorded 8 Listings on Junior Market in 2010.
September 2010The first cohort of JSE’se-Learning Campus enrolled.
April 2010Launch of JSE’s e-Learning Campus April 1, 2010.
October 2009Access Financial Services Ltd. was the first company to be listed on the Junior Exchange.
July 2011 - JSE Established US Denominated Securities Market.
July 2011 - PROVEN listed first US Denominated Securities.
2011- 4 Listings on the Junior Market.
2012- 3 Listings on the Junior Market.
Historical Points of the JSE
January 31, 2012 Proven Investments Limited listed its 8% preference shares.
February 8, 2012 Proven Wealth Management received Member Dealer’s licence.
December 2012The largest acquisition of a Jamaican company - Campari acquired Lascelles deMercado.
February 2009 th
JSE’s 40 Anniversary Celebrations.
April 2009Launch of the JSE’s Junior Market by Senator Don Wehby.
JAMAICA STOCK EXCHANGE YEAR BOOK 2013
April 26, 2005
The JSE (Main) Index
recorded its highest value
of 120,385.49 points.
Effective July 1, 2009
All non-resident shareholders
were subject to tax on dividends
at 33 1/3% for corporations and
25% for individuals.
April 1, 2013
A tax of 15% was imposed
on dividends payable to
resident shareholders.

7
,
began in Jamaica as an over-the-
over the last 43 Years over the last 44 Years
June 1, 2000A new JSE Index-Jamaica Select Index-comprising the 15 most liquid stocks was introduced on June 1. The JSE Select Index comprises and reflects only the performance of the fifteen most liquid stocks in the market.
May 2000The JSE All Jamaican Composite Index, which includes only Jamaican companies was introduced. The two new indices gave a truer reflection and reading of the market's performance.
February 25, 1997The JSE placed its website (www.jamstockex.com) on the world wide web, opening up the market to the international financial community.
June 1, 1998A subsidiary, the Jamaica Central Securities Depository (JCSD) was established and began to formalize back office operations.
1994JSE marked 25 years of existence.
March 1993The Securities Act was passed by the Houses of Parliament and becomes effective in December 1993.
June 1969The JSE Composite Index, the market's main indicator of performance, is first calculated (100 points).
1992The Jamaican stock market was the top market surveyed by the International Finance Corporation with an index gain of 202 percent.
February 3, 1969Trading began with 34 companies listed.
August 14,1968The Jamaica Stock Exchange was incorporated as a private limited liability company.
1962First formal securities market, the Kingston Stock Market Committee, was established by Bank of Jamaica.
JAMAICA STOCK EXCHANGE YEAR BOOK 2013

8JAMAICA STOCK EXCHANGE YEAR BOOK 2013
“Providing A Fair, Efficient and Transparent Stock Market”
Best Practices
Awards 2012
The JSE Best Practices AwardsCelebrating With the Winners
Custos Steadman Fuller, presents the Governor General's Award for Excellence to Patrick Hylton - Group Managing Director, NCB. Looking on are Sandra Glasgow and Sanya Goffe, NCB Director.
JSE Corporate Highlights
The JSE Best Practices Awards were established in 2004 by the Jamaica Stock Exchange. This event, which is in its ninth year, was established to promote best practice standards for the companies listed on the Stock Exchange. In 2014 the Jamaica Stock
thExchange will be celebrating its 45 thanniversary and its 10 anniversary for
its Best Practices Awards.
The objectives of these awards are to:
1. To provide an avenue to recognize listed companies and stockbrokers, in the securities industry, who uphold best practices standards;
2. To enhance the relationship between the JSE and its stakeholders;
3. To create an awareness of the standards for best practices in the areas being adjudged.
The major award categories include: Annual Report, Website, Corporate Disclosure, Best Performing Company, the PSOJ /JSE Award for Corporate Governance and the coveted Governor General’s Award for Excellence given to the overall winner for Listed Company on the Main Market.
The Member Dealers Awards category was established two years ago to recognize Member Dealers for their contribution in developing the Capital Market and for upholding best practices standards in the process. A Junior Market category was established in 2011 for companies listed on this market.
Chairman of the Best Practices Committee is Professor Neville Ying, Executive Director of the Jamaica Diaspora Institute.
The past winners of the Governor General's Award for Excellence have been GraceKennedy (2004), Dehring, Bunting and Golding (2005), Bank of Nova Scotia (2006), Pan Caribbean Financial Services and National Commercia l Bank (2007) , Pan Caribbean Financial Services and Scotia DBG Investments (2008), National C o m m e r c i a l B a n k ( 2 0 0 9 ) , PanCaribbean (2010) and National Commercial Bank (2011 & 2012).
National Commercial Bank and Access Financial Services
Cop Prestigious Governor General Awards
National Commercial Bank (NCB) and Access Financial Services Limited
walked away with the Governor General’s Awards for Excellence for t h e M a i n a n d J u n i o r M a r ket respectively. The announcement was made at the Jamaica Stock Exchange Best Practices Awards Banquet held at the Jamaica Pegasus Hotel on Wednesday, December 4, 2013. NCB and Scotia Bank were also, declared joint winners of the JSE/PSOJ Best Practices Award for Corporate Governance. The occasion was the
thJamaica Stock Exchange's 9 Awards Banquet, where Listed Companies and Member Dealers are awarded for outstanding performances for 2012.
Mrs. Marlene Street Forrest, General Manager of the Jamaica Stock Exchange who was first at the wicket in welcoming the guests, said that in spite of the harsh economic climate, companies that establish best practices standards would be reaping the benefits now. She went on to implore companies to communicate more with t h e i r e m p l o y e e s a n d o t h e r
(Cont’d on next page)

9JAMAICA STOCK EXCHANGE YEAR BOOK 2013
“Providing A Fair, Efficient and Transparent Stock Market”
JSE Corporate Highlights
stakeholders during these difficult economic times. She further delivered a three pronged approach which companies could employ. These are:
Best Practices
Awards 2012
Define a role for the Board in communicat ing wi th the shareholders; Uncover and discuss rather than cover and dismiss subjects of p o t e n t i a l s t a k e h o l d e r s ' concerns when sending out press releases and notices, Other than through once or twice a yearly activities, carve out a space for shareholders' survey and dialogue. We are certain that you will find that the stake they have in the company is far more than the money they have invested in it.
Custos of St. Andrew Marigold Harding
presents the winning prize in the category of
JSE Member Dealers Revenue Generation & Market Activity to Kirk Brown, Asst. Manager,
Stock Brokerage Unit
Alvaro Casserly, Best Practices Committee Member and Director - JCSD presents the winning prize in the category of JSE Member Dealers Investor Relations to Ian Laidlaw, Sales Manager of Mayberry Investments Ltd.
thThe Guest Speaker for the 9 Best P r a c t i c e s A w a r d s , t h e M o s t Honourable PJ Patterson, Former Prime Minister of Jamaica, spoke on the benef i t s o f the Creat ive and Entertainment Industries, especially West Indies Cricket. The Former Prime Minister told the audience that since it has been said that West Indies Cricket belongs to the people, this should be demonstrated by the packaging and listing of the shares of West Indies Cricket Board (WICB) on the Stock Exchange, thereby allowing a wider ownership to the people of the region. He explained that this will give the common man in the street a chance to own shares in the Company and by extension, truly feel a part of West Indies Cricket. Mr. Patterson further stated that players who also had a stake in the Company would be motivated to improve their performance as they would c lear ly understand the c o n n e c t i o n b e t w e e n t h e i r performance and that of the share
price of the Company. He encouraged the Stock Exchange to have a conversation with the relevant persons as he was convinced that the opportunity and the financial impact on the region could be substantial. Professor Neville Ying, the Chairman of the Best Practices Awards was the next at the wicket. He appealed to the L i s t e d C o m p a n i e s a n d Brokerage Houses, to apply innovation and creativity to improve their business and o p e r a t i o n a l p r o c e s s e s . Professor Ying urged the companies l i sted on the Exchange to continue on this trend of excellence but more importantly companies should combine excel lence with c o n s t a n t c r e a t i v i t y a n d innovation.
It was now time for the Master of Ceremonies, Mr. Michael Anthony Cuffe, along with Miss G r e t a B o g u e s , M a n a g e r Corporate Affairs at Wray and Nephew and member of the B e s t P r a c t i c e s A w a r d s Committee to announce the winners for both Member Dealers Awards and Listed Companies Awards.
(Cont’d on next page)

10JAMAICA STOCK EXCHANGE YEAR BOOK 2013
“Providing A Fair, Efficient and Transparent Stock Market”
JSE Corporate Highlights
MEMBER DEALERS AWARDSThe able pair commenced with the Member Dealers Awards. In the category of Revenue Generation & Market Activity, the JSE recognizes Member Dealers that, during the year, traded the most value on the Exchange and part ic ipated in the JSE 's Programmes:
Sagicor Investments Ltd was the winner in this category with Mayberry Investments Ltd. and NCB Capital Markets Ltd taking first and second Runner up places respectively.
The next category to be announced was that of Investor Relations. This award recognizes the Member Dealer that; “consistently exceeds customers' expectation by providing excellent customer service.” Mayberry Investments Ltd. was declared the winner while Sagicor Investments Jamaica Ltd. and Barita Investments Ltd. were declared second and first Runner up respectively. JSE Member-Dealers Award for Best Website was next. This award is given to encourage member dealers to raise the quality and efficiency of the dissemination of information to the investing public via the website. The winner in this category was Mayberry Investments. Victoria Mutual Wealth Management Ltd. was the 2nd Runner up, with the 1st runners up being Stocks & Securities Ltd. and JMMB Securities Ltd.
The next category to be announced was the “Expansion of Investors & Listed Companies Base”. This award recognizes the Member Dealer that has “increased the number of clients in the JCSD and have listed the most companies within 2012”. The winner in
Best Practices
Awards 2012
this category was Stocks & Securities Ltd. The 2nd runner up in this category was NCB Capital Markets Ltd. and the 1st runner up position went to Mayberry Investments Ltd.
The Jamaica Stock Exchange's Member Dealers Overall Winner went to Mayberry Investments Ltd. for the third consecutive year!
Alvaro Casserly, Best Practices Committee Member and Director
st- JCSD presents the 1 runner up prize in the category of JSE Member Dealers Investor Relations to Nelson Rose, Business Development Manager of Barita Investments Ltd.
It was now time for the Best Practices Awards 2012 for Listed Companies to be announced. This year both Junior Market and Main Market companies were recognized.
The first award in this category was the presentation of the Best Practices - Annual Report Award for Junior & Main Markets Listed Companies. This award is given to encourage publicly listed companies to produce clearer,
LISTED COMPANIES AWARDS
more reader-friendly annual reports and to provide greater insight into the c o m p a n i e s ' f i n a n c i a l a f fa i r s , governance practices and business activities.
Junior Market: In this category the winner was General Accident Insurance Company while the second and first runner up positions went to KLE Group and Dolphin Cove respectively.
Main Market: National Commercial Bank Jamaica Ltd. was the winner while the second and first Runner up positions went to Scotia Group Jamaica and Sag icor Investments Ltd . respectively.
Best Performing Company Award seeks to identify and recognize outstanding performance by listed companies in enhancing shareholder value in the areas of capital efficiency, profitability and direct return on shareholdings.
(Cont’d on next page)

11JAMAICA STOCK EXCHANGE YEAR BOOK 2013
“Providing A Fair, Efficient and Transparent Stock Market”
JSE Corporate Highlights
Winners in the Junior and Main Market categories were:
Best Practices
Awards 2012
Junior Market - Access Financial Services Ltd. emerged the winner while second and first runners up were Lasco Financial Services Ltd and Cargo Handlers .
Main Market - The winner was Carreras Ltd. for the second consecutive year! First and second Runner up positions went to Kingston Properties Ltd. and Supreme Ventures Ltd. Respectively.
Corporate Disclosure & Investor Relations award serves to recognize companies that maintain good investor relations with the wider investing public and make timely and accurate reports and announcements to the JSE. The winners were:
Junior Market - Honey Bun Ltd.
Main Market - the Winner was stSagicor Investments Ltd. The 1
ndand 2 Runner up positions went to GraceKennedy Ltd. and National Commercial Bank Jamaica respectively.
Member Dealer Awards
Alicia Hussey, Best Practices
Committee Member presents ndthe 2 runner up prize in the
category of JSE Member
Dealers Website to Devon
Barrett, General Manager of
Victoria Mutual Wealth
Management Ltd (VMWM)
and Nicole Thompson,
Manager - Research &
Stockbroking - VMWM .
Nsombi Jaja, Best
Practices Committee ndMember presents the 2
runner up prize in the
category of JSE Member
Dealers Expansion of
Investors & Listed
Companies Base to
Tracey Ann Spence, Asst
Vice President - NCB
Capital Markets Ltd.
The Best Practices Website Award seeks to encourage listed companies to raise the quality and efficiency of the dissemination of information to the investing public via their websites.
Junior Market - These awards were handed out as usual with Access Financial Services Ltd.
st nddeclared the winner. 1 and 2 Runner up positions were Lasco Distr ibutors and General Accident Insurance Jamaica Ltd. respectively.
(Cont’d on next page)

12JAMAICA STOCK EXCHANGE YEAR BOOK 2013
“Providing A Fair, Efficient and Transparent Stock Market”
JSE Corporate Highlights
Member Dealer Awards
Marlene Street Forrest, General Manager JSE presents the JSE Member Dealers Overall Winner to Gary Peart, Chief Executive Officer Mayberry Investments Ltd.
Donovan Perkins, Chairman-JSE
ndpresents the 2 runner up prize in the
category of Best Performing Company
Main Market to Lorna Gooden,
Corporate Secretary, Supreme Ventures
Ltd.
Donovan Perkins, Chairman-JSE presents
the winning prize in the category of Best
Performing Company Main Market to Marcus Steele,
Managing Director, Carreras Ltd.
Best Practices
Awards 2012
Main Market - Jamaica Money Markets Brokers was the winner. First and second place Runner up positions went to Carreras Limited and National Commercial Bank Jamaica Ltd. Respectively.
The penultimate award was the PSOJ/JSE Corporate Governance Award which seeks to recognize companies that demonstrate and practice outstanding corporate governance. National Commercial Bank and Scotia Group Jamaica emerged the joint winners. The first runner up was Sagicor Investments Ltd and second runner up was Jamaica Money Markets Brokers, followed by the 1st Runner up - Sag icor Investments Ltd. In the end, the JSE's Junior Market Overall Best Practices Award went to Access Financial Services Limited. The company to walk away with Governor General's Award for Excellence and the overall winner of the competition was National Commercial Bank Jamaica Ltd.

13JAMAICA STOCK EXCHANGE YEAR BOOK 2013

14JAMAICA STOCK EXCHANGE YEAR BOOK 2013
“Providing A Fair, Efficient and Transparent Stock Market”
(Cont’d on next page)
GENERAL MANAGER'S REPORT - JSE
Mrs. Marlene Street Forrest General Manager Jamaica Stock Exchange
he Year 2013 was as challenging as it was rewarding for the Jamaica Stock Exchange Group which is comprised of the JSE (Exchange) and its wholly owned subsidiary, the Jamaica Central Securities Depository. The challenges experienced centered on the continued
difficult economic climate which affected confidence and optimism of not only the investing public but companies listed on the Exchange and potential listed companies. The need to secure an agreement with the International Monetary Fund directly affected our Junior Market during the period, as the government grappled with the issues of tax reforms and the likely changes to the incentives that would possibly affect the current or prospective Junior Market companies. Consequently both primary and secondary market activities slowed significantly, impacting trading revenue and listing fees. Interest income declined due to the Group's participation in the National Debt Exchange (NDX) which resulted in a reduction in the rate of interest on investments and a lengthening of the maturity period of the securities held. Fortunately, the decline was offset by foreign exchange gain brought about by the devaluation of the Jamaican dollar.
Prior years' revenue diversification programmes yielded positive results as the Group's profit of $7.2 million for the year resulted from the performance of the JCSD Trustee Services which returned a profit of $16.2 million. The Exchange continued to pursue its strategic objectives during the year and was successful in listing its ordinary shares on the market, which provided the original shareholders with an opportunity to monetize their investments and the new shareholders with an opportunity to invest in a group which has positive long term prospects. We welcome all new shareholders on board and encourage you to grow with us.
T
The Group itself continues to take the long view in respect to the achievement of market growth and profitability and has continued to work towards the development of products and services aimed at creating positive value for our shareholders. On-going activities centre on the upgrades and enhancement of trading and settlement platforms to ensure efficiency of market delivery and upgrades of other supporting systems to assist in regulatory and compliance activities. Of equal importance is the continued effort to increase market knowledge and participation through different programmes and avenues of contact with the public. We were successful in our efforts in developing a detailed business continuity programme and are pursuing avenues to ensure that the Group has the capacity to be responsive.

15JAMAICA STOCK EXCHANGE YEAR BOOK 2013
“Providing A Fair, Efficient and Transparent Stock Market”
(Cont’d on next page)
GENERAL MANAGER'S REPORT - JSE
Globally, while most stock markets rallied in 2013, of seventy-six countries around the world which were examined, only sixteen countries, including Jamaica, showed declines in their indices. Jamaica posted a decline of 12.59% in the main index. The third quarter 2013 Business and Consumer Confidence Indices Survey released by the Jamaica Conference Board of the Jamaica Chamber of Commerce reported that business and consumer confidence were at an all-time low and registered mainly negative outlook in respect to economic improvements. This reflected the decline in index use for 2013, the low cess fee income and other operating revenue and contributed to the loss of $9 million experienced by the Exchange. It is an established fact that the business environment in which the Jamaica Stock Exchange, or any other stock exchange, operates directly affects the results of operations and ours was so affected.
Uncertainties about employment, the stability of the Jamaican dollar relative to the US dollar and other hard currencies, inflation and the delay in the signing of the IMF agreement negatively impacted on business and individual decisions to invest for the long-term.
ENVIRONMENTAL FACTORS
It is anticipated that 2014 will be another challenging year. While some confidence will return given the signing of an IMF agreement, this is accompanied by very strict adherence to sustainable economic policies and targets set by the government, which could still have a contractionary effect on the market. We wish to record our appreciation to the government for its confidence in the equities market which is demonstrated by their continued support of the Junior Market and their encouragement which has lit awareness in small and medium sized companies of the importance of equity financing, especially in our current economic environment.
During the year under review, the stock market realized mixed results as all JSE Main Market Indices reflected declines while the Junior Market Index and the JSE USD Equities Market Index reflected improvements. The JSE Main Index dropped 12.45% to close the year at 80,633.55 points. The capitalization of the main market also reflected a fall which resulted from the overall decline in the stock prices and the delisting of Lascelles deMercado & Company Limited. The latter contributed 6.4% to this decline. On the
JSE MARKET PERFORMANCE IN 2013
We believe that several opportunities exist to grow the market and to enable the Group to achieve profitability. As more business opportunities are opened up the Exchange will benefit from businesses seeking to raise capital. Our trading and settlement platforms can be leveraged for the trading of products such as futures and options, closed end funds, depository receipts and fixed income trading. With the latter, it is expected that more corporate bonds will be listed on the bonds market and that the US$ Denominated Securities Market will experience more buoyancy within 2014. There will be a positive spin-off arising from legislative and regulatory changes in areas such as Collective Investment Schemes from which we are certain the Group will benefit in providing registrar and trustee services.
OPPORTUNITIES
other hand, the JSE Junior Market Index advanced by 17% to close 2013 at 757.86 points. The market capitalization of the Junior Market increased by $5.29 billion as a result of the general increases in stock prices and the listing of the ordinary shares by five companies. Likewise, the JSE USD Equities Market recorded improvements for both the index and market capitalization of 36.8% respectively.
The mixed performance of the market resulted in significantly reduced revenue from trading and trading activities.
The JSE relies heavily on the technological infrastructure and employees' competence to deliver high quality products and services to the market. The Group's technology unit continues to support the business by ensuring that the IT infrastructure is current and will allow the Exchange to operationalize its business strategies and expand its service portfolio.
During the year 2013, we experienced no significant downtime that impacted the systems and markets operated efficiently each business day. We continue to ensure the delivery of a reliable IT Strategy that will enable the JSE to take advantage of emerging trends and technology.
We have made significant progress in this area and have achieved several successes.
JSE DEPARTMENTAL HIGHLIGHTS 2013Trading & Settlement Platforms

16JAMAICA STOCK EXCHANGE YEAR BOOK 2013
“Providing A Fair, Efficient and Transparent Stock Market”
(Cont’d on next page)
GENERAL MANAGER'S REPORT - JSE
1. Implementation of a Business Process and Document Management System2. Completion of the Business Continuity Planning Program3. Implementation of a new telephone system4. Continuing activities for the implementation of an Online Trading System5. Commencement of activities for the implementation of a new website, including mobile apps6. Replacing obsolete computers across the group; the initiative continues7. Commencement of activities geared towards improving / upgrading supporting systems
The Group's technology unit continues the journey of ensuring we keep current relevant areas of the IT infrastructure. We have made significant progress in this area to ensure that the organization's strategic objectives are met.
In the area of Risk Management and Compliance we continue to enhance and maintain system redundancies which allows for 100% availability during business hours. Our risk management policies and procedures ensure that we are compliant with established policies and international standards geared towards ensuring compliance through continued audits.
Our team remains committed to the initiatives to be achieved in 2013 and will continue to expand its capacity to ensure that the Group takes advantage of market opportunities through the utilization of efficient and effective use of technology.
We had another successful year delivering on our objectives to keep the market abreast of new changes in the market place and offering our workshops and campus aimed at fostering continuing professional education. Driven by data received from the JCSD, our outreach and the listing of more companies on the market, the Group was able to increase the number of accounts/investors by 5,431, a 5% increase over 2012 .
The Exchange utilizes various approaches to reach investors or potential investors. Some of the programmes that we engage in are as outlined:
Marketing Activities
Tapping into the Diaspora market to grow the investor base is an area of focus for the Exchange. The involvement of the Exchange in the Diaspora Conference held in Montego Bay provided the Company with the much needed medium to connect with well over 300 delegates from the Diaspora and others who attended the Conference.
Diaspora Conference 2013
This website based simulation game allows students to buy and sell stocks traded on the JSE Stock Market. Calabar High School defended their title for the fourth consecutive season while Kingston College placed second and Innswood High placed third. The Individual winners were Damorine Ellis, first place; Jason Hylton, second place, both from Calabar High, and in third place Trevaune Baker from Kingston College.
Capital Market Conference The event is a unique forum for all constituents of the financial services sector to exchange views and develop strategies for engineering an environment to foster successful growth of the region's capital markets. In the past eight years, this Conference has attracted decision-makers, CEOs, accountants, attorneys-at-law and other business professionals from different industries from Jamaica and across the Caribbean. The 2013 Conference saw just under 300 persons in attendance.
Stock Market Game
This competition is designed to respond to the need to improve the level of market analysis. For every quarter of the year, the JSE invites analysts from the securities industry,
Market Research Competition
Successful initiatives during 2013 which continue into 2014 were:
Mrs. Marlene Street Forrest, General Manager – JSE, held the attention of two visitors to the JSE's booth while Director, Mr. Mark Croskery looks on.

17JAMAICA STOCK EXCHANGE YEAR BOOK 2013
“Providing A Fair, Efficient and Transparent Stock Market”
(Cont’d on next page)
GENERAL MANAGER'S REPORT - JSE
· The role & functions of the Stock Market· The importance of savings & investments· Investing using stocks and · The importance of financial literacy
In 2013, over 60 high schools and tertiary institutions visited the Stock Exchange to glean more information on the investments in general and the Stock Market. Thirty three percent more schools attended for the year 2013 as compared to the previous year.
Workshops
The JSE's workshops provide a medium to create an intensive educational experience in a seminar setting. Participants in these workshops are usually Listed Companies, Member Dealers and persons in the related field from which the topic is chosen. The JSE's workshops seek to introduce new concepts and to spur participants to investigate further on their own. These workshops also help to demonstrate and encourage practical and current techniques designed to keep participants abreast of the latest trends and for them to take back to their business places.
The six workshops held in 2013 are as follows:
1. The Fundamentals of Risk Management 2. Corporate Secretary3. Combating Financial Fraud 4. Impact Investments5. Business Pre & Post Disaster Planning6. Analysing and Interpreting Balance Sheet
There were over 180 persons trained from various companies across Jamaica.
JSE's Public Investor Outreach
The Jamaica Stock Exchange (JSE) continues to reshape the financial landscape with our informative and engaging Public Awareness Programmes. The JSE aims to transform how people view the stock market by enabling them to embrace the stock market as a viable medium for wealth creation. Based on our success to date, the JSE will continue to host our branded Public Education Outreach Forum. In 2013 the JSE partnered with JMMB to host four outreaches across Jamaica; one was held in Mandeville, another in St. Ann and two in Kingston. There were over 700 persons in attendance at our Public Education Outreaches.
The JSE offers an exciting 20-minute presentation geared towards employees in the Jamaican workforce. The aim of the programme is to present simple and concise information about how the stock market works to benefit Jamaicans.
In 2013 the Stock Exchange visited 26 institutions, up from 24 the previous year. The emphasis was on the public sector workers who responded very positively to the information provided.
Corporate Outreach
thThe Jamaica Stock Exchange hosted its 6 National Investor Education Week from September 29 - October 3, 2013. We continue to push this agenda as we are aware that it is through financial knowledge that individuals will be able to make wiser financial decisions. The focus of the discussions
National Investor Education Week
The JSE continues its drive towards exposing high school students, who are pursuing the CSEC and CAPE exams, to the roles and functions of the Stock Exchange, and to allow students to develop an appreciation for investments. In summary, the programme aims to introduce students from an early age to:
High School Education Programme
tertiary institutions and the media to submit analyses based on the past performance and future expectations of listed companies. Participants conduct research, prepare and submit an analysis on the selected company using the JSE's prescribed format. The winner of the 2013 competition was NCB Capital Markets Limited.
Mr. Damion Topping, JSE's Technical Support/Web Maintenance Officer, presents a gift basket to a visitor of JSE's booth.

18JAMAICA STOCK EXCHANGE YEAR BOOK 2013
“Providing A Fair, Efficient and Transparent Stock Market”
(Cont’d on next page)
GENERAL MANAGER'S REPORT - JSE
1. The Stock Market Review2. The Pocket Book3. The Year Book 4. A Guide to the Jamaican Securities Markets5. The JSE Annual Report
National Commercial Bank received the Governor General’s Award for Excellence on the Main Market and was declared joint winners with Scotia Bank for the JSE/PSOJ Best Practices Award for Corporate Governance. Honey Bun received the Governor General’s Award for Excellence for the Junior Market.
Publications
The Exchange publishes a number of publications aimed at assisting investors, potential investors and the investment community to make more informed decisions and generally to provide market updates. These publications are:
e-Campus
The (JSE) e-Campus in 2013 became the first in the English-speaking Caribbean to be officially certified by the prestigious CPD Certification Service based in London, England to join organizations such as the London Stock Exchange, Imperial College London, Kings College London, London School of Economics & Political Science, UBS Global Asset Management, amongst others. This certification comes on the heels of our Jamaican local financial sector regulator, the Financial Services Commission (FSC), approving the JSE e-Campus Post Graduate Diploma in Financial Services Management and Certificate Courses. The JSE e-Campus was also registered by the University
Council of Jamaica (UCJ) as a tertiary institution to develop and deliver courses and programmes geared to the Financial Services industry.
The Post Graduate Certificate Course “Understanding and
Interpreting Jamaica's Financial Regulations and Laws” has
been accredited by the Accreditation Committee of the
General Legal Council of Jamaica. This means all attorneys
who pursue this Course will receive eight (8) Continuing
Legal Professional Development (CPL) credits from the
General Legal Council.
Our internal controls and procedures have improved following our decision to outsource our internal audit function to PriceWaterHouseCoopers. The JSE continues to take on board the recommendations of our auditors and our response time for implementation has been excellent. The responsiveness of our team will lend itself to further gains in respect to efficiencies and controls.
HUMAN RESOURCES
INTERNAL AUDIT
A strategic priority of the Group is that of ensuring a moti-
vated and prepared workforce. The JSE Group continues to
invest in various training and development programmes to
facilitate staff advancement and development. The
members participated in workshops, seminars in both
operational support and other courses specific to their
respective areas of responsibility. We continue to benefit
from a culture of employee involvement and a structured
performance and appraisal system. In 2013 we
concentrated on improving our succession planning
programme as well as the software to support human
resources management information.
In 2014, the JSE's primary main objective is that of increasing shareholder value. This we intend to do through focusing on the following:
FOCUS - 2014
· Further diversification of revenue stream. Capitalizing on market opportunities by providing new products and services· Increasing Investor & Business Awareness of the Markets· Development of Stock Market mobile application
is on individuals obtaining a broader understanding of the role and responsibilities of regulatory bodies, companies and investors in ensuring that the financial sector delivers on its objective of wealth creation.
The JSE Best Practices Awards were established in 2004 by the Jamaica Stock Exchange as a medium to encourage listed companies and stockbrokers in the securities industry to adopt and uphold best practices standards and to enhance the relationship between the JSE and its stakeholders. The JSE has over the years refined these awards and has added several new awards since its inception. Chief among these are:
Best Practices Awards
Junior Market Awards in 2012The Member Dealers Awards category in 2011The PSOJ Award for Corporate Governance in 2008

19JAMAICA STOCK EXCHANGE YEAR BOOK 2013
“Providing A Fair, Efficient and Transparent Stock Market”
GENERAL MANAGER'S REPORT - JSE
………………………………..........................……….Marlene J. Street ForrestGeneral Manager, JSE
the long-term viability of the Exchange. Further, our dedicated employees must be commended as, despite the tough economic climate and sometimes limited resources and another challenging year, they did not under-deliver but were able to develop new products, energize old ones and just simply maintain them. The enthusiasm was always on display whether to our internal or external customers. Many thanks to the members of the Board and the Committees who continue to play their part in ensuring that the strategies and the underlying fabric of the Group is current, modern and appropriate and that the Exchange continues to uphold good governance practices.
We are committed to remaining relevant to our shareholders, listed companies, member dealers and other market participants. The team stands ready to continue to deliver on the promise of 'providing a fair, efficient and transparent market'.
· Enhancement of Disaster Recovery & Business Continuity capabilities· Improvement in our website· Improvements in our internal capabilities and infrastructure for better service delivery
Our team is committed to continuing the thrust to implement solutions that are geared towards allowing the JSE and its subsidiaries to take advantage of market opportunities which will increase revenue, improve customer service and restore profitability. An increase in the Return on Equity, efficient utilization of assets and cost effective regulation of the market as well as maximizing the Group's investment portfolio will be the major areas of focus. This was our commitment to you last year and we continue to work towards improvements and realizing our goal.
Finally I wish to take this opportunity to thank our new shareholders who, through the acceptance of our initial public offering of ordinary shares, expressed confidence in

20JAMAICA STOCK EXCHANGE YEAR BOOK 2013
“Providing A Fair, Efficient and Transparent Stock Market”
(Cont’d on next page)
RESPONSIBILITYCORPORATE SOCIAL
The JSE Group
The JSE continues to recognize the importance of Corporate Social Responsibility. The Exchange focus was on the aged, young adults and the children and concentrated on the immediate community of downtown Kingston and i ts environs.
The JSE started its Breakfast Programme at St. Michael's
Primary School in 2011 to assist the students to have a meal
at the start of their day in order to increase attendance,
punctuality and assist in the general health of the school
population. The JSE realized at the time that there was a
need for this programme, as many parents could not afford
to provide a proper meal for their children in order to send
them to school on a consistent basis. The poor attendance
led to a decline in the level of academic achievement.
The Breakfast Progamme at the St. Michael's Primary School
was implemented with the blessing of the former late
principal and to date it is meeting the objectives of
improvement in attendance, punctuality and academic
achievement of the students.
Additionally, the JSE contributes to other programmes in St.
Michael's and St. Aloysius Primary Schools. These include
“Teacher Recognition” and “Boys' Day”. In support of the
Boys' Day campaign for inner-city youths, the JSE awarded
one scholarship to a male student who was successful at the
GSAT level at St. Aloysius Primary School, while recognizing
the boys' achievements at St. Michael's Primary.
Our youth programme focused on education
YOUTH OUTREACH
ELDERLY OUTREACH The JSE over the years has built a very close relationship with
the Missionaries of the Poor through its founder, Father
Richard Ho Lung. Through the visit by our staff to the
facilities which house and care for the poor and destitute
and by our monetary contributions, the Company seeks to
play its part in improving the social fabric of the country.
Miss Davia Eastman, JSE's Marketing Officer (l) and Mrs. Charlette Eddie Nugent, JSE's Communications Officer (r) congratulate Jobey Smith – who was awarded JSE's GSAT Scholarship in recognition of St. Aloysius Primary School 'Boy Day '.

21JAMAICA STOCK EXCHANGE YEAR BOOK 2013
“Providing A Fair, Efficient and Transparent Stock Market”
RESPONSIBILITYCORPORATE SOCIAL
The JSE also provides needed assistance to the Denham
Town Golden Age Home, an institution that takes care of the
elderly within our society. The employees make periodic
visits to the institution and both company and staff make
well needed contributions in cash and kind to ensure that
the lives of these senior citizens are made easier.
Mrs. Marlene Street Forrest (first left standing) and JSE/JCSD staff members at their visit to the Denham Town Golden Age Home. Residents of the home were presented with items donated by JSE/JCSD staff, Blue Power Group and Jamaican Teas. A very happy Resident receives a package
from JSE/JCSD staff members.
Mrs. Marlene Street Forrest, General Manager, Jamaica Stock Exchange, presents the manager of Denham Town Golden Age Home with a package from Jamaican Teas, while residents look on during the JSE/JCSD courtesy call
For over 15 years the Company has supported students at
the tertiary level in completing their courses of studies in
the field of Business. This is accomplished by providing the
Vernon Mendez Scholarship to well deserving students at
the University of the West Indies and University of
Technology.
Our Contribution to Nation Building, Through Young Adult Education

22JAMAICA STOCK EXCHANGE YEAR BOOK 2013
“Providing A Fair, Efficient and Transparent Stock Market”
Mr. Wentworth Graham Chief Regulatory Officer
(Cont’d on next page)
The Regulatory & Market Oversight Division
2013 Year In Review of JSE's Regulatory Activities
2013 represents another year during which the Regulatory & Market Oversight
Division (RMOD) of the Jamaica Stock Exchange (JSE) continued to shoulder the
responsibility of providing suitable regulatory oversight of the Exchange's
activities.
During the course of the year the RMOD fulfilled its responsibilities with
supervision and policy directive from the Regulatory and Market Oversight
Committee (RMOC). As you may recall in last quarter of 2007 the Board of the JSE
ceded its regulatory authority to the RMOC; and, in the first quarter of 2008 the
RMOD was formed as a new unit within the JSE to undertake the operational
activities of the RMOC.
In attending to the regulatory activities of the JSE the RMOD focuses on six (6) core
responsibilities; these are as follows:
The RMOD's Operational Responsibilities
Introduction
1. Listed Company Compliance2. Member-firm Regulation3. Market Surveillance4. Enforcement5. Dispute Resolution/Arbitration6. Risk Assessment
Before detailing the performance activities of the RMOD's core responsibilities for
the 2013 calendar year, it is appropriate to mention that during the course of the
year efforts were made to further streamline the Division's operational activities
to provide clearer accounts of the activities within the unit.
1. Listed Company Compliance
In satisfying Listed Company Compliance the RMOD reviews Listed Companies'
financial statements and Corporate News that are filed with the JSE. In 2013 the
RMOD processed two hundred and sixty-four (264) financial statements versus
two hundred and forty-eight (248) in 2012. As it relates to Corporate News, for
the year 2013 the RMOD reviewed one thousand and thirty eight (1,038)
submissions; in 2012 total Corporate News reviewed was five hundred and
seventeen (517). The increase in reviews in 2013 over 2012 was as a result of
additional securities that were listed JSE during 2013.
2. Member Firm Regulation
The RMOD's Member-firm Regulation treats with the examination of member-
firms' financial statements and examination of member-firms' trading operations.
During 2013 the RMOD examined One Hundred and Eighty eight (188) financial
RMOD's 2013 Operational Performance

23JAMAICA STOCK EXCHANGE YEAR BOOK 2013
“Providing A Fair, Efficient and Transparent Stock Market”
The Regulatory & Market Oversight Division
2013 Year In Review of JSE's Regulatory Activities
statements for member-firms. These statements included
Monthly, Quarterly and Audited Statements. In 2012 the
number of statements reviewed amounted to One Hundred
& Eighty Seven (187). In addition to the foregoing it should
be noted that during the course of the year the RMOD
complemented its member-firm regulation by applying off-
site monitoring tools which involves examining member-
firms' daily trading activities on the JSE.
3. Market Surveillance
The responsibility of Market Surveillance activities spans
monitoring daily trading on the JSE to detect market
infractions, such as: Advancing the Bid, Marking the Close,”
Pumping and Dumping, among others. The RMOD
represents its Market Surveillance Activities through the
formulation of Exception Reports. During the course of
2013 the RMOD formulated Eighteen (18) Exception
Reports; in 2012 Exception Reports amounted to nine (9)
4. Enforcement
The RMOD is required to administer enforcement actions
against member-dealers and listed companies whenever
there are breaches to JSE's rules and market regulations.
During the course of the year the RMOD administered
thirteen (13) enforcement actions against member-dealers
and twenty-eight (28) against Listed Companies. In 2012
the number of enforcement actions that were taken against
member-dealers and Listed Companies were seven (7) and
two (2), respectively.
5. Dispute Resolution/Arbitration
For the year 2013 the JSE had no matter that was considered
under its Dispute Resolution/Arbitration operation. During
the course of 2012 the RMOD administered one (1) matter
through its Dispute Resolution/Arbitration process.
Closing Comments
As mentioned in my opening remarks, the year under review
represented one during which the RMOD was called upon to
continue satisfying JSE's role as being a self-regulatory
organization. It is recognized that the RMOD's activities is a
subset of the overall policy and operational activities of the
JSE Group. In this regard, I wish to express gratitude to
members of the RMOC, staff of the RMOD and of wider JSE,
as well as supportive stakeholders for the collective
contribution to the regulatory affairs of the Exchange.
Having reflected on 2013 activities, it can be safely stated
that support from within, and external to the JSE, has once
again made it possible for the RMOD to satisfy its motto of
“Safeguarding market integrity,” while contributing JSE's
purpose of “Providing a fair, efficient and transparent stock
market” to all.
6. Risk Assessment
In treating with risk assessment the RMOD continued to rely
on the activities of JSE's Internal Auditors. For the year
under review JSE's Internal Auditors conducted one (1)
assessment of RMOD's operations. The Auditors also did
one (1) assessment of the Division’s operations in 2012.

The Jamaica Stock Exchange
STOCK MARKET REVIEW 2013Economic Overview
In May 2013 the government of Jamaica was able to arrive at an agreement with the International Monetary Fund (IMF) by way of a
four-year Extended Fund Facility. This agreement opened the door to loans to the tune of approximately US$1 billion from the IMF
and another US$1 billion from the Inter-American Development Bank and the World Bank. As a condition of the agreement, the
government had to meet quantitative and qualitative fiscal and legislative targets under the close supervision of the IMF.
The IMF agreement was preceded by the second debt exchange programme in three years. This essentially meant the extension of the maturity dates on local debt, accompanied by lower interest rates with the ultimate objective of giving the government more wiggle room for fiscal manoeuvres.
So far, the government has met all the necessary quantitative and qualitative targets under the extended fund facility with the IMF over the last three quarters of the fiscal year 2013/2014.
This was against the background of the challenging economic conditions and social ills such as crime that prevailed.
The JMD closed the year 2013 at $106.3777:US$1.00. This reflects a decline of 14.41% or $13.40 against the USD. This was also a faster pace of depreciation than the 7.36% seen in 2012 where the dollar closed at J$92.9776:US$1.00.
The net international reserves (NIR) stood at US$1,047.83 million at the end of 2013 relative to US$1,125.58 at the end of December 2012. Although lower than what was recorded in the corresponding period of the previous year, the NIR showed improvements from the lowest level for the year of US$835.69 million in November 2013.
For the calendar year 2013 the rate of inflation was 9.7%, up 1.7% on the 8.0% recorded at the end of 2012.
Treasury Bill yields were mixed when the month of December 2013 was compared to the month of December 2012. The 28-days
and 90-days Treasury bill results showed average yields of 6.25% and 7.53% down from 6.31% and 7.67% in December 2012. On the
other hand, the 180-days Treasury bill showed an average yield of 8.25% in December 2013, up from 7.18% in December 2012.
The labour force data for October 2013, the most recent data, showed an unemployment rate of 14.9% compared to 14.0% in October 2012.
Nevertheless, towards the end of the calendar year there seemed to be signs of improvement in the economy. The Jamaican economy grew by 0.5% in the third quarter of 2013 with a growth of 2.2% and 0.1% in the goods producing and services sectors respectively. This reflects a turnaround after six consecutive quarterly declines.
Index Value 2013 points Value 2012 points Change % Change
Main JSE Index 80,633.55 92,101.22 11,467.67 12.45%
All Jamaican Composite Index 81,850.04 91,161.60 9,311.56 10.21%
JSE Select Index 2,176.17 2,489.67 313.50 12.59%
JSE Cross Listed Index 740.28
873.93
133.65 15.29%
JSE Combined Index 82,934.95
93,503.79
10,568.84 11.30%
Junior Market Index 757.86
647.78
110.08 16.99%
JSE USD Equities Market Index
92.86
67.86
25.00 36.84%
Continued on page
24JAMAICA STOCK EXCHANGE YEAR BOOK 2013

Continued on page 26
STOCK MARKET REVIEW 2013
All the Main Market indices showed declines for the year 2013. The Main JSE index declined by 11,467.67 points or 12.45% to close
at 80,633.55 points. The All Jamaican Composite index and the JSE Select index lost 9,311.56 points (10.21%) and 313.50 points
(12.59%) to close at 81,850.01 points and 2,176.17 points respectively. At the same time, the JSE Combined index and the JSE Cross
Listed index showed declines of 10,568.84 points (11.30%) and 133.65 points (15.29%) to close at 82,924.95 points and 740.28
points respectively.
The Junior Market index showed an improvement on the year 2012 gaining 110.08 points (16.99%) to close 2013 at 757.86 points.
Similarly, the JSE USD Equities Market index advanced at the end of 2013 relative to 2012. The USD index gained 25.00 points or 36.84% to close at 92.86 points.
Graph 1
Graph 1 shows the performance of the JSE Main Market index
in 2013 vs 2012.
Graph 2
Graph 2 shows the performance of the JSE Junior Market
index in 2013 vs 2012.
Decem
ber
Continued from page 24
Graph 3
Graph 3 shows the performance of the JSE USD Market index
in 2013 vs 2012.
25JAMAICA STOCK EXCHANGE YEAR BOOK 2013
STOCK MARKET REVIEW 2013
Indices Highest Value Lowest Value Largest One month gain Largest One Month decline
Largest one day gain
Largest one day decline
JSE Index 92,435.27 points on
January 4, 2013
77,001.06 points on
November 20, 2013
4.91% (4,101.54 points) in May 2013 closing
the month at 87,577.92 points.
5.69% (5,069.79 points) in February
2013 to close
the month
at 84,048.93
2.15% (1,716.09 points) on April
5, 2013
to close at 81,579.81
points
4.05% (3,322.47 points) on
November 8, 2013
to close
at 78,679.41 points
JSE All Jamaican
Composite Index
91,721.24 points on
January 4, 2013
75,674.02 points on
November 20, 2013
8.00% (6,548.19 points) in May 2013 closing
the month at 88,443.29 points
8.81% (7,580.22 points) in February
2013 closing the month at 78,414.03
3.88% (3,021.18 points) on April
5, 2013
to close at 80,798.12
points
3.28% (2,699.13 points) on
February 12, 2013
to close
at 79,612.84 points
JSE Select Index 2,530.76 points on June
14, 2013
2,064.73 points on
November 20, 2013
8.21% (184.65 points) in May 2013 closing
the month at 2,434.58 points
7.70% (179.46 points) in February 2013
closing
the month
at 2,152.15 points.
4.48% (95.08 points) on April 5,
2013 closing at 2,219.75 points
3.75% (83.66 points) on
February 12, 2013 closing
at 2,146.64 points
JSE Cross Listed Index 873.93 points on
January 2, 2013
738.46 points on November
8, 2013
1.03% (8.29 points) in May 2013 closing
the
month at 810.31 points
6.96% (55.27 points) in November 2013
closing the month at 738.46 points
3.57% (27.64 points) on April
15, 2013 closing at 802.02
points
0.01%
on June 26, 2013 and
November
12, 2013 closing
at 799.86 and 738.51 points
respectively
JSE Combined Index 93,830.20 points on
January 4, 2013
79,097.88 points on
November 20, 2013
5.66% (4,806.77 points) in May 2013 closing
the month at 89,724.01 points.
5.69% (5,149.26 points) in February
2013 to close the month at 85,338.79
points.
2.03% (1,652.86 points) on April
5, 2013 to close at 83,041.81
points
3.87% (3,254.17 points) on
November 8, 20 13 to close
at 80,833.69 points
JSE Junior Market
Index
840.18 points on July 9,
2013
584.67 points on March 7,
2013
23.13% (142.75 points) in May 2013 closing
the month at 759.93 points.
5.73% (36.04 points) in February 2013
to close the month at 592.48 points.
5.47% (34.36 points) on May
15, 2013 to close at 662.80
points.
3.08% (24.05 points) on
October 8, 2013 to close at
755.53 points
JSE USD Index 92.86 points on
December 27, 2013
65 points on February 11,
2013
8.34% (7.15 points) in December 2013 to
close the month at 92.86.
There was no month over month
decline in the USD market index in 2013
9.78% (7 points) on March 22,
2013 to close at 78.57 points
8.91% (7 points) on March
20, 2013 to close at 71.57
points.
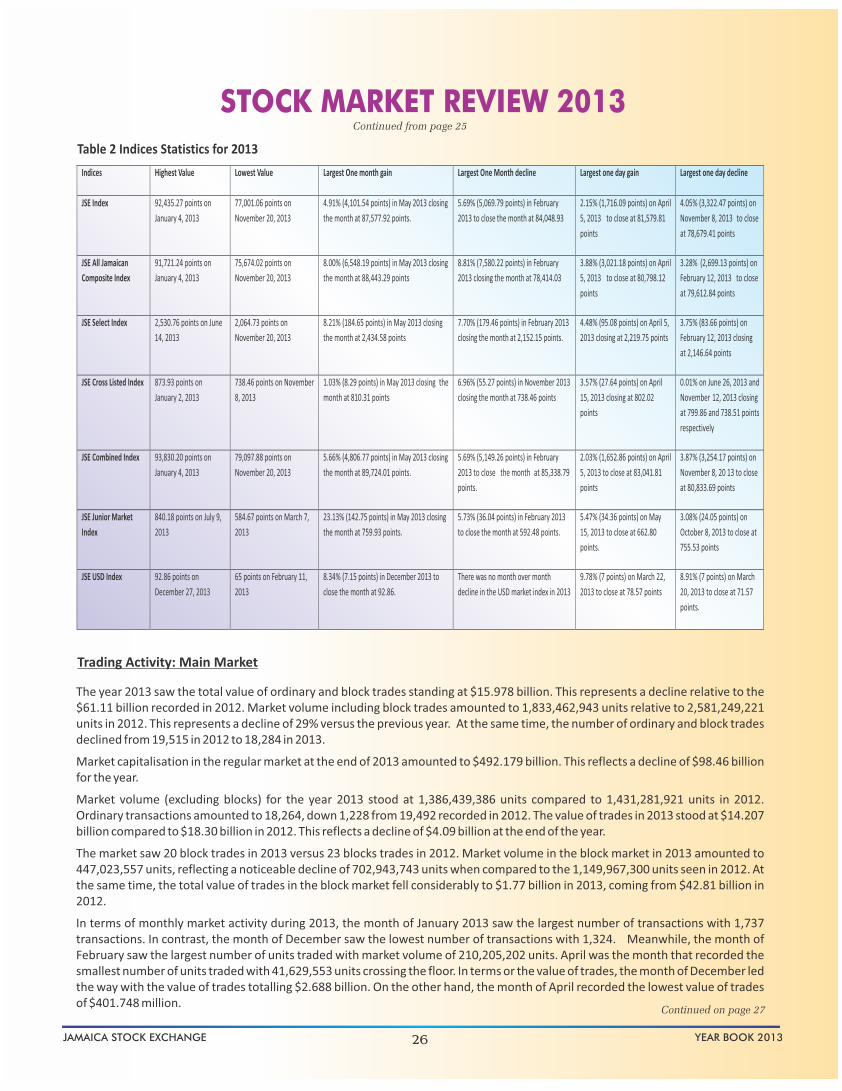
Table 2 Indices Statistics for 2013
Continued from page 25
The year 2013 saw the total value of ordinary and block trades standing at $15.978 billion. This represents a decline relative to the $61.11 billion recorded in 2012. Market volume including block trades amounted to 1,833,462,943 units relative to 2,581,249,221 units in 2012. This represents a decline of 29% versus the previous year. At the same time, the number of ordinary and block trades declined from 19,515 in 2012 to 18,284 in 2013.
Market capitalisation in the regular market at the end of 2013 amounted to $492.179 billion. This reflects a decline of $98.46 billion for the year.
Market volume (excluding blocks) for the year 2013 stood at 1,386,439,386 units compared to 1,431,281,921 units in 2012. Ordinary transactions amounted to 18,264, down 1,228 from 19,492 recorded in 2012. The value of trades in 2013 stood at $14.207 billion compared to $18.30 billion in 2012. This reflects a decline of $4.09 billion at the end of the year.
The market saw 20 block trades in 2013 versus 23 blocks trades in 2012. Market volume in the block market in 2013 amounted to 447,023,557 units, reflecting a noticeable decline of 702,943,743 units when compared to the 1,149,967,300 units seen in 2012. At the same time, the total value of trades in the block market fell considerably to $1.77 billion in 2013, coming from $42.81 billion in 2012.
In terms of monthly market activity during 2013, the month of January 2013 saw the largest number of transactions with 1,737 transactions. In contrast, the month of December saw the lowest number of transactions with 1,324. Meanwhile, the month of February saw the largest number of units traded with market volume of 210,205,202 units. April was the month that recorded the smallest number of units traded with 41,629,553 units crossing the floor. In terms or the value of trades, the month of December led the way with the value of trades totalling $2.688 billion. On the other hand, the month of April recorded the lowest value of trades of $401.748 million.
Trading Activity: Main Market
26
JAMAICA STOCK EXCHANGE YEAR BOOK 2013
Continued on page 27

Continued on page 28
STOCK MARKET REVIEW 2013
The main advancers and decliners for 2013 were:
Company
Close
Price
% Change
Radio Jamaica
$1.30
(34.67%)
Seprod Limited
$10.50
(32.26%)
Berger Paints (Jamaica)
$1.75
(31.64%)National Commercial Bank $16.38 (31.52%)
Carreras Limited $36.11 (27.79%)Sagicor Investments Jamaica $16.00 (27.73%)Gleaner Company $1.10 (21.43%)First Caribbean International $90.00 (20.35%)
Mayberry Investments $2.00 (20.00%)Scotia Investments Jamaica $25.17 (17.48%)
Company Close
Price
%
Change
Caribbean Cement $3.50 250.00% Hardware & Lumber $6.10 79.41% Ciboney Group $0.05 66.67% Palace Amusement $95.00 58.33% Kingston Wharves $6.06 21.20% Kingston Properties $4.50 19.05% Desnoes & Geddes $5.10 13.33% GraceKennedy Limited $55.07 10.12%
Jamaica Producers $19.00 6.74%
Table 3 - Advancers Table 4 - Decliners
Continued from page 26
The top three advancers for the year were Caribbean Cement Company Limited up 250% to close at $3.50, Hardware & Lumber Limited up 79.41% to close at $6.10 and Ciboney Group Limited up 66.67% to close at $0.05. On the other hand, the main decliners were Radio Jamaica Limited down 34.67% to close at $1.30, Seprod Limited down 32.26% to close at $10.50 and Berger Paints (Jamaica) Limited down 31.64% to close at $1.75. This information is outlined in Table 3 and Table 4. The value leader was National Commercial Bank Jamaica Limited with over $3.698 billion. The volume leader was LIME with 211,053,549 units traded during the year. Trading occurred in 33 ordinary shares of which 16 advanced 8 declined and 9 traded firm.
The JSE Junior Market
At the end of 2013 the JSE Junior Market Index stood at 757.86 points. This reflects an increase of 110.08% on the 647.78 recorded at the end of 2012. The Junior Market welcomed the listing of five new companies during the year. Table 5 shows the companies that were listed 2013, the amount raised from these listings and the close prices as at December 31, 2013 along with their listing prices:
Table 5
Company Date Listed Amount Raised Millions
Listing Price Close Price Dec 31, 2013
% Change Since listing
Caribbean Cream Limited May 17, 2013 $75.18 $1.00 $0.89 -11.00%
Eppley Limited July 29, 2013 $82.56 $377.00 $380.00 0.80%
Caribbean Flavours and Fragrances Ltd October 14, 2013 $50.58 $2.25 $2.60 15.56%
Derrimon Trading Company Limited December 17, 2013 $150.338 $2.05 $2.49 21.46%
Medical Disposables & Supplies Ltd December 24, 2013 $115.58 $1.83 $2.20 20.22%
27JAMAICA STOCK EXCHANGE YEAR BOOK 2013

STOCK MARKET REVIEW 2013
Trading Activity: Junior Market
In 2013 the number of trades in the Junior Market amounted to 7,157. This compares to 5,047 trades in the year 2012. Market volume in 2013 stood at 477,733,468 units, down 92,132,767 units compared to 569,866,235 units in 2012. At the same time, the market value of trades stood at $1.385 billion in 2013, down 73.27% when compared to $5.185 billion recorded during the previous year. There were no block transactions in the Junior Market in 2013.
Market capitalisation at the end of 2013 amounted $27.391 billion. This reflects an increase of $5.289 billion compared to the end of 2012.
Lasco Manufacturing Limited was the value leader with $286.157 million dollars. Meanwhile, Caribbean Cream Limited was the volume leader with 148,839,095 units traded.
The USD Equities Market Index closed 2013 at 92.86 points, reflecting an improvement on the 67.82 points recorded at the end of 2012.
Market volume stood at 52,073,750 units, a significant increase of 44,918,040 units on the 7,155,710 units recorded for the year 2012. The value of trades in the USD market for 2013 was US$5.768 million relative to US$0.633 million in 2012. The number of trades amounted to 242 in 2013 versus 122 in 2012, up by 120. There were no block transactions in the US$ Equities Market in 2013.
Market capitalization at the end of 2013 in the USD market was US$38.34 million compared to US$28.02 million at the end of 2012.
Trading Activity: US Dollar Equities Market
Market Developments
Table 8Company/Security Date Listed Amount Raised Listing
Price
Caribbean Cream Limited May 17, 2013 $75.18 million $1.00
Jamaica Stock Exchange Limited July 23, 2013 $108.86 million $2.85
Eppley Limited July 29, 2013 $82.56 million $377.00
Jamaica Money Market Brokers Limited 7.50% Preference Shares
September 27, 2013 $1.43 billion $2.00
Jamaica Money Market Brokers Limited 7.25% Preference Shares
September 27, 2013 $38.395 billion $2.50
Caribbean Flavours and Fragrances Limited October 14, 2013 $50.58 million $2.25
Access Financial Services L imited 9% Unsecured Short Term Notes
October 18, 2013 $102.5 million $97.9964
Jamaica Public Service Company Limited 9.5% Cumulative Non -redeemable
F Series
Preference Shares
November 1, 2013
$2.45 billion
$1,050.14
Sagicor Real Estate X Fund Limited
November 15, 2013
$1.49 billion
$5.00
Jamaican Teas Limited Secured Corporate Notes Due 2017
November 25, 2013
$103.17 million
$100.00
Eppley Limited 9.5% Preference Shares
December 12, 2013
$361.95 million
$6.00
Derrimon Trading Company Limited December 17, 2013 $150.338 million $2.05
Medical Disposables & Supplies Limited December 24, 2013 $115.58 million $1.83
Sagicor Group Limited* December 23, 2013 - $8.05
*Sagicor Group Jamaica Limited was listed consequent to the change in the organisational structure of the Sagicor Group of companies to meet requirements of the new omnibus legislation for deposit taking institutions.
Continued from page 27
The main advancers and decliners of the Junior Market for 2013 were:
Company Close Price Change%
Lasco Financial Services Ltd $1.28 161.22%
Access Financial Services Ltd $12.00 93.55%
Blue Power Group Limited $10.00 66.67%
Cargo Handlers Limited $13.50 35.00%
Paramount Trading Limited $3.55 27.24%
Lasco Distributors Limited $1.30 17.65%
Lasco Manufacturing Limited $1.24 12.62%
Dolphin Cove Limited $8.42 7.95%
Caribbean Producers (Ja.) Ltd $2.70 4.65%
Jamaican Teas Limited $4.00 1.27%
Table 6 - Advancers
Company Close Price Change%
C2W Music Limited
$0.29 (76.03%)
K.L.E. Group Limited $1.10 (70.27%)
Consolidated Bakeries (Jamaica)
$1.16 (38.30%)
AMG Packaging & Paper Company Limited
$3.48 (13.00%)
Honey Bun Limited
$3.19 (8.86%)
General Accident Insurance Company Limited
$1.63 (7.39%)
Table 7 - Decliners
Continued on page 29
28JAMAICA STOCK EXCHANGE YEAR BOOK 2013

STOCK MARKET REVIEW 2013
Company/Security Date Delisted
Sagicor Life Limited December 20, 2013
Guardian Holdings Limited December 31, 2013
Lascelles deMercado & Co. Limited January 9, 2013
Lascelles 15% Preference shares January 9, 2013
Lascelles 6% Preference shares January 9, 2013
Cable & Wireless Jamaica Limited 5.5% Preference shares
September 16, 2013
Cable & Wireless Jamaica Limited 6% Preference shares
September 16, 2013
Jamaica Stock Exchange Variable Rate Preference Shares
May 31, 2013
Table 9
The Jamaica Stock Exchange launched its bond market in April 2013. As it relates to listing, the following criteria was outlined: Any company that is incorporated in a Caricom Country were list its fixed income securities on the JSE Bond Market. Similar to the equities market, companies interested in listing their bonds will be required to follow the requirements as outlined in the JSE Rule Book. Methods available for listing securities include the following: Prospectus Issue, Offer for Sale, Offer by Tender, Placing or Introduction
On July 5, 2013 there was a 10:1 stock split for all three LASCO affiliated companies. The close prices on July 4, 2013 and the adjusted prices at the start of trading on July 5, 2013 are presented in Table 10
Stock Price at Close July 4, 2013 Stock Price at start July 5, 2013
Lasco Distributors Limited $16.49 $1.65
Lasco Financial Services Limited $12.33 $1.23
Lasco Manufacturing Limited $16.34 $1.63
As at December 31, 2013, the total number of companies listed on the regular market stood at 36 while the total number of companies listed on the Junior Market stood at 21. The number of companies listed on the USD market stood at 1. There were 34 ordinary shares listed and 10 preferences as at December 31, 2013 were on the regular market. There was one preference share listing on the JSE Junior Market while two bonds were listed on the Bond Market.
Table 10
Continued from page 28
29JAMAICA STOCK EXCHANGE YEAR BOOK 2013
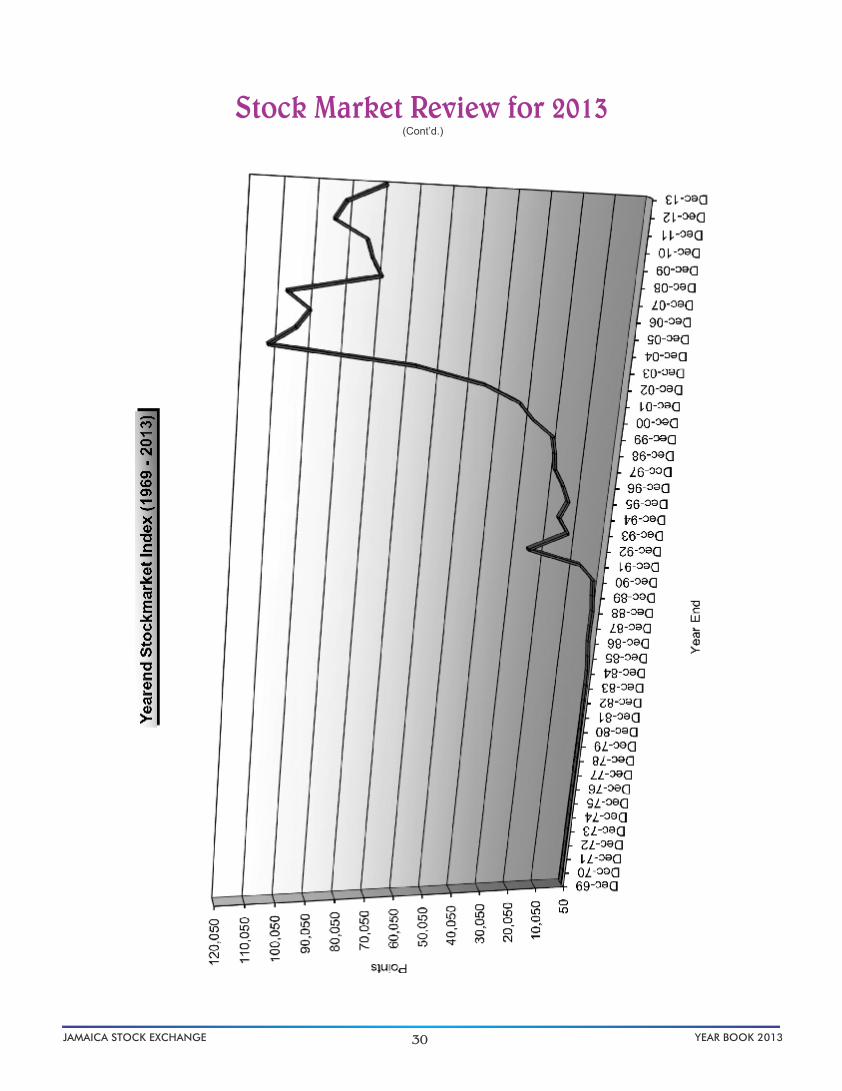
30
(Cont’d.)
Stock Market Review for 2013
JAMAICA STOCK EXCHANGE YEAR BOOK 2013

31JAMAICA STOCK EXCHANGE YEAR BOOK 2013
The Jamaica Stock Exchange
Best Practices
Awards 2013
Best Practices
Awards 2013
Presents its
Best Practices Awards Ceremony
JAMAICA PEGASUS HOTELWednesday, December 3, 2014
Best Practices Awards Ceremony
th0 Annual 1

32
MARKET ACTIVITY - A Five Year History
TRADING VALUE (JA$000's) 2013 2012 2011 2010 2009
JAMAICA STOCK EXCHANGE YEAR BOOK 2013
BANK OF NOVA SCOTIA +
BARITA INVESTMENTS LTD
BERGER PAINTS JAMAICA LTD
CAPITAL & CREDIT FINANCIAL GROUP LTD
CARIBBEAN CEMENT COMPANY LTD
CARRERAS LIMITED
CIBONEY GROUP LTD
DESNOES & GEDDES LTD
DYOLL GROUP LIMITED +
FIRST CARIBBEAN INTERNATIONAL LTD
FIRST CARIBBEAN INTERNATIONAL JA. LTD +
FIRST JAMAICA INVESTMENTS LTD +
GLEANER COMPANY LTD
GRACEKENNEDY LIMITED
GUARDIAN HOLDINGS LTD
HARDWARE & LUMBER LTD
JAMAICA BROILERS GROUP LTD
JAMAICA MONEY MARKET BROKERS LTD
JAMAICA PRODUCERS GROUP LTD
JAMAICA STOCK EXCHANGE LTD
KINGSTON PROPERTIES LIMITED
KINGSTON WHARVES LIMITED
LASCELLES de MERCADO & Co. LTD
LIME*
MAYBERRY INVESTMENTS LTD
MONTEGO BAY ICE COMPANY LTD
MONTEGO FREEPORT LTD +
NATIONAL COMMERCIAL BANK LTD
PALACE AMUSEMENT COMPANY (1921) LTD
PAN JAMAICAN INVESTMENT TRUST LTD
PEGASUS HOTELS OF JAMAICA LTD
PULSE INVESTMENTS LIMITED
RADIO JAMAICA LTD
SAGICOR GROUP JAMAICA LTD
SAGICOR INVESTMENTS JAMAICA LTD**
SAGICOR LIFE JAMAICA LTD
SAGICOR REAL ESTATE X FUND
SALADA FOODS LTD
SCOTIA GROUP JAMAICA LTD
SCOTIA INVESTMENTS JAMAICA LTD
SEPROD LIMITED
SUPREME VENTURES LTD
TRINIDAD CEMENT LTD
TOTAL ORDINARY VALUE
6,604
16,910
47,722
2,471,931
106
169,533
39,796
130,273
1,544,642
203
2,751
328,988
817,903
440,610
4,195
7,513
23,456
35,676
105,653
2,373
3,698,295
36
518,919
225
35,850
4,974
146,812
269,280
1,802
20,189
2,005,070
196,011
158,258
257,962
3,006
13,513,527
4,801
19,742
25,575
19,055
4,893,528
397
213,119
33,190
131,549
953,357
96,293
1,854
327,189
707,463
131,221
21,294
380,203
422,207
39,247
79,565
1,486
3,368,497
188
195,762
0
5,838
35,269
206,449
3,666,602
21,008
1,715,645
250,656
142,720
44,242
6,738
18,161,949
40,632
20,377
68,230
47,502
344,358
314
162,362
159,579
89,455
45,723
156,642
3,105,798
31,270
11,856
775,981
1,032,782
163,178
1,023
147,120
151,377
64,691
117,900
868
7,024
4,518,340
461
397,591
870,309
7,472
40,989
2,649,342
846,106
129,807
1,141,800
137,557
106,163
320,360
12,109
17,924,449
1,812
11,784
40,710
45,427
465,287
193
192,261
118,122
1,654
1,484,028
63,639
1,264,779
4,461
8,493
599,930
256,388
447,168
43,550
380,163
414,387
37,549
73,829
5
16,392
4,351,820
10
1,011,205
18,985
8,525
68,246
122,955
507,329
88,703
1,545,038
325,735
214,670
2,915,479
33
17,150,744
3,553
28,951
36,963
379,426
451
71,619
55,286
2,745
64,381
62,331
500,484
3,668
2,963
304,661
38,608
287,132
22,075
4,812
182,114
72,193
43,092
264
4,469
3,249,097
252
180,159
4,034
11,036
24,496
2,626,323
157,868
73,950
858,137
187,267
395,049
1,466,618
16,595
11,423,252

MARKET ACTIVITY - A Five Year History
TRADING VALUE (JA$000's) 2013 2012 2011 2010 2009
(Cont’d.)
+ Delisted *Formerly CABLE & WIRELESS (JA) **Formerly PAN CARIBBEAN FINANCIAL SERVICES LIMITED
TRADING VALUE (JA$000's) * 2013 2012 2011 2010 2009
12,712
- 5
738
- - - -
- 13,694 26,378
53,527
29,047,423
-21.58%
- 8
1,220
- 22 17
-
-
13,663
14,930
37,040,986 -9.09%
Junior Market
33JAMAICA STOCK EXCHANGE YEAR BOOK 2013
BANK OF NOVA SCOTIA JA VAR. PREFERENCE BARITA SERIES PREF SHARES A BARITA SERIES PREF SHARES B CABLE & WIRELESS (JA) 5.5% + CABLE & WIRELESS (JA) 6% + CAPITAL & CREDIT MERCHANT BANK VAR PRE JAMAICA LIVESTOCK ASSN. 7.5% JAMAICA MONEY MARKET BROKERS 7.25% JAMAICA MONEY MARKET BROKERS 7.50% JAMAICA MONEY MARKET BROKERS 8.50% JAMAICA MONEY MARKET BROKERS 8.75% JAMAICA MONEY MARKET BROKERS 12% JAMAICA MONEY MARKET BROKERS 12.25% JAMAICA MONEY MARKET BROKERS 12.15% JAMAICA PUBLIC SERVICE 5% C JAMAICA PUBLIC SERVICE 5% D JAMAICA PUBLIC SERVICE 6% JAMAICA PUBLIC SERVICE 7% JAMAICA STOCK EXCHANGE VAR PREF LASCELLES de MERCADO 6% MAYBERRY INVESTMENTS 12% NCB CAPITAL MARKETS 11.75% PAN CARIBBEAN FIN SERV 12.5% PROVEN INVESTMENTS LIMITED 8% TOTAL PREFERENCE VALUE TOTAL VALUE Annual % Change
31 25,610 1,553 77,679
1 332
588,976 694,182
14,207,709
-22.34%
810 71
73
4,382 89,731
986
7,290
29,802 133,146
18,295,094
1.07%
1,199 43,218
318
257 47
17,758 102,186
3,940
5
1,573
6,149
176,650
18,101,099 4.35%
1,469 2,823
648 45
4,433 73,270 26,755
2,743
10,986 38
73,266
196,476
17,347,220 50.66%
1,138
0 602
1,345
6,102 58,429
76
0
3,995
5,652 6,345 7,442
91,126
11,514,378
-52.77%
Access Financial Services Limited AMG Packaging & Paper Company Limited Blue Power Group Limited C2W Music Limited Caribbean Cream Limited* Caribbean Flavours and Fragrances Limited* Cargo Handlers Limited Caribbean Producers Jamaica Limited Consolidated Bakeries (Jamaica) Limited Derrimon Trading Company Limited* Dolphin Cove Limited Eppley Limited* General Accident Insurance Co. (Jamaica) Ltd Honey Bun (1982) Limited Jamaican Teas Limited K.L.E. Group Limited Lasco Distributors Limited Lasco Financial Services Limited Lasco Manufacturing Limited Medical Disposables & Supplies Limited* Paramount Trading (Jamaica) Limited TOTAL VALUE USD Equities Market Proven Investments Limited Junior Market Preference Shares Eppley Limited 9.5%*
120,877 16,617 53,708 1,991 4,456 161,922 6,064 74,502 44,067 9,377 86,575 2,014 40,222 6,250 57,228 3,375 245,802 124,344 286,157 4,412 35,951
1,385,912 -73.27%
5 ,769
54
104,323 14,543 25,742 573
1,648 49,262 1,794
144,262
53,944 22,548 52,219 2,208 1,957,800 327,163 2,427,207
63
5,185,299 315.51%
6 34
23,398 40,452 30,518
6,446 308,215
129,603
163,561 25,210 72,536
176,060
51,832 220,117
1,247,948
8 59

34JAMAICA STOCK EXCHANGE YEAR BOOK 2013

35
MARKET ACTIVITY - A Five Year History
TRADING VOLUME (000's) 2013 2012 2011 2010 2009
JAMAICA STOCK EXCHANGE YEAR BOOK 2013
BANK OF NOVA SCOTIA + BARITA INVESTMENTS LTD BERGER PAINTS JAMAICA LTD CAPITAL & CREDIT FINANCIAL GROUP LTD CAPITAL & CREDIT MERCHANT BANK + CARIBBEAN CEMENT COMPANY LTD CARRERAS LIMITED CIBONEY GROUP LTD CMP INDUSTRIES + COURTS (JAMAICA) + DESNOES & GEDDES LTD DYOLL GROUP + FIRST CARIBBEAN INTERNATIONAL LTD FIRST CARIBBEAN INTERNATIONAL JA LTD FIRST JAMAICA INVESTMENTS LTD GLEANER COMPANY LTD GOODYEAR (JAMAICA) + GRACEKENNEDY LIMITED GUARDIAN HOLDINGS LTD HARDWARE & LUMBER LTD JAMAICA BROILERS GROUP LTD JAMAICA MONEY MARKET BROKERS LTD JAMAICA PRODUCERS GROUP LTD JAMAICA STOCK EXCHANGE LTD KINGSTON PROPERTIES LIMITED KINGSTON WHARVES LIMITED LASCELLES deMERCADO & CO LTD LIME* MAYBERRY INVESTMENTS LTD MONTEGO BAY ICE COMPANY LTD MONTEGO FREEPORT LTD+ NATIONAL COMMERCIAL BANK JA. LTD PALACE AMUSEMENT CO (1921) LTD PAN JAMAICAN INVESTMENT TRUST LTD PEGASUS HOTELS OF JAMAICA LTD PULSE INVESTMENTS LTD. RADIO JAMAICA LTD RBTT FINANCIAL HOLDINGS LTD+ SAGICOR FINANCIAL CORPORATION + SAGICOR GROUP JAMAICA LTD SAGICOR INVESTMENTS JAMAICA LTD** SAGICOR LIFE JAMAICA LTD SAGICOR REAL ESTATE X FUND SALADA FOODS LTD SCOTIA GROUP JAMAICA LTD SCOTIA INVESTMENTS JAMAICA LTD SEPROD LIMITED SUPREME VENTURES LTD TRINIDAD CEMENT LTD TOTAL ORDINARY VOLUME
2,247 7,729
27,403 51,808 2,051
38,342
372
109,357
29,339 1 636 71,403 100,514 24,273 1,416 1,841 3,454
211,054
50,227 132
206,021
0 10,247
244 27,112
601 9,288 32,304 324 2,373 100,014 7,674 11,416 90,357 189
1,231,761
1,317 6,735 5,620
11,626 96,258 9,533
50,272
290
76,963
17,162 549 429 67,073 83,469 6,310
5,081 74,463 1,650 198,554 35,191
1,152 142,238
3 3,368
3,535 13,952
8,926 358,051
2,484 76,137 9,065 7,836 17,134 368
1,392,792
14,218 6,476
19,105
20,110 5,494 5,026
47,112
1,394 6,777 1,221
75,958
57,686 195
2,356 119,284 103,254
7,012
262 29,608
509 289,218
44,939 50
5,303 181,302
12 6,695
38,712 3,846
15,818
100,208 93,125
13,984 48,882
5,664 4,738
120,010 570
1,496,133
745 5,210
10,935
11,006 9,891 4,008
43,139
1,023 125
41,079 46,256
21,574
25 1,843
91,390 63,433 19,135
10,687
139,104 1,432
99,198 30,425
8,443
242,116
21,620 1,239 1,699
24,612
6,961 75,649
6,935
69,713 15,396
9,406 1,463,169
2,598,621
2,310 8,821
9,384 9,423 8,745
19,032
465 197
2,706 50,134
11,346
13 454
76,569 7,153
14,206
3,377 1,837
617 170,995
22,800 17
2,448 230,630
4 5,537
258 2,028
10,913
1
186,932 27,279
4,938
49,955 11,976 24,963
651,315 300
1,630,078

36
MARKET ACTIVITY - A Five Year History(Cont’d.)
TRADING VOLUME (000's) 2013 2012 2011 2010 2009
+ Delisted *Formerly CABLE & WIRELESS (JA) **Formerly PAN CARIBBEAN FINANCIAL SERVICES
TRADING VOLUME (000's) 2013 2012 2011 2010 2009
Junior Market
JAMAICA STOCK EXCHANGE YEAR BOOK 2013
BANK OF NOVA SCOTIA JAMAICA VAR. PREF. BARITA INVESTMENTS LTD SERIES A BARITA INVESTMENTS LTD SERIES B CABLE & WIRELESS (JA) 5.5% CABLE & WIRELESS (JA) 6% CAPITAL & CREDIT MERCHANT BANK JAMAICA MONEY MARKET BROKERS 8.50% JAMAICA MONEY MARKET BROKERS 8.75% JAMAICA MONEY MARKET BROKERS 7.25% JAMAICA MONEY MARKET BROKERS 7.50% JAMAICA MONEY MARKET BROKERS 12% JAMAICA MONEY MARKET BROKERS 12.25% JAMAICA MONEY MARKET BROKERS 12.15% JAMAICA LIVESTOCK ASSN. 7.5% JAMAICA PUBLIC SERVICE 5% C JAMAICA PUBLIC SERVICE 5% D JAMAICA PUBLIC SERVICE 6% JAMAICA PUBLIC SERVICE 7% JAMAICA PUBLIC SERVICE 9.5% JAMAICA STOCK EXCHANGE VAR PREF LASCELLES deMERCADO 6% MAYBERRY INVESTMENTS 12% NCB CAPITAL MARKETS PAN CARIBBEAN FIN SERV 12.5% PROVEN INVESTMENTS LIMITED 8% TOTAL PREFERENCE VOLUME TOTAL VOLUME Annual % Change
443 25,211 12 12,804
2
176
116,031 154,679
1,386,439
-3.13%
267 24
1,252 25,983
316 95
4,635
5,918 38,490
1,431,282
-7.67%
1071.475 14234.778
106.25
131.666 5072.644
31171.283
1187.83 24.204
15.7
963.14
30.205
54,009
1,550,142 -41.32%
1,175
919 0
460
1,561 24,962
8,373 25
0
1,375 0
3,688 14
364
42,916
2,641,537 58.92%
834
0 341
2,723 21,346
24 575
0
1,836
2,011 2,351
39
32,081
1,662,158 -27.58%
Caribbean Flavours and Fragrances Limited* Caribbean Producers Jamaica Limited Consolidated Bakeries (Jamaica) Limited Derrimon Trading Company Limited* Dolphin Cove Limited Eppley Limited* General Accident Insurance Co. (Jamaica) Ltd Honey Bun (1982) Limited Jamaican Teas Limited K.L.E. Group Limited Lasco Distributors Limited Lasco Financial Services Limited Lasco Manufacturing Limited Medical Disposables & Supplies Limited* Paramount Trading (Jamaica) Limited TOTAL VOLUME U SD Equities Market Proven Investments Limited J unior Market Preference Shares Eppley Limited 9.5%*
2,195 34,801 41,068 3,855 10,553 5 23,425 1,700 14,193 1,206 51,113 52,843 45,513 2,010 11,102
477,724
52,074
9
20,890 951
19,645
26,879 5,123 12,770 582 177,230 65,560 210,217
23
569,866
7,156
109,847
24,844
63,758 5,696
17,967
22,270 13,177 26,429
306,221
6 ,728

37
17 R
ipon
Roa
d,
Kin
gsto
n 5
Tel
: (8
76)
960-6
389-
94F
ax:
(876
) 96
0-68
16
Em
ail:
ide
alfi
n@cw
jam
aica
.com
17 R
ipon R
oad, K
ingst
on 5
Te
l: (8
76)
960-6
389-9
4F
ax:
(876)
960-6
816
Em
ail:
idealfin
@cw
jam
aic
a.c
om
IF
C
JAMAICA STOCK EXCHANGE YEAR BOOK 2013
The Jamaica Stock Exchange
Best Practices
Awards 2013
Best Practices
Awards 2013
Presents its
Best Practices Awards Ceremony
JAMAICA PEGASUS HOTELWednesday, December 3, 2014
Best Practices Awards Ceremony
th0 Annual 1

38
MONTH-END STOCK PRICE 2013
Ordinary Shares
January February Mar ch Apr il May
JAMAICA STOCK EXCHANGE YEAR BOOK 2013
BARITA INVESTMENTS LTD
BERGER PAINTS LTD
CARIBBEAN CEMENT COMPANY
CARRERAS GROUP
CIBONEY GROUP LTD
DESNOES & GEDDES
FIRST CARIBBEAN INTERNATIONAL BANK
GLEANER COMPANY
GRACEKENNEDY LTD.
GUARDIAN HOLDINGS LTD.
HARDWARE & LUMBER
JA. BROILERS' GROUP
JAMAICA MONEY MARKET BROKERS
JA. PRODUCERS GROUP
JAMAICA STOCK EXCHANGE
KINGSTON PROPERTIES LTD
KINGSTON WHARVES
LIME*
MAYBERRY INVESTMENTS
MONTEGO BAY ICE COMPANY LTD
NATIONAL COMMERCIAL BANK JA LTD
PALACE AMUSEMENT COMPANY (1921) LTD
PAN JAMAICAN INVESTMENT TRUST
PULSE INVESTMENTS LTD
RADIO JAMAICA LTD
SAGICOR GROUP JAMAICA LTD
SAGICOR INVESTMENTS JAMAICA LTD**
SAGICOR LIFE JAMAICA
SAGICOR REAL ESTATE X FUND
SALADA FOODS JA. LTD
SCOTIA GROUP JAMAICA LTD
SCOTIA INVESTMENTS JA LTD
SEPROD LIMITED
SUPREME VENTURES LTD.
TRINIDAD CEMENT LIMITED
3.33
2.69
0.81
54.98
0.03
3.95
113.00
1.12
49.49
277.00
3.22
4.71
8.25
15.02
3.78
5.40
0.19
2.51
18.00
20.81
95.00
57.01
1.00
1.70
20.01
8.51
8.45
20.80
26.02
16.50
2.41
18.33
3.05
1.80
0.87
53.01
0.03
3.93
110.00
1.13
49.51
277.00
3.22
4.53
7.20
15.00
3.75
5.50
0.18
2.22
18.00
19.54
95.00
50.29
1.00
1.30
14.20
7.05
8.50
18.72
23.15
14.21
2.40
18.33
3.35
1.80
0.84
52.92
0.03
4.11
106.00
1.12
47.31
270.00
4.35
4.55
6.20
15.11
3.90
5.50
0.20
2.00
18.00
17.46
95.00
55.97
1.60
1.32
14.68
7.11
8.51
19.09
22.03
14.45
2.50
15.60
2.99
1.95
0.63
54.34
0.02
4.05
101.50
1.17
55.02
270.00
4.10
4.56
8.00
15.08
4.00
5.96
0.18
2.01
18.00
18.02
95.00
50.20
1.60
1.35
15.50
7.75
9.00
21.00
23.00
14.56
2.51
15.60
3.00
2.38
0.71
60.91
0.03
4.90
103.00
1.17
60.62
270.00
3.95
4.72
9.02
17.10
4.50
7.76
0.16
2.36
18.00
19.10
95.00
57.56
1.60
1.23
15.88
8.31
9.00
21.17
26.64
14.50
2.90
15.60

39
MONTH-END STOCK PRICE 2013
June July August September October November December
(Cont’d.)Ordinary Shares
JAMAICA STOCK EXCHANGE YEAR BOOK 2013
2.59
2.30
0.90
52.97
0.08
4.81
101.05
1.16
60.00
270.00
3.86
4.99
7.99
18.50
4.50
8.00
0.15
2.60
17.95
20.11
95.00
51.93
1.60
1.30
17.00
8.55
9.02
21.19
27.50
14.51
3.00
15.60
2.30
2.25
0.95
50.35
0.07
4.76
101.11
1.18
56.32
270.00
4.60
4.99
8.09
18.22
3.25
4.50
7.80
0.14
2.60
17.95
19.05
95.00
51.11
0.94
1.30
18.00
8.93
9.02
21.11
26.36
14.57
2.90
15.60
2.50
2.25
2.00
46.90
0.07
4.50
100.00
1.20
56.14
270.00
4.52
5.14
8.02
18.21
2.95
4.50
7.00
0.17
2.63
17.95
19.86
95.00
51.10
0.87
1.30
16.73
8.19
8.50
21.41
26.16
13.00
2.66
15.60
2.49
2.26
2.08
46.98
0.06
4.57
100.00
1.21
55.38
270.00
4.52
4.80
8.00
18.25
2.85
4.50
6.01
0.18
2.60
17.95
18.80
95.00
50.34
0.87
1.31
16.55
8.60
8.50
21.20
26.50
13.50
2.70
15.60
2.30
2.17
2.07
40.00
0.05
4.50
100.00
1.11
54.72
270.00
4.50
4.50
8.13
18.25
2.85
4.50
5.60
0.17
2.00
17.95
17.55
95.00
48.01
0.87
1.22
15.66
8.13
8.21
20.03
26.02
13.00
2.55
15.60
2.00
1.78
2.06
35.98
0.04
4.48
90.00
1.11
55.96
270.00
4.20
4.20
7.90
18.26
2.20
4.50
6.00
0.16
1.99
17.95
17.80
95.00
48.11
0.87
1.30
15.66
7.75
5.55
8.10
17.55
26.01
11.30
2.50
15.60
2.50
1.75
3.50
36.11
0.05
5.10
90.00
1.10
55.07
270.00
6.10
4.53
7.50
19.00
1.80
4.50
6.06
0.16
2.00
17.95
16.38
95.00
53.00
0.87
1.30
10.17
16.00
6.07
8.10
20.15
25.17
10.50
2.78
17.61

MONTH-END STOCK PRICE 2013
January February Mar ch Apr il May
Preference Shares(Cont’d.)
40
January February Mar ch Apr il May
Junior Market
JAMAICA STOCK EXCHANGE YEAR BOOK 2013
CWJA 5.50 %
CWJA 6 %
JMMB Limited 7.25%
JMMB Limited 7.50%
JMMB Limited 8.50%
JMMB Limited 8.75%
J.P.S 5% C
J.P.S 5% D
J.P.S 6%
J.P.S 7%
J.P.S 9.5%
JSEVP
Proven Investments Limited 8%
0.50
0.53
3.50
3.25
0.36
0.35
0.40
0.39
1.89
5.00
0.50
0.53
3.50
3.25
0.36
0.35
0.40
0.39
1.89
5.09
0.50
0.53
3.50
3.20
0.36
0.35
0.40
0.39
1.89
5.09
0.50
0.53
3.50
3.30
0.36
0.35
0.40
0.39
1.89
5.09
0.50
0.53
3.50
3.22
0.36
0.35
0.40
0.39
1.89
5.04
Access Financial Services Limited Amg Packaging & Paper Company Limited Blue Power Group Limited C2W Music Limited Cargo Handlers Limited Caribbean Cream Limited Caribbean Flavours and Fragrances Ltd Caribbean Producers Jamaica Limited Consolidated Bakeries Jamaica Limited Derrimon Trading Company Ltd Dolphin Cove Limited Eppley Ltd General Accident Insurance Co. (Jamaica) Ltd Honey Bun (1982) Limited Jamaican Teas Limited KLE Group Limited Lasco Distributors Limited Lasco Financial Services Limited Lasco Manufacturing Limited Medical Disposables & Supplies Ltd Paramount Trading Jamaica Limited USD Equities Market Proven Investments Limited
* Formerly CABLE & WIRELESS (JA.) LTD. **Formerly PAN CARIBBEAN FINANCIAL SERVICES
6.28 3.80 5.52 1.21
11.00
2.24 1.80
7.50
1.68 3.81 3.90 3.70
10.50 5.00
11.01
3.25
0.0950
6.50 3.84 4.55 1.15
10.02
2.10 1.80
7.93
1.65 4.00 3.70 3.70 8.86 5.79 9.40
3.06
0.1000
6.56 3.60 5.50 1.15
10.05
2.01 1.60
8.40
1.55 3.65 3.70 3.70
10.50 6.11
10.50
3.25
0.1063
7.00 3.81 5.50 1.15
10.05
2.00 1.60
8.11
1.63 4.00 3.85 2.76 9.59 7.50
10.33
3.00
0.11
7.56 4.05 6.81 1.15
10.20 1.10
2.30 1.01
8.35
1.81 3.85 4.40 2.70
14.95 9.88
15.07
3.37
0.1100

MONTH-END STOCK PRICE 2013
June July August September October November December
(Cont’d.)
41
Preference Shares
June July August September October November December
Junior Market
JAMAICA STOCK EXCHANGE YEAR BOOK 2013
0.50
0.53
3.50
3.00
0.36
0.35
0.40
0.39
5.09
0.50
0.53
3.55
3.10
0.36
0.35
0.40
0.39
5.09
0.50
0.53
3.70
3.00
0.36
0.35
0.40
0.39
5.09
2.50
2.00
3.51
3.00
0.36
0.35
0.40
0.39
5.09
2.50
2.00
3.50
2.98
0.36
0.35
0.40
0.39
5.09
2.50
2.00
3.50
2.90
0.36
0.35
0.40
0.39
1,050.14
5.10
2.50
2.00
3.50
3.00
0.36
0.35
0.40
0.39
1,050.14
5.09
8.25 4.34
10.00 1.15
11.00 1.20
2.01 1.38
8.65
2.04 4.00 4.02 2.70
15.96 12.34 15.72
3.30
0.1149
8.50 4.00
10.00 1.15
13.00 1.03
2.03 1.35
9.00
377.00 1.93 4.00 4.30 2.00 1.47 1.60 1.51
3.30
0.1171
8.25 4.00 9.20 1.00
13.00 1.05
2.03 1.45
8.80
377.00 1.76 3.50 4.02 1.61 1.50 1.44 1.62
3.30
0.1190
8.40 4.00 9.50 0.97
13.00 1.00
2.08 1.21
8.45
377.00 1.82 3.41 3.95 1.61 1.50 1.20 1.51
3.20
0.119
8.28 3.50 9.28 0.93
13.20 1.00 2.55 1.95 1.16
8.00
380.00 1.62 3.05 3.80 1.40 1.45 1.15 1.42
3.30
0.1195
9.58 3.50 9.28 0.40
13.00 0.88 2.65 2.10 1.32
8.00
380.00 1.60 3.06 3.60 1.10 1.40 1.25 1.30
3.50
0.1200
12.00 3.48
10.00 0.29
13.50 0.89 2.60 2.70 1.16 2.49 8.42
380.00 1.63 3.19 4.00 1.10 1.30 1.28 1.24 2.20 3.55
0.1300

Last 2013Close Price BID ASK
Last 2012Close Price BID ASK
Last 2011Close Price BID ASK
Last 2010Close Price BID ASK
Last 2009Sale Price BID ASK
Year-End Closing Stock Price Quotation
ORDINARY SHARES
42JAMAICA STOCK EXCHANGE YEAR BOOK 2013
2.50
1.75
3.50
36.11
0.05
5.10
90.00
1.10
55.07
270.00
6.10
4.53
7.50
19.00
1.80
4.50
6.06
0.16
2.00
17.95
16.38
95.00
53.00
0.87
1.30
10.17
16.00
6.07
8.10
20.15
25.17
10.50
2.78
17.61
BANK OF NOVA SCOTIA*
BARITA INVESTMENTS
BERGER PAINTS
CAPITAL & CREDIT FINANCIAL GROUP*
CAPITAL AND CREDIT MERCHANT BANK*
CARIBBEAN CEMENT COMPANY
CARRERAS LIMITED
CIBONEY GROUP
CMP INDUSTRIES*
COURTS JAMAICA *
DESNOES & GEDDES
DYOLL GROUP*
FIRST CARIBBEAN INTERNATIONAL BK
FIRST CARIBBEAN INTERNATIONAL BK JA*
FIRST JAMAICA INVESTMENT *
GLEANER COMPANY
GOODYEAR JAMAICA*
GRACEKENNEDY LIMITED
GUARDIAN HOLDINGS LTD.
HARDWARE & LUMBER
JAMAICA BROILERS
JAMAICA MONEY MARKET BROKERS
JAMAICA PRODUCERS GROUP
JAMAICA STOCK EXCHANGE LTD
KINGSTON PROPERTIES KPREIT (JA) LTD
KINGSTON WHARVES
LASCELLES DEMERCADO & CO*
LIME
MAYBERRY INVESTMENTS
MONTEGO BAY ICE
MONTEGO FREEPORT*
NATIONAL COMM. BANK JAMAICA
PALACE AMUSEMENT CO (1921) LTD
PAN JAMAICAN INVESTMENT TRUST
PEGASUS HOTELS*
PULSE INVESTMENTS LTD
RADIO JAMAICA LIMITED
RBTT FINANCIAL HOLDINGS LTD*
SAGICOR FINANCIAL CORPORATION*
SAGICOR GROUP JAMAICA LTD
SAGICOR INVESTMENTS JAMAICA LTD***
SAGICOR LIFE JAMAICA LTD*
SAGICOR REAL ESTATE X FUND
SALADA FOODS JAMAICA LTD
SCOTIA GROUP JAMAICA LTD
SCOTIA INVESTMENTS JAMAICA LTD
SEPROD LIMITED
SUPREME VENTURES LTD
TRINIDAD CEMENT LTD.
2.50
1.85
3.35
37.00
0.05
5.00
1.10
56.00
185.00
6.01
4.53
7.49
18.26
1.55
6.06
0.16
2.00
17.90
45.00
54.00
0.87
1.45
10.60
16.00
5.76
8.50
20.01
25.08
12.00
2.78
17.61
3.00
2.15
3.50
37.50
0.08
5.10
89.99
1.19
58.50
300.00
7.50
5.00
7.60
19.00
2.85
4.50
8.00
0.18
2.25
17.90
18.00
95.00
55.00
1.30
1.90
16.53
6.20
13.00
21.00
26.50
13.00
3.00
2.76
2.56
1.00
50.01
0.03
4.50
113.00
1.40
50.01
277.00
3.40
5.03
8.21
17.80
3.78
5.00
0.16
2.50
18.00
23.92
60.00
57.55
1.00
1.99
22.14
10.11
8.50
21.17
30.50
15.50
2.85
18.33
2.91
2.94
0.80
50.05
0.03
4.50
1.40
50.01
3.10
5.00
8.20
17.60
3.75
5.00
0.15
2.50
24.90
60.00
57.55
1.00
1.88
22.50
10.10
8.40
21.01
28.05
15.50
2.60
18.20
4.00
3.10
1.15
57.00
0.08
4.70
112.99
1.45
52.00
300.00
4.45
5.15
8.70
18.00
5.50
0.16
2.80
24.99
95.00
62.00
1.60
1.98
24.00
10.30
8.50
23.45
31.00
16.00
2.85
70.00
4.71
3.20
4.55
3.00
61.52
0.05
5.13
115.67
13.25
2.20
62.99
165.00
5.90
5.92
12.40
24.01
4.52
5.92
292.50
0.20
3.26
18.00
1.50
28.06
50.00
60.01
22.49
2.45
2.54
26.56
10.00
8.87
24.01
28.89
22.52
3.00
18.31
4.00
3.20
4.50
2.78
61.52
0.05
4.73
13.25
2.05
62.99
5.20
5.51
12.00
24.03
3.75
5.50
290.00
0.19
3.27
1.50
27.20
50.00
60.01
14.50
1.45
2.55
27.00
10.00
10.00
24.00
29.00
22.51
2.90
18.50
4.50
3.25
4.55
3.45
63.64
0.09
5.25
116.00
2.19
63.00
300.00
9.00
6.00
12.49
26.90
4.52
6.00
295.00
0.20
3.30
1.70
27.50
90.00
62.00
4.00
2.70
28.00
10.08
12.50
24.25
30.00
24.50
3.10
53.00
1.99
2.01
3.30
3.07
53.07
0.03
3.59
114.01
13.19
36.50
1.70
51.00
220.00
4.65
6.01
4.00
20.25
3.90
4.00
305.00
0.33
2.47
16.00
1.43
19.32
46.00
47.01
12.01
2.30
2.30
19.49
7.24
13.00
21.13
22.00
21.00
2.17
53.00
2.02
2.91
3.00
53.00
0.03
3.40
36.00
1.65
50.40
2.30
5.90
3.90
20.00
3.91
3.51
270.00
0.32
2.31
13.00
1.40
18.50
45.00
47.00
12.00
1.00
2.30
17.08
6.82
13.05
21.10
21.00
21.01
2.10
1.99
3.00
3.30
3.07
54.00
0.10
3.60
120.00
13.19
38.00
1.79
52.00
300.00
4.90
6.01
4.00
22.88
4.00
300.00
0.34
2.49
16.00
1.80
19.35
60.00
48.00
15.00
2.40
3.00
19.50
7.90
13.20
21.25
23.00
23.00
2.17
86.00
1.20
4.41
4.00
35.02
0.10
3.42
117.94
12.70
27.97
1.16
40.50
299.50
3.50
4.96
4.00
25.89
5.00
3.08
250.00
0.38
1.99
15.67
1.90
16.00
60.00
36.00
19.99
5.44
2.01
250.00
18.10
7.02
15.50
19.57
16.62
18.00
2.01
72.00
1.20
2.81
3.72
35.00
0.05
3.36
13.50
26.50
1.16
40.03
210.00
3.50
4.97
4.00
23.00
4.00
3.00
250.00
0.39
1.85
13.00
1.85
15.10
31.00
34.70
15.50
4.08
2.01
150.00
15.00
6.80
14.00
19.00
16.60
18.01
2.01
0.00
3.00
4.50
4.00
37.50
0.10
3.70
118.90
21.00
30.75
1.29
40.50
225.00
4.99
5.00
26.00
5.00
3.30
320.00
0.44
1.99
16.00
1.90
15.99
36.00
19.00
5.30
2.55
260.00
19.50
7.00
15.80
20.39
19.31
21.00
2.25
71.90

Last 2009Sale Price BID ASK
JAMAICA STOCK EXCHANGE YEAR BOOK 201343
Last 2013Close Price BID ASK
Last 2012Close Price BID ASK
Last 2011Close Price BID ASK
Last 2010 Close Price BID ASK
Last 2009Sale Price BID ASK
Year-End Closing Stock Price Quotation
PREFERENCE SHARES(Cont’d.)
*Delisted
Last 2013Close Price BID ASK
Last 2012Close Price BID ASK
Last 2011Close Price BID ASK
Last 2010 Sale Price BID ASK
Junior Market
BANK OF NOVA SCOTIA JA VARIABLE PREF.* BARITA INVESTMENTS SERIES A* BARITA INVESTMENTS SERIES B* CABLE & WIRELESS (JA) 5.5%* CABLE & WIRELESS (JA) 6%* CAPITAL & CREDIT MERCHANT BANK VAR PREF* JAMAICA LIVESTOCK ASSOCIATION 7.5%* JAMAICA MONEY MARKET BROKERS 7.25% JAMAICA MONEY MARKET BROKERS 7.50% JAMAICA MONEY MARKET BROKERS 8.50% JAMAICA MONEY MARKET BROKERS 8.75% JAMAICA MONEY MARKET BROKERS 12%* JAMAICA MONEY MARKET BROKERS 12.25%* JAMAICA MONEY MARKET BROKERS 12.15%* JAMAICA PUBLIC SERVICE 5% C JAMAICA PUBLIC SERVICE 5% D JAMAICA PUBLIC SERVICE 6% JAMAICA PUBLIC SERVICE 7% JAMAICA STOCK EXCHANGE VAR PREF* LASCELLES de MERCADO 15%* LASCELLES de MERCADO 6%* MAYBERRY INVESTMENTS 12%* NCB CAPITAL MARKETS LTD 11.75%* PAN CARIBBEAN FIN SERV 12.5%* PROVEN INVESTMENTS LIMITED 8%
2.50 2.00 3.50 3.00
0.36 0.35 0.40 0.39
5.09
2.00
0.36 0.35 0.40 0.40
2.50 2.30 3.50 3.00
5.10
3.08 2.99 0.50 0.53
3.50 3.25
3.12 0.36 0.35 0.40 0.39 1.97
5.00
0.53
3.50 3.25
0.36 0.35 0.40 0.39
1.97
3.04 3.00 0.50 0.53
1.60
3.50 3.50
3.25 0.36 0.35 0.40 0.39 1.70
20.00 25.01
197.00
0.50 0.53
1.00
3.50 3.50
0.40 0.35 0.40 0.39 1.76
23.00 28.75
3.00 3.00
1.90
3.25
2.40
200.00
1.33 3.04 3.00 0.50 0.53 2.00 2.30
3.00 2.95 3.20 0.36 0.35 0.40 0.39 1.66
20.00 25.01
2.88 2.17
200.50
3.00
0.53
0.55
3.20 0.36 0.35 0.41 0.39 1.66
2.71 220.00
1.33 3.80
2.00
3.30
3.50
1.12
0.50 0.53 1.55 2.40
2.27 2.53 3.12 0.36 0.35 0.40 0.39 2.00
20.00 25.01
2.80 2.70
199.00
1.11
0.00 0.53 1.25 0.55
2.26 2.52 0.00 0.36 0.35 0.40 0.39 1.95 0.00 0.00 2.82 2.70
1.30
0.00 0.00 1.55 0.00
2.80 3.00 3.11 0.00 0.00 0.00 0.00 2.20 0.00 0.00 3.08 3.50
196.00
ACCESS FINANCIAL SERVICES LIMITED AMG PACKAGING & PAPER COMPANY LTD BLUE POWER GROUP LIMITED C2W MUSIC LIMITED CARGO HANDLERS LIMITED CARIBBEAN CREAM LIMITED CARIBBEAN FLAVOURS & FRAGRANCES LTD* CARIBBEAN PRODUCERS JAMAICA LTD CONSOLIDATED BAKERIES JAMAICA LIMITED DERRIMON TRADING COMPANY LTD* DOLPHIN COVE LIMITED EPPLEY LIMITED* GENERAL ACCIDENT INSURANCE CO JAMAICA HONEY BUN (1982) LIMITED JAMAICAN TEAS LIMITED KLE GROUP LIMITED LASCO DISTRIBUTORS LIMITED LASCO FINANCIAL SERVICES LIMITED LASCO MANUFACTURING LIMITED MEDICAL DISPOSABLES & SUPPLIES LTD PARAMOUNT TRADING (JAMAICA) LIMITED USD Equities Market Proven Investments Limited JUNIOR MARKET PREFERENCE SHARES EPPLEY LIMITED 9.5%
12.00 3.48
10.00 0.29
13.50 0.89 2.60 2.70 1.16 2.49 8.42
380.00 1.63 3.19 4.00 1.10 1.30 1.28 1.24 2.20 3.55
0.13
6.00
12.00 3.48
10.00 0.33
13.51 0.89
2.70 1.16 2.35 8.32
1.80
3.60 1.00 1.30 1.20 1.20 2.20 3.55
0.12
6.00
15.00 3.50
13.00 0.60
1.00 2.60 2.75 1.20 2.45 8.42
1.85 3.80 4.00 1.10 1.37 1.30 1.26
3.56
0.13
6.20 4.00 6.00 1.21
10.00
2.58 1.88
7.80
1.76 3.50 3.95 3.70
11.05 4.90
11.01
2.79
0.10
6.05 3.90 5.56
10.01
2.23 1.88
7.62
1.53 3.66 4.01 3.70
11.05 4.95
11.00
2.88
0.08
6.49 4.00 7.50 1.21
2.74 1.90
7.80
2.00 5.50 5.00 3.80
11.99 5.50
11.92
0.10
4.60 4.47 6.09
13.05
2.80
7.60
2.50 5.50 5.01
13.45
6.24 13.93
0.11
4.40 4.35 6.04
13.55
2.80
7.50
2.40 5.50 5.01
13.45
5.80 13.84
0.11
4.89 4.50 6.08
2.89
7.80
2.50 6.00 5.15
14.99
6.85 14.00
0.11
5.00
4.70
13.00
4.51
4.00
3.50 2.59 5.75
4.71
4.50
4.52
3.72
3.35 2.39 5.10
5.00
5.50
4.90
4.44
3.50 2.59 5.75

44JAMAICA STOCK EXCHANGE YEAR BOOK 2013

45
ANNUAL HIGH AND LOW STOCK PRICES
ORDINARY SHARES 2013
HIGH LOW 2012
HIGH LOW 2011
HIGH LOW 2010
HIGH LOW 2009
HIGH LOW
JAMAICA STOCK EXCHANGE YEAR BOOK 2013
Bank of Nova Scotia (Ja.) Ltd.* Barita Investments Berger Paints (Ja.) Ltd. Capital & Credit Financial Group Ltd Capital & Credit Merchant Bank* Caribbean Cement Co. Ltd. Carreras Group Ltd. Ciboney Group Ltd. Desnoes & Geddes Ltd. First Caribbean International Ltd First Caribbean International Jamaica First Jamaica Investment Ltd. Gleaner Co. Ltd. Goodyear (Ja.) Ltd.* GraceKennedy Ltd. Guardian Holdings Ltd. Hardware & Lumber Ltd. Jamaica Broilers Group Ltd. Jamaica Money Market Brokers Ltd. Jamaica Producers Go. Ltd. Jamaica Stock Exchange Limited Kingston Properties Limited Kingston Wharves Ltd. Lascelles de Mercado Ltd. LIME^^^ Mayberry Investments Ltd. Montego Bay Freeport Ltd. Montego Bay Ice Ltd. National Commercial Bank Ja. Ltd Palace Amusement Company (1921) Ltd. Pan Jamaican Investment Trust Pegasus Hotels of Ja. Ltd. Pulse Investments Ltd. Radio Jamaica Ltd. Sagicor Financial Corporation* Sagicor Group Jamaica Limited Sagicor Investments Jamaica Limited^^^^ Sagicor Life Jamaica Limited Sagicor Real Estate X Fund Salada Foods Jamaica Ltd. Scotia Group Jamaica Ltd. Scotia Investments Jamaica Limited^^^^^ Seprod Group Ltd. Supreme Ventures Ltd. Trinidad Cement Ltd.
3.50 2.94
3.50 61.00
0.08 5.15
113.00
1.40
63.00 270.00
6.10 5.30 9.50
20.70 3.25 4.52 8.50
0.21 2.70
17.95 24.90 95.00 60.00
1.60 1.90
10.60 25.00 10.50
7.00 9.02
24.00 31.00 16.90
3.10 18.33
2.00 1.70
0.59 35.00
0.02 3.80
90.00
1.10
47.00 270.00
3.00 3.90 5.89
14.99 1.80 3.75 4.95
0.13 1.90
17.95 15.55 60.00 48.00
0.85 1.20
8.05
14.00 6.80 5.07 8.00
16.15 22.00 10.00
2.20 15.58
4.79 3.49 4.70
3.00
65.00 0.09 5.13
115.00
2.20
63.50 278.00
5.90 5.89
12.49 24.50
4.53 6.01
420.01 0.25 3.65 1.50
28.00 60.00 63.00
3.20 2.90
29.00 11.00
10.01 26.49 32.00 22.52
3.10 18.33
2.60 2.50 4.15
0.80
48.45 0.02 3.65
112.99
1.30
48.00 165.00
3.00 4.04 7.50
16.00
3.75 4.50
240.00 0.14 1.77 1.15
19.50 50.00 57.00
1.00 1.98
18.00 9.26
7.90
19.30 25.00 12.80
2.25 18.31
5.00 3.50 5.00
3.75
67.10 0.10 6.00
117.61 13.25
2.25
67.00
165.00 6.10 7.26
13.00 34.50
4.52 6.50
334.00 0.33 4.00 1.64
18.00 34.00 50.00 65.00 22.50
4.00 3.05
30.00 11.30
13.00 28.00 35.10 24.50
3.33 53.00
1.90 2.01 2.21
1.75
53.00 0.03 2.40
114.00 6.50
1.60
50.99
160.00 4.50 5.51 3.90
20.00
3.75 3.50
285.00 0.13 1.80 1.08
16.00 18.30 35.00 47.00 11.00 1.00 2.25
17.00 6.81
8.50
20.78 20.50 21.00
1.96 18.00
2.90 3.2
4.50
7.00 55.00
0.10 5.25
121.00 13.50 40.00
1.70
69.00 220.00
5.05 7.50 4.40
25.99
5.00 5.75
325.00 0.50 3.00 2.61
16.00 21.00 52.00 50.00 20.00
5.19 3.50
20.45 7.40
14.00 25.50 24.00 27.00
2.90 62.00
1.99 1.20 2.70
2.75
34.56 0.02 3.10
113.00 13.00 25.05
1.16
38.00 175.00
4.00 4.50 3.40
17.00
3.80 2.50
220.00 0.29 1.75 1.36
16.00 13.02 46.00 33.00 12.00
2.30 2.01
14.00 5.51
7.50
16.01 16.00 17.00
1.80 53.00
2.05 5.00
5.00
52.00 0.10 4.50
122.00 20.00 30.00
1.84
51.05 320.00
9.01 5.20 7.33
26.00
6.70 4.80
450.00 0.65 2.35 2.60
16.00 19.50 60.00 40.00 20.00
5.50 3.00
260.00
21.50 7.50
20.50 23.00 26.00 19.00
3.30 72.00
1.10 2.05
3.20
35.00 0.03 3.31
116.00 12.50 19.00
1.10
36.00 100.00
3.50 3.10 3.90
12.00
3.99 1.90
240.00 0.35 1.53 1.45
15.00 12.00 60.00 23.00 12.51
5.00 1.40
260.00
12.00 4.00
7.51
14.00 12.00 13.00
1.72 55.25

46
ANNUAL HIGH AND LOW STOCK PRICES
PREFERENCE SHARES (Cont’d.)
2013HIGH LOW
2012HIGH LOW
2009HIGH LOW
2008HIGH LOW
2007HIGH LOW
Junior Market
JAMAICA STOCK EXCHANGE YEAR BOOK 2013
2013HIGH LOW
2012HIGH LOW
2011HIGH LOW
2010HIGH LOW
2009HIGH LOW
Bank of Nova Scotia Variable Pref. Barita Invest Ltd Series A Barita Invest Ltd Series B C & W Ja Ltd. 5.5% C & W Ja Ltd. 6% Capital & Credit Merchant Bank Var Pref Jamaica Livestock Association 7.5% Jamaica Money Merket Brokers 12%** Jamaica Money Merket Brokers 12.25%** Jamaica Money Merket Brokers 12.15% Jamaica Money Merket Brokers 7.25% Jamaica Money Merket Brokers 7.50% Jamaica Money Merket Brokers 8.50% Jamaica Money Merket Brokers 8.75% JPS 5% C JPS 5% D JPS 6% JPS 7% Jamaica Stock Exchange Var Pref Lascelles Group 15% Lascelles Group 6% Mayberry Investments Ltd. 12%** NCB Capital Markets 11.75%** P.C.F.S. 12.5% Proven Investments Limited 8%
2.50 2.05 3.70 3.30
1.89
5.11
2.50 2.00 3.50 2.90
1.88
4.95
3.09 3.00
1.00
3.12
4.00 3.61
2.00
2.80 2.99
0.50
3.12
3.40 3.15
1.40
3.08 3.00
1.99
3.40
3.51 3.60
0.35
1.76
220
3.00 2.99
1.60
3.20
3.50 3.00
0.35
1.5
197.00
1.50 3.90
2.00 2.30 3.05 3.00 3.25
2.17
3.00 2.75
203.63
1.10 3.00
1.25 1.50 2.41 2.53 3.00
1.65
2.85 2.71
195.00
1.75
0.53 2.04 2.46 2.40 3.00 3.13
0.35
2.60
3.09 3.00
199.00
1.10
0.53 0.97 0.30 2.15 2.20 3.12
0.35
2.00
2.00 2.51
190.00
Access Financial Services Limited AMG Packaging & Paper Company Limited Blue Power Group Limited C2W Music Limited Cargo Handlers Limited Caribbean Cream Limited Caribbean Flavours and Fragrances Limited Caribbean Producers Jamaica Limited Consolidated Bakeries (Jamaica) Limited Derrimon Trading Company Limited Dolphin Cove Limited Eppley Limited General Accident Insurance Co. (Jamaica) Ltd Honey Bun (1982) Limited Jamaican Teas Limited K.L.E. Group Limited Lasco Distributors Limited ! Lasco Financial Services Limited ! Lasco Manufacturing Limited ! Medical Disposables & Supplies Limited Paramount Trading (Jamaica) Limited JUNIOR PREFERENCE SHARES Eppley Limited 9.5% USD ORDINARY SHARES Proven Investments Limited
12.00 4.70
11.00 1.21
14.00 1.20 2.88 2.74 1.90 2.50 9.10
380.00 2.05 4.01 4.60 3.70
18.00 13.01 17.00
2.25 3.65
6.00
0.1300
5.76 3.48 4.50 0.29
10.01 0.88 2.40 1.50 0.90 2.35 7.05
380.00 1.31 3.00 3.60 1.10 1.30 0.97 1.20 2.10 2.60
6.00
0.0910
6.30 4.50 6.10 1.39
13.50
2.90 2.05
7.82
2.50 5.30 5.20 4.00
15.00 6.85
14.10
2.79
0.11
3.88 3.48 4.15 1.20
10.00
2.08 1.80
6.50
1.50 3.00 3.70 3.70
10.50 3.80
10.10
2.79
0.075
5.6
6.91
14.01
9.61
5.50
16.00 7.00
15.00
0.15
3.82
4.70
12.50
4.25
3.51
3.00 1.98 4.80
0.11
* Ordinary shares delisted** Preference shares delisted @Formerly CIBC WI Holdings ^Formerly CIBC Jamaica ^^^Formerly Cable & Wireless Jamaica Limited ^^^^ Formerly Pan Caribbean Financial Services ^^^^^ Formerly Scotia DBG Investments ! Stock split declared during the year

47
STOCK MARKET DATA
JANUARYFEBRUARYMARCHAPRILMAYJUNEJULYAUGUSTSEPTEMBEROCTOBERNOVEMBERDECEMBERYEAR
ANNUALCHANGE
* Including block transactions
2013 2012 2011 2010 2009
MONTHLY TRADING VOLUME (000's) units*
JANUARYFEBRUARYMARCHAPRILMAYJUNEJULYAUGUSTSEPTEMBEROCTOBERNOVEMBERDECEMBERYEAR
ANNUALCHANGE
* Including block transactions
2013 2012 2011 2010 2009
MONTHLY TRADING VOLUME (000's) units*
Junior Market
Main Market
JAMAICA STOCK EXCHANGE YEAR BOOK 2013
53,089 214,304
79,016 41,652 69,062
194,910 110,613 118,786 93,873
150,562 70,908
636,689 1,833,463
-28.97%
65,119 169,949
95,550 40,745
199,168 1,041,308
383,653 82,533 69,434 40,255 50,554
342,981 2,581,249
41.88%
93,885 61,826
154,588 143,871 176,135
97,993 100,996 109,166 187,849 205,561 184,579 302,852
1,819,301
-49.06%
1,468,781 64,203
249,143 127,488 171,530
61,146 67,170 53,343 83,381
133,235 132,737 959,042
3,571,199
102.35%
112,655 47,038
498,028 81,664 86,595 23,566 64,739
120,261 212,708
36,568 319,279 161,792
1,764,893
-40.23%
13,605 14,688 19,563 25,945 54,004 39,042
174,121 22,409 38,891 30,682 19,420 25,363
477,733
-16.17%
8,344 14,181 31,692
8,005 9,930 6,457 8,249 7,276 7,167 6,802
436,805 24,957
569,866
86.10%
12,004 4,176 6,633 3,156
16,638 16,702 65,198 39,720 24,710 40,453 64,803 12,029
306,221
564.80%
26 18
722 1,357 2,332
378 2,268
723 1,360
11,324 17,062
8,493 46,062
87804.33%
0 19 33 52

48
STOCK MARKET DATA(Cont’d.)
MONTHLY TRADING VALUE (JA$000's)*
ANNUAL CHANGE
2013 2012 2011 2010 2009
* Including block transactions
JANUARYFEBRUARYMARCHAPRILMAYJUNEJULYAUGUSTSEPTEMBEROCTOBERNOVEMBERDECEMBERYEAR
ANNUALCHANGE
* Including block transactions
2013 2012 2011 2010 2009
MONTHLY TRADING VALUE (JA$000's)*
Junior Market
JANUARYFEBRUARYMARCHAPRILMAYJUNEJULYAUGUSTSEPTEMBEROCTOBERNOVEMBERDECEMBERYEAR
Main Market
719,608 1,944,614
959,372 401,898 656,235
1,095,750 1,826,898
632,375 539,795
1,744,954 1,031,790 4,424,955
15,978,243
-73.85%
1,183,492 1,963,234 1,109,343
486,656 5,360,901 5,164,368 3,477,776
925,101 604,556 435,725 434,694
39,963,720 61,109,565
191.08%
408,933 539,605
2,375,923 730,479
1,838,945 764,767 757,140 898,263
2,078,010 1,535,771 2,533,204 6,532,936
20,993,976
0.79%
3,131,073 744,308
2,042,854 1,084,224 2,745,998
799,321 920,509 864,238 756,131
2,115,922 1,751,264 3,872,810
20,828,652
70.87%
527,323 368,619
1,352,785 707,094 488,788 200,622 505,671
1,198,223 1,256,443
240,681 3,326,288 2,017,543
12,190,080
-81.81%
61,013 62,425
102,309 144,380 140,605 335,368 257,185
45,245 78,013 77,027 32,845 49,550
1,385,966
-73.27%
49,011 83,797
170,416 35,122 38,629 37,333 36,574 44,566 36,674 31,375
4,465,469 156,334
5,185,299
315.51%
57,381 19,869 29,759 15,629 89,002 96,961
206,314 168,581 108,040 149,034 248,060
59,316 1,247,948
549.40%
707 501
22,570 10,137 12,057
1,750 10,312
3,108 5,542
36,664 56,282 32,539
192,170
46109.49%
0 415
1 416
JAMAICA STOCK EXCHANGE YEAR BOOK 2013

49
STOCK MARKET DATA
2013 2012 2011 2010 2009MONTH
JANUARYFEBRUARYMARCHAPRILMAYJUNEJULYAUGUSTSEPTEMBEROCTOBERNOVEMBERDECEMBER
YEAR ENDCHANGE
JSE STOCK MARKET INDEX
(Cont’d.)
Main Market
JAMAICA STOCK EXCHANGE YEAR BOOK 2013
89,118.72 84,048.93 81,986.30 83,476.38 87,577.92 86,853.91 86,063.98 85,039.91 84,500.20 81,832.16 77,481.83 80,633.55
-12.45%
92,206.86 90,869.40 91,369.00 91,460.74 88,381.96 87,388.96 85,511.52 85,871.47 87,188.38 89,821.80 89,932.82 92,101.22
-3.35%
85,074.33 85,805.72 86,532.02 89,234.77 88,651.86 88,584.96 90,804.09 93,531.84 91,731.85 95,270.74 96,125.86 95,297.20
11.82%
75,166.03 79,094.75 86,010.60 88,332.24 86,011.58 86,333.62 85,849.88 84,593.09 83,613.08 83,352.14 84,466.50 85,220.82
2.28%
87,206.90 83,091.44 79,022.64 79,742.37 82,837.63 80,866.14 79,304.49 79,883.87 79,928.03 80,567.52 83,322.40 83,321.96
3.95%

* Volume & Value include Block transactions ** Transactions include Block Trades
50
STOCK MARKET DATA(Cont’d.)
JANUARYFEBRUARYMARCHAPRILMAYJUNEJULYAUGUSTSEPTEMBEROCTOBERNOVEMBERDECEMBERYEAR
MONTHLY TRADING HIGHLIGHTS, 2013 *
MONTHLY TRADING AVERAGES
NO. OF
Trading Days Transactions Transactions Volume(000s) Value J$ (000s) High Low Close
Average Daily JSE Junior Market IndexMonth
MONTHLY TRADING HIGHLIGHTS, 2013 *
MONTHLY TRADING AVERAGES
NO. OF
Trading Days Transactions Transactions Volume(000s) Value J$ (000s) High Low Close
Average Daily JSE IndexMonth
Junior Market
Main Market
JANUARY** FEBRUARY** MARCH** APRIL** MAY JUNE** JULY AUGUST** SEPTEMBER** OCTOBER NOVEMBER DECEMBER** YEAR
JAMAICA STOCK EXCHANGE YEAR BOOK 2013
22 19 20 21 22 20 23 20 21 22 21 20
251
1,738 1,637 1,464 1,361 1,452 1,713 1,603 1,512 1,447 1,601 1,429 1,327
18,284
79 86 73 65 66 86 70 76 69 73 68 66 73
2,413 11,279 3,951 1,983 3,139 9,746 4,809 5,939 4,470 6,844 3,377
31,834 7,482
32,709 102,348
47,969 19,138 29,829 54,787 79,430 31,619 25,705 79,316 49,133
221,248 64,436
92,435.27 90,428.92 85,694.89 83,522.96 87,578.31 88,849.67 88,276.46 86,265.61 85,363.57 85,328.52 82,868.00 80,633.55
89,118.72 84,048.93 81,986.30 79,863.72 83,549.41 86,853.91 86,063.98 84,480.16 84,122.81 81,639.52 77,001.06 77,624.11
89,118.72 84,048.93 81,986.30 83,476.38 87,577.92 86,853.91 86,063.98 85,039.91 84,500.20 81,832.16 77,481.83 80,633.55
22 19 20 21 22 20 23 20 21 22 21 20
251
550 383 364 437 565 947
1,296 600 577 592 386 460
7,157
25 20 18 21 26 47 56 30 27 27 18 23 28
618 773 978
1,235 2,455 1,952 7,570 1,120 1,852 1,395
925 1,268 1,845
2,773 3,286 5,115 6,875 6,391
16,768 11,182 2,262 3,715 3,501 1,564 2,478 5,493
654.07 627.97 633.55 625.65 761.34 801.30 840.18 809.44 791.58 779.58 731.84 778.24
628.12 591.92 584.67 602.12 620.75 729.38 797.47 778.52 753.60 732.59 705.23 731.03
628.52 592.48 622.44 617.18 759.93 801.30 797.47 792.42 768.83 732.59 724.44 757.86

51
STOCK MARKET DATA
Market Value
Company JA$(000)
Company JA Units (000) Company JA$(000)
Market Capitalisation
Top Twenty Companies by Market Capitalisation, Volume and Value as at December 31, 2013
Market Volume
(Cont’d.)
** Formerly Pan Caribbean Financial Services Ltd * Formerly Cable & Wireless Jamaica Ltd.
JAMAICA STOCK EXCHANGE YEAR BOOK 2013
FIRST CARIBBEAN INTERNATIONAL BANK LTD SCOTIA GROUP JAMAICA LTD GUARDIAN HOLDINGS LTD. NATIONAL COMMERCIAL BANK JAMAICA LTD. SAGICOR GROUP JAMAICA LTD GRACEKENNEDY LTD. CARRERAS LIMITED DESNOES & GEDDES LTD JAMAICA MONEY MARKET BROKERS LTD PAN-JAMAICAN INVESTMENT TRUST LTD SCOTIA INVESTMENTS JAMAICA LTD. SAGICOR REAL ESTATE X FUND SAGICOR INVESTMENTS JAMAICA LTD** KINGSTON WHARVES LTD SUPREME VENTURES LTD. JA. BROILERS GROUP LTD SEPROD LIMITED LASCO MANUFACTURING LIMITED TRINIDAD CEMENT LIMITED LASCO DISTRIBUTORS LIMITED
137,261,874 62,698,196 62,612,996 40,405,575 38,249,286 18,433,209 17,529,238 14,326,773 12,229,144 11,301,295 10,651,812 9,076,694 8,834,334 8,667,009 7,331,569 5,432,722 5,422,178 5,068,041 4,398,364 4,376,360
LIME *National Commercial Bank Jamaica Ltd. Caribbean Cream Limited Proven Investments Limited 8% Pref Shares Gleaner Company Limited Jamaica Money Market Brokers Ltd Scotia Group Jamaica Ltd Supreme Ventures Limited Jamaica Broilers Group Ltd Lasco Financial Services Limited Carreras Limited Lasco Distributors Limited Mayberry Investments Ltd Lasco Manufacturing Limited Consolidated Bakeries (Jamaica) Limited Desnoes & Geddes Limited Caribbean Producers Jamaica Limited Sagicor Life Jamaica Ltd GraceKennedy Ltd Caribbean Cement Company Ltd
211,053,549 206,021,432 148,839,095 116,030,787 109,357,400 100,513,791 100,014,091
90,356,553 71,402,881 52,843,071 51,807,575 51,113,074 50,226,564 45,512,936 41,068,404 38,342,147 34,801,141 32,304,059 29,339,083 27,402,586
National Commercial Bank Jamaica Ltd. Carreras Limited Scotia Group Jamaica Ltd GraceKennedy Ltd Jamaica Money Market Brokers Ltd Proven Investments Limited 8% Pan-Jamaican Investment Trust Jamaica Producers Group Ltd Jamaica Broilers Group Lasco Manufacturing Limited Sagicor Life Jamaica Ltd Supreme Ventures Ltd Lasco Distributors Limited Scotia Investments Jamaica Ltd Desnoes & Geddes Caribbean Cream Limited* Seprod Limited Sagicor Investments Jamaica Limited** Gleaner Company Ltd Lasco Financial Services Limited
3,698,295.04 2,471,931.15 2,005,070.13 1,544,641.75 817,903.07 588,976.00 518,919.25 440,609.97 328,987.82 286,157.36 269,280.15 257,961.79 245,802.30 196,010.64 169,533.07 161,921.94 158,257.67 146,812.18 130,272.71 124,343.89

52JAMAICA STOCK EXCHANGE YEAR BOOK 2013

53
STOCK MARKET DATA
JANUARYFEBRUARYMARCHAPRILMAYJUNEJULYAUGUSTSEPTEMBEROCTOBERNOVEMBERDECEMBER
YEAR
NO. OF Volume ValueMonth
Transactions (000's) Units Ja$(000's) Volume Value
% of Overall Market:-
Block Transactions (2013)
Twenty Most Active Stocks for 2013 *
Company No. of Transactions
* Includes Block Transactions
(Cont’d.)
JAMAICA STOCK EXCHANGE YEAR BOOK 2013
Scotia Group Jamaica Limited National Commercial Bank Ltd. Carreras Limited Jamaica Money Market Brokers Lasco Financial Services Limited Lasco Manufacturing Limited Sagicor Life Jamaica Limited GraceKennedy Ltd Lasco Distributors Limited Jamaica Broilers Group Limited LIME Caribbean Cement Company Limited Proven Investments 8% Pref share General Accident Insurance Company (JA) Scotia Investments Jamaica Limited Caribbean Producers Jamaica Limited Kingston Wharves Desnoes & Geddes Limited Mayberry Investments Limited JMMB 8.75%
2,718 2,075 2,064 1,389 1,326 1,308 1,272 1,211 1,161 897 655 602 549 510 459 455 454 436 425 379
20,345
1 2 0 1 1 0 0
10 0 2 0 3
1,601 4,099
- 22 14 - -
7,098 -
145 -
434,045
288 32,272
- 149 108
- -
1,232 -
260 -
1,736,225
3.01% 1.91% 0.00% 0.05% 0.02% 0.00% 0.00% 5.98% 0.00% 0.10% 0.00%
68.17%
0.04% 1.66% 0.00% 0.04% 0.02% 0.00% 0.00% 0.19% 0.00% 0.01% 0.00%
39.24%
20 447,024 1,770,534 24.38% 11.08%

54
DIVIDEND SUMMARY
2013 2012 2011 2010 2009$ 000 $ 000 $ 000 $ 000 $ 000Ordinary (Ja. $000’s)
JAMAICA STOCK EXCHANGE YEAR BOOK 2013
Access Financial Services Ltd. AMG Packaging & Paper Company Limited Bank of Nova Scotia Jamaica Ltd Barita Investments Limited Berger Paints Jamaica Ltd Blue Power Group Limited C2W Music Limited Capital & Credit Financial Group Capital & Credit Merchant Bank Ltd. Cargo Handlers Limited Caribbean Cement Company Caribbean Cream Limited Caribbean Flavours and Fragrances Limited Caribbean Producers Jamaica Limited** Carreras Limited Consolidated Bakeries (Jamaica) Limited Derrimon Trading Company Limited Desnoes & Geddes Limited Dolphin Cove Limited Eppley Limited First Caribbean Bank Jamaica Ltd First Jamaica Investments Ltd. General Accident Insurance Company Ja Gleaner Company Limited GraceKennedy Limited Hardware & Lumber Limited Honey Bun (1982) Limited Jamaica Broilers Group Limited Jamaica Livestock Association 7.5% Jamaica Money Market Brokers Limited Jamaica Producers Group Jamaica Stock Exchange Limited Jamaican Teas Limited Kingston Properties Limited Kingston Wharves Limited KLE Group Limited Lascelles deMercado & Co. Limited Lasco Distributors Limited Lasco Financial Services Limited Lasco Manufacturing Limited LIME Mayberry Investments Ltd. Medical Disposables & Supplies Limited Montego Bay Ice Co. Limited Montego Freeport Limited National Commercial Bank (Ja.) Ltd. Palace Amusement Sagicor Investments Jamaica Limited Pan-Jamaican Investment Trust Paramount Trading (Jamaica) Limited Pegasus Hotels of Jamaica Ltd. Pulse Investments Limited Radio Jamaica Limited Sagicor Group Jamaica Limited Sagicor Life Jamaica Sagicor Real Estate X Fund Limited Salada Foods Jamaica Limited Scotia Investments Jamaica Ltd. Scotia Group Jamaica Ltd. Seprod Limited Supreme Ventures Limited
* FirstCaribbean Int'l Bank Ltd. # Guardian Holdings # Trinidad Cement Ltd
263,529 0
50,830 27,862
5,932
63,292 0
509 5,723,338
842,752 156,971
140,025 83,906
727,660 24,253 14,138
167,899
536,000 34,001
8,435 9,927
257,436
84,160 52,808 57,219
2,733,032 2,515
833,740 435,248
28,034 1,504,396
41,552 761,751
4,978,549 428,561 632,942
46,706 -
120,586 0.00%
-
123,239
40,129 25,719
5,650
- 36,033
-
629 2,718,464
561,834 117,749
100,031 93,177
665,937 10,105 11,310
168,203
439,016 34,001
16,829
5,981 143,020
47,123 6,141
61,304 -
252,241
2,707,390 2,156
724,967 436,869
0 34,995
2,106,156
36,358
727,895 4,605,158
428,611 606,569
46,706 (0.48)
120,588 8.73%
-
85,098
61,510
- -
11,989 -
2,427,200
- 47,090
-
1,060,925 329,018 494,874
- 0
191,884
204,874 84,702
16,780
- 32,179
4,051,362
- 96,092
- -
3,347,318 2,156
704,884 300,209
- -
41,584
2,444,643
36,358 558,617
4,605,150 392,463 448,386
89,857 -
110,906 4.73%
13,725
4,180,087
20,361
- -
-
3,398,080
702,293
- 392,964
79,937
445,007 -
239,855 4,299
175,606 42,243
- 128,717
528,162
- 96,092
- -
4,676,398 -
603,921 246,677
42,059
- 17,599
1,617,226
31,144
558,616 4,605,135
387,299 369,216
89,857 0.78%
105,898 9.34%
325 -71.69%
3,863,946
20,361
- -
-
7,912,672
983,208
106,303 332,508
62,768
378,838 -
131,921 4,305
336,579 25,394
9,528 -
1,344,162
- 96,092
- -
2,165,911 2,156
684,905 232,973
48,066
- -
2,141,157
- 497,254
4,231,746 335,658 584,359
89,161 -4.73% 96,848
-26.24% 1,148
-93.43%
Total Dividend Payout 21,713,202 18,100,990 22,077,345 23,602,718 26,532,770 Percentage Change (%) 19.96% -18.01% -6.46% -11.04% 32.18%
# Dividend quoted in Trinidad & Tobago Dollars (TT$) * Dividend quoted in $US for 2004, and in BDS$ for all previous years ** Dividend quoted in $US

55
Stock Bonus, Splits & New Listings
2013 2012 2011 2010 2009COMPANY
JAMAICA STOCK EXCHANGE YEAR BOOK 2013
Access Financial Services Limited AFS 9% Unsecured Short Term Notes AMG Packaging & Paper Co Limited Barita Investments Bank of Nova Scotia Berger Paints Blue Power Group Limited C2W Music Limited Cable & Wireless Jamaica Ltd Caribbean Cement Company Capital & Credit Merchant Bank Cargo Handlers Limited Caribbean Cream Limited Caribbean Flavours and Fragrances Limited Caribbean Producers Jamaica Limited Carreras Group Consolidated Bakeries (Jamaica) Limited Courts Jamaica Ltd Dehring, Bunting & Golding Limited Desnoes & Geddes Dolphin Cove Limited Eppley Limited Eppley Limited 9.5% Preference Share General Accident Insurance Company Jamaica Ltd Gleaner Company GraceKennedy Guardian Holdings Ltd Honey Bun (1982) Limited Jamaica Broilers Jamaica Producers Group Jamaica Money Market Brokers Jamaican Teas Limited JAMT Fixed and Floating Secured Notes Kingston Wharves Ltd KLE Group Limited Lasco Distributors Limited Lasco Financial Services Limited Lasco Manufacturing Limited Mayberry Investments Mayberry Investments Limited 12% Medical Disposables & Supplies Limited Montego Freeport NCB Capital Markets 11.75% National Commercial Bank Jamaica Ltd Paramount Trading Jamaica Limited Pegasus Hotels Pulse Investments Limited Radio Jamaica RBTT Financial Holdings Ltd Salada Foods Seprod Limited Scotia Group Jamaica Supreme Ventures Limited Trinidad Cement Ltd
- New
- - - - - - - - - -
New New
- - - - - - -
New New
- - - - - - - - -
New - -
1 For 10 1 For 10 1 For 10
- -
New - - - - - - - - - - - - -
- - -
New - - -
- New
- - -
- - -
- - -
- New
- -
- - -
New - - - - - - - - -
New - - -
- - -
New -
- - -
New - - -
New - - -
-
- -
- - -
- - - - - - - - -
- - -
New
- - -
New
-
- - -
New
- - -
- - -
New
-
New New New
- -
- - -
- - - - - - - - -
New
-
- - -
-
- - -
- - -
- - -
-
- -
- - -
- - - - - - - - -

Issued Price Market Financial Company Capital Dec-31 Capitalisation Year-End Results
Due Date Audited for
56
CORPORATE DATA
Main Market
JAMAICA STOCK EXCHANGE YEAR BOOK 2013
BARITA INVESTMENTS LTD
BERGER PAINTS LTD
CARIBBEAN CEMENT COMPANY LTD
CARRERAS LIMITED
CIBONEY GROUP LTD
DESNOES & GEDDES LTD
FIRST CARIBBEAN INTERNATIONAL BANK LTD
GLEANER COMPANY LTD
GRACEKENNEDY LTD.
GUARDIAN HOLDINGS LTD.
HARDWARE & LUMBER LTD
JA. BROILERS GROUP LTD
JAMAICA MONEY MARKET BROKERS LTD
JA. PRODUCERS GROUP LTD
JAMAICA STOCK EXCHANGE LTD
KINGSTON PROPERTIES LTD
KINGSTON WHARVES LTD
LIME
MAYBERRY INVESTMENTS LTD
MONTEGO BAY ICE COMPANY LTD
NATIONAL COMMERCIAL BANK JAMAICA LTD.
PALACE AMUSEMENT COMPANY (1921) LTD
PAN-JAMAICAN INVESTMENT TRUST LTD
PULSE INVESTMENTS LTD.
RADIO JAMAICA LTD
SAGICOR GROUP JAMAICA LTD
SAGICOR INVESTMENTS JAMAICA LTD
SAGICOR REAL ESTATE X FUND
SALADA FOODS JAMAICA LTD
SCOTIA GROUP JAMAICA LTD
SCOTIA INVESTMENTS JAMAICA LTD.
SEPROD LIMITED
SUPREME VENTURES LTD.
TRINIDAD CEMENT LIMITED
445,001,824
214,322,393
851,136,591
485,440,000
546,000,000
2,809,171,264
1,525,131,934
1,211,243,827
334,723,248
231,899,986
80,842,023
1,199,276,400
1,630,552,530
187,024,006
140,250,000
68,800,102
1,430,199,578
16,817,439,741
1,201,149,291
6,161,510
2,466,762,828
1,437,028
213,231,978
271,789,674
357,476,991
3,760,991,782
552,145,844
1,495,336,750
103,883,290
3,111,572,984
423,194,765
516,397,918
2,637,254,926
249,765,136
47,577,008,142
2.50
1.75
3.50
36.11
0.05
5.10
90.00
1.10
55.07
270.00
6.10
4.53
7.50
19.00
1.80
4.50
6.06
0.16
2.00
17.95
16.38
95.00
53.00
0.87
1.30
10.17
16.00
6.07
8.10
20.15
25.17
10.50
2.78
17.61
1,112,504,560.00
375,064,187.75
2,978,978,068.50
17,529,238,400.00
27,300,000.00
14,326,773,446.40
137,261,874,060.00
1,332,368,209.70
18,433,209,267.36
62,612,996,220.00
493,136,340.30
5,432,722,092.00
12,229,143,975.00
3,553,456,114.00
252,450,000.00
309,600,459.00
8,667,009,442.68
2,690,790,358.56
2,402,298,582.00
110,599,104.50
40,405,575,122.64
136,517,660.00
11,301,294,834.00
236,457,016.38
464,720,088.30
38,249,286,422.94
8,834,333,504.00
9,076,694,072.50
841,454,649.00
62,698,195,627.60
10,651,812,235.05
5,422,178,139.00
7,331,568,694.28
4,398,364,044.96
492,179,964,998.40
30-Sept.
31-Mar.
31-Dec.
31-Mar.
31-May
30-June
31-Oct.
31-Dec.
31-Dec
31-Dec.
31-Dec.
30-Apr.
31-Mar.
31-Dec.
31-Dec.
31-Dec.
31-Dec.
31-Mar.
31-Dec.
31-Dec.
30-Sept.
30-June
31-Dec.
30-June
31-Mar.
31-Dec.
31-Dec.
31-Dec.
30-Sept.
31-Oct.
31-Oct.
31-Dec.
31-Dec.
31-Dec.
29-Nov.
30-May
01-Mar.
30-May
29-Aug
29-Aug.
30-Dec.
01-Mar.
01-Mar.
01-Mar.
01-Mar.
29-Jun
30-May
01-Mar.
01-Mar.
01-Mar.
01-Mar.
30-May
01-Mar.
31-Mar.
29-Dec.
28-Sept.
01-Mar.
29-Aug.
30-May
01-Mar.
01-Mar.
01-Mar.
29-Nov.
29-Jan.
29-Jan.
01-Mar.
01-Mar.
01-Mar.

Issued Price Market Financial Company Capital Dec-31 Capitalisation Year-End Results
CORPORATE DATA
Due Date Audited for
(Cont’d.)
PREFERENCE SHARES
JAMAICA MONEY MARKET BROKERS 7.25%
JAMAICA MONEY MARKET BROKERS 7.5%
JAMAICA MONEY MARKET BROKERS 8.5%
JAMAICA MONEY MARKET BROKERS 8.75%
JAMAICA PUBLIC SERVICE 5%C
JAMAICA PUBLIC SERVICE 5%D
JAMAICA PUBLIC SERVICE 6%
JAMAICA PUBLIC SERVICE 7%
JAMAICA PUBLIC SERVICE 9.5%
PROVEN INVESTMENTS LIMITED 9%
TOTAL
15,358,000
715,482,000
26,322,000
889,073,000
66,500
680,000
300,000
420,000
2,455,607
200,000,000
1,850,157,107.00
2.50
2.00
3.50
3.00
0.36
0.35
0.40
0.39
1,050.14
5.09
38,395,000.00
1,430,964,000.00
92,127,000.00
2,667,219,000.00
23,940.00
238,000.00
120,000.00
163,800.00
2,578,731,134.98
1,018,000,000.00
7,825,981,874.98
30-May
30-May
30-May
30-May
31-Mar.
31-Mar.
31-Mar.
31-Mar.
31-Mar.
30-May
31-Mar.
31-Mar.
31-Mar.
31-Mar.
31-Dec.
31-Dec.
31-Dec.
31-Dec.
31-Dec.
31-Mar.
57JAMAICA STOCK EXCHANGE YEAR BOOK 2013
The Jamaica Stock Exchange
Best Practices
Awards 2013
Best Practices
Awards 2013
Presents its
Best Practices Awards Ceremony
JAMAICA PEGASUS HOTELWednesday, December 3, 2014
Best Practices Awards Ceremony
th0 Annual 1

58
Issued Price Market Financial Company Capital Dec-31 Capitalisation Year-End Results
CORPORATE DATA
Due Date Audited for
Junior Market(Cont’d.)
JAMAICA STOCK EXCHANGE YEAR BOOK 2012
ACCESS FINANCIAL SERVICES LIMITED
AMG PACKAGING & PAPER CO LIMITED
BLUE POWER GROUP LIMITED
C2W MUSIC LIMITED
CARGO HANDLERS LIMITED
CARIBBEAN CREAM LIMITED
CARIBBEAN FLAVOURS & FRAGRANCES LTD
CARIBBEAN PRODUCERS JAMAICA LTD
CONSOLIDATED BAKERIES (JAMAICA) LTD
DERRIMON TRADING COMPANY LTD
DOLPHIN COVE LIMITED
EPPLEY LIMITED
GENERAL ACCIDENT INSURANCE CO JAM.
HONEY BUN (1982) LIMITED
JAMAICAN TEAS LIMITED
KLE GROUP LIMITED
LASCO DISTRIBUTORS LIMITED
LASCO FINANCIAL SERVICES LIMITED
LASCO MANUFACTURING LIMITED
MEDICAL DISPOSABLES & SUPPLIES LTD
PARAMOUNT TRADING (JAMAICA) LTD
TOTAL
Eppley Limited 9.5% Preference Share
TOTAL
Proven Investments Limited
TOTAL
274,509,840
102,378,857
56,499,000
400,000,000
41,625,000
378,568,115
89,920,033
1,100,000,000
222,709,171
273,336,067
392,426,376
796,249
1,031,250,000
94,253,390
168,708,365
100,000,000
3,366,431,150
1,228,102,990
4,087,130,170
263,157,895
154,246,708
13,826,049,376
6 3,253,214,625.00
60,325,600
60,325,600
294,951,884
294,951,884
12.00
3.48
10.00
0.29
13.50
0.89
2.60
2.70
1.16
2.49
8.42
380.00
1.63
3.19
4.00
1.10
1.30
1.28
1.24
2.20
3.55
6.000
0.1300
3,294,118,080.00
356,278,422.36
564,990,000.00
116,000,000.00
561,937,500.00
336,925,622.35
233,792,085.80
2,970,000,000.00
258,342,638.36
680,606,806.83
3,304,230,085.92
302,574,620.00
1,680,937,500.00
300,668,314.10
674,833,460.00
110,000,000.00
4,376,360,495.00
1,571,971,827.20
5,068,041,410.80
578,947,369.00
547,575,813.40
27,889,132,051.12
527,895,078,924.50
361,953,600.00
361,953,600.00
38,343,744.92
38,343,744.92
31-Dec.
31-Aug.
30-Apr.
31-Dec.
30-Sept.
28-Feb.
30-Jun.
30-June
31-Dec.
31-Dec.
31-Dec.
31-Dec.
31-Dec.
30-Sept.
30-Sept.
31-Dec.
31-Mar.
31-Mar.
31-Mar.
31-Dec.
31-May.
31-Dec.
31-Mar.
01-Mar.
30-Oct.
29-Jun
01-Mar.
29-Nov.
29-Apr.
29-Aug.
29-Aug.
01-Mar.
01-Mar.
01-Mar.
31-Mar.
31-Mar.
29-Nov.
29-Dec.
01-Mar.
30-May
30-May
30-May
01-Mar.
30-Jul

59
Top Twenty Companies
Turnover (Sales)
Pre-Tax Profits
COMPANY Profit Before Tax 2013 2012 Change %
COMPANY Turnover2013 2012 Change %
JAMAICA STOCK EXCHANGE YEAR BOOK 2013
GraceKennedy Limited National Commercial Bank Jamaica Ltd. Scotia Group Jamaica Ltd. Sagicor Group Jamaica Limited Supreme Ventures Limited Jamaica Broilers Group Limited LIME Seprod Limited Jamaica Money Market Brokers Limited Desnoes & Geddes Limited Carreras Limited Caribbean Cement Company Limited Lasco Distributors Limited Jamaica Producers Group Limited Sagicor Investments Jamaica Limited Hardware & Lumber Limited Derrimon Trading Company Limited General Accident Insurance Co Ja Kingston Wharves Limited Lasco Manufacturing Limited
67,257,502 48,941,802 44,453,718 42,356,165 34,140,265 26,522,970 19,075,407 13,921,759 13,601,445 12,732,391 12,241,512 12,089,484
8,255,354 7,753,863 6,816,959 6,810,599 5,255,523 4,479,755 4,232,408 3,659,094
61,340,268 44,425,230 41,260,183 35,507,391 29,726,146 23,672,341 20,438,364 12,723,578 11,613,716 13,154,054 11,022,746 9,084,600 7,460,509 6,790,257 7,400,806 6,284,052 4,761,309 3,788,969 3,670,177 3,227,502
9.65% 10.17%
7.74% 19.29% 14.85% 12.04% (6.67%)
9.42% 17.12% (3.21%) 11.06% 33.08% 10.65% 14.19% (7.89%)
8.38% 10.38% 18.23% 15.32% 13.37%
Scotia Group Jamaica Ltd. National Commercial Bank Jamaica Ltd. Carreras Limited Sagicor Group Jamaica Limited GraceKennedy Limited Jamaica Money Market Brokers Limited Scotia Investments Jamaica Ltd. Pan-Jamaican Investment Trust Desnoes & Geddes Limited Sagicor Investments Jamaica Limited Jamaica Broilers Group Limited Seprod Limited Hardware & Lumber Limited Supreme Ventures Limited Lasco Manufacturing Limited Lasco Distributors Limited Jamaica Producers Group Limited Dolphin Cove Limited General Accident Insurance Co Ja Access Financial Services Ltd.
16,255,241 11,007,568
9,287,116 7,014,463 5,075,199 3,647,375 2,796,522 2,624,156 1,871,325 1,472,446 1,190,884 1,118,394
817,717 711,092 640,220 506,833 431,022 342,332 323,702 270,112
14,850,277 13,115,889 3,926,230 6,916,749 4,102,404 2,814,017 2,759,223 2,231,797 1,455,176 2,050,123 1,114,757 1,199,632
125,392 1,453,766
561,209 570,711 272,449 264,916 285,269 237,968
9.46% (16.07%) 136.54%
1.41% 23.71% 29.61%
1.35% 17.58% 28.60%
(28.18%) 6.83%
(6.77%) 552.13% (51.09%)
14.08% (11.19%)
58.20% 29.22% 13.47% 13.51%

60
Top Twenty Companies
After-Tax Profits
COMPANY Profit After Tax 2013 2012 Change %
(Cont’d.)
JAMAICA STOCK EXCHANGE YEAR BOOK 2013
Scotia Group Jamaica Ltd. National Commercial Bank Jamaica Ltd. Carreras Limited Sagicor Group Jamaica Limited GraceKennedy Limited Jamaica Money Market Brokers Limited Pan-Jamaican Investment Trust Scotia Investments Jamaica Ltd. Desnoes & Geddes Limited Sagicor Investments Jamaica Limited Jamaica Broilers Group Limited Seprod Limited Lasco Manufacturing Limited Hardware & Lumber Limited Lasco Distributors Limited Supreme Ventures Limited General Accident Insurance Co Ja Dolphin Cove Limited Access Financial Services Ltd. Jamaica Producers Group Limited
11,517,195 8,549,831 6,538,2446,297,935 3,794,064 3,739,058 2,491,106 1,994,535 1,211,244 1,162,613 1,095,064
905,753 640,220 609,963 506,833 482,569 327,914 322,060 270,112 252,273
10,159,045 10,045,862
2,597,220 5,864,574 3,786,332 2,240,456 2,086,930 1,923,379 1,229,558 1,462,284
936,206 878,761 587,760
2,812 550,377
1,076,886 290,537 250,821 237,968 189,406
13.37% (14.89%) 151.74%
7.39% 0.20%
66.89% 19.37%
3.70% (1.49%)
(20.49%) 16.97%
3.07% 8.93%
21591.43% (7.91%)
(55.19%) 12.86% 28.40% 13.51% 33.19%

61
Corporate Profit Profile
Turnover Profit Before Tax Profit After Tax2013 2012 Change % 2013 2012 Change % 2013 2012 Change %COMPANY
JAMAICA STOCK EXCHANGE YEAR BOOK 2013
Access Financial Services Ltd. AMG Packaging & Paper Company Barita Investments Limited Berger Paints Jamaica Limited Blue Power Group Limited LIME Caribbean Cement Company Limited Caribbean Cream Limited Carreras Limited Cargo Handlers Limited Ciboney Group Limited Consolidated Bakeries Jamaica Limited Derrimon Trading Company Limited Desnoes & Geddes Limited Dolphin Cove Limited Eppley Limited General Accident Insurance Co Ja Gleaner Company GraceKennedy Limited Hardware & Lumber Limited Honey Bun (1982) Limited Jamaica Broilers Group Limited Jamaica Money Market Brokers Limited Jamaica Producers Group Limited Jamaica Stock Exchange Limited Jamaican Teas Limited Kingston Properties Limited Kingston Wharves Limited KLE Group Limited Lasco Distributors Limited Lasco Financial Services Limited Lasco Manufacturing Limited Mayberry Investments Limited Montego Bay Ice Co. Limited National Commercial Bank Jamaica Ltd. Palace Amusement Company (1921) Limited Pan-Jamaican Investment Trust Paramount Trading (Jamaica) Limited Pulse Investments Limited Radio Jamaica Limited Sagicor Investments Jamaica Limited Sagicor Group Jamaica Limited Salada Foods Jamaica Limited Scotia Investments Jamaica Ltd. Scotia Group Jamaica Ltd. Seprod Limited Supreme Ventures Limited Total Caribbean Producers Jamaica Ltd. * C2W Music Limited *FirstCaribbean International Bank (W.I.) * Guardian Holdings Ltd. + Jamaica Public Service Company * Proven Investments Jamaica Limited * Trinidad Cement Limited + * Quoted in United States Dollars US$ + Quoted in Trinidad & Tobago Dollars TT$
761,541 444,468 512,700
1,608,216 1,044,905
19,075,407 12,089,484
675,708 12,241,512
157,489 0
672,945 5,255,523
12,732,391 1,502,209
65,292 4,479,755 3,188,709
67,257,502 6,810,599
701,712 26,522,970 13,601,445
7,753,863 295,554
1,226,435 91,470
4,232,408 333,875
8,255,354 467,730
3,659,094 1,393,675
17,979 48,941,802
862,474 2,106,271
642,129 259,912
1,783,997 6,816,959
42,356,165 634,434
1,914,403 44,453,718 13,921,759 34,140,265
417,964,226
69,36819
622,930 4,969,547 1,099,383
14,419 1,941,049
597,708 357,462 808,980
1,540,689 863,003
20,438,364 9,084,600
431,023 11,022,746
127,508 0
474,554 4,761,309
13,154,054 1,286,639
79,342 3,788,969 3,194,665
61,340,268 6,284,052
611,333 23,672,341 11,613,716 6,790,257
504,301 824,532
78,030 3,670,177
288,461 7,460,509
270,237 3,227,502 1,819,144
16,072 44,425,230
842,189 1,681,803
613,809 241,878
1,828,840 7,400,806
35,507,391 715,609
1,650,905 41,260,183 12,723,578 29,726,146
379,101,031
67,491117
645,529 4,354,178 1,141,595
11,185 1,615,888
27.41% 24.34%
(36.62%) 4.38%
21.08% (6.67%) 33.08% 56.77% 11.06% 23.51%
0.00% 41.81% 10.38% (3.21%) 16.75%
(17.71%) 18.23% (0.19%)
9.65% 8.38%
14.78% 12.04% 17.12% 14.19%
(41.39%) 48.74% 17.22% 15.32% 15.74% 10.65% 73.08% 13.37%
(23.39%) 11.86% 10.17%
2.41% 25.24%
4.61% 7.46%
(2.45%) (7.89%) 19.29%
(11.34%) 15.96%
7.74% 9.42%
14.85% 10.25%
2.78%
(84.08%) (3.50%) 14.13% (3.70%) 28.91% 20.12%
270,112 49,432 70,500 47,091
103,980 (4,646,088)
(3,079) 21,260
9,287,116 84,944 (3,204) 33,115 71,493
1,871,325 342,332
39,051 323,702
91,458 5,075,199
817,717 35,317
1,190,884 3,647,375
431,022 462
99,208 107,058
42 (55,866) 506,833 163,899 640,220 (21,992)
10,822 11,007,568
18,841 2,624,156
83,541 127,899 (79,492)
1,472,446 7,014,463
124,453 2,796,522
16,255,241 1,118,394
711,092 63,977,242
3,087(620)
(24,500) (35,296)
12,242 4,545
52,877
237,968 47,666
347,607 49,402 47,105
(19,927,377) (2,672,105)
31,193 3,926,230
64,557 (6,200)
7,358 25,322
1,455,176 264,916
23,864 285,269
86,885 4,102,404
125,392 41,921
1,114,757 2,814,017
272,449 187,437
66,897 177,638
73 (15,629) 570,711 103,169 561,209 474,103
7,559 13,115,889
22,438 2,231,797
84,127 165,106 146,521
2,050,123 6,916,749
224,252 2,759,223
14,850,277 1,199,632 1,453,766
40,118,239
3,116(604)
74,273 414,334
18,004 3,427
(384,093)
13.51% 3.70%
-79.72% (4.68%)
120.74% 76.68%
(99.88%) (31.84%) 136.54%
31.58% 48.32%
350.05% 182.33%
28.60% 29.22% 63.64% 13.47%
5.26% 23.71%
552.13% (15.75%)
6.83% 29.61% 58.20%
(99.75%) 48.30%
(39.73%) (42.27%) 257.45% (11.19%)
58.86% 14.08%
(104.64%) 43.16%
(16.07%) (16.03%)
17.58% (0.70%)
(22.54%) (154.25%)
(28.18%) 1.41%
(44.50%) 1.35% 9.46%
(6.77%) (51.09%)
59.47%
(0.94%) (132.99%)
132.99% (108.52%)
(32.00%) 32.62%
113.77%
270,112 49,432 70,278 34,083
103,980 (4,919,134)
113,921 13,941
6,538,244 84,947 (3,204) 33,115 49,927
1,211,244 322,060
38,985 327,914
85,842 3,794,064
609,963 35,317
1,095,064 3,739,058
252,273 7,190
93,256 52,496
53 (55,866)506,833 163,899 640,220 102,343
5,145 8,549,831
14,124 2,491,106
73,348 127,899 (36,375)
1,162,613 6,297,935
90,486 1,994,535
11,517,195 905,753 482,569
49,193,414
3,193(620)
(27,493) 45,569
6,977 4,153
58,199
237,968 47,666
254,963 33,317 47,105
(20,235,439) (3,348,265)
31,362 2,597,220
64,560 (6,200)
3,676 15,795
1,229,558 250,821
15,062 290,537 133,532
3,786,332 2,812
41,542 936,206
2,240,456 189,406 129,903
74,749 178,848
63 (13,029) 550,377 102,434 587,760 439,354
(445) 10,045,862
14,663 2,086,930
53,375 165,106
87,407 1,462,284 5,864,574
148,436 1,923,379
10,159,045 878,761
1,076,886 26,085,861
3,042(604)
71,869 352,532
11,657 3,263
(324,340)
13.51% 3.70%
(72.44%) 2.30%
120.74% 75.69%
103.40% (55.55%) 151.73%
31.58% 48.32%
800.83% 216.10% (1.49%) 28.40%
158.83% 12.86%
(35.71%) 0.20%
21591.43% (14.98%)
16.97% 66.89% 33.19%
(94.47%) 24.76%
(70.65%) (16.57%)
(328.78%) (7.91%) 60.00%
8.93% (76.71%)
(1255.43%) (14.89%)
(3.68%) 19.37% 37.42%
(22.54%) (141.62%)
(20.49%) 7.39%
(39.04%) 3.70%
13.37% 3.07%
(55.19%) 88.58%
4.96%
(2.70%) (139.75%)
(87.07%) (40.15%)
27.28%117.94%

62
January February Mar ch Apr il May
Monthly Trading Volume
Ordinary Shares
JAMAICA STOCK EXCHANGE YEAR BOOK 2013
Barita Investments Ltd
Berger Paints Jamaica Ltd
Caribbean Cement Company
Carreras Limited
Ciboney Group
Desnoes & Geddes
First Caribbean International Bank Ltd
Gleaner Company
GraceKennedy Ltd
Guardian Holdings Ltd.
Hardware & Lumber Ltd
Jamaica Broilers Group Ltd
Jamaica Money Market Brokers Ltd
Jamaica Producers Group Ltd
Jamaica Stock Exchange Ltd
Kingston Properties Ltd
Kingston Wharves Ltd
LIME*
Mayberry Investments Ltd
Montego Bay Ice
National Commercial Bank Jamaica Ltd.
Palace Amusement Company (1921) Ltd
Pan-Jamaican Investment Trust Ltd
Pulse Investments Ltd.
Radio Jamaica Ltd
Sagicor Group Jamaica Ltd
Sagicor Investments Jamaica Ltd**
Sagicor Life Jamaica Ltd
Sagicor Real Estate X Fund
Salada Foods Jamaica Ltd
Scotia Group Jamaica Ltd
Scotia Investments Jamaica Ltd
Seprod Limited
Supreme Ventures Limited
Trinidad Cement Ltd.
Total Ordinary (Monthly)
770,867
14,468
1,642,967
6,128,310
2,890,667
8,668
323,518
1,920,621
16,926
3,988,033
4,779,351
17,507
238,629
14,869,009
758,608
5,018,888
200
284,090
977
54,603
170,521
893,379
16,530
2,614,288
951,597
425,387
1,501,439
50,300,048.00
5,500
744,929
1,763,511
6,087,470
2,000
10,591,236
259,998
76,187,346
2,652,950
22,144,867
1,454,008
2,056,804
197,050
134,373
20,845,787
4,747,743
33,771,993
1,776,048
26,000
149,070
30,068
1,196,120
552,818
17,362,791
451,916
1,193,152
2,005,676
20,000
208,411,224.00
173,199
94,997
202,638
1,121,937
63,370
2,359,378
8,888
5,108,333
9,427,724
752
28,831
1,268,432
2,364,465
128,199
1,055,200
270,017
4,507,938
12,928,673
3,369,851
1,427,396
1,100
633,603
262,880
3,975,414
1,387,160
3,403,662
841,909
127,198
378,505
168,400
57,090,049.00
239,900
404,817
764,773
869,099
50,000
1,015,766
5,986
3,261,779
1,667,596
22,278
1,107,920
6,650,809
31,218
3,820
97,662
2,507,087
2,999,369
976,588
108,088
344,635
242,778
1,515,089
14,340
4,227,021
261,626
874,209
519,672
500
30,784,425.00
191,256
556,983
614,066
806,174
1,000
516,257
2,537
6,216,230
842,017
88,447
1,262,018
1,900,115
398,362
458,550
365,350
4,186,123
2,704,620
2,566,276
540,553
3,000
77,897
5,507,097
3,391,957
8,260
8,386,716
912,807
113,563
7,449,069
50,067,300.00

63
June July August September October November December Yearly Total
Monthly Trading Volume(Cont’d.)
JAMAICA STOCK EXCHANGE YEAR BOOK 2013
90,537
2,798,487
1,768,876
2,174,710
208,035
6,307,360
28,740
1,581,447
1,979,656
45,854
4,404,459
20,700,267
55,181
100
674,000
45,982,812
1,059,373
132,177
5,547,669
221
223,344
6,465,582
1,003,334
5,894,192
41,760
3,500,170
2,121,267
939,476
71,157,484
186,886,570.00
74,731
123,185
4,894,066
19,266,326
15,880
9,113,813
10,051
2,413,000
1,870,064
80,000
13,027,951
6,910,869
2,055,939
2,218
244,662
7,037,928
2,396,683
6,521,614
466,642
60,999
603,498
57,643
4,706,276
8,177,254
473,646
1,072,916
807,953
92,485,807.00
99,281
493,899
2,578,804
815,341
1,345,942
1,703
1,994,601
336,285
113,000
528,224
23,024,179
1,831,855
1,023,015
27,471
788,732
49,815,588
900,348
5,760,485
133,965
135,600
145,787
277,385
1,924,165
5,740
4,071,824
161,519
1,912,163
1,067,034
101,313,935.00
42,519
260,024
1,623,999
499,524
147,106
658,060
1,414,234
213,230
3,792,589
15,939,403
76,438
351,300
90,629
155,662
27,857,015
797,327
2,992,545
98,868
14,000
39,040
245,110
3,143,994
200,000
4,825,939
168,390
323,664
2,362,487
68,333,096.00
512,900
620,618
3,648,511
689,621
1,510,292
439,174
20,000
8,226,478
4,229,169
204,759
15,523,224
3,317,986
17,515,859
24,050
7,500
128,908
8,443,195
1,117,538
10,427,036
4,952,500
14,753,329
557,162
4,139,084
114,148
18,776,438
268,484
2,815,056
2,214,479
125,197,498.00
15,710
218,660
738,961
13,158,704
30,300
2,427,933
25,325
1,909,067
732,664
33,910
3,890,604
4,294,635
76,132
10,000
245,751
3,772,033
3,577,237
648,770
82,466
3,536,906
921,661
1,188,166
207,966
32,000
20,701,287
497,689
19,536
658,805
63,652,878.00
30,873
1,397,693
7,161,414
190,359
23,437
676,561
100
721,367
3,467,107
2,000
464,560
9,177,704
29,022
4,950
950
110,353
21,229,034
16,239,045
128,419,717
152,903
2,200
307,831
600,725
12,686
336,223
115,645
3,966,701
562,921
1,599,550
233,950
404
197,237,985.00
2,247,273
7,728,760
27,402,586
51,807,575
2,051,420
38,342,147
371,996
109,357,400
29,339,083
752
636,005
71,402,881
100,513,791
24,272,516
1,415,533
1,841,270
3,454,099
211,053,549
50,226,564
132,177
206,021,432
421
10,246,863
243,876
27,111,781
600,725
9,288,325
32,304,059
323,611
2,372,756
100,014,091
7,673,771
11,415,870
90,356,553
189,304
1,231,760,815

64
January February Mar ch Apr il May
Preference Shares
Monthly Trading Volume(Cont’d.)
JAMAICA STOCK EXCHANGE YEAR BOOK 2013
C & W Ja. 5.5% C & W Ja. 6% JMMB 8.50% JMMB 8.75% JMMB 7.25% JMMB 7.50% J.P.S 5% C J.P.S 5% D J.P.S 6% J.P.S 7% J.P.S 9.5% Jamaica Stock Exchange Var. Pref. Proven Investments Limited 8% Total Preference (Monthly) Monthly Total
1,070,729
27,606 90,000
1,188,335
51,488,383
152,795 1,133,481
144,652 363,050
1,793,978
210,205,202
2,598,600
2,288 19,324,882
21,925,770
79,015,819
110,000 3,023,472
1,740
1,312 7,708,604
10,845,128
41,629,553
1,285,505
17,694,877 18,980,382
69,047,682
Access Financial Services Limited AMG Packaging & Paper Company Limited Blue Power Group Limited C2W Music Limited Cargo Handlers Limited Caribbean Cream Limited* Caribbean Flavours and Fragrances Limited* Caribbean Producers Jamaica Limited Consolidated Bakeries (Jamaica) Limited Derrimon Trading Company Limited* Dolphin Cove Limited Eppley Limited* General Accident Insurance Co. (Jamaica) Ltd Honey Bun (1982) Limited Jamaican Teas Limited K.L.E. Group Limited Lasco Distributors Limited Lasco Financial Services Limited Lasco Manufacturing Limited Medical Disposables & Supplies Limited* Paramount Trading (Jamaica) Limited Monthly Total U SD Equities Market Proven Investments Limited J unior Market Preference Shares Eppley Limited 9.5%*
January February Mar ch Apr il May
Junior Market
*formerly Cable & Wireless (Jamaica) ** formerly Pan Caribbean Financial Services New listings *Caribbean Cream Limited was listed on May 17, 2013 *Eppley Limited was listed on July 29, 2013
*Eppley Limited 9.5% PREF SHARE was listed on December 12, 2013 *Caribbean Flavours & Fragrances Limited was listed on October 14, 2013 *Derrimon Trading Company Limited was listed on December 17 2013 *Medical Disposables & Supplies Limited was listed on December 24, 2013
211,959 197,527 273,314
80,500 2,165
1,052,346 2,116,187
130,900
631,815 224,244
2,626,252 170,074
1,458,546 223,498 705,908
3,499,872
13,605,107
683,850
538,198 741,804
50,706 2,500
70,472
2,636,351 1,201,836
1,127,778
3,166,007
125,077 152,014
20,177 215,935 911,222
1,936,936
1,791,150 14,688,163
4,765,765
14,020,644 257,016 137,772
420
1,538,801 213,100
15,011
1,312,490
142,781 15,579
536,251 414,450 333,178
625,960
19,563,453
12,875,302
311,500 513,463 916,003
1,717,578
297,063
3,938,426 408,080
4,659,062 330,983
2,464,952 1,655,671 5,475,771
3,256,739
25,945,291
1,799,383
1,766,057 732,300
1,008,660
28,111 4,056,843
1,858,401
33,690,154
3,395,920
1,978,660 298,285 800,151 303,774 999,046 988,856
1,758,576
340,252 54,004,046
14,477,261

65
(Cont’d.)
Monthly Trading Volume
Preference Shares
June July August September October November December Yearly Total
JAMAICA STOCK EXCHANGE YEAR BOOK 2013
1,563,986
6,459,929 8,023,915
194,910,485
34,500 698,593
17,393,675 18,126,768
110,612,575
6,200 948,452
9,419,688 10,374,340
111,688,275
21,811
3,571,693
21,946,620 25,540,124
93,873,220
10,494 3,815,074
12,253 6,911,711
14,469,771 25,219,303
150,416,801
103,000 1,401,751
5,016,289
734,091 7,255,131
70,908,009
4,100 4,099,697
876,000
425,600 5,405,397
202,643,382.00
0 0
442,900 25,211,033
12,253 12,804,000
0 0 0
1,740 0
175,858 116,030,787 154,678,571
1,386,439,386
June July August September October November December Yearly Total
Junior Market
123,197 481,163
2,290,337
85,540 3,040,757
7,628,711 1,378,912
1,235,289
3,265,679
125,207 231,386
6,818 8,075,065 2,787,402 7,787,541
498,905
39,041,909
748,100
123,776 659,483 883,529
2,880
130,455,140
2,292,805 58,400
101,368
1,886,643
13,268 189,694 140,000
14,849,717 10,982,447 11,310,588
170,962
174,120,700
1,971,213
555,737 17,000
249,517 200
14,568 1,499,990
920,988 713,662
94,893
3,809,283
61,896 1,327,039
124,231 4,746,747 5,875,343 2,302,285
95,214
22,408,593
3,698,340
473,341 198,450 304,533 155,000
4,256 1,064,976
2,119,967
381,734
1,487,732
1,164,547 46,000
2,176,795 44,229
8,611,924 17,815,796
2,509,576
332,441 38,891,297
724,950
626,453 28,500
123,309 44,000 11,472
1,962,293 2,066,149 6,500,991
166,510
2,379,943 5,300
797,161 56,642
1,370,728 10,000
4,159,122 5,390,100 4,798,590
184,573
30,681,836
861,047
366,428 5,000
163,316 2,399,170
754 184,676
94,023 2,142,496
841,001
242,688
1,316,513 10,333
643,541 56,187
2,335,100 4,350,174 4,098,137
170,958
19,420,495
232,686
113,468 408,600 254,081 118,620 154,955
6,574,420 34,920
4,391,706 306,908
3,855,371 44,543
157,453 188,209
698
2,660,669 1,448,112 2,495,850 2,009,798
135,197 25,353,578
9,235,853
9,000
19,230,758 4,240,306 6,655,077 2,799,990
375,593 148,839,095
2,195,092 34,801,141 41,068,404
3,855,371 10,553,128
5,300 23,424,677
1,700,022 14,192,939
1,206,473 51,113,074 52,843,071 45,512,936
2,009,798 11,102,223
477,724,468
52,073,750
9,000

66
Monthly Trading Value Ja.$(000)
Ordinary Shares
January February Mar ch Apr il May
JAMAICA STOCK EXCHANGE YEAR BOOK 2013
Barita Investments Ltd
Berger Paints
Caribbean Cement Company
Carreras Limited
Ciboney Group
Desnoes & Geddes
First Caribbean International Bank
Gleaner Company Ltd
GraceKennedy Ltd
Guardian Holdings Ltd.
Hardware & Lumber Ltd
Jamaica Broilers Group
Jamaica Money Market Brokers Ltd
Jamaica Producers Group Ltd
Jamaica Stock Exchange Ltd
Kingston Properties Ltd
Kingston Wharves Ltd
LIME*
Mayberry Investments Ltd.
Montego Bay Ice
National Commercial Bank Jamaica Ltd.
Palace Amusement Ltd
Pan-Jamaican Investment Trust
Pulse Investments Ltd.
Radio Jamaica Ltd
Sagicor Group Jamaica Ltd
Sagicor Investments Jamaica Limited**
Sagicor Life Jamaica Ltd
Sagicor Real Estate X Fund
Salada Foods Jamaica Ltd
Scotia Group Jamaica Ltd
Scotia Investments Jamaica Ltd
Seprod Limited
Supreme Ventures Ltd
Trinidad Cement Ltd.
Total Ordinary (Monthly)
2,533,436.93
39,455.60
1,647,716.01
307,496,687.94
11,562,519.37
979,481.05
399,162.54
95,714,257.62
55,131.86
19,319,008.26
39,699,002.48
285,771.94
1,195,570.63
2,443,126.76
1,901,183.90
107,881,783.85
15,500.00
16,230,740.67
977.00
100,338.05
3,504,500.47
8,882,883.29
140,073.50
56,845,739.38
25,824,699.33
6,966,922.25
3,673,615.75
715,339,286
17,262.50
1,562,411.35
1,624,413.84
323,156,791.48
60.00
41,720,735.50
28,615,141.00
91,390,469.71
130,280,617.82
100,425,223.54
11,202,097.75
30,853,182.29
739,087.50
727,864.40
3,840,131.76
10,604,340.72
652,132,750.77
96,092,495.47
26,200.00
213,899.00
498,374.00
9,012,813.06
4,698,467.60
333,054,692.33
11,335,999.54
17,009,659.80
4,824,636.64
366,600.00
1,906,026,419
584,266.60
180,367.06
177,622.68
59,203,924.37
2,474.80
9,563,382.32
942,128.00
5,778,882.54
448,562,989.38
203,040.00
123,664.85
5,740,739.70
16,708,509.26
1,931,569.30
4,120,800.00
1,467,310.56
830,604.89
25,935,202.37
65,011,773.48
70,600,725.01
1,760.00
829,083.90
3,887,660.21
27,897,798.35
11,797,460.00
66,480,973.82
19,230,605.26
1,843,949.20
955,333.61
2,624,072.00
853,218,674
796,529.00
786,229.65
565,900.09
47,832,370.95
1,231.00
4,144,204.52
607,194.00
3,865,609.34
90,544,788.18
88,819.80
5,067,416.63
45,420,106.29
471,890.28
15,280.00
549,676.25
443,816.21
6,023,914.92
17,625,750.69
5,420,573.06
465,429.70
3,637,497.10
11,533,891.45
127,387.50
87,403,214.68
5,933,884.80
11,745,947.90
1,325,117.18
7,800.00
352,451,471
574,340.32
1,239,777.09
399,854.67
46,747,179.82
25.00
2,280,005.74
261,311.00
7,543,806.34
48,290,774.07
349,365.65
5,790,513.54
15,896,850.70
6,706,851.57
2,067,975.00
2,455,565.38
680,785.16
5,560,125.45
47,876,859.15
29,036,635.60
4,730.00
96,457.29
85,545,863.75
27,077,770.27
74,340.00
181,509,927.36
22,019,826.78
1,661,662.82
20,932,607.10
562,681,787

67
June July August September October November December Yearly Total
Monthly Trading Value Ja.$(000)(Cont’d.)
Ordinary Shares
JAMAICA STOCK EXCHANGE YEAR BOOK 2013
228,682.67
6,848,438.62
1,685,644.54
120,547,750.89
14,882.45
30,982,308.80
2,904,498.93
1,851,115.08
115,433,353.48
178,202.40
20,816,354.45
184,056,534.85
1,018,729.98
450.00
5,269,874.12
7,773,536.66
2,749,415.23
2,372,577.15
112,685,017.38
20,995.00
11,914,869.13
8,561,722.87
16,144,908.64
51,946,582.99
376,675.20
76,200,181.24
55,176,590.39
13,688,878.37
206,561,158.90
1,058,009,930
191,168.43
278,036.85
4,828,994.32
1,005,308,771.05
1,111.60
43,453,599.27
1,016,256.61
2,836,694.91
105,153,487.15
365,000.00
65,274,397.44
57,120,293.79
39,355,198.70
7,208.50
1,935,865.86
993,049.85
6,231,551.90
126,830,884.62
24,047,825.44
57,339.06
775,970.40
992,237.00
40,604,214.74
177,820,965.87
12,509,633.40
15,823,171.65
2,434,683.20
1,736,247,612
239,458.61
1,111,382.75
5,724,396.57
40,513,975.11
6,085,518.00
171,153.00
2,369,918.70
19,082,883.49
511,200.00
2,658,766.38
187,016,106.85
33,315,625.82
3,035,532.95
123,720.71
5,927,094.44
8,331,614.26
2,342,725.81
110,203,638.35
6,851,703.54
120,140.00
186,637.20
4,592,545.05
16,647,027.77
49,660.00
87,644,702.79
4,322,011.86
28,095,256.50
3,058,463.15
580,332,860
106,067.50
587,579.74
3,734,250.72
23,590,719.30
8,826.36
2,988,651.55
1,676,246.86
12,048,442.35
18,913,981.78
128,934,394.84
1,395,071.50
1,051,150.00
407,830.50
1,045,650.30
4,851,027.68
2,077,265.40
55,951,804.97
5,045,003.65
12,180.00
50,889.35
4,060,831.32
27,089,918.87
1,700,000.00
104,778,808.16
4,536,514.18
4,508,501.35
6,145,535.10
417,297,143
1,229,820.00
1,393,998.06
7,978,714.64
28,108,622.99
74,940.72
1,981,130.78
2,000,000.00
9,628,281.07
238,190,464.96
921,319.35
66,180,704.64
27,529,576.87
323,351,082.70
68,542.50
33,750.00
747,409.58
1,501,538.64
2,771,855.94
184,991,943.48
242,313,680.01
19,400,026.67
9,014,775.01
36,513,604.22
966,300.20
386,885,637.35
7,094,645.70
39,121,583.15
5,733,500.55
1,645,727,449.78
32,031.40
430,769.68
1,664,725.83
462,589,540.38
1,612.00
11,509,744.96
2,289,457.33
2,128,954.52
41,101,645.25
147,217.60
16,823,737.62
35,277,191.98
1,389,803.25
23,500.00
1,466,087.99
582,607.40
6,981,671.84
11,245,222.39
3,964,689.01
4,769,407.80
14,732,808.60
9,338,427.62
1,105,820.57
259,000.00
368,647,263.31
13,074,398.13
229,935.00
1,710,846.36
1,013,518,118
70,661.10
2,451,488.63
17,690,213.14
6,834,816.66
923.11
3,261,264.33
9,000.00
803,570.43
200,238,048.29
11,200.00
1,976,971.77
69,042,401.21
535,195.73
8,910.00
4,275.00
667,743.11
3,404,080.26
32,474,147.98
2,205,857,611.25
7,400,305.75
1,914.00
400,180.30
4,973,646.13
200,181.28
2,735,216.80
696,599.79
77,798,022.92
14,951,827.84
17,562,206.00
606,295.51
7,114.44
2,672,676,033
6,603,725
16,909,935
47,722,447
2,471,931,151
106,087
169,533,065
39,795,621
130,272,712
1,544,641,752
203,040
2,751,122
328,987,816
817,903,067
440,609,973
4,194,844
7,513,169
23,455,713
35,675,920
105,653,401
2,372,577
3,698,295,040
36,495
518,919,246
225,240
35,850,043
4,973,646
146,812,182
269,280,149
1,802,420
20,189,364
2,005,070,129
196,010,637
158,257,674
257,961,793
3,005,586
13,513,526,782

68
January February Mar ch Apr il May
Preference Shares
Monthly Trading Value Ja.$(000)(Cont’d.)
JAMAICA STOCK EXCHANGE YEAR BOOK 2013
C & W Ja. 5.5% C & W Ja. 6% J.M.M.B. 7.25% J.M.M.B. 7.50% J.M.M.B. 8.50% J.M.M.B. 8.75% J.P.S 5% C J.P.S 5% D J.P.S 6% J.P.S 7% J.P.S 9.5% Jamaica Stock Exchange Var Pref Proven Investments Limited 8% Total Preference (Monthly) Monthly Total
3,479,869.25
52,175.34 448,821.40
3,980,866
719,320,152.42
534,982.50 3,683,520.25
273,214.40 1,823,719.50
6,315,437
1,912,341,856.02
8,382,773.14
4,324.32 97,766,322.43
106,153,420
959,372,093.41
385,000.00 9,675,860.40
679
2,479.68 39,232,835.56
49,296,854
401,748,325.41
4,126,875.26
89,319,006 93,445,881
656,127,667.51
January February Mar ch Apr il May
Junior Market
* Formerly Cable & Wireless (Jamaica) ** Formerly Pan Caribbean Financial Services
Access Financial Services Limited Amg Packaging & Paper Company Limited Blue Power Group Limited C2W Music Limited Cargo Handlers Limited Caribbean Cream Limited* Caribbean Flavours and Fragrances Limited* Caribbean Producers Jamaica Limited Consolidated Bakeries (Jamaica) Limited Derrimon Trading Company Limited* Dolphin Cove Limited Eppley Limited* General Accident Insurance Co. (Jamaica) Ltd Honey Bun (1982) Limited Jamaican Teas Limited K.L.E. Group Limited Lasco Distributors Limited Lasco Financial Services Limited Lasco Manufacturing Limited Medical Disposables & Supplies Limited* Paramount Trading (Jamaica) Limited Monthly Total Junior Preference Shares Eppley Limited 9.5%* U SD Equities Market Proven Investments Limted
1,286,969.76 770,389.75
1,612,465.18 97,405.00 23,815.00
2,363,639.95 3,979,525.68
976,280.46
1,137,752.89 855,017.84
10,507,350.65 628,733.80
16,093,449.58 1,124,387.90 7,728,406.78
11,827,240.72
61,012,830.94
68,274.41
3,618,112.20 2,823,725.10 256,301.00 2,925.00
706,089.44
5,807,632.24 2,185,825.54
8,745,165.80
4,911,460.68 475,684.75 584,577.24 74,654.90 2,050,889.79 5,138,561.48 19,770,514.62
5,272,830.06
62,424,949.84
471,879.16
80,931,417.44 927,072.60 715,399.20
4,221.00
3,078,614.37 341,114.00
120,156.40
2,035,717.92 531,938.40 58,067.85
5,551,263.05 2,507,503.35 3,489,658.50
2,016,681.27 102,308,825.35
1,353,643.43
2,134,517.48 1,869,565.70 5,037,517.40 3,367,491.49 2,345,552.90 5,710,568.40 1,490,262.67 18,263,657.87 1,085,141.00 24,003,688.29 11,710,272.42 57,000,888.78 10,360,885.15 144,380,009.55 197,909.44
12,430,586.74 2,964,406.64 6,097,575.68 283,653.33 4,366,912.74 4,057,101.59 32,483,630.90 27,570,186.23 3,455,849.36 1,181,243.29 3,362,315.20 832,616.15 11,237,801.00 8,460,520.07 20,696,494.77 1,124,256.80 140,605,150.49 1,596,288.98

69
June July August September October November December Yearly Total
Monthly Trading Value Ja.$(000)(Cont’d.)
Preference Shares
JAMAICA STOCK EXCHANGE YEAR BOOK 2013
4,865,232.97
32,874,354 37,739,587
1,095,749,517.10
122,475.00 2,204,196.00
88,323,739 90,650,410
1,826,898,021.86
22,632 2,861,333
47,926,212 50,810,177
631,143,036.58
76,632.61 10,715,127.38
111,706,182.80 122,497,943
539,795,086.12
30,632.50 13,825,422.00
36,729.00 11,428,575.34
73,645,148.79 98,966,508
1,744,693,957.41
10,032,578.00 360,500.00
4,140,523.60
3,738,000.58 18,271,602
1,031,789,720.0
1,752,000.00 14,350.00 12,115,355.00
2,171,653.96 16,053,359
2,688,729,391.72
0 0
30,633 25,610,000
1,553,301 77,679,242
0 0 0
679 0
332,194 588,975,996 694,182,043
14,207,708,826
June July August September October November December Yearly Total
Junior Market
991,882.00 2,049,009.36
20,370,009.90
901,967.00 3,234,841.62
16,431,294.72 1,827,470.27
10,440,252.60
6,392,204.48 500,747.30 1,026,727.18 18,408.60
121,936,343.59 29,435,192.51 118,062,358.09
1,749,269.70 335,367,978.92
83,385.73
1,040,108.79 2,800,951.75 9,052,808.89
37,440.00
142,914,048.15
4,654,627.02 79,861.70
870,199.80
3,734,182.06 53,072.00 801,134.74 358,275.48
31,998,461.04 22,672,677.70 35,551,869.55
565,174.60
257,184,893.27
228,664.02
4,628,370.75 68,000.00 2,460,817.60 200.00
185,577.30 1,584,523.86
1,871,255.13 1,001,614.28
834,585.40
7,119,971.72 221,686.00 5,445,931.24 217,371.32 7,074,407.75 8,581,896.54 3,634,908.93
314,349.98
45,245,467.80
433,320.31
3,961,584.76 793,800.00
2,921,243.85 150,350.00 57,434.00
1,088,503.21
4,399,618.14 497,779.25
12,559,615.00
2,051,276.26 156,800.00 9,511,691.42 71,308.69
12,704,702.06 22,006,225.22 3,984,391.31
1,096,315.30
78,012,638.47
83,725.76
5,190,457.00 108,925.00 1,150,685.44 40,920.00 154,363.40 1,998,167.62 5,732,017.92 13,525,547.17 205,249.30
19,752,202.13 2,014,000.00 1,303,739.50 173,484.86 5,347,000.20 14,000.00 6,065,835.07 6,466,186.00 7,203,398.36
581,079.52
77,027,258.49
102,562.40
3,473,802.24 17,500.00
1,520,144.80 1,659,768.00 9,802.00
174,195.42 243,644.45 4,291,859.17 1,069,009.40
1,984,234.64
2,113,143.11 31,641.65
2,316,747.60 74,685.70
3,364,551.85 4,413,524.16 5,521,378.05
565,516.40
32,845,148.64
27,886.11
1,189,127.80 1,423,179.00 2,512,962.94 39,898.00
2,091,892.50 6,560,745.92 87,910.00
10,652,938.52 396,279.60
9,377,365.55 376,554.59
255,679.38 578,819.54 2,792.00
3,720,904.31 1,826,941.74 3,513,093.19 4,411,799.37 477,537.99
49,496,421.94
54,000.00
1,121,084.36
120,876,937 16,616,525 53,707,932
1,991,466 4,456,255
161,921,939 6,063,572
74,501,620 44,067,360
9,377,366 86,574,986
2,014,000 40,221,546
6,250,398 57,227,993
3,375,196 245,802,297 124,343,889 286,157,361
4,411,799 35,951,137
1,385,911,574
54,000
5,768,624.11

70JAMAICA STOCK EXCHANGE YEAR BOOK 2013

71
Understanding Terms and References
T
ACKNOWLEDGEMENT
he policy used to guide the process of compiling statistics relating to each company requires that the data be arranged to mirror the published accounts of the respective company.
The statistics are based on the audited financial statements of the companies under review. The figures given for the highest and lowest (share prices) relate to the highest and lowest prices for the calendar year. The closing stock price relates to closing price at the company's year-end.
The Jamaica Stock Exchange's Year Book is intended to be a general reference book and does not, by itself, provide answers to all the questions which should be asked about shares and their prospects. Detailed evaluation of a particular company should not be made without consulting a stockbroker or investment advisor.
International Securities Identification Number (ISIN) appears beside the name of each listed company. These numbers uniquely identify the securities internationally.
1. Shareholders' Equity includes share capital, which takes into account preference share, revenue and capital reserves, but excludes minority interest. 2. Return on Equity is calculated based on average capital (average of capital at beginning of year and capital at year-end) in use for the year, including preference stock. 3. Gearing Debt includes interest bearing debts only, for example, bank loans, overdraft and long term liabilities. 4. After Tax Profits represent profit after taxation as reported by the annual reports of the listed companies. 5. Price Earnings Ratio is calculated using closing stock price at the companies' financial year end. 6. Earnings Per Share (EPS) reflects EPS as reported by companies. EPS and closing price per share are quoted in Jamaican dollars, except for First Caribbean International Bank (FCIB); Guardian Holdings Ltd., Trinidad Cement Ltd., where the quotations are in Barbados or TT dollars, except for closing stock which is in Jamaican dollars. 7. Operating Profit Margin is calculated using Turnover and Pre-tax Profit as reported in the financial statements of the listed companies. 8. Balance Sheet and Profit and Loss figures are quoted in thousands. 9. Previously published financial data, which is included in this report, may reflect adjustments made subsequent to publication. 10. The Jamaica Stock Exchange relies on the listed companies for information to ensure the accuracy of the book's content. Where information, such as telephone numbers or corporate data, is not received on time for publication, data in the previous year's publication is utilized or the information is omitted. LEGEND: n/a = Figures were not made available for publication. * = Re-stated * = Company was de-listed
The Jamaica Stock Exchange Year Book is an annual publication of the Jamaica Stock Exchange. It is distributed free of cost to local and international investors. We are grateful to all our advertisers for their consistent support. The team behind the publication:
Marketing & Communications Market Operations & TradingNeville Ellis – Marketing Manager Riccalya Robb – Trading ManagerMichael Johnson – Senior Marketing Officer Ferris Jackson – Trading OfficerDavia Eastman – Marketing Officer Charlette Eddie-Nugent – Communications Officer
Marlene Street Forrest – General ManagerRobin Levy – Deputy General Manager
JAMAICA STOCK EXCHANGE YEAR BOOK 2013

Financial Year End December 31
Access Financial Services Ltd (AFS JMP004681012)
Board of Directors
Secretary
Registrar &Transfer Agent
Principal Activities
Financial Data
2013 2012 2011 2010 2009 2007
Website
Listed Date October 30, 2009
BALANCE SHEET (000)
No. of Shares issued
($000)
Shareholders' Equity
Long Term Liability
Gearing Debt
Current Assets
Current Liabilities
PROFIT & LOSS ($000)
Turnover
% incr. over prior yr
Pre-tax Profit
% incr (decr.) over prior yr.
Aftertax Profit (Loss)
% incr. over prior yr.
Extraordinary items
IMPORTANT RATIOS
Debt/Equity
Current Ratio
Return on Equity
Earnings Per Share
Closing Stock Price
P.E. Ratio
CORPORATE INFORMATION AND FINANCIAL DATA
Operating Profit (Loss) Margin
Jamaica Central Securities Depository Ltd. 40 Harbour Street, Kingston
A provider of micro, small and medium sized business loans and personal loans. The Company also offers hire purchase facilities, as well as remittance, cambio and bill payment services.
Gary Peart
www.accessfinanceonline.com
Brian Goldson (Chairman); Marcus James (CEO); Gary Peart (Company Secretary) Christopher Berry; Alexander Johnson
72JAMAICA STOCK EXCHANGE YEAR BOOK 2013
274,510
605,559
166,874
542,958
1,254,714
489,856
761,541
27.41
270,112
13.51
270,112
13.51
0.90
2.56
44.85
35.47
0.98
12.00
12.24
274,510
598,976
32,616
212,660
946,385
248,306
597,708
41.27
237,968
46.83
237,968
46.83
0.36
3.81
43.94
39.81
0.87
6.20
7.13
274,510
484,247
44,323
276,002
791,502
267,777
423,108
10.51
162,070
10.10
162,070
10.10
0.57
2.96
36.36
38.30
0.59
4.60
7.80
274,510
407,275
19,773
228,773
661,497
231,244
382,869
27.93
147,206
73.69
147,206
123.04
0.56
2.86
43.23
38.45
0.54
5.00
9.26
27,451
273,794
104,502
308,060
477,044
230,184
299,284
35.52
84,750
65.68
65,999
100.76
1.13
2.07
33.96
28.32
0.24
27.51
114.63
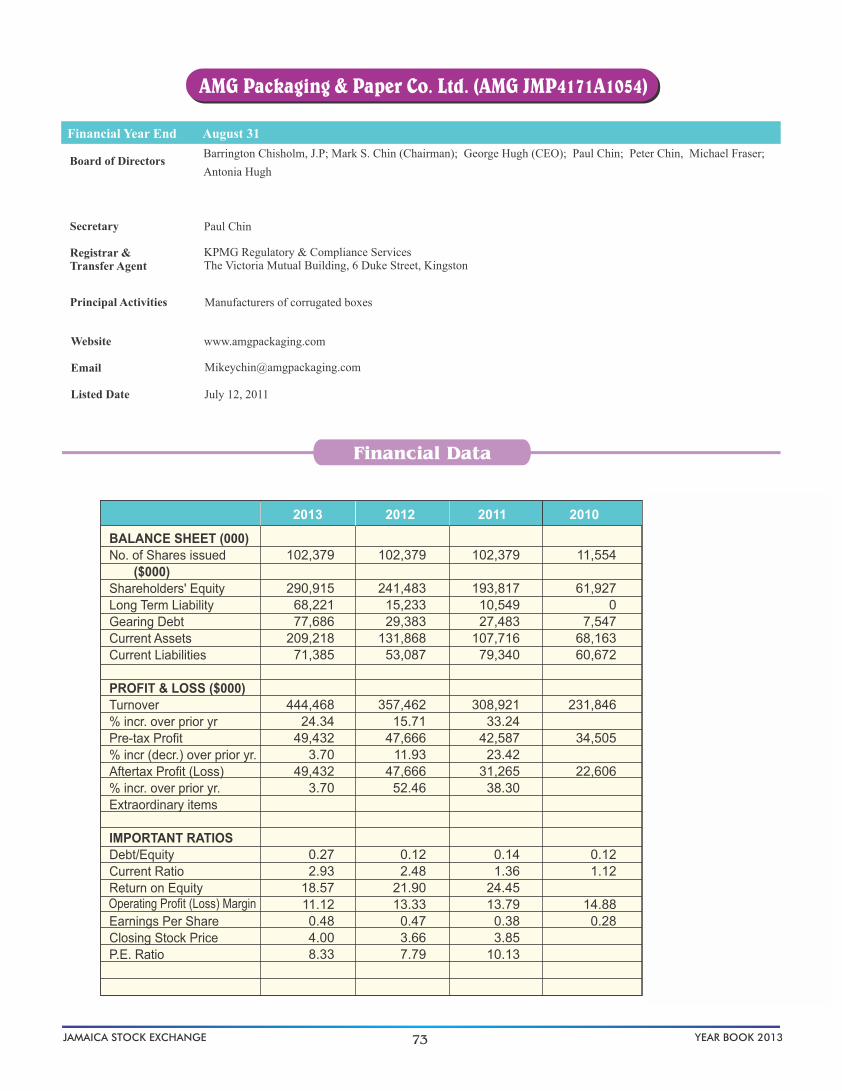
Financial Year End August 31
Financial Data
Board of Directors
Secretary
Registrar &Transfer Agent
Principal Activities
Website
Listed Date July 12, 2011
73
Barrington Chisholm, J.P; Mark S. Chin (Chairman); George Hugh (CEO); Paul Chin; Peter Chin, Michael Fraser;
Antonia Hugh
2013 2012 2011 2010 2009 2008
BALANCE SHEET (000)
No. of Shares issued
($000)
Shareholders' Equity
Long Term Liability
Gearing Debt
Current Assets
Current Liabilities
PROFIT & LOSS ($000)
Turnover
% incr. over prior yr
Pre-tax Profit
% incr (decr.) over prior yr.
Aftertax Profit (Loss)
% incr. over prior yr.
Extraordinary items
IMPORTANT RATIOS
Debt/Equity
Current Ratio
Return on Equity
Earnings Per Share
Closing Stock Price
P.E. Ratio
Operating Profit (Loss) Margin
Paul Chin
KPMG Regulatory & Compliance Services The Victoria Mutual Building , 6 Duke Street , Kingston
Manufacturers of corrugated boxes
www.amgpackaging.com
AMG Packaging & Paper Co. Ltd. (AMG JMP4171A1054)
JAMAICA STOCK EXCHANGE YEAR BOOK 2013
102,379
290,915
68,221
77,686
209,218
71,385
444,468
24.34
49,432
3.70
49,432
3.70
0.27
2.93
18.57
11.12
0.48
4.00
8.33
102,379
241,483
15,233
29,383
131,868
53,087
357,462
15.71
47,666
11.93
47,666
52.46
0.12
2.48
21.90
13.33
0.47
3.66
7.79
102,379
193,817
10,549
27,483
107,716
79,340
308,921
33.24
42,587
23.42
31,265
38.30
0.14
1.36
24.45
13.79
0.38
3.85
10.13
11,554
61,927
0
7,547
68,163
60,672
231,846
34,505
22,606
0.12
1.12
14.88
0.28

74
Financial Year End September 30
Barita Investments Limited (BIL JMP161681094)
Financial Data
2013 2012 2011 2010 2009 2008
Board of Directors
Secretary
Registrar &Transfer Agent
Subsidiaries
Principal Activities
Website
Listed Date January 14, 2010
BALANCE SHEET (000)
No. of Shares issued
($000)
Shareholders' Equity
Total Liabilities
Total Assets
Fixed Assets
PROFIT & LOSS ($000)
Turnover
% incr. over prior yr
Pre-tax Profit
% incr. over prior yr.
Aftertax Profit
% incr. over prior yr.
IMPORTANT RATIOS
Debt/Equity Ratio
Debt to Assets Ratio
Return on Equity
Operating Profit Margin
Earnings Per Share
Closing Stock Price
P.E. Ratio
Rita Humphries-Lewin (Chairman); Karl Lewin - Managing Director, Barita Unit Trusts Carl Domville - Audit Committee Chairman; Anthony Jenkinson; Paul Cooper John Minott - Deputy Chairman; Ian McNaughton (Company Secretary & General Manager)
Ian McNaughton
Jamaica Central Securities Depository Limited40 Harbour Street , Kingston Barita Unit Trusts Management Company Limited 15 St Lucia Way , Kingston 5
www.baritagroup.com
The principal activities of the company and its subsidiaries (collectively referred to as "the Group") are Stocks and securities brokerage, money market activities, cambio operations and funds management.
JAMAICA STOCK EXCHANGE YEAR BOOK 2013
445,002
1,403,756
11,767,099
13,170,855
177,470
512,700
70,500
70,278
8.38
0.89
4.53
13.75
0.16
2.49
15.56
445,002
1,701,373
11,861,279
13,562,652
169,667
808,980
8.16
347,607
7.03
254,963
16.38
6.97
0.87
14.73
42.97
0.57
2.99
5.25
445,002
1,759,570
13,046,151
14,805,721
167,944
747,953
58.49
324,776
144.03
219,079
125.65
7.41
0.88
15.22
43.42
0.49
3.00
6.12
445,002
1,118,604
11,218,145
12,336,749
133,482
471,913
8.73
133,089
4.78
97,086
10.03
0.91
9.87
28.20
0.22
2.00
9.09
405,734
848,739
10,949,155
11,797,894
132,251
434,023
4.84
127,020
15.17
98,625
11.53
12.90
0.93
12.62
29.27
0.24
(36.62)
(79.72)
(72.44) (1.56)

75
Financial Year End March 31
Berger Paints (Ja.) Limited (BRG JMP165551079)
Financial Data
2013 2012 2011 2009+ 2008
BALANCE SHEET (000)
No. of Shares issued
($000)
Shareholders' Equity
Long Term Liability
Gearing Debt
Current Assets
Current Liabilities
PROFIT & LOSS ($000)
Turnover
% incr. over prior yr
Pre-tax Profit
% incr (decr.) over prior yr.
Aftertax Profit (Loss)
% incr. over prior yr.
Extraordinary items
IMPORTANT RATIOS
Debt/Equity
Current Ratio
Return on Equity
Earnings Per Share
Closing Stock Price
P.E. Ratio
Operating Profit (Loss) Margin
Board of Directors
Secretary
Registrar &Transfer Agent
Principal Activities
Website bergercaribbean.com
L isted Date October 15, 1992
Huron Gordon
Jalaj Dani (Chairman); Mustafa Turra (General Manager)- appointed May 2013; Warren McDonald; Tom Thomas (appointed June 2013); Pokar Chandiram; Michael Fennell; Milton Samuda; Gokul Manjeshwar (resigned June 1, 2013);
Duke Corporation Limited Scotiabank Center, Duke & Port Royal Street, Kingston
Manufacturers and distributors of industrial and decorative paints and paint related material
+Berger Paints Limited financial year end changed from Dec 31 to Mar 31, therefore the results used was for the 15 month period ended March 31, 2010
JAMAICA STOCK EXCHANGE YEAR BOOK 2013
214,322
480,430
135,330
0
642,617
278,524
1,608,216
4.38
47,091
34,083
2.30
0.00
2.31
7.15
2.93
0.16
1.80
11.25
214,322
472,330
124,505
0
563,684
219,502
1,540,689
2.83
49,402
33,317
0.00
2.57
7.11
3.21
0.16
3.00
18.75
214,322
464,532
113,911
0
623,004
296,343
1,498,241
101,091
5.95
67,806
0.00
2.10
14.70
6.75
0.32
3.00
9.38
214,322
458,036
105,253
0
527,802
243,884
1,829,255
19.79
95,416
344.23
74,099
376.21
0.00
2.16
17.19
5.22
0.35
2.68
7.66
214,322
404,098
95,114
0
687,594
481,120
1,527,014
4.98
21,479
15,560
0.00
1.43
3.72
1.41
0.07
2.00
28.57
(4.68) (51.13)
(50.86)
(18.10)
(8.49)
(71.96)
(67.15)

Financial Year End April 30
Blue Power Group Ltd. (BPOW JMP170271069)
Financial Data
2013 2012 2011 2010 2009 2008
Board of Directors
Secretary
Registrar &Transfer Agent
Subsidiaries
Principal Activities
Listed Date April 22, 2010
BALANCE SHEET (000)
No. of Shares issued
($000)
Shareholders' Equity
Long Term Liability
Gearing Debt
Current Assets
Current Liabilities
PROFIT & LOSS ($000)
Turnover
% incr. over prior yr
Pre-tax Profit
% incr (decr.) over prior yr.
Aftertax Profit (Loss)
% incr. over prior yr.
Extraordinary items
IMPORTANT RATIOS
Debt/Equity
Current Ratio
Return on Equity
Earnings Per Share
Closing Stock Price
P.E. Ratio
Operating Profit (Loss) Margin
76
Kenneth Benjamin; Jeffrey Hall; Peter Millingen; Antony Hart; Dhiru Tanna; Major Noel Dawes
Lisa Kong
Cotrade Limited (Indirect Subsidiary)
Jamaica Central Securities Depository Limited 40 Harbour Street, Kingston
The main activities carried out by the company include manufacture and sale of laundry soaps and the sale of lumber, hardware supplies and related products from distribution outlets.
JAMAICA STOCK EXCHANGE YEAR BOOK 2013
56,499
345,309
0
553
390,783
88,471
1,044,905
21.08
103,980
120.74
103,980
120.74
0.00
4.42
35.09
9.95
1.84
5.50
2.99
56,499
247,262
553
3,053
269,821
61,160
863,003
9.05
47,105
47,105
0.01
4.41
20.79
5.46
0.83
4.85
5.84
56,499
205,806
33,861
47,059
275,086
78,195
791,407
13.63
55,667
27.72
54,607
87.02
0.23
3.52
30.59
7.03
0.97
4.85
5.00
56,499
151,199
30,451
33,666
221,413
86,212
696,456
7.52
43,586
95.85
29,199
97.50
0.22
2.57
30.36
6.26
0.85
5.15
6.06
1
41,153
95,959
70,047
158,251
65,469
647,744
22,255
14,784
1.70
2.42
3.44
(15.38)
(13.74)

77JAMAICA STOCK EXCHANGE YEAR BOOK 2013
Financial Data
C2W Music Limited (MUSIC JMP3506L1091)
Financial Year End December 31
2013 2012 2011 2010 2009 2008
BALANCE SHEET (000)
No. of Shares issued
($000)
Shareholders' Equity
Long Term Liability
Gearing Debt
Current Assets
Current Liabilities
PROFIT & LOSS ($000)
Turnover
% incr. over prior yr .
Pre-tax Profit
% incr. (decr.) over prior yr.
Aftertax Profit
% incr. (decr.) over prior yr.
IMPORTANT RATIOS
Debt/Equity
Current Assets Ratio
Return on Equity
Operating Profit Margin
Earnings Per Share
Closing Stock Price
P.E. Ratio
Board of Directors
Secretary
Registrar &Transfer Agent
Principal Activities
Website
Listed Date
400,000
42
0
73
29
210
19
(84.08
(620
2.70
(620
2.70
1.72
0.14
(175.99
(33.34
(0.0016
0.29
(181.25
400,000
662
0
0
446
57
117
(604
(604
0.00
7.89
(182.31
(5.17
(0.00
1.21
(711.76
US$ US$
)
)
)
)
)
)
)
)
)
)
)
)
)
Mr. Gerald S. Hadeed Chairman (resigned effective September 12, 2013); Derek Wilkie (Acting Chairman);
Maxime Gousse - Non-Executive Director; Mr. Gassan Elias Azan Non-Executive Director (resigned February 1, 2013);
Mr. Ivan Berry - Director and Chief Executive Officer; Ms. Neysha Soodeen Non-Executive;
Ms. Kristine Gibbon-Thompson; Christopher D.R. Bovell -Mentor
Denise Douglas
Jamaica Central Securities Depository Limited
The principal activities of the company involve developing the talents of Caribbean songwriters, acquiring licensing
rights to their compositions and promoting the commercial use of the compositions.
www.c2wmusic.com
May 29, 2012
Note :- Closing stock price quoted in Ja. $

78
Financial Year End March 31
Cable & Wireless (Ja.) Ltd. (LIME JMP192311026)
Financial Data
2013 2012 2011 2010 2009 2008
BALANCE SHEET (000)
No. of Shares issued
($000)
Shareholders' Equity
Long Term Liability
Gearing Debt
Current Assets
Current Liabilities
PROFIT & LOSS ($000)
Turnover
% incr. over prior yr
Pre-tax Profit
% incr. over prior yr.
Aftertax Profit
% incr. over prior yr.
IMPORTANT RATIOS
Debt/Equity
Current Assets Ratio
Return on Equity
Operating Profit Margin
Earnings Per Share
Closing Stock Price
P.E. Ratio
Board of Directors
Secretary
Registrar &Transfer Agent
Subsidiaries
Principal Activities
Duke Corporation Limited, Penthouse, Scotiabank Centre Cnr. Duke & Port Royal Streets, Kingston
Jamaica Digiport International Limited Digital Media & Entertainment Limited
Website www.lime.com
Email [email protected]
Listed Date October 27, 1988
Senator Kamina Johnson Smith
Provision of international and domestic telecommunication services
Christopher Dehring (Chairman); Mark Kerr-Jarrett, J.P.; Hon. Patrick Rousseau, OJ; David Shaw (CEO LIME Caribbean) - resigned in 2013; Garfield Sinclair (Managing Director LIME Jamaica and Cayman); Senator Kamina Johnson Smith; Carolyn Hayle; David Kelhan
JAMAICA STOCK EXCHANGE YEAR BOOK 2013
16,817,440
278,595
322,798
6,550,233
11,185,083
19,075,407
76.68
75.69
0.59
29.01
(24.36
(0.29
0.20
(0.68
16,817,440
261,598
324,283
6,745,746
7,954,820
20,438,364
(1.68
(19,927,377
(340.59
(20,235,439
(231.10
(0.02
0.85
479.69
(97.50
(1.20
0.16
(0.13
16,817,440
5,788,113
263,207
822,052
6,244,287
10,709,643
20,787,973
22.70
(4,522,902)
20.24
(6,111,526)
(80.38)
0.14
0.58
(68.97
(21.76
(0.36
0.27
(0.74
16,817,440
11,934,987
281,221
297,605
6,078,884
7,367,627
16,942,218
3.49
(5,670,624
(1434.45
(3,388,191
(1018.86
0.02
0.83
(24.80
(33.47
(0.20
0.33
(1.64
16,817,440
15,387,416
285,951
302,163
5,692,429
6,642,511
16,370,138
2.01
(369,555
94.88
(302,825
92.78
0.02
0.86
(2.01
(2.26
(0.02
0.45
(25.00
16,817,440
14,695,499
3,421,455
4,170,494
5,643,395
6,589,605
16,046,854
(10.87
(7,216,382
(330.02
(4,194,698
(304.24
0.28
0.86
(23.96
(44.97
(0.25
0.78
(3.12
(19,684,458) (14,225,008)
(6.67)
(4,646,088)
(4,919,134)
(0.02)
)
)
)
)
)
)
)
)
)
)
)
)
)
)
)
)
)
)
)
)
)
)
)
)
)
)
)
)
)
)
)
)
)
)
)
)
)
)
)

79
Financial Year End December 31
Caribbean Cement Company (CCC JMP210961059)
Board of Directors
Secretary
Registrar & Transfer Agent (Effective 15/12/06)
Subsidiaries
Principal Activities
Financial Data
2013 2012 2011 2010 2009 2008
BALANCE SHEET (000)
No. of Shares issued
($000)
Shareholders' Equity
Long Term Liability
Gearing Debt
Current Assets
Current Liabilities
PROFIT & LOSS ($000)
Turnover
% incr. over prior yr .
Pre-tax Profit (Loss)
% incr. (decr.) over prior yr.
Aftertax Profit (Loss)
% incr. (decr.) over prior yr.
Exceptional Item
Extraordinary Item
IMPORTANT RATIOS
Debt/Equity Ratio
Current Assets Ratio
Return on Equity
Earnings (Loss) Per Share
Closing Stock Price
P.E. Ratio
Operating (Loss) Profit Margin
Pan Caribbean Bank Limited 60 Kuntsford Boulevard, Kingston 5
Jamaica Gypsum & Quarries Ltd, Harbour Head; Rockfort Mineral Bath Complex Ltd., Rockfort Caribbean Gypsum Company Ltd; Rockfort
Website www.caribcement.com
Email [email protected]
Listed Date February 3, 1969
Bernadene M. Crooks
Manufacture and sale of Portland cement and the winning and sale of gypsum.
Brian Young, F.C.A. (Chairman); Rollin Bertrand, Ph.D (Group CEO); Hollis Hosein F.C.C.A., C.A., Judith Robinson, F.C.C.A., Ph.D.; Paul Stockhausen, B.Eng.; Bevon Francis Derek Jones; Mrs. Bernadene Crooks (Company Secretary)
JAMAICA STOCK EXCHANGE YEAR BOOK 2013
851,137
4,752,049
739,476
808,810
4,273,591
3,027,671
12,089,484
33.08
(3,079
99.88
113,921
103.40
-
-
0.17
1.41
12.57
(0.03
0.10
3.50
35.00
851,137
(2,939,072
797,712
832,173
3,942,937
3,751,513
9,084,600
13.08
(2,672,105
10.45
(3,348,265
(28.12
-
-
(0.28
1.05
264.70
(29.41
(3.93
1.00
(0.25
851,137
409,193
3,827
594,453
3,179,133
3,767,676
8,033,786
1.31
(2,983,995
(33.07
(2,613,360
(67.83
-
-
1.45
0.84
(152.30
(37.14
(3.07
3.00
(0.98
851,137
3,022,553
4,006
852,686
3,158,828
3,998,079
7,929,783
(10.59
(2,242,360
(830.33
(1,557,193
(977.55
-
-
0.28
0.79
(49.73
(28.28
(1.83
3.07
(1.68
851,137
3,240,096
3,178
6,078
3,425,499
3,473,008
8,869,260
0.73
(241,028
(142.14
(144,512
(134.70
-
-
0.00
0.99
(4.31
(2.72
(0.17
4.00
(23.53
851,137
3,458,584
6,117
42,299
3,478,903
3,470,851
8,805,293
12.21
571,932
(13.30
416,438
(20.24
-
-
0.01
1.00
12.59
6.50
0.49
3.95
8.06
)
)
)
)
)
)
)
)
)
)
)
)
)
)
)
)
)
)
)
)
)
)
)
)
)
)
)
)
)
)
)
)
)
)
)
)
)

80JAMAICA STOCK EXCHANGE YEAR BOOK 2013
Financial Data
Caribbean Cream Ltd. (KREMI JME201300014)
Financial Year End February 28
2013 2012 2011 2010 2009 2008
BALANCE SHEET (000)
No. of Shares issued
($000)
Shareholders' Equity
Long Term Liability
Gearing Debt
Current Assets
Current Liabilities
PROFIT & LOSS ($000)
Turnover
% incr. over prior yr .
Pre-tax Profit
% incr. (decr.) over prior yr.
Aftertax Profit
% incr. (decr.) over prior yr.
Extraordinary items
Exceptional Item
IMPORTANT RATIOS
Debt/Equity
Current Assets Ratio
Return on Equity
Operating Profit Margin
Earnings Per Share
Closing Stock Price
P.E. Ratio
Board of Directors
Secretary
Registrar &Transfer Agent
Principal Activities
Website
Listed Date
378,568
115,885
73,996
85,591
102,437
126,868
675,708
56.77
21,260
13,941
0.74
0.81
17.18
0.03
378,568
46,379
44,641
52,111
25,765
46,527
431,023
31,193
31,362
1.12
0.55
0.07
(31.84)
(55.55)
Christopher Clarke - Managing Director and Chief Executive Officer; Matthew Clarke MD;
Carol Clarke Webster - Chairman; Mark McKenzie Wayne Wray - Mentor
Denise Douglas
Jamaica Central Securities Depository Limited
The principal activities of the Company are the manufacture and sale of ice cream under the 'Kremi' brand and the
importation and distribution of certain types of frozen novelties.
www.caribcream.com
May 17, 2013

81JAMAICA STOCK EXCHANGE YEAR BOOK 2013

Financial Year End September 30
Cargo Handlers Ltd. (CHL JMP210381076)
Financial Data
2013 2012 2011 2010 2009 2008
Board of Directors
Secretary
Registrar &Transfer Agent
Principal Activities
Listed Date December 17, 2010
BALANCE SHEET (000)
No. of Shares issued
($000)
Shareholders' Equity
Long Term Liability
Gearing Debt
Current Assets
Current Liabilities
PROFIT & LOSS ($000)
Turnover
% incr. over prior yr
Pre-tax Profit
% incr (decr.) over prior yr.
Aftertax Profit (Loss)
% incr. over prior yr.
Extraordinary items
IMPORTANT RATIOS
Debt/Equity
Current Ratio
Return on Equity
Earnings Per Share
Closing Stock Price
P.E. Ratio
Operating Profit (Loss) Margin
Jane Fray; Theresa Chin; Anthony Hart Mark Hart; Andrew McCarthy
The principal activity of the company is the provision of stevedoring services.
Jamaica Central Securities Depository Limited40 Harbour Street, Kingston
Ms. J. Fray
82JAMAICA STOCK EXCHANGE YEAR BOOK 2013
41,625
136,864
0
0
150,692
19,851
157,489
23.51
84,944
31.58
84,947
31.58
0.00
7.59
67.40
53.94
2.27
13 .00
5.73
41,625
115,209
0
0
113,030
14,694
127,508
64,557
24.19
64,560
24.35
0.00
7.69
63.96
50.63
1.72
12 .00
6.98
41,625
86,682
0
122
61,778
25,075
149,457
51,983
2589.24
51,919
3815.46
0.00
2.46
114.41
34.78
1.41
13.94
9.89
4,077
0
0
30,946
45,746
165,208
(4.89
1,933
(16.82
1,326
(8.68
0.00
0.68
38.85
1.17
0.04
N/A
2,750
0
50
44,150
77,849
173,697
2,324
1,452
0.02
0.57
1.34
N/A
(14.69) (9.53) )
)
)


