YEAR-END REPORT FOR THE 2007 FIELD SEASON AT LEVIATHAN MINE · YEAR-END REPORT FOR THE 2007 FIELD...
25
YEAR-END REPORT FOR THE 2007 FIELD SEASON AT LEVIATHAN MINE Alpine County, California February 2008 Prepared by: California Regional Water Quality Control Board, Lahontan Region 2501 Lake Tahoe Boulevard South Lake Tahoe, CA 96150 Prepared for: USEPA, Region IX 75 Hawthorne Street, SFD-7-2 San Francisco, CA 94105-3901
Transcript of YEAR-END REPORT FOR THE 2007 FIELD SEASON AT LEVIATHAN MINE · YEAR-END REPORT FOR THE 2007 FIELD...

YEAR-END REPORT
FOR THE 2007 FIELD SEASON
AT LEVIATHAN MINE
Alpine County, California
February 2008
Prepared by: California Regional Water Quality Control Board, Lahontan Region 2501 Lake Tahoe Boulevard South Lake Tahoe, CA 96150 Prepared for: USEPA, Region IX 75 Hawthorne Street, SFD-7-2 San Francisco, CA 94105-3901

1
YEAR-END REPORT FOR THE 2007 FIELD SEASON AT LEVIATHAN MINE
Table of Contents
1. INTRODUCTION 3
2. BACKGROUND 2.1 Site Setting and History 4 2.2 AMD Collection and Storage 5 2.3 Pond Water Treatment Plant Process 6
3. 2007 SLUDGE REMOVAL AND POND WATER TREATMENT 3.1 Sludge Removal and Disposal 7 3.2 Pond Water Treatment 8 3.3 Sampling for Monitoring Pond Water Treatment 9 3.4 Sampling Results from Pond Water Treatment Monitoring 10 3.4.1 Data Quality Objectives 10 3.4.2 Data Summary 10 3.4.3 Data Quality Evaluation .........................................................11 3.4.4 Deviation from the SAP 12
4. SURFACE WATER MONITORING AND METEOROLOGICAL INFORMATION
4.1 Monitoring Objectives 12 4.2 Flow Monitoring 12 4.3 Surface Water Monitoring 13 4.4 Sampling Results from Surface Water Monitoring 14 4.4.1 Data Quality Objectives 14 4.4.2 Data Summary 14 4.4.3 Deviation from the SAP 15 4.5 Meteorological Monitoring 15
5. SITE MAINTENANCE 5.1 Repairing Perimeter Fencing 16 5.2 Storm Water Conveyance and Road Maintenance 16 5.3 Covering Exposed Liner 16 5.4 Invasive Plant Control 16 FIGURES Figure 1: Site Location 17 Figure 2: Leviathan Creek and Receiving Waters 18 Figure 3: Lahontan RWQCB AMD Capture and Treatment System 19 Figure 4: Surface Water Monitoring Locations 20

2
LIST OF TABLES Table 1: 2007 Discharge Criteria for Pond Water Treatment 21 Table 2: Pond 1 Lime Treatment Plant Monitoring Locations and Sampling Schedule 22 Table 3: Flow Monitoring Locations 23 Table 4: Surface Water Quality Monitoring Stations 24
APPENDICES Data Summary Report for 2007 Pond 1 Lime Treatment Appendix A Data Summary Report for 2007 Surface Water Monitoring Appendix B

3
1. INTRODUCTION
Leviathan Mine is a former sulfur mine that the State of California acquired in the early 1980s to address water quality problems caused by historic mining. Jurisdiction over Leviathan Mine rests with the State Water Resources Control Board, which, in turn, has delegated jurisdiction over clean up work to the California Regional Water Quality Control Board, Lahontan Region (Lahontan Water Board). On May 11, 2000, the United States Environmental Protection Agency (USEPA) placed Leviathan Mine on the Comprehensive Environmental Response, Compensation, and Liability Act (CERCLA) National Priorities List, thus making Leviathan Mine a federal Superfund site. USEPA has identified the Lahontan Water Board as a Potentially Responsible Party. On July 19, 2000, pursuant to its authority under CERCLA, USEPA issued an Administrative Abatement Action (AAA) to the Lahontan Water Board and, thereby, directed the Lahontan Water Board to implement certain pollution abatement and site characterization activities at Leviathan Mine. With slight modifications, USEPA subsequently reissued the AAA in 2001, 2002, 2003, 2004, and 2005. In its 2005 AAA, USEPA decided to, instead of issuing AAA every year; allow its Remedial Project Manager, for each year that the first phase of Non-Time Critical Removal Action continues, to notify Lahontan Water Board of the necessity to continue the Work for an addition year. It is expected that USEPA will direct Lahontan Water Board to continue work at Leviathan Mine until a final remedy addressing all releases of hazardous substances at Leviathan Mine is implemented. This Year-End Report for the 2007 Field Season at Leviathan Mine (Year-End Report) has been prepared by the Lahontan Water Board for the USEPA. This Year-End Report was prepared to comply with Paragraph No. 50 of USEPA’s July 14, 2005 Administrative Abatement Action (AAA) which states:
"Within thirty (30) days after the LRWQCB concludes that the seasonal work on the NTCRA has been fully performed, the LRWQCB shall so notify EPA and shall schedule and conduct a pre-certification inspection to be attended by the LRWQCB and EPA. The pre-certification inspection shall be followed by a written report submitted within ninety (90) days of the inspection by the LRWQCB's Project Coordinator certifying that all work to date on the NTCRA has been completed in full satisfaction of the requirements of this Administrative Action."
The pre-certification inspection occurred on October 2, 2007. In a letter dated November 16, 2007, Lahontan Water Board staff requested, and the USEPA granted, an extension of the due date for the 2007 Year-End Report until February 29, 2008. This Year-End Report constitutes the “written report” as referenced in Paragraph No. 50 of the AAA, and contains year-end summaries of all Lahontan Water Board activities performed in 2007. The activities required of the Lahontan Water Board by the USEPA are described in Paragraph No. 37 of the AAA. These activities consist of:
1. summer treatment of acid mine drainage (AMD) captured year-round in a series of ponds;
2. site maintenance of ponds, drainage and diversion channels, and gates and fences; and
4
3. site monitoring of water quality, water quantity, and meteorological information.
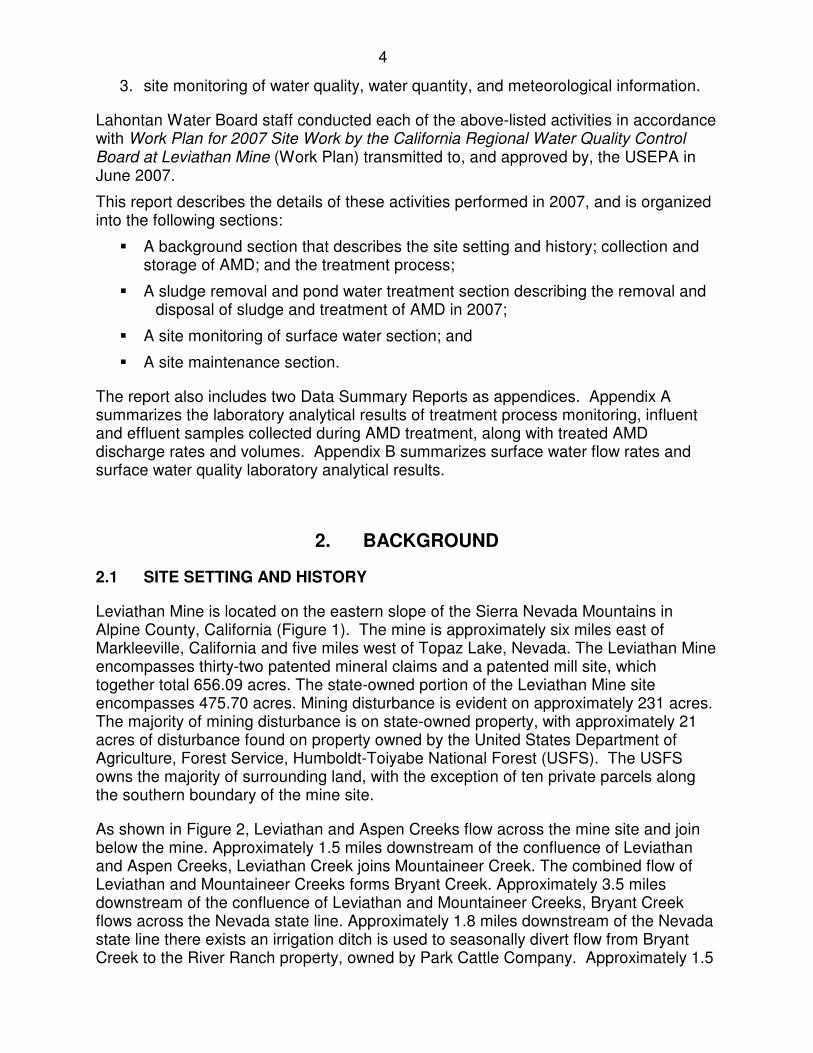
Lahontan Water Board staff conducted each of the above-listed activities in accordance with Work Plan for 2007 Site Work by the California Regional Water Quality Control Board at Leviathan Mine (Work Plan) transmitted to, and approved by, the USEPA in June 2007.
This report describes the details of these activities performed in 2007, and is organized into the following sections:
� A background section that describes the site setting and history; collection and storage of AMD; and the treatment process;
� A sludge removal and pond water treatment section describing the removal and disposal of sludge and treatment of AMD in 2007;
� A site monitoring of surface water section; and
� A site maintenance section.
The report also includes two Data Summary Reports as appendices. Appendix A summarizes the laboratory analytical results of treatment process monitoring, influent and effluent samples collected during AMD treatment, along with treated AMD discharge rates and volumes. Appendix B summarizes surface water flow rates and surface water quality laboratory analytical results.
2. BACKGROUND
2.1 SITE SETTING AND HISTORY
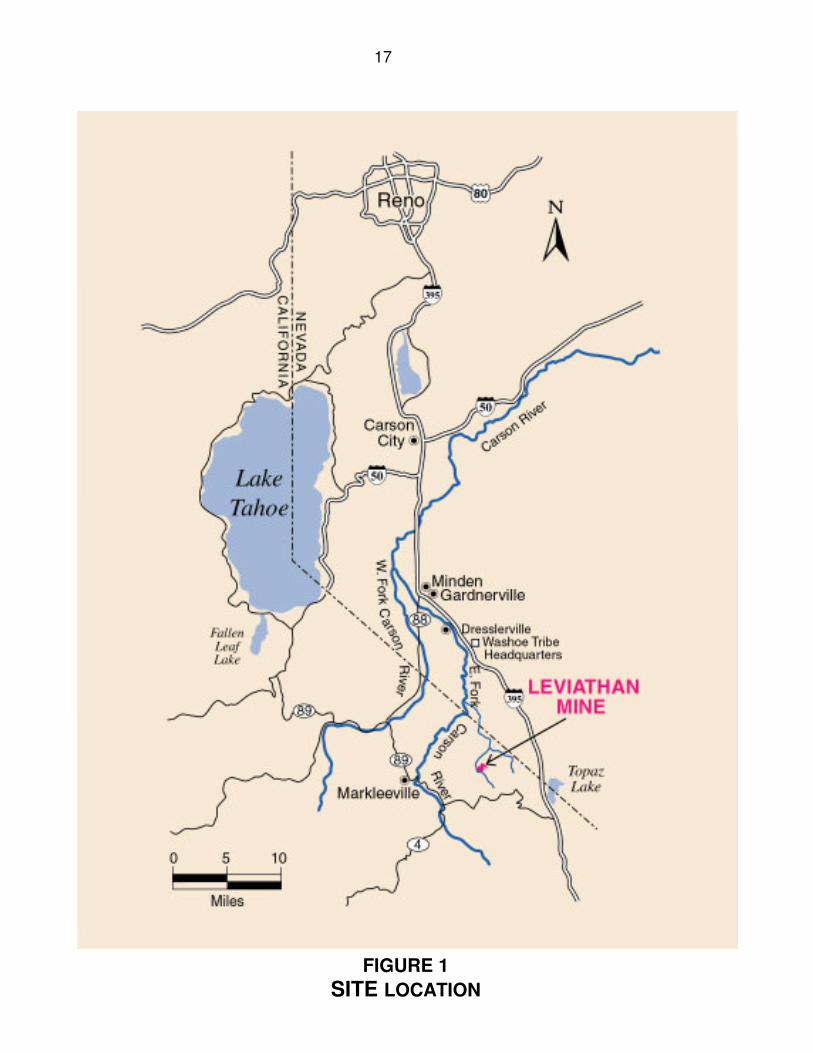
Leviathan Mine is located on the eastern slope of the Sierra Nevada Mountains in Alpine County, California (Figure 1). The mine is approximately six miles east of Markleeville, California and five miles west of Topaz Lake, Nevada. The Leviathan Mine encompasses thirty-two patented mineral claims and a patented mill site, which together total 656.09 acres. The state-owned portion of the Leviathan Mine site encompasses 475.70 acres. Mining disturbance is evident on approximately 231 acres. The majority of mining disturbance is on state-owned property, with approximately 21 acres of disturbance found on property owned by the United States Department of Agriculture, Forest Service, Humboldt-Toiyabe National Forest (USFS). The USFS owns the majority of surrounding land, with the exception of ten private parcels along the southern boundary of the mine site.
As shown in Figure 2, Leviathan and Aspen Creeks flow across the mine site and join below the mine. Approximately 1.5 miles downstream of the confluence of Leviathan and Aspen Creeks, Leviathan Creek joins Mountaineer Creek. The combined flow of Leviathan and Mountaineer Creeks forms Bryant Creek. Approximately 3.5 miles downstream of the confluence of Leviathan and Mountaineer Creeks, Bryant Creek flows across the Nevada state line. Approximately 1.8 miles downstream of the Nevada state line there exists an irrigation ditch is used to seasonally divert flow from Bryant Creek to the River Ranch property, owned by Park Cattle Company. Approximately 1.5

5
miles downstream from the irrigation diversion, Bryant Creek joins the East Fork of the Carson River.
Historic mining activities at Leviathan Mine included underground and open pit extraction of sulfur-rich ore. These activities resulted in the exposure of naturally occurring sulfide minerals to air and water. This exposure triggered a series of chemical reactions that caused local ground water to become acidic and metal-rich. The acidic groundwater discharges from an old mine tunnel and seeps at several locations within the Leviathan Mine site. When this AMD enters local surface water bodies, it adversely affects water quality, which in turn affects algae, insect, and fish growth, and damages the in-stream habitat through deposition of metal-rich precipitates.
The Lahontan Water Board has implemented several projects to abate AMD from entering local surface water bodies. In 1985, the Lahontan Water Board completed construction of a pollution abatement project at Leviathan Mine to address specific problem areas. This project included the construction of AMD storage and evaporation ponds, which are the focus of the Lahontan Water Board’s pond water treatment activities.
2.2 AMD Collection and Storage
The 1985 pollution abatement project included construction of five lined evaporation ponds (Figure 3) to capture and evaporate AMD from remnant underground mine workings. The primary sources of AMD to the pond system are the “Adit” and the Pit Under-Drain (PUD).
� The Adit is the location where acidic groundwater emanated from a remnant tunnel excavated during underground mining activities that occurred in the 1930s (Figure 3). The exact condition of the interior of the tunnel is unknown, but it is likely that portions of the tunnel have collapsed. The approximate location of the tunnel is shown in Figure 3. As part of the 1985 pollution abatement project, the Lahontan Water Board installed an underground drain to collect acidic groundwater emanating from the Adit. The underground drain consists of 12-inch-diameter perforated pipe in a bed of drain rock completely buried in native material. The perforated pipe is connected to a non-perforated 12-inch pipe that carries the AMD to a concrete flow control structure (FCS, Figure 3). AMD from the Adit has a pH of less than 3.0 and typically has a discharge rate between 9 and 15 gallons per minute (gpm) with a maximum rate measured to approximately 42 gpm (flow data collected from1999 to 2007).
� The Lahontan Water Board contractors installed the PUD during construction of the 1985 pollution abatement project to dewater saturated soils in the bottom of the open pit prior to backfilling the pit to its current elevation. The PUD consists of approximately 1,500 linear feet of 12-inch-diameter perforated pipe set in a bed of drain rock beneath the pit bottom, buried in pit backfill material (Figure 3). The perforated pipes connect to a non-perforated 18-inch-diameter pipe that conveys PUD discharge to the FCS (Figure 3). AMD from the PUD has a pH of less than 3.0 and typically has a flow rate between 0.1 and 4 gpm, with rates as high as approximately 38 gpm (flow data collected from1999 to 2007).

6
� The five evaporation ponds (Figure 3) cover a cumulative surface area of approximately 12.8 acres with a cumulative holding capacity of approximately 16.5 million gallons based on an October 1998 survey conducted by ARCO Environmental Remediation, LLC. AMD from the FCS can be routed directly to Leviathan Creek or to the pond system. When the AMD is directed to the pond system, it is discharged to Ponds 1, 2 South, and 2 North; these 3 ponds are commonly called the “upper ponds” and have a combined volume of approximately 14.5 million gallons. Pond 3 receives overflow from the upper ponds. Overflow from Pond 3 can be directed to Leviathan Creek or to Pond 4. Pond 4 overflows directly to Leviathan creek.
To prevent AMD from discharging to Leviathan Creek via pond overflows, the Lahontan Water Board treats pond water during the summer months to increase pond storage capacity for the subsequent winter and spring months. The Lahontan Water Board assembled a treatment system during the 1999 field season on the north east corner of Pond 1 and tested the process at full-scale during the 1999 and 2000 field seasons. The typical field season at Leviathan Mine runs from mid-June through mid-October. The Lahontan Water Board has continued to operate the lime treatment system adjacent to Pond 1 during the summer months from 2001 through 2007.
2.3 Pond Water Treatment Plant Process
The Lahontan Water Board’s treatment of AMD contained in the pond system is accomplished through lime neutralization. The neutralization of AMD by the addition of alkalinity has long been accepted as an effective means to raise pH and remove metals in AMD. Lime (calcium hydroxide or Ca[OH]2), is mixed into the AMD from the pond system; the addition of alkalinity causes an increase in pH and the precipitation of dissolved constituents, including metals, contained in the AMD. The precipitated metals are then separated from the solution, and the final products are 1) a nearly metal-free effluent with near neutral pH, and 2) waste sludge.
The Pond Water Treatment plant treats the AMD stored in the three upper ponds. The process is also referred to as Pond 1 lime treatment because the treatment system is located on the north side of Pond 1 (Figure 3). The treatment system draws the AMD from Pond 1 for treatment and, thus, lowering the water elevation of Pond 1. The lower water level in Pond 1 causes AMD from Pond 2 North and Pond 2 South to flow by gravity to Pond 1 and to be treated by the treatment system. The Pond 1 Lime Treatment Plant operates optimally in the warm summer months. Cold temperatures encountered in the late summer and early fall appear to cause slow reaction times, and consequently, decreases in treatment rates.
A 5-horsepower (hp) electric pump conveyed AMD from Pond 1 to a 10,000-gallon fiberglass Phase 1 reaction tank (R-1). A pH probe installed in R-1 measured pH in R-1 and controlled the amount of lime slurry added to R-1. A 3-hp mixer mixed AMD and lime slurry in R-1. The lime slurry raised the pH of the AMD from 2.5 to an approximate range of 3.1 to 3.4.
The partially treated AMD then flows by gravity from R-1 through a two-chambered combination flash/flocculation mix tank and into a Lamella clarifier (CL-1) where precipitates settled.

7
Two 1.5-inch air diaphragm pumps remove precipitates from the bottom of CL-1. One of the 1.5-inch diaphragm pumps is used to pump a portion of the precipitates back into the top of R-1. The second 1.5-inch air diaphragm pump is used to pump remaining precipitates from the bottom of CL-1 back into the top of CL-1 in an effort to keep precipitates from settling out and potentially clogging the bottom of CL-1 with solids.
Supernatant and precipitates from CL-1 flows by gravity to the Phase 2 reaction tank (a second 10,000-gallon fiberglass tank) referred to as R-2. A pH probe in R-2 measures pH and controls the amount of lime slurry added to R-2. This is the second of a two-point lime addition process. A 7.5-hp mixer on R-2 mixes the partially treated AMD, precipitates, and lime slurry. In R-2, the lime slurry raises the pH of the partially treated AMD to approximately 8.5, which causes all but trace amounts of remaining metals to precipitate out of solution.
Treated AMD and precipitates then flows through the Phase 2 flash/flocculation mix tank and into the Phase 2 Lamella clarifier (CL-2). Two 10-hp mud pumps transfer the water/solid mixture from the bottom of CL-2 to the Pit Clarifier. Polymer solution (Superfloc A-1849 RS Anionicpolyacrylamide water-in-oil emulsion, or equivalent) is injected into the sludge slurry line just upstream of the two 10-hp mud pumps.
The Pit Clarifier (Figure 3) is an earthen reservoir located in the bottom of the Leviathan Mine open pit. The Pit Clarifier has plan dimensions of approximately 150-feet by 150-feet, and includes a perforated pipe and gravel/sand under-drain. When the treatment plant was treating AMD, the sludge slurry from CL-2 was pumped to the Pit Clarifier where solids settled out in near-quiescent conditions. Water can be discharged from the Pit Clarifier via a surface decant structure or via an under-drain. The under-drain was designed to de-water the sludge at the end of the treatment season. Treated water exiting the Pit Clarifier is conveyed by gravity to a weir box used for final effluent monitoring and discharge. If discharge from the Pit Clarifier is found to be out of compliance (by field analysis or direct knowledge of system upset), discharge can be stopped and diverted back to Pond 1 for re-treatment.
Discharge of treated pond water from the Pond 1 Lime Treatment Plant to Leviathan Creek (via the Pit Clarifier) is governed by discharge standards in USEPA’s 2005 Non-Time Critical Removal Action Memo, as shown in Table 1.
3. 2007 SLUDGE REMOVAL AND POND WATER TREATMENT 3.1 Sludge Removal and Disposal
Reliable access to the site by heavy equipment was reestablished in mid-June 2007 following substantial repairs to site access roads (see Section 5.2). Approximately 1,122 tons of sludge generated during operation of the 2006 pond water treatment plant were removed from the Pit Clarifier in late June 2007 and disposed of in a Class I hazardous waste landfill in Beatty, Nevada by mid-July.
Sludge generated in the spring of 2005 and 2006 from the Pond 3 Emergency Treatment Operation was contained in Pond 3 during treatment. A portion of the sludge
8
was removed from Pond 3 in November 2006 (see 2006 Year End Report). The remaining approximately 100 tons of sludge contained in Pond 3 was removed and disposed of in mid-July 2007 at a Class 1 hazardous waste facility in Beatty, Nevada. 3.2 Pond Water Treatment
The overall objective of the Pond Water Treatment efforts was to treat the AMD contained in the ponds and produce an effluent that meets the Discharge Criteria designated by USEPA for the project. If discharge from the Pit Clarifier was found to be out of compliance (by field analysis or direct knowledge of system upset), discharge was stopped. The effluent was retained in the Pit Clarifier until it met field parameters.
While sludge was being removed from the Pit Clarifier for disposal, contractors assembled the treatment plant with modifications made during the 2005 treatment season and used again in 2006. The Pond Water Treatment Plant contractor began treating AMD contained in the pond system on July 8, 2007. Discharge of treated water out of the Pit Clarifier to Leviathan Creek began on July 11, 2007.
The treatment plant was shut down on July 24, 2007 after all the AMD in Ponds 2 North and 2 South were drained into Pond 1 and all the AMD in Pond 1 was treated. Given the short treatment duration, only the Pit Clarifier under-drain was used for discharge during the 2007 treatment season.
After all the pond water was treated and the treatment system was shut down on July 24, 2007, the Water Board continued to collect effluent samples discharging from the Pit Clarifier until July 30, 2007, when the flow rate out of the under-drain dropped below 4 gpm. By July 30, 2007 approximately 3.1 million gallons of treated pond water had been discharged out of the Pit Clarifier to Leviathan Creek. Twenty three effluent confirmation samples were collected in 2007; this includes 3 duplicate samples.
The system operators observed an effluent pH of 5.73 at 0630 on 7/16/07, and stopped discharge to Leviathan Creek. The system operators indicated that a clog between Reactor 2 and Clarifier 2 caused the system upset. The effluent was retained in the Pit Clarifier until it met field parameters at approximately 1030 on 7/16/07. Although there was a system upset that caused a brief stoppage in discharge, effluent quality was in compliance with the discharge criteria.
The 2007 Pond Water Treatment Plant operation consumed approximately 86 dry standard tons of lime; 1,736 pounds of polymer; 3,641 gallons of diesel fuel; and 646 gallons of gasoline. The Lahontan Water Board’s treatment effort combined with natural evaporation resulted in the upper pond system having a storage capacity of approximately 14 million gallons at the end of the treatment season.
Sludge generated by the Pond Water Treatment Plant in 2007 is contained in the Pit Clarifier and will be disposed of at a Class I hazardous waste facility in the spring of 2008. The Pond Water Treatment Plant operation generated an estimated 550 cubic yards (wet volume) of sludge. Dewatering of the sludge over the winter will increase solids content and reduce both the volume and mass of the sludge. Water Board staff

9
anticipates that the 550 cubic yards of sludge will result in approximately 250 tons of sludge being disposed in 2008. 3.3 Sampling for Pond Water Treatment Monitoring
Sampling and analysis conducted for the process monitoring of the Pond Water Treatment was performed in accordance with the Lahontan Water Board’s Sampling and Analysis Plan (SAP) for Leviathan Mine Site Pond Water Treatment (June 2007). Monitoring locations and schedule for the Pond Water Treatment Operation is presented in Table 2. Samples were analyzed by the Water Board’s contracted off-site laboratories: Basic Labs of Industry, California, and California Laboratory Services (CLS) of Rancho Cordova, California.
Lahontan Water Board staff collected a grab sample of the treated effluent each day the system discharged to the creek until the discharge dropped below 4 gpm. A portion of the grab sample was field filtered, preserved with nitric acid, and submitted to the Water Board’s contracted off-site laboratory to be analyzed for dissolved: aluminum (Al), arsenic (As), copper (Cu), chromium (Cr), cadmium (Cd), nickel (Ni), iron (Fe), lead (Pb), and zinc (Zn). An unfiltered portion of the daily grab sample was preserved with nitric acid and submitted for Total Recoverable Selenium (Se). Once per week, in addition to the above analyses, Water Board staff submitted samples of treated effluent and untreated influent for sulfate (SO4), total dissolved solids, and dissolved: calcium (Ca), cobalt (Co), manganese (Mn), and magnesium (Mg). Specific details of sample collection and handling are described in the SAP. The Sample Identification Tracking Form is included in Appendix A, Attachment A-1.
To provide “real-time” information on effluent quality and system operation, treatment system operators measured the pH at several mid-process locations as well as the effluent at least once every two hours while the system was operating. Operators used these data to moderate lime additions and maintain effluent quality. They also measured influent flow rate, pit clarifier temperature, and effluent temperature. Each day the system was discharging to Leviathan Creek, Water Board staff also collected pH measurements while collecting the effluent sample. In addition to pH measurements, Water Board staff analyzed dissolved aluminum and dissolved iron in the field laboratory during the first two weeks of treatment to ensure the treatment system had stabilized. Staff used a Hach Company DR2010 Spectrophotometer to analyze influent and effluent samples.
Treated water flows from the Pit Clarifier through a weir box where the flow data are recorded. The flow measuring system is similar to those used by the United States Geological Survey (USGS) for measuring AMD flows from the Pit Under-Drain and Adit. The weir box has a 90-degree V-notch weir and stage data is recorded at 15-minute intervals by a combination data logger/pressure transducer system.
Sludge generated during the 2007 treatment effort was sampled in September 2007 for waste characterization and disposal purposes. Sludge generated by the Pond Water
10
Treatment system, and contained in the Pit Clarifier, was sampled directly from the Pit Clarifier following partial dewatering of sludge. Three sludge samples were colleted from three different locations in the Pit Clarifier. Sludge samples were collected in a vertical profile that represented the complete interval of sludge from the upper surface of sludge down to the base of the sludge. Sludge samples were analyzed by the Lahontan Water Board’s contracted off-site laboratory for comparisons with Total Threshold Limit Concentrations (TTLCs) and Soluble Threshold Limit Concentrations (STLCs) for Title 22 metals, and aluminum and iron. Wastes with Concentrations exceed TTLCs or STLCs are considered Hazardous Wastes and should be disposed off at a properly permitted disposal site. 3.4 Sampling Results from Pond Water Treatment Monitoring
3.4.1 Data Quality Objectives
The overall objective of the monitoring program for Pond Water Treatment was to collect data to evaluate the effectiveness of the treatment process in terms of effluent and sludge quality. The Data Quality Objectives (DQOs) for this project were developed using the USEPA Guidance for Data Quality Objectives, EPA QA/G-4 (EPA, 2000), and are described in the SAP. The specific DQOs for this project, as outlined in the SAP are as follows:
• Identify the chemical characteristics of the untreated pond water.
• Identify the chemical characteristics of the treated pond water.
• Identify the chemical characteristics of solids generated in the treatment process.
• Monitor the effectiveness in meeting USEPA discharge criteria.
• Collect field pH measurements at critical points within the treatment system and at the discharge point.
3.4.2 Data Summary
The results of laboratory analyses of aqueous and sludge samples for the Pond Water Treatment System are included in Appendix A (Data Summary Report for 2007 Pond Water Treatment Plant Monitoring).
Laboratory monitoring results for influent, effluent, and sludge samples are presented in Appendix A, Tables A-1 through A-4. Table A-2 shows the calculated 4-day average for the effluent concentrations. No exceedences of the daily maximum or four-day arithmetic average discharge criteria concentrations (Table 1) occurred in 2007.
Results of field analyses are presented in Appendix A, Attachment A-2. Specific details of field sample collection, handling, and field analytical procedures are described in the SAP. Field pH measurements taken by Lahontan Water Board staff and system operators confirmed that the discharge

11
of treated effluent to Leviathan Creek was within US EPA’s discharge criteria for pH.
A summary of the system operator’s flow, pH, and temperature readings is included as Appendix A, Table A-5. A summary of daily discharge data is included in Appendix A, Table A-6. The raw data has not been included due to the large volume of data recorded by the data logger, but it is available upon request to the Water Board.
The three sludge samples collected from the Pit Clarifier averaged approximately 27.9 percent solids. With the exception of the TTLC analysis for arsenic and the STLC analysis for nickel, the sludge did not exceed any other STLC or TTLC limits. These results are consistent with past sludge generated at the Pond 1 Treatment System. The TTLC concentration for arsenic was exceeded in all three samples collected from the pit clarifier. The arithmetic average arsenic concentration for the three samples is 859 mg/kg. The TTLC for arsenic is 500 mg/kg. The STLC for nickel was exceeded in one of the three samples collected. The arithmetic average STLC nickel concentration for the three samples is 17.9 mg/L. The STLC for nickel is 20 mg/L.
3.4.3 Data Quality Evaluation Data were assessed to confirm that holding times were met and that field quality control samples were collected. Any exceedences of method hold times would be denoted with an “H” qualifier on the data tables. No holding times were exceeded in 2007 field season. Water Board staff collected one field duplicate sample per week of treatment. The Relative Percent Difference (RPD) was calculated for the duplicate and corresponding sample. Considerations for assessing the RPD include: • If both the sample and duplicate values were greater than or equal to five times the Practical Quantization Limit (PQL), then the RPD must be less than or equal to 25% to be in control limits. • If either the sample or duplicate value was less than five times the PQL, then the absolute difference between the sample and duplicate values had to be less than the PQL to be in control limits. Results that were out of control limits were flagged with “*” qualifier in Table A-1. Only one set of sample and duplicate results for dissolved aluminum, collected on July 27, 2007, were flagged for exceeding the control limits for RPD. Equipment Rinsate Blanks (ERBs) and Field Method Blanks (FMBs) were also collected once per week and submitted for the same analyses as effluent samples. Water Board staff collected ERBs by pouring distilled water over laboratory equipment used in sample collection and processing after the equipment had been cleaned. FMBs were collected and processed with

12
distilled water in the same method as effluent samples. No data were disqualified based on ERB or FMB results.
3.4.4 Deviations from the SAP
When the 2007 field season started, the new Leviathan Mine project laboratory contracts had not been executed. Lahontan Water Board staff requested California Laboratory Services (CLS), a laboratory contracted with Lahontan Water Board to serve other board programs, to temporarily fill in for the initial stage of the project. The samples analyzed by CLS were influent and effluent samples collected from July 11, 2007 to July 16, 2007.
Laboratory Data Validation Checklists for Metals Analysis by ICP and ICPMS, as described in the Site-Wide SAP, was not in the scope of CLS’ contract and, therefore, was not completed by CLS. After Leviathan Mine Project laboratory contracts were put in place, Basic Laboratories produced laboratory Data Validation Checklists for all of their laboratory reports. They were not included in this report, but are available at the Water Board office for review.
4. SURFACE WATER MONITORING AND METEOROLOGICAL INFORMATION
As required by the USEPA, the Lahontan Water Board continued their efforts in 2007 field season to monitor surface water flow and quality, and to collect meteorological information in the vicinity of Leviathan Mine.
4.1 Monitoring Objectives The overall objective of the surface water monitoring program is to characterize and track changes in surface water quality and pollutant loading in the Leviathan Creek watershed. Samples are collected at various locations at Leviathan Mine as well as in the surrounding watersheds. Specific objectives outlined in the Work Plan are as follows:
• To continue monitoring surface water quality at eleven stations on a monthly basis and three stations on a semi-annual basis.
• To continue monitoring surface water and acid mine drainage flow rates.
The results of this investigation supplement the existing data contained within the Leviathan Mine Site-wide database that is maintained by Atlantic Richfield Company (ARC). All surface water data and flow data are forwarded to ARC for incorporation into the Site-wide database.
4.2 Flow Monitoring Flow data are reported on the basis of water year. The 2007 water year begins October 1, 2006 and ends September 30, 2007. Under contract to Lahontan Water Board, the

13
USGS monitored water flows and pond level elevations for the 2007 water year. Flow monitoring locations and equipment are detailed in Table 3. Daily average flow data for stations with continuous recorders are included in Appendix B Data Summary Report for 2007 Surface Water Monitoring, Tables B-1 to B-13. Included in these tables are the daily and monthly average flow data for 11 stations with continuous flow recorders and daily and monthly average stage data for water levels in Pond 1 and Pond 4. Six of the stations (the Adit, PUD, CUD, Station 15, Pond 1, and Pond 4) can be viewed in real-time through the USGS’s website, www.water.usgs.gov. However, it is important to note that the flow data for CUD during the months of October and November 2007 do not accurately reflect the true flows of the CUD due to ARC’s treatment operations. ARC has since redesigned and modified their CUD collection and treated effluent discharge system so that the CUD weir box is now functioning properly.
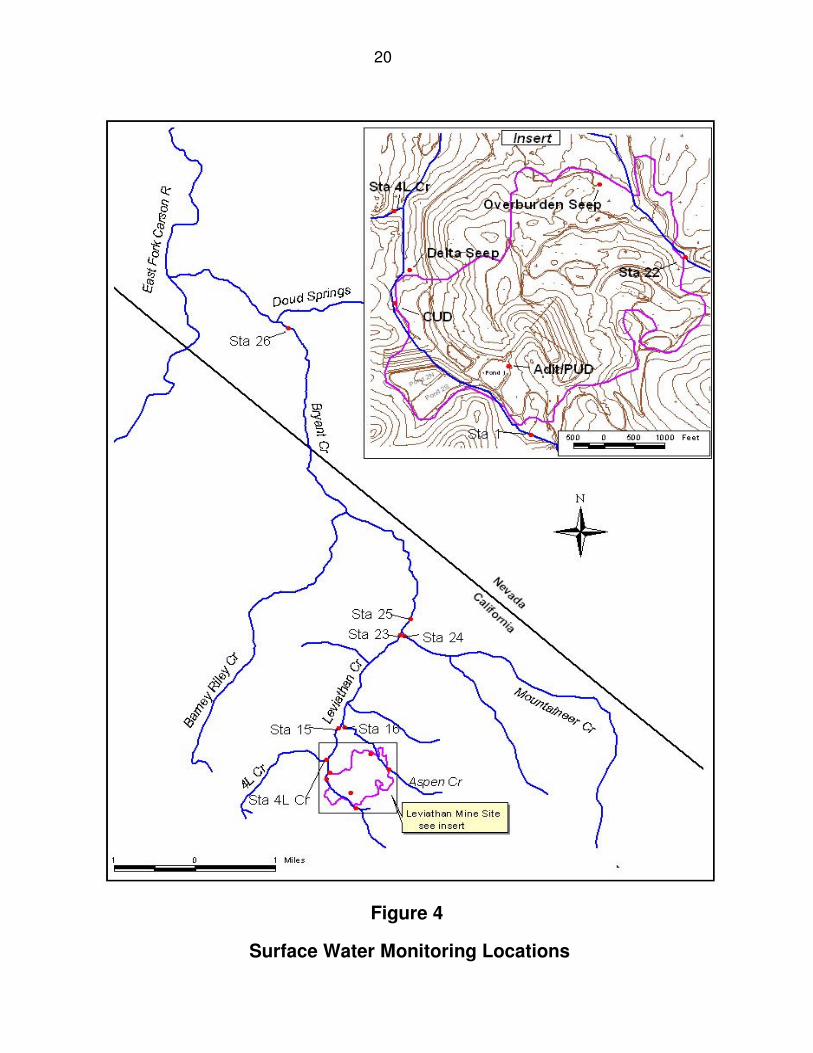
4.3 Surface Water Monitoring Surface water sampling and analysis was done in compliance with the Sampling and Analysis Plan for Leviathan Mine Site Surface Water Monitoring (January 2004) (SAP). The SAP is not included in this report, but copies may be obtained from the Lahontan Water Board. The Lahontan Water Board conducted monthly water quality monitoring through the 2007 water year. The Lahontan Water Board’s monthly and semi-annual surface water quality monitoring stations are shown in Figure 4. Measured parameters are summarized in Table 4. There are eleven sites that are sampled monthly and three sites that are sampled semi-annually, in the spring and fall. Two sampling events were delayed so samples were collected twice in certain months. The February 2007 sampling event was delayed until March 6, 2007 because of snowstorms and severe weather. Samples were collected again at the end of March. The June 2007 sampling event was delayed until July 2, 2007 because of a large wildfire in South Lake Tahoe. Samples were collected again at the end of July. Samples were collected for total and dissolved: aluminum, arsenic, calcium, cadmium, chromium, cobalt, copper, iron, magnesium, manganese, nickel, and zinc using a peristaltic pump and disposable tubing. Samples for dissolved metals, Total Dissolved Solids (TDS), and sulfate were field filtered through a 0.45-micron filter. Water Board staff collected samples in bottles pre-preserved by the contract laboratory with nitric acid. A duplicate sample and a field method blank were collected for each sampling event. Detailed sample collection and handling procedures and QA/QC protocols are described in the SAP. Due to a change in contracted laboratories, three separate laboratories analyzed samples collected by the Water Board during 06/07 water-year. Weck Laboratories in Industry, California analyzed all samples collected from October 2006 through February 2007, and the TDS and sulfate samples collected in March 2007 and April 2007. California Laboratory Services in Rancho Cordova, CA analyzed TDS and sulfate samples collected in May 2007 and June 2007. Basic Laboratory in Redding, CA, analyzed metals samples collected in May 2007 and June 2007, and all samples collected from July 2007 to September 2007.

14
4.4 Sampling Results From Surface Water Monitoring
4.4.1 Data Quality Objectives
The data quality objectives of the surface water monitoring program, as outlined in the SAP, were as follows:
• Identify the chemical characteristics of the various surface waters in the
vicinity of Leviathan Mine, including acid mine drainage (AMD) and creek waters.
• Monitor flows of AMD discharges and selected creeks.
• Track the impacts of remediation projects on downstream surface waters.
• Identify seasonal and annual variations in the chemical characteristics and
field parameters of surface waters in the vicinity of Leviathan Mine.
• Calculate the loading of metals to the downstream surface waters from the various discharges at Leviathan Mine.
4.4.2 Data Quality Evaluation and Summary
Surface water data collected for this water year is summarized in the Data Summary Report for 2007 Surface Water Monitoring, included as Appendix B. The analytical results of the sampling, along with any qualifiers, are presented in Tables B-14 to B-25. The tables also show the field data measurements collected by Water Board staff, including pH, temperature, electrical conductivity, and specific conductance.
An evaluation of the completeness of the required field collection shows that 138 samples were to be collected during the water-year (eleven stations sampled monthly and three stations sampled twice). In total, 136 of the required 138 samples were collected, resulting in a completeness of 98.5%. Station 15 (Leviathan Creek above the Aspen Creek confluence) was not sampled during the June 2007 and August 2007 events as the creek had no flow at the time of sampling. During the July sampling, the Water Board was discharging effluent to the creek from the Pond 1 treatment system, which increased the flows in the creek. All other stations were sampled as scheduled and an additional sample was collected at the Overburden Upper Seep. Basic Laboratories and Weck Laboratories completed Data Validation Checklists for all reports. They are not included in this report but are available for viewing at the Water Board. Appendix B, Attachment B-1 contains the Data Validation Checklists for Field QC and Level A/B Screening Checklists completed by Water Board staff for each sampling event. Data were assessed

15
to confirm that holding times were met and that field quality control samples were collected. Holding times were met for all of the samples collected, and all field quality control samples (duplicates and field method blanks) were collected as required in the SAP. Water Board staff collected one field duplicate per week of treatment. The Relative Percent Difference (RPD) was calculated for the duplicate and corresponding sample. Considerations for assessing the RPD include: • If both the sample and duplicate values were greater than or equal to five
times the Practical Quantization Limit (PQL), then the RPD must be less than or equal to 25% to be in control limits.
• If either the sample or duplicate value was less than five times the PQL, then the absolute difference between the sample and duplicate values had to be less than the PQL to be in control limits.
Results that were out of control limits were flagged with “*” qualifier on Appendix B, Tables B-14 to B-25. Out of the total number of results presented in this report, seven sets of sample and duplicate results were flagged for exceeding the control limits for RPD. Field Method Blanks (FMBs) were also collected once per sampling event and submitted for the same analyses as other samples. FMBs were collected and processed using distilled water in the same method as effluent samples. No data were disqualified based on FMB results. 4.4.3 Deviations from the SAP Deviations from the SAP were noted during the initial data review including the use of methods other than those specified in the SAP. The methods detailed in the SAP for metals analysis are 6010 and 6020, though Weck Labs used Methods 200.7 and 200.8 for metals analysis. Basic Labs also used Method 200.8 for metals analysis. These are essentially equivalent methods that were developed by different branches of EPA but produce similar results and are run on the same instrumentation (ICP and ICP-MS). Methods 200.7 and 200.8 will be added to the table of methods in the SAP.
4.5 Meteorological Monitoring The project’s weather station is located on the Lahontan Water Board’s construction trailer near Pond 1. It is a Davis Integrated Sensor Suite, and has been operational since its installation in November 2002. The system measures the following conditions hourly: wind speed, wind direction, rainfall, outside temperature, outside humidity, ultraviolet radiation, and solar radiation. Lahontan Water Board staff downloaded data from this weather station quarterly and transmitted the data to ARC for incorporation into the Leviathan Mine site-wide database.
16
5. SITE MAINTENANCE
The Lahontan Water Board conducted site maintenance work during the 2007 field season in accordance with the USEPA-approved Work Plan. Routine maintenance activities include repairing perimeter fencing, removing sediment from storm water ditches, covering exposed pond liners and minor road repair. Non-routine maintenance for 2007 included road improvements along the Nevada access road.
5.1 Repairing Perimeter Fencing
A barbed-wire fence surrounds the majority of the site. During the 2007 field season, Lahontan Water Board staff inspected portions of the perimeter fence and noted the fencing required repairs in locations adjacent to ponds 2 North and 2 South (Figure 3). Lahontan Water Board staff repaired the perimeter fence throughout the 2007 field season.
5.2 Storm Water Conveyance and Road Maintenance
Lahontan Water Board staff removed sediment contained in the concrete lined ditch east of Pond 1 during the 2007 field season (Figure 3).
Prior to conducting pond water treatment in 2007, Lahontan Water Board contractors replaced and extended the culvert conveying Aspen Creek below the Nevada access road. Additional road base material was placed and compacted in the roadway on both sides of the culvert to assist oversized vehicles negotiate the culvert crossing. The culvert replacement was initiated in late May and was completed in early June 2007.
5.3 Covering Exposed Liner
Lahontan Water Board staff visually inspected cover material around each pond to detect areas where earthen cover had eroded. Minor amounts of liner were exposed, and Lahontan Water Board staff placed material from storm water conveyances over the exposed liner.
5.4 Invasive Plant Control
The El Dorado County, Department of Agriculture (EDCDA) visited Leviathan Mine and applied herbicide (telar) on invasive plants in August 2007. This year (2007), as in 2002 through 2006, the EDCDA sprayed to eradicate tall whitetop (Lepidium latifolium).
17
FIGURE 1 SITE LOCATION

18

Figure 3Lahontan RWQCB AMD Capture and Treatment System
approximate channelunderdrain (CUD)discharge location
approximatetreated AMD
dischargepoint
Pond 1treatment
system
pitclari�er
NE
WS
Pond2N
Pond2S
Pond 4Pond 3
Pond 1
stormwater collection system
regradedpit
Leviathan Creek underground concrete pipe
Leviathan Creek concrete channel
Leviathan Creek concrete channel
Upper Leviathan Creek
California Road
Flow Control Structure (ADIT and PUD
collection point)
stormwater collection system
pit underdrain (PUD)
Approximate Scale in Feet
0 500
ADIT/Tunnel 5
20
Figure 4
Surface Water Monitoring Locations

21
TABLE 1 2007 DISCHARGE CRITERIA FOR POND WATER TREATMENT
Water Quality Parameter Maximum Four Day Average
PH -- Between 6.0 – 9.0 SUf2 Arsenic 0.34 mg/L f1 0.15 mg/Lf4
Aluminum 4.0 mg/L f1 2.0 mg/L f4
Cadmium 0.009 mg/L f1 0.004mg/L f4
Chromium 0.97 mg/L f1 0.31 mg/L f4
Copper 0.026 mg/L f1 0.016 mg/L f4
Iron 2.0 mg/L f1 1.0 mg/L f4
Lead 0.136 mg/L f1 0.005 mg/Lf4
Nickel 0.84 mg/L f1 0.094 mg/L f4
Selenium (Total Recoverable) Not Promulgated f3 0.005 mg/L f4
Zinc 0.21 mg/L f1 0.21 mg/L f4
mg/L milligrams per liter
f1 Dissolved concentration in a daily grab sample that has been field-filtered (0.45 micron) and acid fixed. f2 pH measurement based on 24-hour average discharge. f3 Total recoverable concentration in a daily grab sample that is acid fixed, but not filtered. f4 The sum of the detected concentration in four daily grab samples, from four consecutive
discharge days, divided by four. If the concentration detected by the laboratory is less than the detection limit, one-half of the detection limit shall be used in calculating the average concentration.
.

22
TABLE 2 POND 1 LIME TREATMENT PLANT
MONITORING LOCATIONS AND SAMPLING SCHEDULE
Monitoring Objective
Sampling Location
Analyses Frequency
pH, Al, and Fe pH: minimum of every two hours; Al and Fe as needed Influent
Sampling port on intake line just prior to Reactor 1
Off-Site Lab Analysis Once per week
Mid process
Reactor 1, Reactor 2,
Influent to Pit Clarifier
pH, Al, and Fe PH: minimum of every two hours
pH, Al, and Fe pH: minimum of every two
hours; Al and Fe: as needed (when discharging) Effluent Weir box near
Pit Clarifier Off-Site Lab
Analysis Daily (when discharging)
Sludge Pit Clarifier Off-Site Lab Analysis
Three samples collected after completion of treatment

23
TABLE 3 FLOW MONITORING LOCATIONS
Station Location/Description Equipment USGS Startup Date
Leviathan Creek above the mine (Station 1) Continuous flow recorder and appurtenances, solar power supply.
October 98
Pit Under-Drain at the flow control structure (PUD)
Continuous flow recorder and appurtenances, solar power supply, telemetry.
October 99
Adit at the flow control Structure (Adit) Continuous flow recorder and appurtenances, solar power supply, telemetry.
October 99
Pond 1 Stage Continuous stage recorder and appurtenances, solar power supply, telemetry.
October 99
Pond 4 Stage Continuous stage recorder and appurtenances, solar power supply, telemetry.
October 99
Channel Under-Drain (CUD) Continuous flow recorder and appurtenances, solar power supply, telemetry.
October 99
Aspen Creek above the mine (Station 22) Continuous flow recorder and appurtenances, solar power supply.
October 03
4L Creek above its confluence with Leviathan Creek (4L Creek)
Continuous flow recorder and appurtenances, solar power supply.
October 03
Leviathan Creek above its confluence with Aspen Creek (Station 15)
Continuous flow recorder and appurtenances, solar power supply, telemetry.
October 98
Aspen Creek above its confluence with Leviathan Creek (Station 16)
None. Monthly flow measurements to establish relationship w/STA 15.
October 98
Overburden (Aspen) Seep, above the Bioreactors (OS)
Continuous flow recorder and appurtenances, solar power supply.
October 98
Bryant Creek just below the confluence of Mountaineer and Leviathan Creeks (Station 25)
Continuous flow recorder and appurtenances, solar power supply.
October 98
Leviathan Creek just above the confluence of Mountaineer and Leviathan Creeks (Station 23)
Continuous flow recorder and appurtenances, solar power supply
November 99
Mountaineer Creek just above the confluence of Leviathan and Mountaineer Creeks (Station 24)
None. Monthly flow measurements to establish relationship w/STA 23.
December 99
Bryant Creek just above confluence with Doud Springs (Station 26)
Continuous flow recorder and appurtenances, solar power supply
August 01

24
TABLE 4 SURFACE WATER QUALITY MONITORING STATIONS
Lahontan
Water Board Station
Site Description Sampling Frequency Parameters Measured
Station 1 Leviathan Creek above Leviathan Mine.
Monthly Total and Dissolved Metals for aluminum, arsenic, calcium, cadmium, cobalt, chromium, copper, iron, magnesium, manganese, nickel, zinc; Total Dissolved Solids (TDS); Sulfate. Field: pH, temperature, electrical conductivity, and specific conductance.
Adit Drainage from Tunnel #5 (the Adit), prior to entering evaporation ponds.
Monthly Same as above.
Pit Under -Drain (PUD)
Drainage from shallow ground water collection pipes in pit, prior to entering evaporation ponds.
Monthly Same as above.
Channel Under-Drain (CUD)
Discharge from Channel Under-Drain below Leviathan Creek concrete channel.
Monthly Same as above.
Delta Seep (DS)
Seepage from the toe of the Delta Slope, located north of Pond 4.
Semi-annual Same as above.
Station 15 Leviathan Creek, above the confluence of Leviathan and Aspen creeks.
Monthly Same as above.
Station 16 Aspen Creek, above the confluence of Leviathan and Aspen creeks.
Monthly Same as above.
4L Creek 4L Creek, just above the confluence of Leviathan Creek.
Semi-annual Same as above.
Station 22 Aspen Creek above Leviathan Mine.
Monthly Same as above.
Overburden Seep (OS)
Overburden seepage (a.k.a. Aspen Seep), above the bioreactors.
Monthly Same as above.
Station 23 Leviathan Creek above the confluence of Leviathan and Mountaineer creeks.
Monthly Same as above.
Station 24 Mountaineer above the confluence of Leviathan and Mountaineer creeks.
Monthly Same as above.
Station 25 Bryant Creek below the confluence of Leviathan and Mountaineer creeks.
Monthly Same as above.
Station 26 Bryant Creek above the confluence of Doud Springs and Bryant Creek.
Semi-annual Same as above.