YEAR-END REPORT 2014 - Investment AB Latour · Year-end Report 2014 ... Securitas and Sweco. ... in...
20
YEAR-END REPORT 2014
Transcript of YEAR-END REPORT 2014 - Investment AB Latour · Year-end Report 2014 ... Securitas and Sweco. ... in...

YEAR-END REPORT
2014
2 YEAR-END REPORT 2014
Year-end Report 2014
NET ASSET VALUE AND THE LATOUR SHARE • The net asset value rose to SEK 250 per share, compared to SEK 212 per share at the beginning of the year. This is an
increase of 21.1 per cent, adjusted for dividends. By comparison, the Stockholm Stock Exchange's Total Return Index (SIXRX) increased by 15.8 per cent. The net asset value was SEK 278 per share at 17 February.1
• The total return on the Latour share was 22.1 per cent for 2014, which is better than the SIXRX index for the ninth consecutive year.
• The Board of Directors proposes an increase of the annual dividend to SEK 6.00 (5.50) per share.
INDUSTRIAL OPERATIONS Fourth quarter • The industrial operations' incoming orders increased to SEK 1,994 m (1,800), which means a 1 per cent decrease for
comparable entities adjusted for foreign exchange effects. • The industrial operations recorded net sales of SEK 2,018 m (1,839), which represents a 2 per cent decrease for
comparable entities adjusted for foreign exchange effects. • The operating profit before restructuring and non-recurring expenses increased to SEK 229 m (180), which corresponds
to an adjusted operating margin of 11.4 (9.8) per cent for continuing operations. Restructuring and non-recurring expenses amounted to SEK 0 m (10) during the quarter.
• Hultafors acquired Tradeport AB. The company has 23 employees and generates an annual turnover of approximately SEK 70 m. Tradeport develops and markets premium safety footwear and workwear.
Full year • The industrial operations' incoming orders increased to SEK 7,663 m (6,988), which means an unchanged level for
comparable entities adjusted for foreign exchange effects. • The industrial operations recorded net sales of SEK 7,581 m (6,897), which means an unchanged level for comparable
entities adjusted for foreign exchange effects. • The operating profit before restructuring and non-recurring expenses increased to SEK 796 m (686), which corresponds
to an adjusted operating margin of 10.5 (9.9) per cent for continuing operations. Restructuring and non-recurring expenses amounted to SEK 41 m (37) during the year.
• The annual sales of the seven acquisitions made for the industrial operations during the year add up to approximately SEK 730 m. SEK 300 m of this have been consolidated in 2014.
GROUP • The Group's profit after financial items was SEK 2,064 m (1,658). • The Group's profit after tax was SEK 1,874 m (1,483), which is equivalent to SEK 11.75 (9.31) per share. • Net debt at the end of December was SEK 3,516 m (1 787) and is equivalent to 8.1 per cent of the market value of total
assets.
INVESTMENT PORTFOLIO • During the year, the value of the investment portfolio increased by 26.4 per cent adjusted for dividends. The comparable
index (SIXRX) increased by 15.8 per cent. 1 The calculation of the net asset value at 17 February 2015 was based on the value of the investment portfolio at 1 p.m. on 17 February and the same values at 31 December were used for the unlisted portfolio.
LATOUR AT A GLANCE Investment AB Latour is a mixed investment company consisting primarily of wholly-owned industrial operations and an investment portfolio of listed holdings in which Latour is the principal owner or one of the principal owners. The investment portfolio consists of nine substantial holdings that had a market value of about SEK 31 billion as at 31 December 2014. The holdings in the investment portfolio with the greatest value are Assa Abloy, Securitas and Sweco. The wholly-owned industrial operations are grouped into five business areas: Hultafors Group, Latour Industries, Nord-Lock, Specma Group and Swegon. The wholly-owned industrial operations generated a turnover of approximately SEK 7.6 billion in 2014.

YEAR-END REPORT 2014 3
Comments from the CEO "We are very pleased to be able to report yet another quarter with excellent performance. And this is despite the fact that volume growth is still slow. This reaffirms that we are maintaining a high level of efficiency and good cost control in our operations. Growth remains weak in European markets, but the picture is not uniform. The UK, Irish and Scandinavian markets are showing good growth. Russia, Finland, France and southern Europe are weak markets and there are many uncertainties surrounding growth in the all-important German market.
For the whole of the industrial operations, it has been a year in which both incoming orders and invoiced sales were unchanged, when adjusted for foreign exchange effects and acquisitions. A decrease of 1 per cent in incoming orders and 2 per cent in invoiced sales was reported for the fourth quarter. The picture across the business areas is still mixed, just as it was earlier in the year. All of the business areas, with the exception of Swegon, continue to report organic growth in both the full year and fourth quarter. Growth has been especially good in Nord-Lock, despite a slight slow-down towards the end of the year. Our largest business area Swegon is exhibiting negative growth, adjusted for acquisitions. Nevertheless, growth during 2014, including acquisitions, was 9 per cent.
Incoming orders increased during the fourth quarter overall by 11 per cent to SEK 1,994 m (1,800). This is equivalent to a 1 per cent organic decline when adjusted for foreign exchange effects and acquisitions. Invoicing increased by 10 per cent to SEK 2,018 m (1,839). The adjusted operating profit was SEK 229 m (180), which corresponds to an adjusted operating margin of 11.4 (9.8) per cent. Nord-Lock and Hultafors Group continue to show a strong earnings trend. Latour Industries has stabilised and Swegon is reporting healthy margins set in relation to the weak growth in volumes. Thanks to the measures that we have undertaken and the acquisitions that we have made, we now have favourable conditions for a continuation of the positive earnings trend in the industrial operations. However, it still remains uncertain whether market developments will give us any other help.
Although there was less acquisition activity in the fourth quarter, we made a very interesting addition to Hultafors through the acquisition of the footwear company Tradeport AB, which markets and develops premium safety footwear and workwear.
Acquisition activity was relatively high in the previous quarters in 2014. This mainly took place in Swegon, where we made a total of four acquisitions, P. Lemmens in Belgium to Commercial Ventilation, Econdition in Germany in Cooling, Luftmiljö in Home Solutions and Vibro-Acoustics® in North America. Furthermore, Latour Industries acquired Elvaco and Bastec in 2014. In total this year’s acquisitions adds SEK 730 m I annual sales and 350 employees. More details about the acquisitions can be found later on in this interim report. The coming period will be marked by the integration of the acquisitions that we have made, and Swegon, above all, has a period of consolidation ahead. At the same time, we are focusing again on compiling a list of potential new acquisitions.
In all essential respects, our listed holdings are continuing to show very good progress. The value of the investment portfolio rose 26.4 per cent, adjusted for dividends, during 2014. This is significantly higher than the comparable index (SIXRX), which rose 15.8 per cent. Several of our listed companies have been active and have made acquisitions and, it should be pointed out, that the underlying earnings growth has been consistently very positive.
In 2014, the net asset value in Latour increased by 21.1 per cent, adjusted for paid dividends. Overall, 2014 delivered a very strong performance and consequently the Board is able to propose an increase in the dividend to SEK 6.00 (5.50) per share."
Jan Svensson President and Chief Executive Officer

4 YEAR-END REPORT 2014
Industrial operations Order intake, invoicing and earnings Fourth quarter The total order intake increased to SEK 1,994 m (1,800) during the fourth quarter. Invoicing increased to SEK 2,018 m (1,839), which is equivalent to a 2 per cent organic decline when adjusted for foreign exchange effects and acquisitions. The adjusted operating profit in the wholly-owned industrial operations increased by 27 per cent to SEK 229 m (180) in the fourth quarter. The adjusted operating margin was 11.4 (9.8) per cent. The reported operating profit including non-recurring expenses increased to SEK 229 m (170), which corresponds to a reported operating margin of 11.4 (9.2) per cent. Full year
The total order intake in continuing operations increased to SEK 7,663 m (6,988) during the year. Invoicing increased to SEK 7,581 m (6,897), which means an unchanged level of invoicing when adjusted for foreign exchange effects and acquisitions. The adjusted operating profit in the wholly-owned industrial operations increased by 16 per cent to SEK 796 m (686). The adjusted operating margin was 10.5 (9.9) per cent. The reported operating profit including non-recurring expenses increased to SEK 755 m (649), which corresponds to a reported operating margin of 10.0 (9.4) per cent.
Please refer to pages 5-8 for more details about developments in each business area.
Acquisitions and divestitures
Hultafors Group acquired the footwear company Tradeport in the fourth quarter. The acquisition complements the brand portfolio in Hultafors with premium products of safety footwear, workwear and accessories. Tradeport's range is based on its own brands, Solid Gear, Toe Guard and Dunderdon, which are complemented by Puma safety footwear to be able to offer the best product mix in the market. Tradeport generates a turnover of approximately SEK 70 m and a level of profitability very much in line with Hultafors Group's levels. The company has 23 employees and mainly operates in the Swedish market.
In early July, Swegon acquired 90 per cent of the shares in P. Lemmens, a leading manufacturer of air handling units in Belgium. P. Lemmens, which has its headquarters in Gembloux in Belgium, has 59 employees and reported a turnover of EUR 26 m in 2013. Its largest product area is compact air handling units with built-in controls. The product range also includes fans, air curtains and products for heat recovery. The acquisition will have a positive impact on the Latour Group's earnings per share from the very start. Swegon holds an option to purchase the remaining outstanding 10 per cent at a price in the range of SEK 47-73 m (in March 2019 at current exchange rates for SEK/EUR) depending on the sales growth in the business. This acquisition increases the net debt of the Latour Group by approximately SEK 720 m. This figure includes full additional purchase price as the acquisition is fully consolidated from day one.
Swegon took a key step into the North American market in the second quarter via its acquisition of Vibro-Acoustics®,
a leading manufacturer of HVAC noise and vibration control products in North America. The company has 167 employees and generated a turnover in 2013 of CAD 28 m, which is equivalent to approximately SEK 170 m.
Swegon also acquired Econdition GmbH in Germany at the end of August. Econdition is a leading supplier of cooling systems and service for data centres and industrial applications. The company's head office is located in Munich and it employs 40 staff and reported a turnover of approximately EUR 14 m in 2013. The acquisition of Econdition is in line with Swegon's strategy to expand its presence in the German market and will increase Swegon's cooling systems sales, especially in the growing segment of data centre cooling. The products that are sold can also be produced at Blue Box, Swegon's Italian operations.
Swegon also acquired Luftmiljö AB in Lidköping in early September. Luftmiljö is a manufacturer of proprietary air handling units for residential buildings with integrated control equipment for air flows up to about 0.5 m³/s. The company was founded in 1999 with production and development in Lidköping and with sales offices in Stockholm and Gothenburg. It has annual sales of SEK 15 m and 14 employees.
Latour Industries acquired Bastec AB at the beginning of July. Bastec AB is an expanding Swedish company that develops and markets systems for building automation. It has a staff of 28 and a turnover in excess of SEK 45 m, with a focus on energy efficiency. Its main product is BAS2, which is primarily used to control and monitor ventilation, heating, cooling and other technical systems in buildings. BAS2 is based on proprietary hardware and software. Sales are mainly conducted through partners that independently implement customer projects and contracts based on BAS2. Bastec also conducts its own contracts and customer projects in the Malmö region. Bastec's products are currently installed in about 4,000 buildings which must comply with stringent requirements for reliability, ease of use and energy efficiency.
In the first quarter, Latour Industries acquired 80 per cent of the shares in Elvaco AB with an option to acquire the residual 20 per cent of the shares during the first quarter of 2017. Elvaco has 20 employees and annual sales in excess of SEK 60 m. Through the option, Elvaco is fully consolidated from day one.
The annual sales of the acquisitions announced so far this year add up to approximately SEK 730 m. SEK 300 m of this have been consolidated in the financial statements during the year.

YEAR-END REPORT 2014 5
Industrial operations summary
Business area results
Group trailing 12 months
2014 2013 2014 2013 2014 2013 2014 2013 2014 2013 2014 2013SEK m Q4 Q4 Full Year Full Year Q4 Q4 Full Year Full Year Q4 Q4 Full Year Full Year
Hultafors Group 365 333 1,306 1,208 53 54 177 138 14.5 16.2 13.6 11.5
Latour Industries 286 264 1,055 982 29 17 68 67 10.2 6.6 6.4 6.8
Nord-Lock 169 154 722 624 45 21 211 123 26.7 13.9 29.3 19.8
Specma Group 328 306 1,294 1,152 5 -1 42 12 1.5 -0.2 3.2 1.0
Swegon 870 783 3,209 2,936 98 89 298 346 11.2 11.4 9.3 11.8
Eliminations - -1 -5 -5 -1 - - - - - - -
2,018 1,839 7,581 6,897 229 180 796 686 11.4 9.8 10.5 9.9 expenses - - - - - -10 -41 -37 - - - -
2,018 1,839 7,581 6,897 229 170 755 649 11.4 9.2 10.0 9.4Gain/loss from sale/purchase of businesses - - - - - -20 -13 -25
Other companies and items ² - 5 - 47 -18 -13 4 -3
2,018 1,844 7,581 6,944 211 137 746 621
Net sales Operating profit Operating margin %
* The comparative year have been adjusted to correspond to the existing structure
2014 2013 2014 2013 Of which Of whichSEK m Trailing 12 Trailing 12 Trailing 12 Trailing 12 2014 acquisitions currency
Hultafors Group 851 780 20.8 16.1 8.1 0.7 3.6
Latour Industries 873 723 7.8 8.8 7.5 3.1 1.0
Nord-Lock 562 529 37.6 21.6 15.8 - 4.9
Specma Group 588 572 0.1 -0.1 12.3 2.7 1.9
Swegon 1,744 1,155 17.1 30.0 9.3 13.8 3.0
Total 4,618 3,759 16.4 17.3 9.9 6.9 2.8
¹ Calculated as total assets less cash and other interest-bearing assets and less non-interest-bearing liabilities. Calculated on the average for the past 12 months.
² Net sales refer to the operations (Brickpack) divested in 2013 preniously presented as part of Latour Industries.
Operating capital¹ Return on operating capital % Growth in net sales %
1000
2000
3000
4000
5000
6000
7000
8000
100
200
300
400
500
600
700
800
SEK mSEK m
Operating profit Orders received Invoicing

6 YEAR-END REPORT 2014
Development per business area
Hultafors Group
Highlights • Tradeport AB, with a turnover of SEK 70 m, was
acquired in the quarter. See page 4 for further information.
• Net sales rose 9.8 per cent during the quarter. Growth was 3.5 per cent when adjusted for foreign exchange effects and acquisitions.
• All product areas reported growth. • Increased demand compared to last year, particularly in
Italy, Ireland, Norway, Sweden and the Netherlands. • Good operating profit as a result of last year's
programme of measures to improve efficiencies and positive foreign exchange effects.
Breakdown of net sales
Latour Industries
Highlights • Net sales rose 8.2 per cent during the quarter. Growth
was 2.5 per cent when adjusted for foreign exchange effects and acquisitions.
• The effects of cost reductions and a programme of measures have led to a significantly better fourth quarter than in 2013.
• All the companies in Latour Industries have reported positive results for the quarter.
• Elvaco and Bastec, the newly-acquired companies, have been developed according to plan.
Breakdown of net sales
2014 2013 2014 2013(SEK m) Q4 Q4 Full Year Full Year
Net sales 365 333 1,306 1,208EBITDA, adjusted* 58 59 195 157EBITA, adjusted* 55 55 182 142EBIT, adjusted* 53 54 177 138EBIT, reported 53 54 177 126
EBITA %, adjusted* 15.0 16.4 14.0 11.8
EBIT %, adjusted* 14.5 16.2 13.6 11.5
Growth % 9.8 0.4 8.1 -3.9
Of which exchange effects 3.8 -0.3 3.6 -1.6Of which acquisitions 2.4 - 0.7 -
Average number of employees 627 625 617 642
* Excluding resttructuring costs
2014 2013 2014 2013(SEK m) Q4 Q4 Full Year Full Year
Workwear 199 193 683 635Tools 123 110 474 443Ladders 33 29 135 125New Business 1 1 5 5Tradeport 9 - 9 -
365 333 1,306 1,208
Pro forma adjustment¹ 61
Trailing 12 month pro forma 1,367
¹ Pro forma for completed acquisitions
2014 2013 2014 2013(SEK m) Q4 Q4 Full Year Full Year
Net sales 286 264 1,055 982EBITDA, adjusted* 34 23 89 89EBITA, adjusted* 30 18 70 69EBIT, adjusted* 29 17 68 67EBIT, reported 29 16 68 63
EBITA %, adjusted* 10.4 6.7 6.6 7.0
EBIT %, adjusted* 10.2 6.6 6.4 6.8
Growth % 8.2 22.5 7.5 28.5
Of which exchange effects 0.6 -0.1 1.0 -0.4Of which acquisitions 5.2 5.9 3.1 17.2
Average number of employees 799 714 733 642
* Excluding resttructuring costs
2014 2013 2014 2013(SEK m) Q4 Q4 Full Year Full Year
LSAB Group 112 111 434 405REAC 63 56 242 196Kabona 35 39 126 128Elvaco 23 - 55 -Specma Seals 26 23 98 102Bastec 13 - 22 -AVT 14 21 57 92Carstens - 14 21 60
286 264 1,055 982
Pro forma adjustment¹ 24
Trailing 12 month pro forma 1,079
¹ Pro forma for completed acquisitions
Hultafors Group offers products in the categories of clothing for professionals, safety footwear, hand tools, ladders and scaffolding. The products are marketed through the brands that have strong positions in their respective markets: Snickers Workwear, Dunderdon, Solid Gear, Toe Guard, Hultafors and Wibe Ladders. Hultafors Group is also a distributor for the German manufacturing company Fein on the Swedish market.
Latour Industries consists of a number of operating areas, each with its own business concept and business model. Our ambition is to develop independent entities within the business area which can eventually become new business areas within Latour. The common denominator is that most customers are active in manufacturing.

YEAR-END REPORT 2014 7
Nord-Lock
Highlights • Net sales rose 9.6 per cent during the quarter. Organic
growth was 1.5 per cent when adjusted for foreign exchange effects.
• Continued robust growth in Emerging Markets and Asia Pacific, particularly in China and South Korea.
• Strong earnings trend during the year attributable to growth in volumes and the implementation of measures to improve efficiencies. Adjusted EBIT increased by 72 per cent during the year, and sales per employee increased by 20 per cent.
• Incoming orders increased by 11 per cent in the quarter and by 17 per cent for the full year.
Breakdown of net sales
Specma Group
Highlights • Net sales rose 7.4 per cent during the quarter. Organic
growth was 5.1 per cent when adjusted for foreign exchange effects.
• The headcount has been reduced by 28 in the fourth quarter, compared to the beginning of the year and the third quarter. These measures produce an immediate effect.
• In addition to these measures, the drop in earnings in the quarter has been attributed to certain non-recurring costs and pricing pressures in the market.
Breakdown of net sales
2014 2013 2014 2013(SEK m) Q4 Q4 Full Year Full Year
Net sales 169 154 722 624EBITDA, adjusted* 50 26 229 139EBITA, adjusted* 46 22 214 126EBIT, adjusted* 45 21 211 123EBIT, reported 45 13 211 114
EBITA %, adjusted* 27.1 14.3 29.6 20.2
EBIT %, adjusted* 26.7 13.9 29.3 19.8
Growth % 9.6 8.0 15.8 -2.5
Of which exchange effects 8.1 -1.8 4.9 -3.3Of which acquisitions - - -
Average number of employees 341 388 367 382
* Excluding resttructuring costs
2014 2013 2014 2013(SEK m) Q4 Q4 Full Year Full Year
Europe 87 84 394 348North America 49 42 198 172Asia Pacific 32 25 114 83Emerging markets 4 3 24 16Other -3 - -8 5
169 154 722 624
Pro forma adjustment¹ -
Trailing 12 month pro forma 722
¹ Pro forma for completed acquisitions
2014 2013 2014 2013(SEK m) Q4 Q4 Full Year Full Year
Net sales 328 306 1,294 1,152EBITDA, adjusted* 10 4 61 30EBITA, adjusted* 5 -1 42 12EBIT, adjusted* 5 -1 42 12EBIT, reported 5 -3 1 -
EBITA %, adjusted* 1.5 -0.2 3.2 1.1
EBIT %, adjusted* 1.5 -0.2 3.2 1.0
Growth % 7.4 14.2 12.3 -3.8
Of which exchange effects 2.3 0.1 1.9 -0.7Of which acquisitions - 4.9 2.7 3.5
Average number of employees 748 815 760 731
* Excluding resttructuring costs
2014 2013 2014 2013(SEK m) Q4 Q4 Full Year Full Year
Global Division 237 218 921 829Nordic Division 91 88 373 323
328 306 1,294 1,152
Pro forma adjustment¹ -
Trailing 12 month pro forma 1,294
¹ Pro forma for completed acquisitions
Nord-Lock is a world leader in bolt securing systems. Its innovative products include wedge-locking technology and Superbolt tensioners which have been providing customers in all major industrial sectors with safe, reliable and effective bolt securing solutions for over 30 years. Nord-Lock optimises the most demanding types of applications using its extensive technical expertise.
Specma Group is an industry leader and Nordic player with an international presence in application customised systems and components for hydraulics. The business is divided into a Global Division that serves major international OEM customers, and a Nordic Division that serves smaller OEM customers, offers industry an MRO concept and serves the after sales market in the Nordic region.
8 YEAR-END REPORT 2014
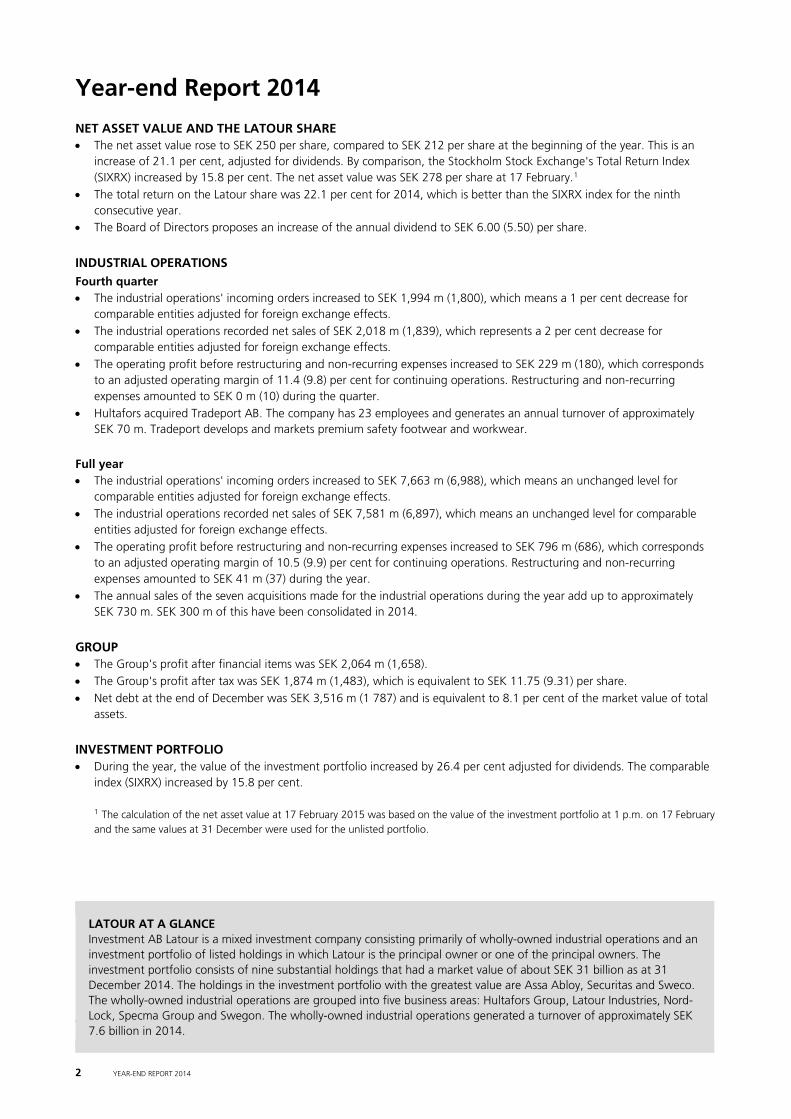
Swegon
Highlights • Net sales rose 11 per cent during the quarter,
corresponding to a 9.4 per cent organic decline when adjusted for foreign exchange effects and acquisitions.
• The picture for demand remains mixed across Europe; there are signs of improvement in Scandinavia, the UK and several export markets, while the markets in Finland and Russia, in particular, are weak.
• The business area Cooling salvaged two orders for projects amounting to SEK 22 m.
• Incoming orders increased significantly during the quarter for North American Vibro-Acoustics®, which was acquired during the year.
• Another quarter with an EBIT margin in excess of 10 per cent, despite negative organic growth.
Breakdown of net sales
2014 2013 2014 2013(SEK m) Q4 Q4 Full Year Full Year
Net sales 870 783 3,209 2,936EBITDA, adjusted* 116 107 373 415EBITA, adjusted* 99 90 303 349EBIT, adjusted* 98 89 298 346EBIT, reported 98 89 298 346
EBITA %, adjusted* 11.4 11.4 9.4 11.9
EBIT %, adjusted* 11.2 11.4 9.3 11.8
Growth % 11.0 10.2 9.3 5.4
Of which exchange effects 3.3 -0.6 3.0 -1.5Of which acquisitions 17.1 13.4 13.8 8.8
Average number of employees 1,807 1,515 1,674 1,461
* Excluding resttructuring costs
2014 2013 2014 2013(SEK m) Q4 Q4 Full Year Full Year
Sweden 180 211 712 784Rest of Nordic region 200 180 767 752Rest of world 490 392 1,730 1,400
870 783 3,209 2,936
Pro forma adjustment¹ 294
Trailing 12 month pro forma 3,503
¹ Pro forma for completed acquisitions
Swegon provides components and innovative system solutions that create a good indoor climate and contribute to significant energy savings in all types of buildings. Swegon's products constitute a turnkey solution for the perfect indoor climate. Including foreign sales companies, Swegon has 1,800 employees and generates a turnover in excess of SEK 3 billion.
8 I N T E R I M R E P O R T J A N U A R Y – J U N E 2 0 1 4

YEAR-END REPORT 2014 9
The Latour share's net asset value
In order to facilitate the evaluation of Latour's net asset value, Latour provides an estimated range of the value (Enterprise Value) for each business area based on EBIT multiples. These multiples have been calculated by comparing valuations of listed companies in comparable industries. Since there are variations in the listed companies’ valuations these are reflected in the tables by valuing each business area in a range. Deductions are then made for the Group's net debt. The evaluation of comparable companies is based on the share price on the balance sheet date. Any price changes after the balance sheet date have not been taken into consideration.
A more detailed description can be found on pages 20–21 in Latour's Annual Report for 2013.
In some cases, the valuation multiples for comparable companies span over a very big range. For this reason the multiples may be adjusted in order to avoid unreasonable values. The valuation multiple EV/sales has been used for certain entities. The indicative value stated below is not a complete market valuation of Latour's holdings.
The net asset value increased to SEK 250 per share during the period from SEK 212 at the beginning of the year. The net asset value consequently increased by 21.1 per cent, adjusted for dividends, which can be compared to SIXRX which rose 15.8 per cent.
EBIT miltiple or Valuation²Net sales¹ EV/sales multiple Valuation² Valuation² SEK/share³
SEK m EBIT¹ Range Range Average Range
Hultafors Group 1,367 189 11 – 15 2,078 – 2,834 2,456 13 – 18Latour Industries 1,079 79 11 – 15 864 – 1,178 1,021 5 – 7Nord-Lock 722 211 12 – 16 2,536 – 3,381 2,958 16 – 21Specma Group 1,294 41 0.4 – 0.6 518 – 776 647 3 – 5Swegon 3,503 350 13 – 17 4,546 – 5,945 5,246 29 – 37
7,965 869 10,541 – 14,114 12,327 66 – 89
Listed shares (see table on page 10 for breakdown) 30,537 192
Unlisted part-owned companiesAcademic Work⁴, 20.06 % 319 2Diamorph⁵, 21.18 % 125 1Oxeon⁶, 31.08 % 25 0
Other assetsShort trading portfolio 79 0Dilution effect of option programme -38 0Other 0 0
Consolidated net debt -3,516 -22
Estimated value 39,859 250(38 073 – 41 645) (239 – 261)
¹ Trailing 12 months for current company structure. EBIT is reported before restructuring costs.
² EBIT and EV/sales recalculated taking into consideration the listed share price on 31 December 2014 for comparable companies in each business area.
³ Calculated on the basis of the number of outstanding shares.
⁴ Valued according to the latest statement made by an independent valuer.
⁵ Valued according to the latest transaction.
⁶ Valued according to Latour's latest acquisition price.
5.0%
10.0%
15.0%
20.0%
25.0%
30.0%
60.0
80.0
100.0
120.0
140.0
160.0
180.0
200.0
Q1 2009 Q1 2010 Q1 2011 Q1 2012 Q1 2013 Q1 2014
Net asset discountSEK per share
Net asset discount Market price

10 YEAR-END REPORT 2014
Investment portfolio 31 December 2014
In the year as a whole, the aggregate value of the investment portfolio increased by 26.4 per cent, adjusted for dividends, while the comparable index (SIXRX) increased by 15.8 per cent.
870,000 more shares were acquired in Tomra in the fourth quarter. 4,370,000 shares were acquired in Tomra earlier in the year.
Cost Listed share price¹ Market value Share of votes Share of equityAktie Number SEK m SEK SEK m % %
Assa Abloy² ³ 35,165,243 1,697 415 14,587 29.5 9.5Fagerhult³ ⁴ 18,620,400 571 138 2,566 49.0 49.2HMS Networks³ 3,027,322 250 149 451 26.7 26.7Loomis² ³ 7,538,328 108 226 1,704 28.6 10.0Nederman³ 3,512,829 306 168 588 30.1 30.1Nobia 23,100,000 469 70 1,605 13.8 13.8Securitas² ³ 39,732,600 1,081 94 3,751 29.6 10.9Sweco² ³ 28,997,760 152 106 3,074 22.8 31.9Tomra³ ⁵ 36,560,000 1,795 60 NOK⁶ 2,211 24.7 24.7
Total 6,429 30,537
³ Shown as associated companies in the balance sheet.
⁴ At the end of December 2014, 90,000 shares were loaned out and are therefore not counted in Latour's share of votes.
⁵ At the end of the report period, the listed share price was NOK 57.50 which has been translated to SEK at the exchange rate on the balance sheet date.
⁶ The last price paid is used as the listed share price.
¹ Purchase price at the end of the report period.
² The shareholdings in Assa Abloy, Loomis, Securitas and Sweco consist of class A and class B shares. Due to the limited trading in class A shares in Sweco, and the fact that the other three companies' class A shares are unlisted, the shares are reported together and have been given the same listed share price.
24,4
30,5
2,61,2
1,0 0,6 0,4 0,3 0,04 0,01 -0,08
21
23
25
27
29
31
33
31/12/2013 Assa Abloy Fagerhult Securitas Loomis Nobia Tomra HMS Sweco Nederman 31/12/2014
Movements in investment portfolio values
+ 6.1 SEK billion
SEK billion
Movements in investment portfolio values (SEK billion). These figures include acquired cost but not dividend payments for the period.
-10%
10%
30%
50%
70%
90%
Fagerhult Loomis Securitas Nobia Assa Abloy HMS Tomra Sweco Nederman
Total return for the portfolio companies
SIXRX (15,8%)
The total return, including share price development and dividends, for each portfolio company.

YEAR-END REPORT 2014 11
Result and financial position
Group The Group's profit after financial items was SEK 2,064 m (1,658). Profit after tax was SEK 1,874 m (1,483), which is equivalent to SEK 11.75 (9.31) per share.
The Group's cash in hand and liquid investments reached SEK 428 m (472). Interest-bearing debt, excluding pension liabilities, was SEK 3,951 m (2,121). The Group's net debt, including pension liabilities, was SEK 3,516 m (1,787). The equity ratio was 85 (88) per cent calculated on reported equity in relation to total assets, including undisclosed surpluses in associated companies.
In the second quarter, a financial strategy decision was taken to buy out all the Swedish pension liabilities within the FPG/PRI pension system. A total of SEK 148 m in pension liabilities was bought out and incurred a non-recurring expense of SEK 10 m which is reported in net financial items.
There have been no transactions with related parties that have had a material effect on the results or financial position of the Group.
Investments During the period, SEK 197 m (162) was invested in property, plant and equipment, of which SEK 129 m (128) was machinery and equipment, SEK 30 m (20) vehicles and 38 m (14) buildings. Out of total investments for the year, SEK 46 (30) m refers to fixed assets in new acquisitions.
Parent company The parent company's profit after financial items was SEK 816 m (805). The parent company's equity ratio was 85 (88) per cent.
Not including repurchased shares, the number of outstanding shares at 30 December 2014 amounted to 159,493,000. At the end of the period, Latour held 467,000 repurchased class B shares. The total number of outstanding call options is 730,000.
The allocation of issued shares is 11,931,278 class A shares and 148,028,722 class B shares.
Events after the reporting period There were no material events subsequent to the end of the reporting period.
Dividends The Board of Directors proposes an increase of the regular dividend of SEK 6.00 (5.50) per share. In absolute terms, this is equivalent to SEK 957 m in dividends.
Risks and uncertainties The main risk to which the Group and the parent company are exposed is the risk attributable to adverse changes in the values of financial instruments, including a general decline in the stock market or in the value of an individual holding. This includes uncertainties relating to changes in exchange rates and interest rates. Latour has a well-diversified holding of shares, spread across nine listed holdings and five wholly-owned business areas. This means that the development and performance of an individual holding will not have a drastic impact on the portfolio as a whole. As the wholly-owned industrial operations have increased in size, Latour as a whole is influenced to a greater degree by changes attributable to these operations. On the whole, Latour is deemed to have a good risk diversification in its portfolio, which covers several industries, with a certain emphasis on sectors linked to the construction industry. Construction can also be divided into several dimensions, such as new builds or government-subsidised repair, conversion or extension work, locally or globally, and housing, office and industrial premises or infrastructure projects. No other material risks in addition to those described in Note 34 of Latour's Annual Report 2013 are deemed to have arisen.
Audit and accounting policies This interim report has been prepared in accordance with the Swedish Annual Accounts Act and IAS 34 Interim Reporting in respect of the Group and in accordance with the Annual Accounts Act and Recommendation RFR 2 Accounting for Legal Entities of the Swedish Financial Reporting Board in respect of the parent company.
New accounting standard requirements that came into effect on 1 January 2014 have not had any impact on the Group's or parent company's accounting as at 31 December 2014.
In other respects, the accounting policies adopted by the Group and parent company are consistent with those used in the preparation of the most recent annual report.
This report has not been audited by the company's auditors.
Nomination Committee The Nomination Committee for the Annual General Meeting on 5 May 2015 comprises the following members: Gustaf Douglas (Chairman, main owner) Björn Karlsson (Bertil Svensson's family and trust) Johan Strandberg (SEB funds) The Nomination Committee can be contacted through Latour's website www.latour.se under Corporate Governance, Board of Directors, Nominating Committee.
Gothenburg, 18 February 2015
Jan Svensson President and CEO
12 YEAR-END REPORT 2014
For further information please contact: Jan Svensson, President and CEO, tel. +46 (0)705-77 16 40. Anders Mörck, Chief Financial Officer, tel. +46 (0)706-46 52 11 or +46 (0)31-89 17 90.
Conference call Investment AB Latour invites you to listen to a conference call with Jan Svensson and Anders Mörck commencing at 11 a.m. today. The number to call is +46 (0)8 566 426 61. The conference will be broadcast on the Internet. To follow the presentation, please visit our website, www.latour.se. The interim report for the period January – March 2015 will be published on 29 April 2015 The General Annual Meeting will be held on 5 May at Radisson Blu Scandinavia Hotel in Gothenburg. The interim report for the period January – June 2015 will be published on 18 August 2015 The interim report for the period January – September 2015 will be published on 6 November 2015
The information contained in this report constitutes information which the company is required to disclose under the Swedish Securities Market Act. The information was submitted for publication on 18 February 2015, at 8:30 a.m.

YEAR-END REPORT 2014 13
Consolidated income statement
Consolidated statement of comprehensive income
Consolidated cash flow statement
2014 2013 2014 2013SEK m Q4 Q4 Full Year Full Year
Net sales 2,018 1,844 7,581 6,944Cost of goods sold -1,257 -1,173 -4,757 -4,399
Gross profit 761 671 2,824 2,545Sales costs -396 -381 -1,472 -1,382Administrative costs -122 -104 -523 -422Research and development costs -50 -40 -155 -156Other operating income 18 9 88 64Other operating expenses - -18 -16 -28
Operating profit 211 137 746 621Income from interests in associates 426 287 1,347 1,060Income from portfolio management - -1 36 43Management costs -4 -3 -15 -14
Profit before financial items 633 420 2,114 1,710Finance income 43 13 105 33Finance expense incl redemption of pension liability -69 -17 -155 -85
Profit after financial items 607 416 2,064 1,658Taxes -55 -36 -190 -175
Profit for the period 552 380 1,874 1,483- - -
Attributable to:Parent company shareholders 552 380 1,874 1,483Non-controlling interests - - - -
Earnings per share regarding profit attributable to parent company shareholders Basic share 3.46 2.38 11.75 9.31 Diluted share 3.45 2.37 11.70 9.27Average number of basic shares outstanding 159,493,000 159,378,000 159,445,425 159,357,121Average number of diluted shares outstanding 160,223,000 160,097,000 160,121,214 159,986,921Number of outstanding shares 159,493,000 159,378,000 159,493,000 159,378,000
2014 2013 2014 2013SEK m Q4 Q4 Full Year Full Year
Profit for the period 552 380 1,874 1,483Other comprehensive incomeItems that will not be recycled to the income statementRestatement of net pension obligations -3 6 -3 6
-3 6 -3 6Items that may subsequently be recycled to the income statementChange in translation reserve for the period 62 35 123 23Change in fair value reserve for the period 150 68 343 629Change in hedging reserve for the period 11 -8 5 -8Change in associated companies' equity 22 -187 383 -256
245 -92 854 388
Other comprehensive income, net after tax 242 -86 851 394
Comprehensive income for the period 794 294 2,725 1,877Attributable to:Parent company shareholders 794 294 2,725 1,877Non-controlling interests - - - -
2014 2013 2014 2013SEK m Q4 Q4 Full Year Full Year
Operating cash flows before movements in working capital 249 194 781 636Movements in working capital 17 60 -266 -17Operating cash flows 266 254 515 619Acquisitions of subsidaries -88 -9 -722 -266Sale of subsidaries - 20 4 20Other investments -87 -75 -163 -152Portfolio management -103 -29 266 444Cash flow after investments -12 161 -100 665Financial payments 31 33 14 -435Cash flow for the period 19 194 -86 230
14 YEAR-END REPORT 2014
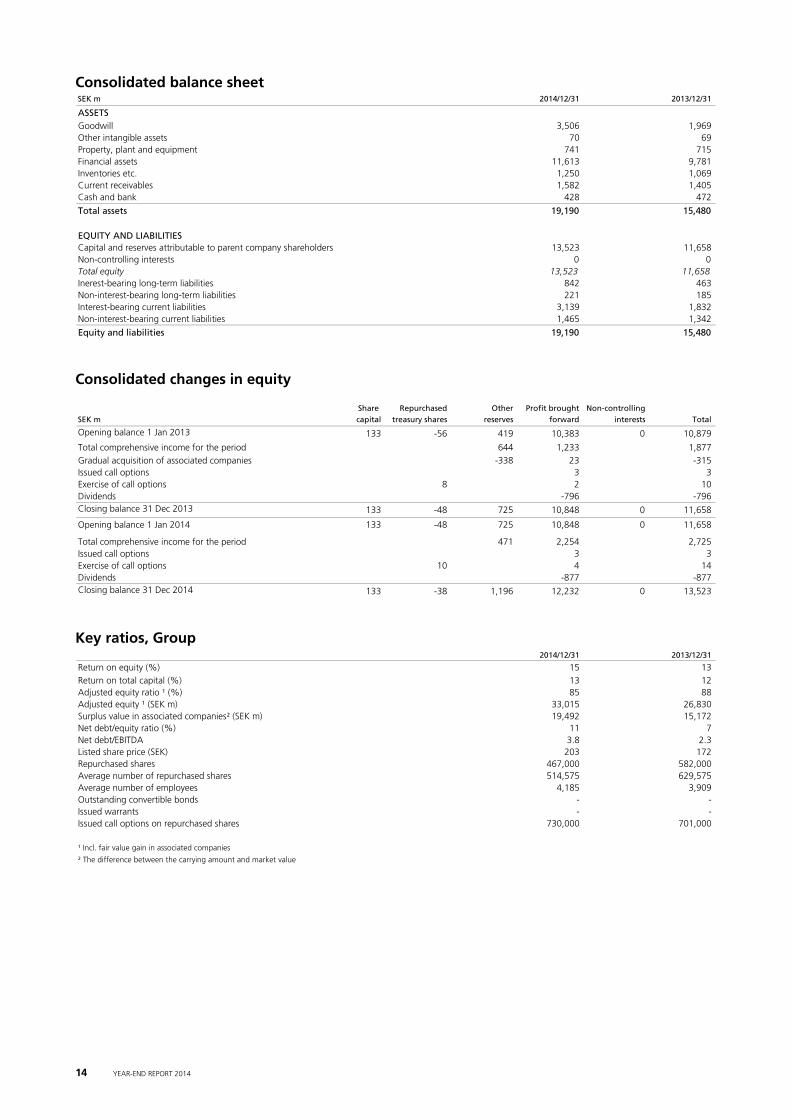
Consolidated balance sheet
Consolidated changes in equity
Key ratios, Group
SEK m 2014/12/31 2013/12/31
ASSETSGoodwill 3,506 1,969Other intangible assets 70 69Property, plant and equipment 741 715Financial assets 11,613 9,781Inventories etc. 1,250 1,069Current receivables 1,582 1,405Cash and bank 428 472
Total assets 19,190 15,480
EQUITY AND LIABILITIESCapital and reserves attributable to parent company shareholders 13,523 11,658Non-controlling interests 0 0Total equity 13,523 11,658Inerest-bearing long-term liabilities 842 463Non-interest-bearing long-term liabilities 221 185Interest-bearing current liabilities 3,139 1,832Non-interest-bearing current liabilities 1,465 1,342
Equity and liabilities 19,190 15,480
Share Repurchased Other Profit brought Non-controllingSEK m capital treasury shares reserves forward interests Total
Opening balance 1 Jan 2013 133 -56 419 10,383 0 10,879
Total comprehensive income for the period 644 1,233 1,877Gradual acquisition of associated companies -338 23 -315Issued call options 3 3Exercise of call options 8 2 10Dividends -796 -796Closing balance 31 Dec 2013 133 -48 725 10,848 0 11,658
Opening balance 1 Jan 2014 133 -48 725 10,848 0 11,658
Total comprehensive income for the period 471 2,254 2,725Issued call options 3 3Exercise of call options 10 4 14Dividends -877 -877Closing balance 31 Dec 2014 133 -38 1,196 12,232 0 13,523
2014/12/31 2013/12/31
Return on equity (%) 15 13Return on total capital (%) 13 12Adjusted equity ratio ¹ (%) 85 88Adjusted equity ¹ (SEK m) 33,015 26,830Surplus value in associated companies² (SEK m) 19,492 15,172Net debt/equity ratio (%) 11 7Net debt/EBITDA 3.8 2.3Listed share price (SEK) 203 172Repurchased shares 467,000 582,000Average number of repurchased shares 514,575 629,575Average number of employees 4,185 3,909Outstanding convertible bonds - -Issued warrants - -Issued call options on repurchased shares 730,000 701,000
¹ Incl. fair value gain in associated companies
² The difference between the carrying amount and market value

YEAR-END REPORT 2014 15
Parent company income statement
Parent company statement of comprehensive income
Parent company balance sheet
Parent company statement of changes in equity
2014 2013 2014 2013SEK m Q4 Q4 Full Year Full Year
Income from interests i Group companies - - 330 325Income from interest in associates - 10 464 448Income from portfolio management -1 - 22 12Management costs -2 -2 -9 -8
Profit before financial items -3 8 807 777
Interest income and similar items 10 15 48 61Interest expense and similar items -9 -9 -39 -33
Profit after financial items -2 14 816 805
Taxes - - - -
Profit for the period -2 14 816 805
2014 2013 2014 2013SEK m Q4 Q4 Full Year Full Year
Profit for the period -2 14 816 805Change in fair value reserve for the period 142 65 326 599
Total other comprehensive income 142 65 326 599
Comprehensive income for the period 140 79 1,142 1,404
SEK m 2014/12/31 2013/12/31
ASSETSFinancial assets 9,858 9,241Current receivables from Group companies 10 15Other current liabilities 2 2Cash and bank 6 7
Total assets 9,876 9,265
EQUITY AND LIABILITIESEquity 8,371 8,089Interese-bearing long-term lilabilities 101 101Non-interest-bearing long-term liabilities 5 5Interese-bearing current liabilities 1,395 1,056Non-interest-bearing current liabilities 4 14
Equity and liabilities 9,876 9,265
SEK m 2014/12/31 2013/12/31
Amount at beginning of year 8,089 7,806Total comprehensive income for the period 1,142 1,404Issued call options 3 3Exercise of call options 14 10Gradual acquisition of associated companies - -338Dividends -877 -796
Amount at end of year 8,371 8,089

16 YEAR-END REPORT 2014
Segment reporting: Development per business area 1 Jan 2014 – 31 Dec 2014
Segment reporting: Development per business area 1 Jan 2013 - 31 Dec 2013
Change in consolidated interest-bearing net debt
Hultafors Latour Specma PortfolioSEK m Group Industries Nord-Lock Group Swegon Other management Total
INCOMEExternal sales 1,305 1,051 722 1,294 3,209 - 7,581Internal sales 1 4 - - - - 5RESULTOperating profit 177 68 211 1 298 -9 746
Income from portfolio management 1,368 1,368Finance income 105Finance expense -155Taxes -190
Profit for the period 1,874
OTHER DISCLOSURESInvestments in: property, plant and equipment 9 17 20 18 102 31 - 197 intangible assets 217 240 3 966 - 1,426Depreciation/amortisation 17 21 18 19 75 17 167
Industrial operations
Hultafors Latour Specma PortfolioSEK m Group Industries Nord-Lock Group Swegon Other management Total
INCOMEExternal sales 1,207 980 623 1,152 2,935 47 6,944Internal sales 1 2 1 1 5RESULTSOperating result 126 63 114 - 346 -28 621
Income from portfolio management 1,089 1,089Finance income 33Finance expense -85Taxes -175
Profit for the period 1,483
OTHER DISCLOSURESInvestments in: property, plant and equipment 12 17 18 17 77 21 - 162 intangible assets 4 122 14 5 148 - - 293Depreciation/amortisation 19 22 16 18 69 18 - 162
Industrial operations
SEK m 2013/12/31 Change in cash Change in loans Other changes 2014/12/31
Interest-bearing receivables 36 1 37Cash 472 -44 428Pensions provisions -174 144 -30Long-term liabilities -310 -502 -812Utilised bank overdraft facilities -12 -33 -45Interest-bearing current liabilities -1,799 -1,295 -3,094
Interest-bearing net debt -1,787 -44 -1,830 145 -3,516

YEAR-END REPORT 2014 17
Five year overview
Note 1: Business combinations
During the period, Latour has acquired 80 per cent of the shares in Elvaco AB, 100 per cent of the shares in Vibro-Acoustics®,100 per cent of the shares in Bastec AB, 90 per cent of the shares in P. Lemmens, 100 per cent of the shares in Econdition GmbH, 100 per cent of the shares in Luftmiljö AB and 100 per cent of the shares in Tradeport AB. Elvaco has contributed SEK 55 m in income and SEK 13 m in operating profit during the period. Vibro-Acoustics® has contributed SEK 81 m in income and SEK -9 m in operating profit/loss during the period. Bastec has contributed SEK 22 m in income and SEK 5 m in operating profit during the period. P. Lemmens has contributed SEK 84 m in income and SEK 20 m in operating profit during the period. Econdition has contributed SEK 39 m in income and SEK 2 m in operating profit during the period. Luftmiljö has contributed SEK 7 m in income and SEK 0 m in operating profit during the period. Tradeport has contributed SEK 9 m in income and SEK 0 m in operating profit during the period. All acquisitions have been made with the aim of strengthening and developing the Latour Group's existing operations.
Transaction costs for acquisitions made during the period amount to SEK 8 m. Estimated additional purchase prices have been booked for acquisitions of Elvaco, Vibro-Acoustics®, Bastec, P. Lemmens, Econdition, Luftmiljö and Tradeport. The final prices are based on performance over the coming years and may amount to as much as SEK 60 m, SEK 85 m, SEK 30 m, SEK 73 m, SEK 37 m, SEK 18 m and SEK 130 respectively. These sums have also been reserved.
SEK m 2014 2013 2012 2011 2010
Net sales, SEK m 7,581 6,944 6,788 7,171 5,991Operating profit, SEK m 746 621 635 883 620Income from interest in associates, SEK m 1,347 1,060 914 1,449 226Income from portfolio management, SEK m 36 43 35 -41 78Profit after finance items, SEK m 2,064 1,710 1,497 2,230 870Earnings per share, SEK 12 9 8 14 5Return on equity, % 15 13 13 18 6Return on total capital, % 13 12 12 17 7Adjusted equity ratio, % 85 88 86 84 85Net debt/equity ratio, % 11 7 8 7 2Listed share price, SEK 203 172 124 107 124
Specification of acquisitions
Transfer date Country Business area Number of employees
17 March 2014 Elvaco AB Sweden Latour Industries 204 June 2014 Vibro-Acoustics® Canada Swegon 16727 June 2014 Bastec AB Sweden Latour Industries 288 July 2014 P. Lemmens Belgian Swegon 5930 August 2014 Econdition GmbH Germany Swegon 401 September 2014 Luftmiljö AB Sweden Swegon 146 November 2014 Tradeport AB Sweden Hultafors Group 23
Two other acquisitions have been made in addition to those mentioned above but these have no material impact on the financial statements.
Assets and liabilities in acquisitions
Consolidated carrying amount
Intangible assets 93Property, plant and equipment 44Finance assets -Inventories 95Account receivable 86Other receivable 46Cash 181Long-term liabilities -336Current liabilities -243
Net indentifiable assets and liabilities -34Group goodwill 1,320
Total purchase price 1,286
Additional purchase price -415
Cash settlement purchase price 871Acquisition of non-cash items 32Acquired cash -181
Effect of Group cash 722

18 YEAR-END REPORT 2014
Note 2: Information regarding financial assets and liabilities The table below shows how fair value is determined for the financial instruments valued at fair value in the report on financial positions. Fair value is determined according to three different levels. Compared to the annual accounts 2013 no transfers were made during the period of 2014 between the different levels of fair value hierarchy and no changes have occurred in the applied valuation techniques and/or principles.
Financial instruments – Fair value
Listed financial assets are valued at the quoted purchase price on the balance sheet date. Fair value on unlisted financial assets is determined by using valuation techniques such as a recent transaction, the price of a similar instrument or discounted cash flows.
Currency derivatives consist of forward exchange contracts and are included in level 2. Valuation at fair value of forward exchange contracts is based on forward rates established by banks on an active market.
The fair value of accounts receivable and other receivables, current receivables, cash and other liquid funds, accounts payable and other liabilities as well as long-term liabilities are estimated to have the same value as their carrying amount. Market interest is not believed to materially deviate from the discount rate for interest-bearing long-term liabilities and therefore the carrying amount is considered in essence equal to the fair value.
The Group's valuation process is carried out by the Group finance and treasury department where a team works with valuation of the financial assets and liabilities held by the Group.
GROUP 2015/12/31Loans and
Financial assets Derivatives accounts
Available-for-sales values at fair value used for receivable, Other Total carryingfinancial assets via profit and loss hedging purposes cash liabilities amount
FINANCIAL ASSETSListed shares, management 1 605¹ 1,605Other long-term securities holdings 0² 0Other long-term receivables 37³ 37Listed shares, trading 79¹ 79Unrealised gains, currency derivatives 41² 41Other current receivables 1 369³ 1,369Cash 428³ 428
Total 1,605 79 41 1,834 0 3,559
FINANCIAL LIABILITIESLong-term loans 812³ 812Bank overdraft facilities 45³ 45Current loans 3 093³ 3,093Other liabilities 835³ 835Unrealised gains, currency derivatives 21² 21
Total 0 0 21 0 4,785 4,806
¹ Level 1 – valued at fair value based on quoted prices on an active market for identical assets.
² Level 2 – valued at fair value based on other observable inputs for assets and liabilities than quoted price included in level 1.
³ Level 3 – valued at fair value based on inputs for assets and liabilities unobservable to the market.

YEAR-END REPORT 2014 19
Information by quarter
SEK m Full Year Q4 Q3 Q2 Q1 Full Year Q4 Q3 Q2 Q1 Full Year Q4 Q3 Q2 Q1
INCOME STATEMENT
Net sales 7,581 2,018 1,877 1,940 1,746 6,944 1,844 1,716 1,764 1,620 6,788 1,697 1,571 1,785 1,735
Cost of goods sold -4,757 -1,257 -1,131 -1,263 -1,106 -4,399 -1,173 -1,077 -1,117 -1,032 -4,299 -1,074 -986 -1,134 -1,105
Gross profit 2,824 761 746 677 640 2,545 671 639 647 588 2,489 623 585 651 630
Costs etc. for the operation -2,078 -550 -484 -515 -529 -1,924 -534 -437 -496 -457 -1,854 -480 -417 -474 -483
Operating profit 746 211 262 162 111 621 137 202 151 131 0 635 143 168 177 147
Total portfolio management 1,368 422 304 335 307 1,089 283 354 238 214 949 292 217 290 150
Profit before financial items 2,114 633 566 497 418 1,710 420 556 389 345 1,584 435 385 467 297
Net financial items -50 -26 -6 -6 -12 -52 -4 -24 -7 -17 -87 -10 -35 -11 -31
Profit after financial items 2,064 607 560 491 406 1,658 416 532 382 328 1,497 425 350 456 266
Taxes -190 -55 -67 -38 -30 -175 -36 -53 -52 -34 -146 -36 -38 -37 -35
Profit for the period 1,874 552 493 453 376 1,483 380 479 330 294 1,351 389 312 419 231
KEY RATIOS
Earnings per share, SEK 11.75 3.46 3.09 2.84 2.36 9.30 2.38 3.01 2.07 1.85 8.47 2.44 1.96 2.63 1.45
Cash flow for the period -86 19 121 -47 -179 230 194 73 -9 -28 -249 11 44 -338 34
Adjusted equity ratio, % 85 85 85 86 87 88 88 86 84 86 86 86 86 85 86
Adjusted equity 33,015 33,015 30,256 28,587 28,181 26,830 26,830 24,197 21,494 22,013 20,223 20,223 18,604 17,984 19,195
Net asset value 39,859 39,859 37,117 35,582 35,022 33,799 33,799 30,459 27,229 27,942 25,726 25,726 24,080 23,359 25,564
Net asset value per share 250 250 233 223 220 212 212 191 171 175 162 162 151 146 160
Listed share price 203 203 191 196 196 172 172 157 135 148 124 124 114 116 134
NET SALES
Hultafors Group 1,306 365 315 322 289 1,208 333 305 282 288 1,257 332 297 309 319
Latour Industries 1,055 286 229 281 274 982 264 223 256 239 765 216 165 195 189
Nord-Lock 722 169 193 192 169 624 154 162 158 150 639 142 163 167 166
Specma Group 1,294 328 302 344 320 1,152 306 265 302 279 1,198 268 251 331 348
Swegon 3,209 870 838 801 700 2,936 783 748 753 652 2,785 711 659 743 672
Other companies and eliminations -5 – 0 0 -6 42 4 13 13 12 144 30 36 40 42
7,581 2,018 1,877 1,940 1,746 6,944 1,844 1,716 1,764 1,620 6,788 1,698 1,571 1,785 1,736
OPERATING PROFIT
Hultafors Group 177 53 50 41 33 126 54 40 12 20 128 36 32 28 32
Latour Industries 68 29 11 20 8 63 16 18 13 16 26 6 8 9 3
Nord-Lock 211 45 68 57 42 114 13 36 35 30 128 15 38 34 41
Specma Group 1 5 18 -26 4 0 -3 0 2 1 -9 -27 -1 8 11
Swegon 298 98 90 74 37 346 89 101 96 59 326 86 84 93 63
755 229 237 166 124 649 169 196 158 126 599 116 161 172 150
Gain/loss from sale/purchase of busin -13 0 -4 -8 -1 -25 -20 -2 - -3 7 7 - - -
Other companies and items 4 -18 29 4 -12 -3 -13 8 -7 8 29 20 7 5 -3
746 211 262 162 111 621 136 202 151 131 635 143 168 177 147
OPERATING MARGIN (%)
Hultafors Group 13.6 14.5 15.8 12.8 11.1 10.4 16.1 13.3 4.2 6.9 10.2 10.8 10.7 9.1 10.0
Latour Industries 6.4 10.2 4.9 7.2 2.8 6.5 6.2 8.2 5.1 6.6 3.4 2.9 4.7 4.4 1.7
Nord-Lock 29.3 26.7 35.1 29.6 24.7 18.3 8.6 22.0 22.0 20.5 20.0 10.2 23.3 20.6 24.5
Specma Group 0.1 1.5 5.8 -7.5 1.2 0.0 -0.9 -0.2 0.6 0.4 -0.7 -10.0 -0.4 2.3 3.2
Swegon 9.3 11.2 10.7 9.2 5.3 11.8 11.4 13.5 12.8 9.1 11.7 12.1 12.8 12.6 9.4
10.0 11.4 12.6 8.6 7.1 9.3 9.2 11.4 8.9 8.6 8.8 6.8 10.2 9.6 8.6
2013 20122014

Investment AB Latour (publ) Corporate ID no. 556026–3237
J A Wettergrens gata 7, Box 336, SE-401 25 Gothenburg, Sweden. Tel +46 (0)31-89 17 90. Fax +46 (0)31-45 60 63 [email protected], www.latour.se