Yarra River Application Project - eWater · Yarra River Application Project . ... While every...
61
Application Report Pierotti, S., Carty, R, Woodman, A 29 June 2012 Source hydrology calibration and dissolved oxygen modelling Yarra River Application Project
Transcript of Yarra River Application Project - eWater · Yarra River Application Project . ... While every...
Application Report
Pierotti, S., Carty, R, Woodman, A
29 June 2012
Source hydrology calibration and dissolved oxygen modelling
Yarra River Application Project
Copyright Notice
© 2012 eWater Ltd
Legal Information
This work is copyright. You are permitted to copy and reproduce the information, in an unaltered form, for non-commercial use, provided you acknowledge the source as per the citation guide below. You must not use the information for any other purpose or in any other manner unless you have obtained the prior written consent of eWater Ltd.
While every precaution has been taken in the preparation of this document, the publisher and the authors assume no responsibility for errors or omissions, or for damages resulting from the use of information contained in this document. In no event shall the publisher and the author be liable for any loss of profit or any other commercial damage caused or alleged to have been caused directly or indirectly by this document.
Citing this document Pierotti, S., Carty, R, Woodman, A (Melbourne Water, Australia and eWater Cooperative Research Centre 2011) Source hydrology calibration and dissolved oxygen modelling; Victoria – Yarra River Application Project Simon Pierotti (Melbourne Water) Richard Carty (Melbourne Water) Amanda Woodman (Sinclair Knight Merz)
Publication date: June 2012 (Version 1)
ISBN: 978-1-921543-64-7
Acknowledgments
eWater CRC acknowledges and thanks Melbourne Water and partners to the CRC and individuals who have contributed to the research and development of this publication. The authors also wish to acknowledge David Waters (Department of Environment and Natural Resources, Queensland) and Rhys Coleman (Melbourne Water) for reviewing and editing the report
For more information:
Simon Pierotti Melbourne Water 100 Wellington Parade East Melbourne, VIC 3002 E: [email protected]
OR
Innovation Centre, Building 22 University Drive South Bruce, ACT, 2617, Australia T: 1300 5 WATER (1300 592 937) T: +61 2 6201 5834 (outside Australia) E: [email protected] www.ewater.com.au
Source hydrology calibration and dissolved oxygen modelling ii
Disclaimer
The following disclaimer relates to all Melbourne Water maps and data used in the preparation of the Source model and/or this report.
Whilst all due skill and attention has been taken in collecting, validating and providing the attached data, Melbourne Water shall not be liable in any way for loss of any kind including damages, costs, interest, loss of profits or special loss or damage, arising from any error, inaccuracy, incompleteness or other defect in this information.
In utilising this information the recipient acknowledges that Melbourne Water makes no representations as to the accuracy or completeness of this information and the recipient ought to carry out its own investigations if appropriate.
Source hydrology calibration and dissolved oxygen modelling iii

Contents 1 Executive Summary .................................................... 1
2 Introduction ................................................................. 3
2.1 Background ........................................................................................................................... 3 Catchment Description.......................................................................................................... 3 Victoria in Drought ................................................................................................................ 4 Dissolved Oxygen and River Flow ........................................................................................ 5
2.2 Project Objectives ................................................................................................................. 6 2.3 Description of the Model ....................................................................................................... 6
Source................................................................................................................................... 6 QUASAR ............................................................................................................................... 6
3 Methods ...................................................................... 8
3.1 Model Inputs ......................................................................................................................... 8 Sub-catchments .................................................................................................................... 8 Rainfall and Potential Evapotranspiration (PET)................................................................... 9 Land use and Pervious Fraction Determination .................................................................... 9 Storages and Releases....................................................................................................... 10 Diversions ........................................................................................................................... 11 Yering Gorge Pumping Station ........................................................................................... 12 Determination of Hydrological Parameters ......................................................................... 13
3.2 Hydrology Calibration and Validation .................................................................................. 16 3.3 Dissolved Oxygen Modelling in QUASAR........................................................................... 16
Model Inputs ....................................................................................................................... 16 Quasar Calibration .............................................................................................................. 17
3.4 Scenario Testing ................................................................................................................. 17 Altered Flow Regimes ......................................................................................................... 18 Climate Change .................................................................................................................. 18
4 Results and Discussion ............................................. 19
4.1 Hydrology Calibration Results ............................................................................................. 19 4.2 Quality of Observed and Predicted Data ............................................................................ 22 4.3 Scenario Testing ................................................................................................................. 24
5 Conclusions ............................................................... 27
6 References ................................................................ 28
Source hydrology calibration and dissolved oxygen modelling iv

Source hydrology calibration and dissolved oxygen modelling
v

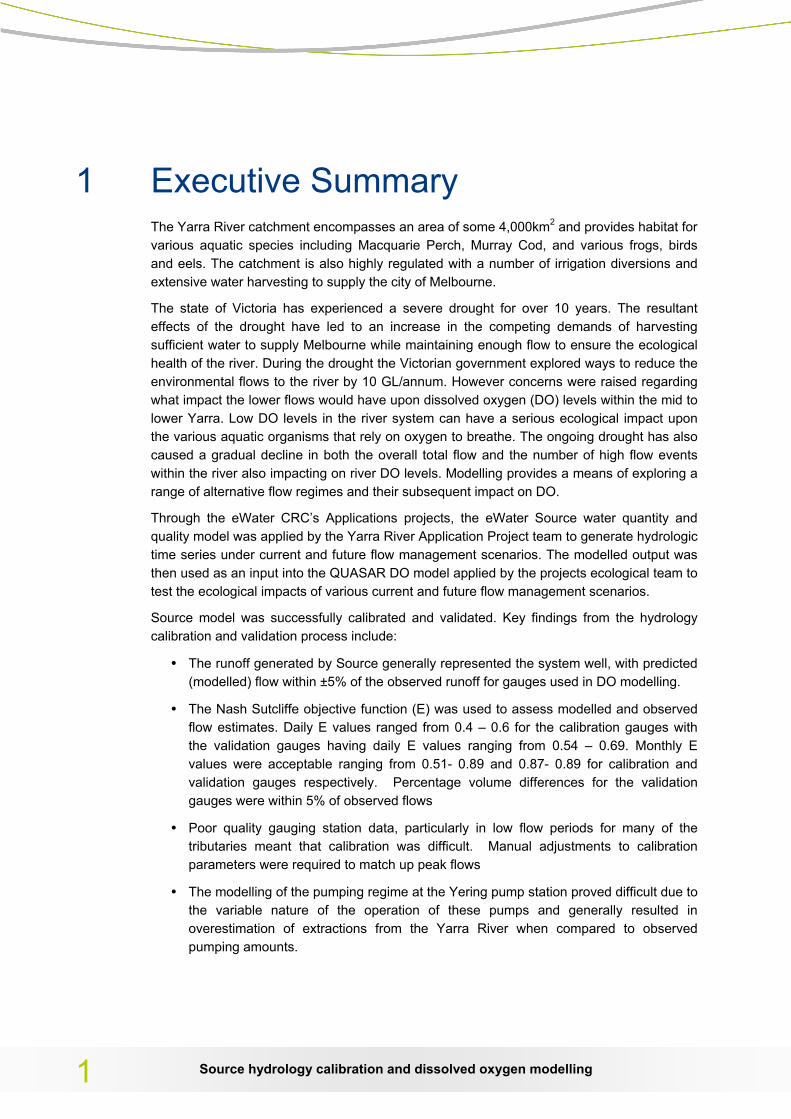
1 Executive Summary The Yarra River catchment encompasses an area of some 4,000km2 and provides habitat for various aquatic species including Macquarie Perch, Murray Cod, and various frogs, birds and eels. The catchment is also highly regulated with a number of irrigation diversions and extensive water harvesting to supply the city of Melbourne.
The state of Victoria has experienced a severe drought for over 10 years. The resultant effects of the drought have led to an increase in the competing demands of harvesting sufficient water to supply Melbourne while maintaining enough flow to ensure the ecological health of the river. During the drought the Victorian government explored ways to reduce the environmental flows to the river by 10 GL/annum. However concerns were raised regarding what impact the lower flows would have upon dissolved oxygen (DO) levels within the mid to lower Yarra. Low DO levels in the river system can have a serious ecological impact upon the various aquatic organisms that rely on oxygen to breathe. The ongoing drought has also caused a gradual decline in both the overall total flow and the number of high flow events within the river also impacting on river DO levels. Modelling provides a means of exploring a range of alternative flow regimes and their subsequent impact on DO.
Through the eWater CRC’s Applications projects, the eWater Source water quantity and quality model was applied by the Yarra River Application Project team to generate hydrologic time series under current and future flow management scenarios. The modelled output was then used as an input into the QUASAR DO model applied by the projects ecological team to test the ecological impacts of various current and future flow management scenarios.
Source model was successfully calibrated and validated. Key findings from the hydrology calibration and validation process include:
• The runoff generated by Source generally represented the system well, with predicted (modelled) flow within ±5% of the observed runoff for gauges used in DO modelling.
• The Nash Sutcliffe objective function (E) was used to assess modelled and observed flow estimates. Daily E values ranged from 0.4 – 0.6 for the calibration gauges with the validation gauges having daily E values ranging from 0.54 – 0.69. Monthly E values were acceptable ranging from 0.51- 0.89 and 0.87- 0.89 for calibration and validation gauges respectively. Percentage volume differences for the validation gauges were within 5% of observed flows
• Poor quality gauging station data, particularly in low flow periods for many of the tributaries meant that calibration was difficult. Manual adjustments to calibration parameters were required to match up peak flows
• The modelling of the pumping regime at the Yering pump station proved difficult due to the variable nature of the operation of these pumps and generally resulted in overestimation of extractions from the Yarra River when compared to observed pumping amounts.
Source hydrology calibration and dissolved oxygen modelling 1
Five scenarios were tested including the base case which represented current conditions. Three altered flow regime scenarios and two climate change scenarios were tested. The hydrological outputs from Source were used in the DO modelling. The scenarios included;
• No diversions and No Yering Pumping
• Diversions and No Yering Pumping
• Increased Environmental Flow
• Climate Change 2030
• Climate Change 2060
The Climate Change scenarios significantly reduced flows in the lower reaches of the Yarra River. It was also evident that diversions only play a minor role in reducing flows in the lower Yarra River, the major contributor being the Yering Gorge pumping station extractions.
DO modelling was undertaken for two reaches of the Yarra River – Chandler Highway and Banksia Street. The Quasar water quality modelling package was used for this task. The five scenario flow inputs were modelled over four separate years to represent current conditions (2008), dry conditions (2006), average conditions (2004) and wet conditions (1996). Measured daily DO data at the Chandler Highway site matched well to predicted (modelled) DO for Base scenario flows. Only monthly DO data was available for the Banksia Street reach, and this matched well to modelled data. Results show that climate (dry versus average and wet years) has more influence on DO in the Yarra rather than specific altered flow scenarios. Climate change is predicted to reduce flow in the river, which results in more frequent and longer periods of low DO.
The development of this base Source model for the Yarra River will provide a simulation tool which will enable stakeholders of the Yarra catchment to assess a range of current and future scenarios of interest. Further work may need to be carried out to fine tune the DO modelling as well as improving the calibration of Source to low flows to help assist with decision making. The modelling of the Yering extraction also needs to be refined in future versions of the model.
Source hydrology calibration and dissolved oxygen modelling 2
2 Introduction
2.1 Background
Catchment Description
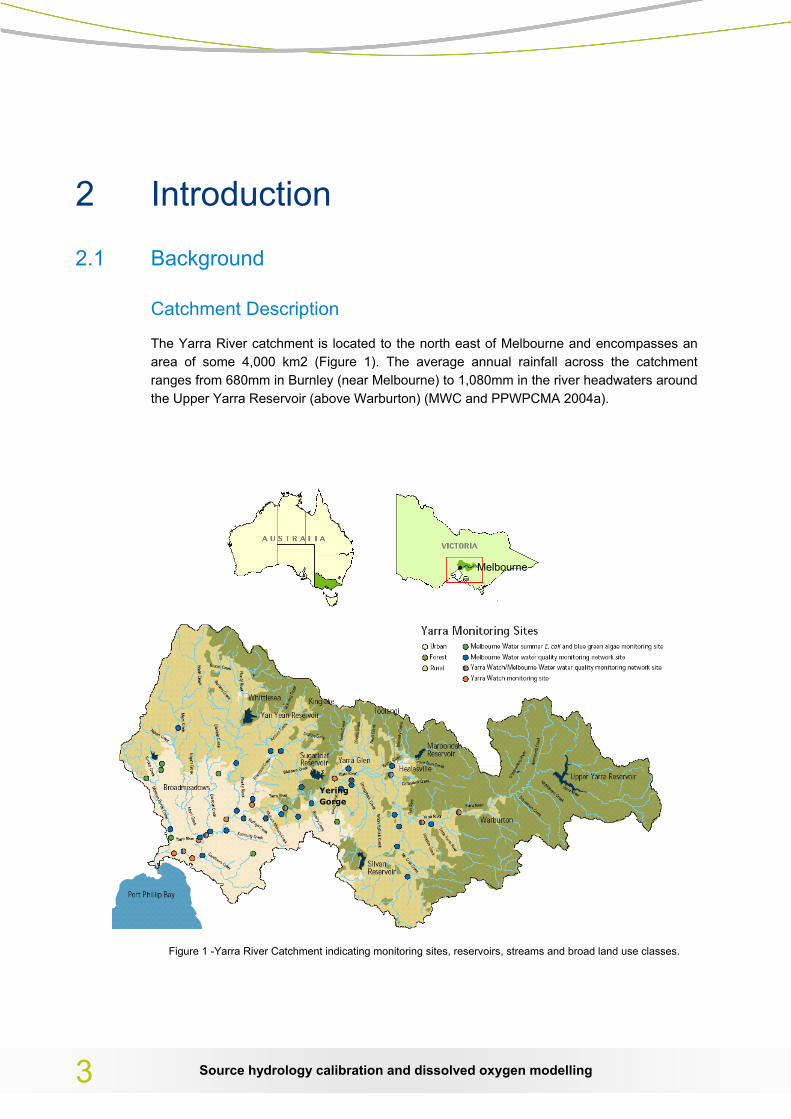
The Yarra River catchment is located to the north east of Melbourne and encompasses an area of some 4,000 km2 (Figure 1). The average annual rainfall across the catchment ranges from 680mm in Burnley (near Melbourne) to 1,080mm in the river headwaters around the Upper Yarra Reservoir (above Warburton) (MWC and PPWPCMA 2004a).
Figure 1 -Yarra River Catchment indicating monitoring sites, reservoirs, streams and broad land use classes.
• Melbourne
Yering Gorge
Source hydrology calibration and dissolved oxygen modelling 3
Between the headwaters and mouth of the river, the Yarra passes through many different classes of land use. The top of the catchment is located on the southern slopes of the Great Dividing Range within the Yarra Ranges National Park. This area contains steep forested slopes that have been protected for more than 100 years due to its extensive use for Melbourne’s water supply harvesting. Further downstream, the mid Yarra flood plains have been largely cleared and developed for agricultural purposes, while in the lower reaches, the Yarra passes through heavily urbanised environments. Overall 50% of the catchment is used for agriculture, 22% is urbanised, and 21% is forested.
In addition to direct water harvesting through the placement of water supply reservoirs at a number of locations throughout the catchment, water is extracted from the various rivers and creeks via weirs. A large pumping station is located in the mid Yarra (Yering Gorge Pumping Station), which can pump to a maximum of 1,000 ML/d. There are also numerous farm dams and diversions throughout the catchment making the Yarra River catchment a highly regulated system (MWC and PPWCMA 2004a).
Victoria in Drought
For over 10 years, the state of Victoria has been experiencing a severe drought with rainfall significantly lower than the long term average (DSE 2007). This has led to an increase in the competing demands of supplying sufficient water to Melbourne while maintaining appropriate environmental flows. As a result, investigations were carried out to determine how environmental flows could be reduced by 10 GL/annum while still maintaining an appropriate level of ecological health in the river (MWC 2007 and DSE 2007).
The outcome of the investigation recommended that the environmental flows downstream of the Yering Gorge Pumping Station (as measured by the downstream gauge at Warrandyte) could be reduced from 245 ML/d to 200 ML/d if the drought continued. This meant that pumping at Yering Gorge was required to cease once flows reached 200 ML/d at Warrandyte (or 150 ML/d at the gauge further downstream at Chandler HWY) Figure 1. A flow reduction to 200ML/d was however subject to some additional restrictions in order to mitigate the ecological risk to the river. If stream flows at the gauging station upstream of the pumping station (at Yarra Glen) reached 1,500 ML/d during April-May, or 2,000 ML/d June-September then this became the minimum environmental flow downstream of the pumping station for 7 days. Therefore, only flows higher than this could be extracted during those periods. It is important to note however that the restriction could only be activated if the flow upstream actually reaches the trigger points (flows), only once per calendar year, and only need be applied if the event did not occur in the previous calendar year.
The Victorian Government adopted these reduced environmental flow targets with the requirement of a yearly review on the ecological impact on the river. The level of water restrictions in Melbourne has since eased due to decent rain, and the original 245ML/d flow entitlements has been re-established. Future drought conditions may mean that these reductions are re-imposed.
Modelling scenarios will attempt to address the implications of some of these reduced or increased environmental flow targets on river flow and dissolved oxygen in the lower Yarra River.
Source hydrology calibration and dissolved oxygen modelling 4
Dissolved Oxygen and River Flow
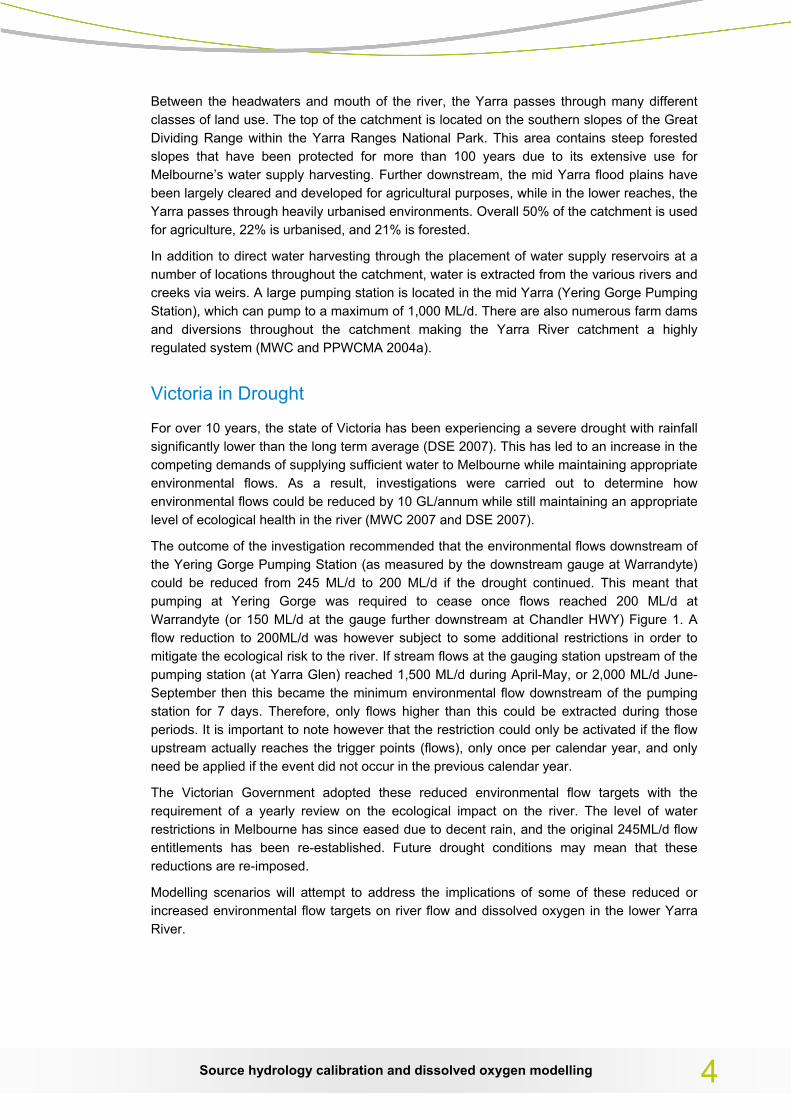
A diverse range of species including Macquarie Perch, Murray Cod, eels, frogs and bird life are supported by the River. Concerns have recently been raised regarding the ecological health of the river system after consistently observing low dissolved oxygen (DO) concentrations in the mid and lower reaches of the river over the past few years (eg. Figure 2). Low DO concentrations in the river can have serious ecological implications for aquatic life that rely on oxygen to breathe (eWater 2009).
Chandler HWY Dissolved Oxygen (Minimum Values) Time Series
0
2
4
6
8
10
12
14
16
1/08/1998 14/12/1999 27/04/2001 9/09/2002 22/01/2004 5/06/2005 18/10/2006 1/03/2008 14/07/2009
Date
DO
Con
cent
ratio
n (m
g/l)
0
20,000
40,000
60,000
80,000
100,000
120,000
140,000
160,000
180,000
Mon
thly
Flo
w (M
L/M
onth
)
DO Min Flow
Figure 2 - Decreasing trend in minimum Dissolved Oxygen concentration over a 10 year period. Plotted against monthly flow at Kew (Chandler HWY Gauge)
There has been a decreasing trend of DO minimum concentrations between 1998-2009 (Figure 2). Additionally, there are indications of a significant increase in the variability of DO concentrations over the past 5 years along with some very low readings of DO (eg. 0.51 mg/L during March 2007). There has also been a consistent decrease in the monthly flow at this site and a noticeable drop in the number of high flow events.
The concerns around the low dissolved oxygen concentrations during these drought periods has led to the need to assess the impacts different flow regimes have upon the level of DO in the river, and to help reduce their impact on aquatic fauna. Previous catchment modelling on the Yarra River has not looked at DO levels or concentrated on low to medium sized flow events. The Ports E2 (BMT WBM, 2008) model was developed as a decision support system (DSS) for the development of the Better Bays and Waterways Plan (BB&W) – Water Quality Improvement Plan (WQIP) for Port Phillip and Western Port catchments and bays. The main focus of Ports E2 was to model gross pollutant loads in the bays and was calibrated with this in mind and made no effort to model DO. The focus of the Yarra River modelling in this project was on calibrating low to mid-range daily flows a key component to DO levels in streams. Modelling offers a way of assessing the impacts of various flow regimes on DO.
Source hydrology calibration and dissolved oxygen modelling 5
2.2 Project Objectives The Yarra River eWater application project is a partnership project between Melbourne Water, Sinclair Knight Merz (SKM), Monash University, EPA Victoria, Department of Sustainability and Environment (DSE), Southern Rural Water and eWater.
The objectives of the application project were to;
• Build on previous catchment modelling work utilising the Source modelling software to a real world project, in this case generating hydrological time series inputs for DO modelling in the Yarra River in a regulated catchment.
• From field measurements determine correlations between flow, DO and temperature and how native fish (specifically Macquarie Perch) respond to changing DO conditions
• Correlations may then be used to try and establish trigger levels, which could be used to trigger management actions, such as refreshing water in poor DO zones by augmenting river flows
This report focuses on the model development in Source, hydrological calibration and generation of hydrological time series of various scenarios to be tested in the DO modelling. The development of a Quasar model to model DO is also documented in this report along with the DO modelling results.
2.3 Description of the Model
Source
Source is a water quality and quantity modelling framework that supports decision-making and a whole-of-catchment management approach. The model structure operates as a node-link network and gives access to a collection of models, data and knowledge that simulate the effects of climatic characteristics (like rainfall and evaporation) and catchment characteristics (like land-use or vegetation cover) on runoff and contaminant loads from unregulated catchments. Source can operate at a daily time step and can be used to predict the flow and load of constituents at any location in the catchment over time (Delgado et al 2011).
The model development of the Yarra River Source Model including input data used is described in the following section.
QUASAR
QUASAR (QUAlity Simulation Along River systems) is a model that describes the time-varying (i.e. dynamic) transport and transformation of solutes, including dissolved oxygen, in branched river systems using 1D ordinary, lumped parameter differential equations of mass conservation (Cox 2003). QUASAR is capable of modelling DO on large branched river systems with multiple influences such as effluent discharges, abstractions and weirs. Simple flow and load addition equations are used at the top of each reach (i.e. in the first computational element) for all flows entering (or being abstracted from) that reach and so all influences such as discharges and abstractions are considered to enter at the beginning of the reach. The solution of the mass-balance equations for flow and the determinants being simulated is then made in each element and the results of these calculations are used as
Source hydrology calibration and dissolved oxygen modelling 6

input for the next element. At the end of a reach the results are stored and then used as the upstream influence on the next reach. In dynamic mode, this is performed once per time-step (Cox 2003). The basic hydraulic model used in Quasar reduces the data requirements and also simplifies the process of calibration and results in relatively quick runtimes. However, it has a temporal program constraint in which the maximum duration of a run is one year. QUASAR is not a current commercial product but is available free of charge. The model is not supported apart from the provision of a user manual, and it will not be further developed.
Source hydrology calibration and dissolved oxygen modelling 7
3 Methods The most recent available data was used to construct the Source model. A modelling period of 32 years was chosen (June 1978-2009) to represent both wet and dry periods. This section provides a description of the input data sets and spatial layers used in the model and how they were generated. An outline of the verification and validation of the model are also detailed and a description of the scenarios tested in the model to be implemented into the DO modelling.
3.1 Model Inputs
Sub-catchments
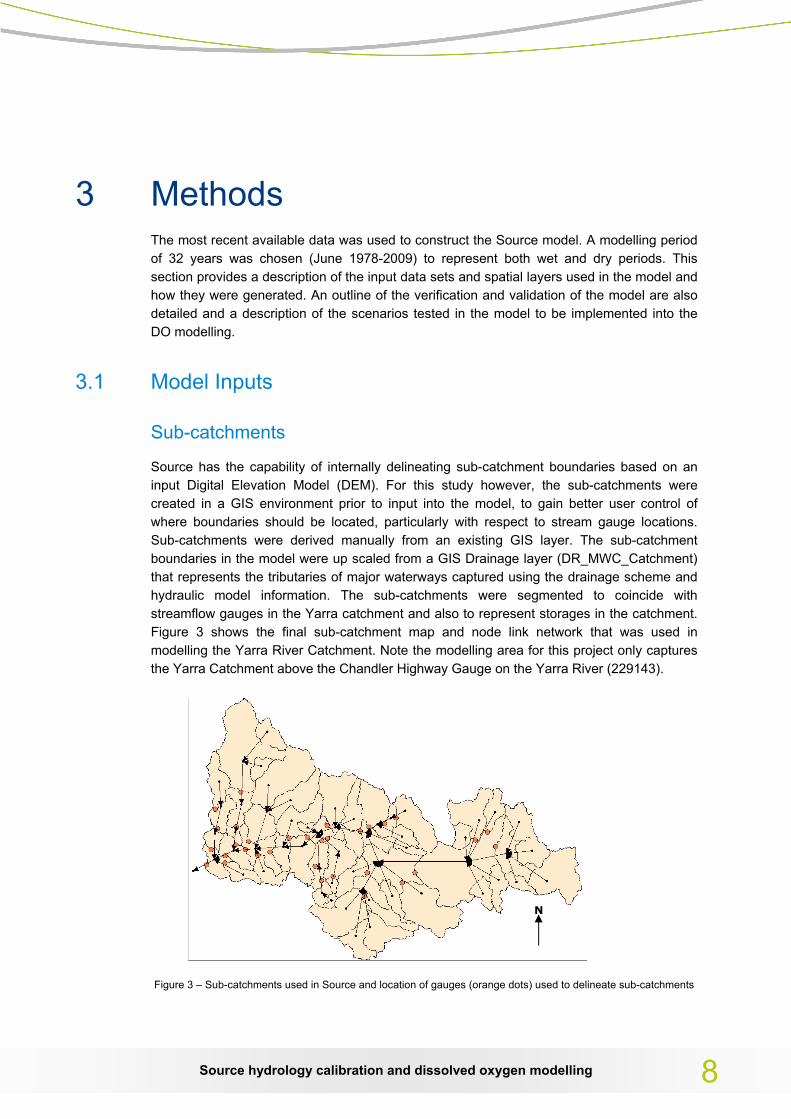
Source has the capability of internally delineating sub-catchment boundaries based on an input Digital Elevation Model (DEM). For this study however, the sub-catchments were created in a GIS environment prior to input into the model, to gain better user control of where boundaries should be located, particularly with respect to stream gauge locations. Sub-catchments were derived manually from an existing GIS layer. The sub-catchment boundaries in the model were up scaled from a GIS Drainage layer (DR_MWC_Catchment) that represents the tributaries of major waterways captured using the drainage scheme and hydraulic model information. The sub-catchments were segmented to coincide with streamflow gauges in the Yarra catchment and also to represent storages in the catchment. Figure 3 shows the final sub-catchment map and node link network that was used in modelling the Yarra River Catchment. Note the modelling area for this project only captures the Yarra Catchment above the Chandler Highway Gauge on the Yarra River (229143).
N
Figure 3 – Sub-catchments used in Source and location of gauges (orange dots) used to delineate sub-catchments
Source hydrology calibration and dissolved oxygen modelling 8

Rainfall and Potential Evapotranspiration (PET)
Data for rainfall and potential evapotranspiration (PET) was sourced from the SILO Data Drill database. Grids of interpolated data are accessed by the SILO Data Drill from the Bureau of Meteorology’s (BOM) station records. Interpolation of the rainfall and PET data occurs on a 5km grid and is provided as individual daily grid sets. When imported into Source each daily grid is interrogated to produce a single time series data set for each sub-catchment (SILO 2009 and Waters 2008). The time series for each calibrated sub-catchment was then extracted and used for hydrologic calibration external to Source.
Land use and Pervious Fraction Determination
The focus of this Source model development was on the hydrology. However a range of land use categories were included to enable future users have the option to model constituents. The PortsE2 (WBM 2008) land use map and codes (Table 1) were used for this project for consistency and enabled the use of the PortsE2 parameter sets for certain sub-catchments. In total, 16 land use categories were created. These are summarised in Table 1 and can be seen spatially in Figure 4.
Table 1 - Land Use Classification - Based upon BMT WBM Report (2008)
Classification % of Total Catchment
Annual Horticulture 1.2
Forest 26
Pasture Cropping - Irrigated 0.02
Pasture Cropping – Non Irrigated 33
Perennial Horticulture 1.7
Plantation Forest 17
Rural Green Space 0.35
Rural Industrial 0.26
Rural Roads 1.9
Rural Township 1.1
Urban 12
Urban Commercial 0.95
Urban Green Space 1.6
Urban Industrial 0.98
Urban Roads 1.0
Water 0.71
Source hydrology calibration and dissolved oxygen modelling 9
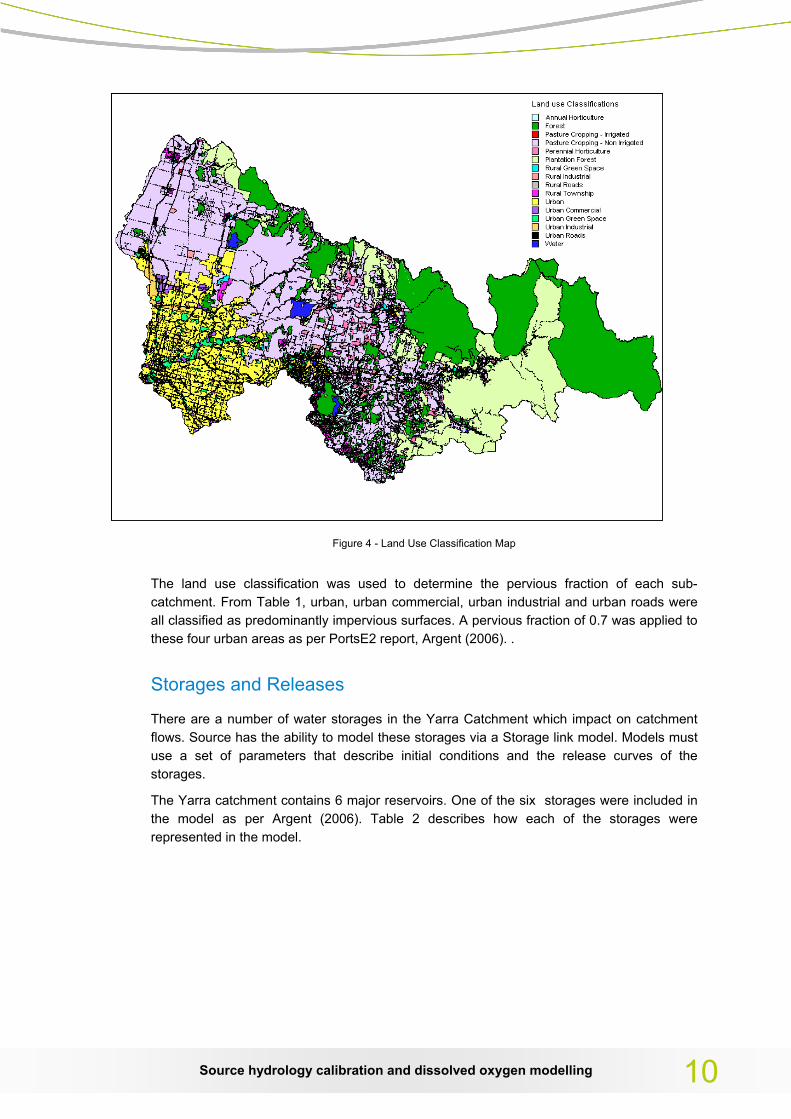
Figure 4 - Land Use Classification Map
The land use classification was used to determine the pervious fraction of each sub-catchment. From Table 1, urban, urban commercial, urban industrial and urban roads were all classified as predominantly impervious surfaces. A pervious fraction of 0.7 was applied to these four urban areas as per PortsE2 report, Argent (2006). .
Storages and Releases
There are a number of water storages in the Yarra Catchment which impact on catchment flows. Source has the ability to model these storages via a Storage link model. Models must use a set of parameters that describe initial conditions and the release curves of the storages.
The Yarra catchment contains 6 major reservoirs. One of the six storages were included in the model as per Argent (2006). Table 2 describes how each of the storages were represented in the model.
Source hydrology calibration and dissolved oxygen modelling 10
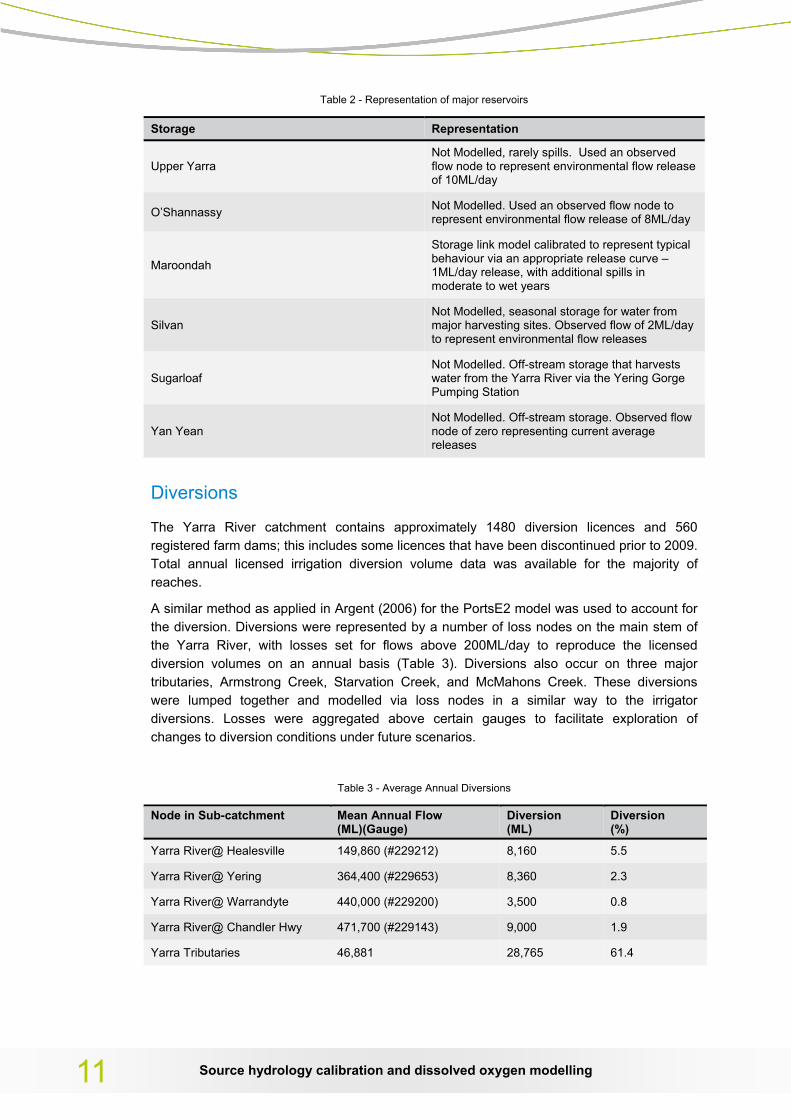
Table 2 - Representation of major reservoirs
Storage Representation
Not Modelled, rarely spills. Used an observed flow node to represent environmental flow release of 10ML/day
Upper Yarra
Not Modelled. Used an observed flow node to represent environmental flow release of 8ML/day O’Shannassy
Storage link model calibrated to represent typical behaviour via an appropriate release curve – 1ML/day release, with additional spills in moderate to wet years
Maroondah
Not Modelled, seasonal storage for water from major harvesting sites. Observed flow of 2ML/day to represent environmental flow releases
Silvan
Not Modelled. Off-stream storage that harvests water from the Yarra River via the Yering Gorge Pumping Station
Sugarloaf
Not Modelled. Off-stream storage. Observed flow node of zero representing current average releases
Yan Yean
Diversions
The Yarra River catchment contains approximately 1480 diversion licences and 560 registered farm dams; this includes some licences that have been discontinued prior to 2009. Total annual licensed irrigation diversion volume data was available for the majority of reaches.
A similar method as applied in Argent (2006) for the PortsE2 model was used to account for the diversion. Diversions were represented by a number of loss nodes on the main stem of the Yarra River, with losses set for flows above 200ML/day to reproduce the licensed diversion volumes on an annual basis (Table 3). Diversions also occur on three major tributaries, Armstrong Creek, Starvation Creek, and McMahons Creek. These diversions were lumped together and modelled via loss nodes in a similar way to the irrigator diversions. Losses were aggregated above certain gauges to facilitate exploration of changes to diversion conditions under future scenarios.
Table 3 - Average Annual Diversions
Node in Sub-catchment Mean Annual Flow (ML)(Gauge)
Diversion (ML)
Diversion (%)
Yarra River@ Healesville 149,860 (#229212) 8,160 5.5
Yarra River@ Yering 364,400 (#229653) 8,360 2.3
Yarra River@ Warrandyte 440,000 (#229200) 3,500 0.8
Yarra River@ Chandler Hwy 471,700 (#229143) 9,000 1.9
Yarra Tributaries 46,881 28,765 61.4
Source hydrology calibration and dissolved oxygen modelling 11
Yering Gorge Pumping Station
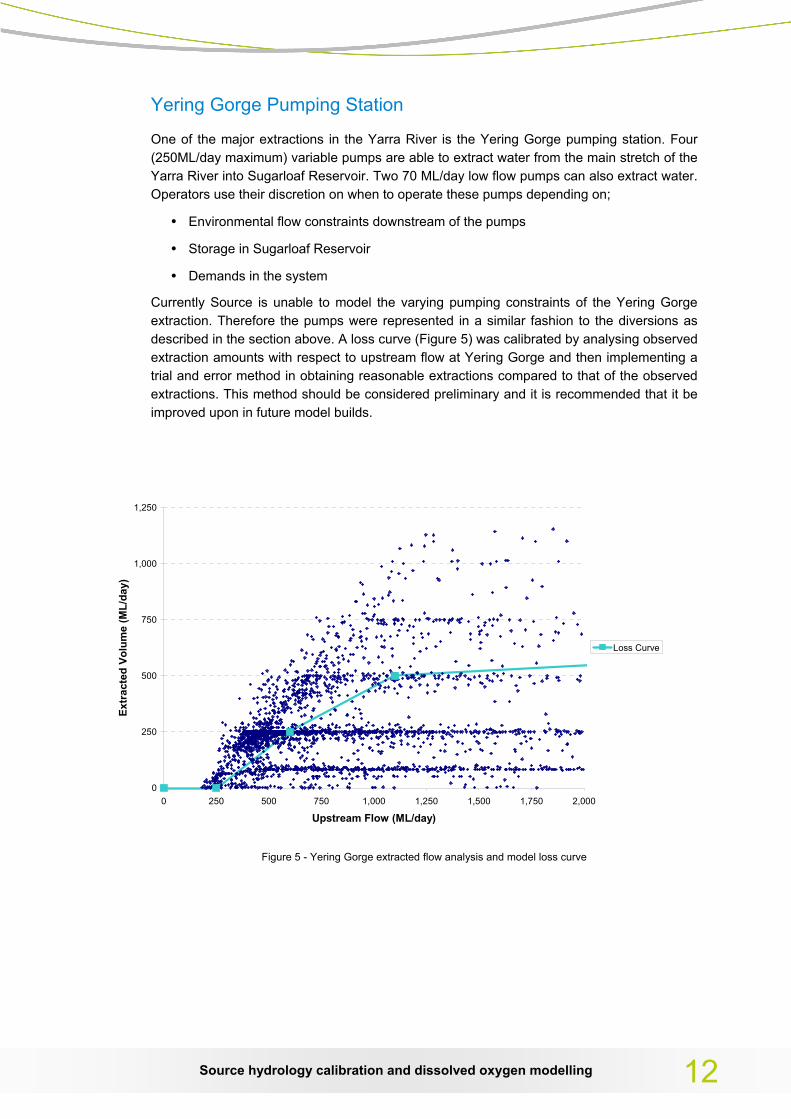
One of the major extractions in the Yarra River is the Yering Gorge pumping station. Four (250ML/day maximum) variable pumps are able to extract water from the main stretch of the Yarra River into Sugarloaf Reservoir. Two 70 ML/day low flow pumps can also extract water. Operators use their discretion on when to operate these pumps depending on;
• Environmental flow constraints downstream of the pumps
• Storage in Sugarloaf Reservoir
• Demands in the system
Currently Source is unable to model the varying pumping constraints of the Yering Gorge extraction. Therefore the pumps were represented in a similar fashion to the diversions as described in the section above. A loss curve (Figure 5) was calibrated by analysing observed extraction amounts with respect to upstream flow at Yering Gorge and then implementing a trial and error method in obtaining reasonable extractions compared to that of the observed extractions. This method should be considered preliminary and it is recommended that it be improved upon in future model builds.
0
250
500
750
1,000
1,250
0 250 500 750 1,000 1,250 1,500 1,750 2,000
Upstream Flow (ML/day)
Extr
acte
d Vo
lum
e (M
L/da
y)
Loss Curve
Figure 5 - Yering Gorge extracted flow analysis and model loss curve
Source hydrology calibration and dissolved oxygen modelling 12

Determination of Hydrological Parameters
Source offers several rainfall runoff models for calibration. The SIMHYD rainfall runoff model was used as per Argent (2006). SIMHYD uses daily rainfall and aerial PET data to estimate daily stream flow (CRC for Catchment Hydrology 2004). SIMHYD was selected for the Yarra River Application project due to its simplicity and because it was used for similar modelling projects in the region.
Initially the Yarra Application project model concentrated on calibrating the lower reaches of the Yarra River using an observed upstream inflow node, however this was unsuitable to run scenarios. Due to time constraints the upper reaches (above Coldstream 229653) of the Yarra have been parameterised using existing SIMHYD parameters from the Yarra Catchment in the Ports E2 model (WBM 2008). This allows scenarios to be tested in the model while improving on the Ports E2 calibration with updated parameters for the more urbanised regions in the lower Yarra River catchment.
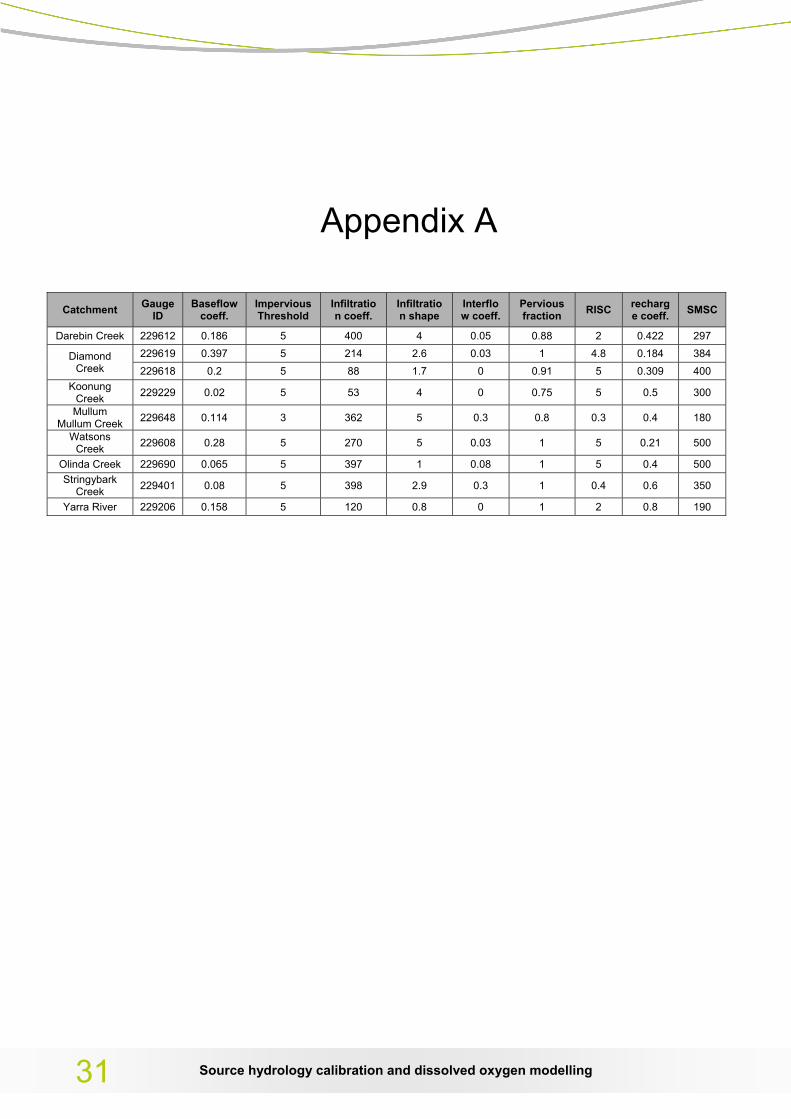
For the lower Yarra reaches, a set of SIMHYD hydrologic parameters were derived upstream of each gauging station. Nine parameter sets were derived for these catchments (Appendix A). For ungauged catchments, either one of the nine parameter sets, or the Ports E2 parameter sets were assigned based on a comparison of attributes between the gauged and ungauged catchments. Attributes considered were location, pervious fraction, land use type, and rainfall. Figure 6 shows the sub-catchments that incorporated the Ports E2 parameter set.
To derive these parameters each sub-catchment must be calibrated against observed data. Gauging station data was used to do this. Observed flow data was extracted from Melbourne Water’s Hydstra database from 1st January 1970 – 30th June 2009. The actual length of historical records available and the quality of the data was highly variable depending upon the station. The site with the longest record was located at Warrandyte (229200) in the mid Yarra with <1% of the data missing. Missing data was then infilled via correlation to an upstream or downstream gauge to create a full record. While some stations had less than 10 years data, most stations had data beginning in the 1970s through to the present day. After extraction from the database, the data was assessed to determine data quality. The criteria used to determine data suitability was;
• Consultation with Melbourne Water hydrographers to assess data quality, data gaps and the quality of the rating curves for the gauging stations
• At least 10 years of streamflow data
• Visual assessment of rainfall and runoff data to identify any obvious problems
The entire Yarra Catchment contains over 60 gauges, with 34 flow gauging stations assessed. Streamflow data from 13 gauges below Coldstream were suitable for calibrating the hydrological model (Table 4), with nine of these being used in the SIMHYD parameterisation. Marked station locations are shown in Figure 6.
Source hydrology calibration and dissolved oxygen modelling 13
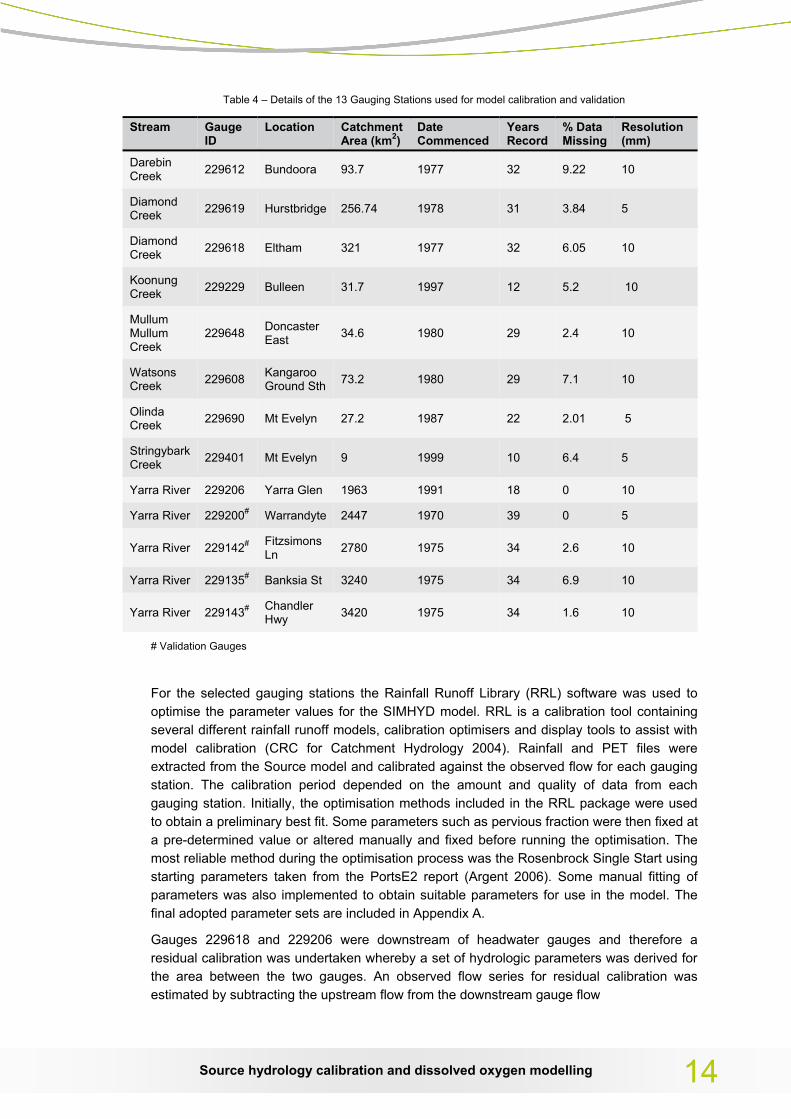
Table 4 – Details of the 13 Gauging Stations used for model calibration and validation
Stream Gauge ID
Location Catchment Area (km2)
Date Commenced
Years Record
% Data Missing
Resolution (mm)
Darebin Creek 229612 Bundoora 93.7 1977 32 9.22 10
Diamond Creek 229619 Hurstbridge 256.74 1978 31 3.84 5
Diamond Creek 229618 Eltham 321 1977 32 6.05 10
Koonung Creek 229229 Bulleen 31.7 1997 12 5.2 10
Mullum Mullum Creek
229648 Doncaster East 34.6 1980 29 2.4 10
Watsons Creek 229608 Kangaroo
Ground Sth 73.2 1980 29 7.1 10
Olinda Creek 229690 Mt Evelyn 27.2 1987 22 2.01 5
Stringybark Creek 229401 Mt Evelyn 9 1999 10 6.4 5
Yarra River 229206 Yarra Glen 1963 1991 18 0 10
Yarra River 229200# Warrandyte 2447 1970 39 0 5
Yarra River 229142# Fitzsimons Ln 2780 1975 34 2.6 10
Yarra River 229135# Banksia St 3240 1975 34 6.9 10
Yarra River 229143# Chandler Hwy 3420 1975 34 1.6 10
# Validation Gauges
For the selected gauging stations the Rainfall Runoff Library (RRL) software was used to optimise the parameter values for the SIMHYD model. RRL is a calibration tool containing several different rainfall runoff models, calibration optimisers and display tools to assist with model calibration (CRC for Catchment Hydrology 2004). Rainfall and PET files were extracted from the Source model and calibrated against the observed flow for each gauging station. The calibration period depended on the amount and quality of data from each gauging station. Initially, the optimisation methods included in the RRL package were used to obtain a preliminary best fit. Some parameters such as pervious fraction were then fixed at a pre-determined value or altered manually and fixed before running the optimisation. The most reliable method during the optimisation process was the Rosenbrock Single Start using starting parameters taken from the PortsE2 report (Argent 2006). Some manual fitting of parameters was also implemented to obtain suitable parameters for use in the model. The final adopted parameter sets are included in Appendix A.
Gauges 229618 and 229206 were downstream of headwater gauges and therefore a residual calibration was undertaken whereby a set of hydrologic parameters was derived for the area between the two gauges. An observed flow series for residual calibration was estimated by subtracting the upstream flow from the downstream gauge flow
Source hydrology calibration and dissolved oxygen modelling 14
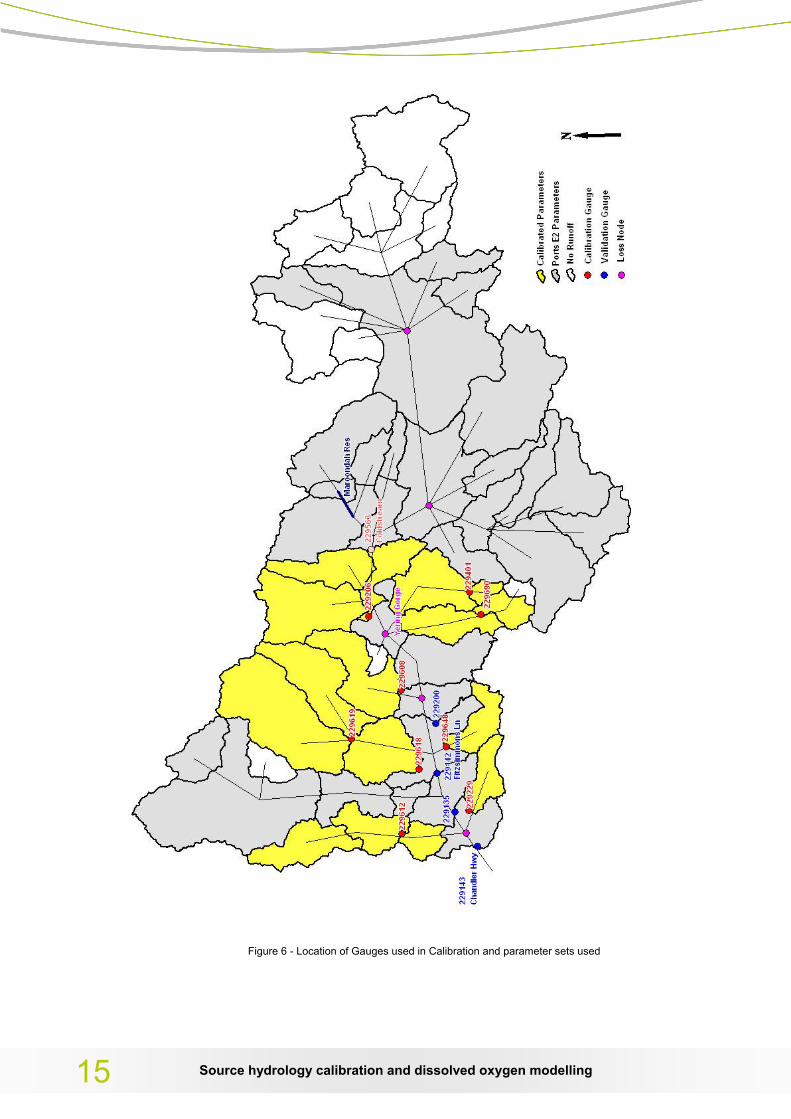
Figure 6 - Location of Gauges used in Calibration and parameter sets used
Source hydrology calibration and dissolved oxygen modelling 15
3.2 Hydrology Calibration and Validation The primary objective function used to optimise the SIMHYD model parameters was the coefficient of efficiency (E) or Nash-Sutcliffe Criterion (Nash and Sutcliffe 1970). It provides a measure of the ability of the model to reproduce recorded flows, with a value of E=1.0 to indicate that all the estimated flows are the same as the recorded flows (Chiew and Scanlon, 2002). The secondary objective functions used were either runoff difference, percentage and flow duration curve depending upon which gave the best fit to the data. The best visual fit did not always seem to be the best calibration for a number of gauges due to poor resolution in the low flows of many of the gauges, therefore some manual changes were used to match up the low to medium sized peak events.
The four gauges in the lower Yarra River in the project target area (229200, 229142, 229135, and 229143), were then used to validate the model within Source. The validation period was between 1981 and 2009. This enabled the ungauged sub-catchments to be validated when gauged sub-catchment parameters were assigned to them and also indicated how well the Ports E2 parameter sets used in the upper Yarra Reaches worked in the model. Two of these validation gauges were used as the sites for the hydrological time series outputs for the DO modelling and scenario testing. Given the assumption that low DO concentrations are at least in part caused by low flows, the calibration of this model will be focussing on low river flows and small to medium runoff events. The results can be seen in Appendix B.
3.3 Dissolved Oxygen Modelling in QUASAR The Quasar software was applied to model Dissolved Oxygen (DO) within two reaches of the Yarra River. These were;
• Chandler Reach (from Chandler Highway, Kew to Dights Falls, Abbotsford); and
• Banksia Reach (from Fitzsimons Lane, Templestowe to Banksia Street, Heidelberg)
This section outlines the inputs applied and calibration approach for the Quasar modelling.
Model Inputs
Reach Parameters
The channel is defined by a set of spatial parameters that are entered into the model. These define the channel length, width and most upstream location of the reach. These spatial parameters were obtained from Google Earth. The channel width information was taken from numerous (>30) width measurements that included runs and bends that were taken where the edge of the banks were relatively obvious for measurement. The mean channel depth was obtained from a longitudinal depth survey undertaken for this project.
The flow-velocity relationship was based on cross-section data supplied by Melbourne Water.
Monthly algae values are entered as chlorophyll-a concentration in micrograms/litre for a month. This information was obtained from monitored data from 1985-1990 and was the only available dataset for this parameter.
Source hydrology calibration and dissolved oxygen modelling 16
Rate coefficients were entered as an initial set of values based on previously established set in Quasar; these are discussed further in Section 2.4.2.
Determinands
Flow and water quality data were entered into Quasar as reach determinand data.
Flow data was obtained from the Source modelling for Chandler Highway and Fitzsimons Lane. Base case conditions were provided in addition to five scenarios (see Table 5).
Water quality inputs were obtained from monitored water quality data for Chandler Highway and Warrandyte for input into the Chandler and Banksia reaches respectively. This contained readings of frequencies varying between weekly and monthly. For data and years where only one spot reading was taken for the month, that value was applied. When more than one spot reading was taken during the month, the average of the readings was taken.
Quasar Calibration
To calibrate the Chandler model, the rate coefficient parameters were adjusted to match the modelled data to daily measured data. Suitable values of these reaction rate coefficients are not widely published, however two research papers were obtained (Eatherall, et al 1998 and Lewis, et al 1997). These studies stated that the process of the calibration is important but that if site specific values for various rate coefficients cannot be obtained (which is the case for the Yarra River due to lack of suitable data) then calibration is best achieved by adjusting rate coefficients so that modelled data is matched to existing data. There was no measured daily data available over the modelling periods for the Banksia reach, therefore the rate coefficients applied for the Chandler reach were considered appropriate for the Banksia reach. This is consistent with approaches applied by Eatherall, et al (1998).
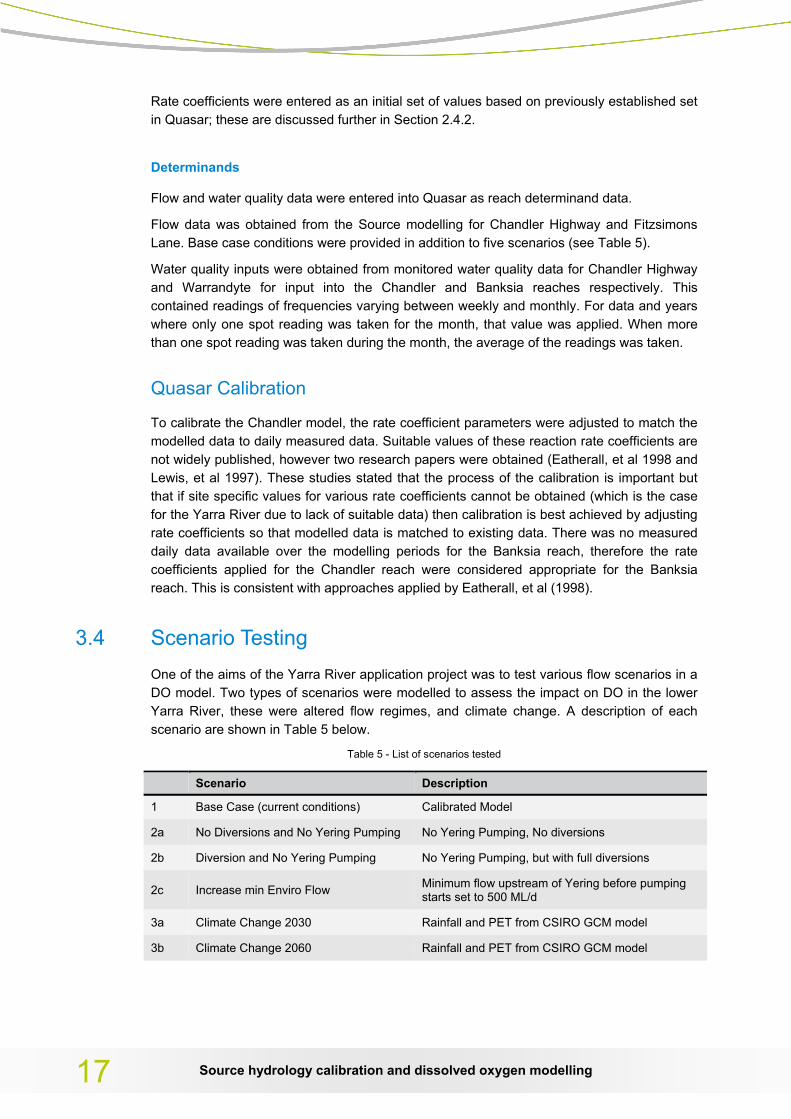
3.4 Scenario Testing One of the aims of the Yarra River application project was to test various flow scenarios in a DO model. Two types of scenarios were modelled to assess the impact on DO in the lower Yarra River, these were altered flow regimes, and climate change. A description of each scenario are shown in Table 5 below.
Table 5 - List of scenarios tested
Scenario Description
1 Base Case (current conditions) Calibrated Model
2a No Diversions and No Yering Pumping No Yering Pumping, No diversions
2b Diversion and No Yering Pumping No Yering Pumping, but with full diversions
2c Increase min Enviro Flow Minimum flow upstream of Yering before pumping starts set to 500 ML/d
3a Climate Change 2030 Rainfall and PET from CSIRO GCM model
3b Climate Change 2060 Rainfall and PET from CSIRO GCM model
Source hydrology calibration and dissolved oxygen modelling 17
For each scenario listed above, daily time series outputs from Source were provided for an average (2004), dry (2006), and wet (1996) year to be used as inputs into QUASAR. The Chandler reach applied the modelled streamflow output from 229143, Chandler Hwy) and the Banksia reach output from 229142, Fitzsimons Ln).
Altered Flow Regimes
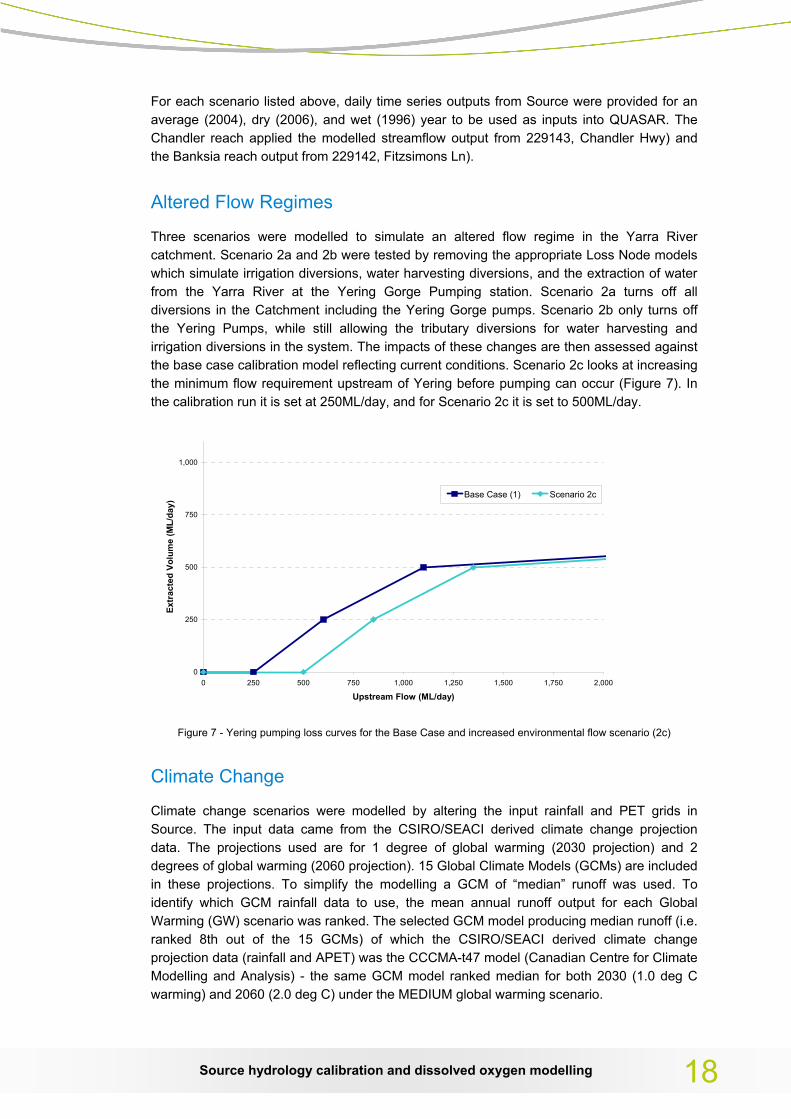
Three scenarios were modelled to simulate an altered flow regime in the Yarra River catchment. Scenario 2a and 2b were tested by removing the appropriate Loss Node models which simulate irrigation diversions, water harvesting diversions, and the extraction of water from the Yarra River at the Yering Gorge Pumping station. Scenario 2a turns off all diversions in the Catchment including the Yering Gorge pumps. Scenario 2b only turns off the Yering Pumps, while still allowing the tributary diversions for water harvesting and irrigation diversions in the system. The impacts of these changes are then assessed against the base case calibration model reflecting current conditions. Scenario 2c looks at increasing the minimum flow requirement upstream of Yering before pumping can occur (Figure 7). In the calibration run it is set at 250ML/day, and for Scenario 2c it is set to 500ML/day.
0
250
500
750
1,000
0 250 500 750 1,000 1,250 1,500 1,750 2,000
Upstream Flow (ML/day)
Extr
acte
d Vo
lum
e (M
L/da
y)
Base Case (1) Scenario 2c
Figure 7 - Yering pumping loss curves for the Base Case and increased environmental flow scenario (2c)
Climate Change
Climate change scenarios were modelled by altering the input rainfall and PET grids in Source. The input data came from the CSIRO/SEACI derived climate change projection data. The projections used are for 1 degree of global warming (2030 projection) and 2 degrees of global warming (2060 projection). 15 Global Climate Models (GCMs) are included in these projections. To simplify the modelling a GCM of “median” runoff was used. To identify which GCM rainfall data to use, the mean annual runoff output for each Global Warming (GW) scenario was ranked. The selected GCM model producing median runoff (i.e. ranked 8th out of the 15 GCMs) of which the CSIRO/SEACI derived climate change projection data (rainfall and APET) was the CCCMA-t47 model (Canadian Centre for Climate Modelling and Analysis) - the same GCM model ranked median for both 2030 (1.0 deg C warming) and 2060 (2.0 deg C) under the MEDIUM global warming scenario.
Source hydrology calibration and dissolved oxygen modelling 18
4 Results and Discussion
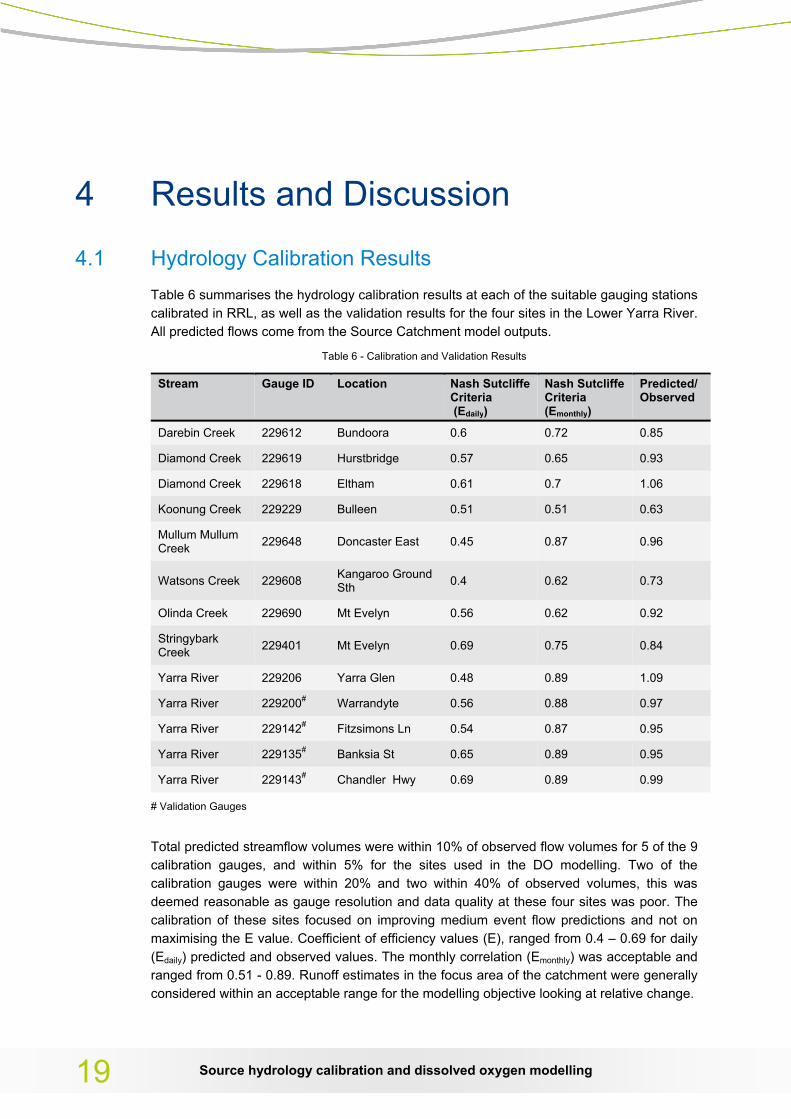
4.1 Hydrology Calibration Results Table 6 summarises the hydrology calibration results at each of the suitable gauging stations calibrated in RRL, as well as the validation results for the four sites in the Lower Yarra River. All predicted flows come from the Source Catchment model outputs.
Table 6 - Calibration and Validation Results
Stream Gauge ID Location Nash Sutcliffe Criteria (Edaily)
Nash Sutcliffe Criteria (Emonthly)
Predicted/ Observed
Darebin Creek 229612 Bundoora 0.6 0.72 0.85
Diamond Creek 229619 Hurstbridge 0.57 0.65 0.93
Diamond Creek 229618 Eltham 0.61 0.7 1.06
Koonung Creek 229229 Bulleen 0.51 0.51 0.63
Mullum Mullum Creek 229648 Doncaster East 0.45 0.87 0.96
Watsons Creek 229608 Kangaroo Ground Sth 0.4 0.62 0.73
Olinda Creek 229690 Mt Evelyn 0.56 0.62 0.92
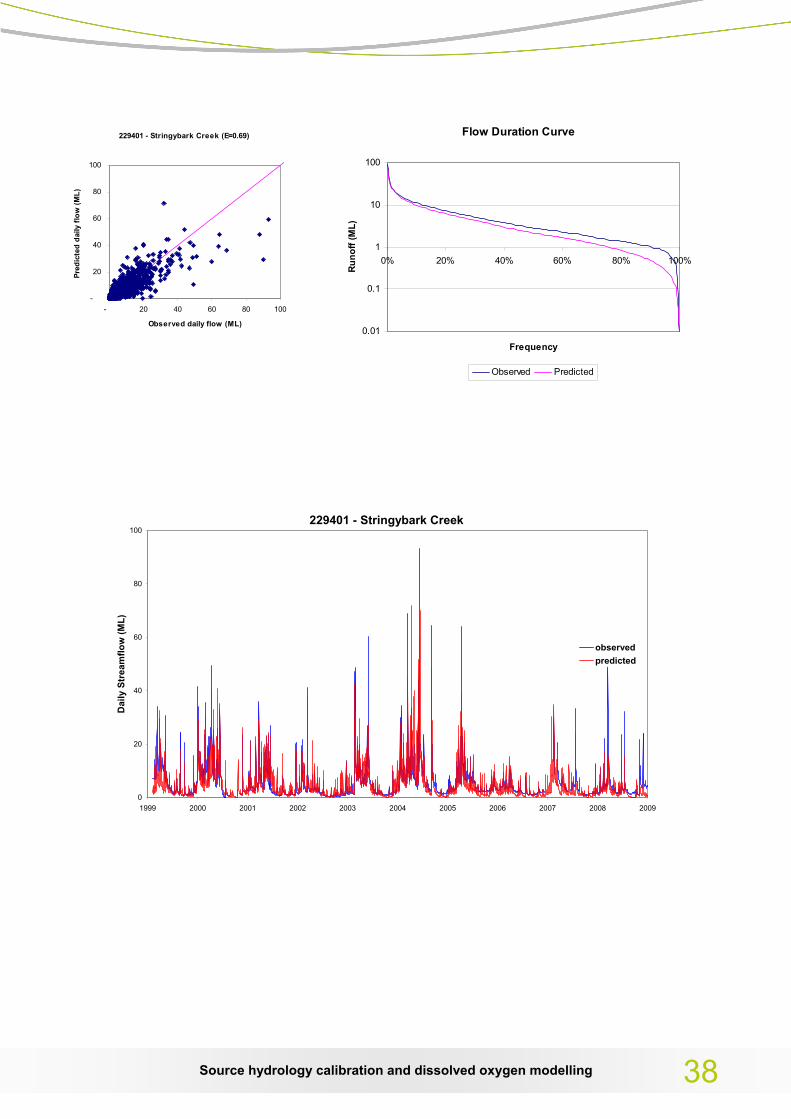
Stringybark Creek 229401 Mt Evelyn 0.69 0.75 0.84
Yarra River 229206 Yarra Glen 0.48 0.89 1.09
Yarra River 229200# Warrandyte 0.56 0.88 0.97
Yarra River 229142# Fitzsimons Ln 0.54 0.87 0.95
Yarra River 229135# Banksia St 0.65 0.89 0.95
Yarra River 229143# Chandler Hwy 0.69 0.89 0.99
# Validation Gauges
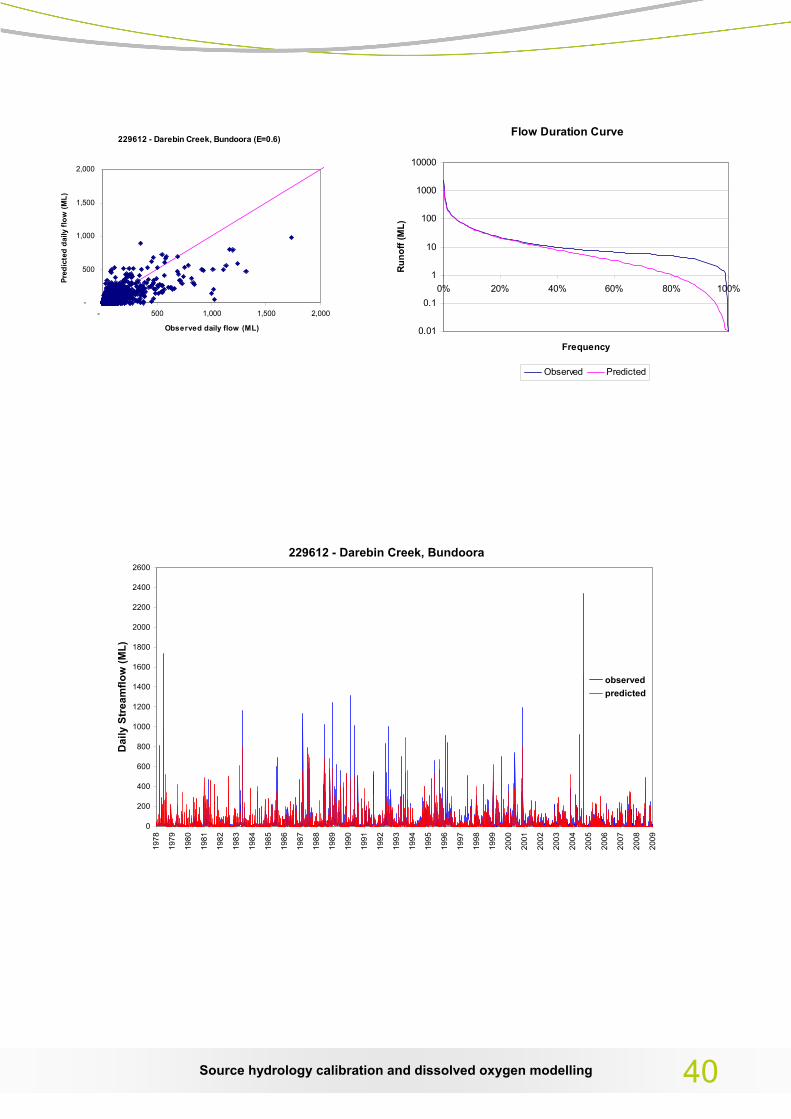
Total predicted streamflow volumes were within 10% of observed flow volumes for 5 of the 9 calibration gauges, and within 5% for the sites used in the DO modelling. Two of the calibration gauges were within 20% and two within 40% of observed volumes, this was deemed reasonable as gauge resolution and data quality at these four sites was poor. The calibration of these sites focused on improving medium event flow predictions and not on maximising the E value. Coefficient of efficiency values (E), ranged from 0.4 – 0.69 for daily (Edaily) predicted and observed values. The monthly correlation (Emonthly) was acceptable and ranged from 0.51 - 0.89. Runoff estimates in the focus area of the catchment were generally considered within an acceptable range for the modelling objective looking at relative change.
Source hydrology calibration and dissolved oxygen modelling 19
Source hydrology calibration and dissolved oxygen modelling
20
229142 - Yarra River, Fitzsimons Ln (E=0.54)
-
5,000
10,000
15,000
20,000
25,000
- 5,000 10,000 15,000 20,000 25,000
Observed daily flow (ML)
Pred
icte
d da
ily fl
ow (M
L)
229143 - Yarra River, Chandler Hwy (E=0.69)
-
5,000
10,000
15,000
20,000
25,000
- 5,000 10,000 15,000 20,000 25,000
Observed daily flow (ML)
Pred
icte
d da
ily fl
ow (M
L)
An initial comparison of daily predicted and observed flows highlighted that there was a flow lag to be accounted for in the runoff routing through main stretch of the Yarra River. A one day lag was applied upstream of the Yering Gorge pumping station. This significantly improved the daily predicted and observed flow comparisons. The lag was applied upstream of the pumping station as it was noted that flows after the pumping station were dropping below the environmental flow requirement. When the lag was applied most of these instances disappeared and the timing of runoff peaks were better aligned.
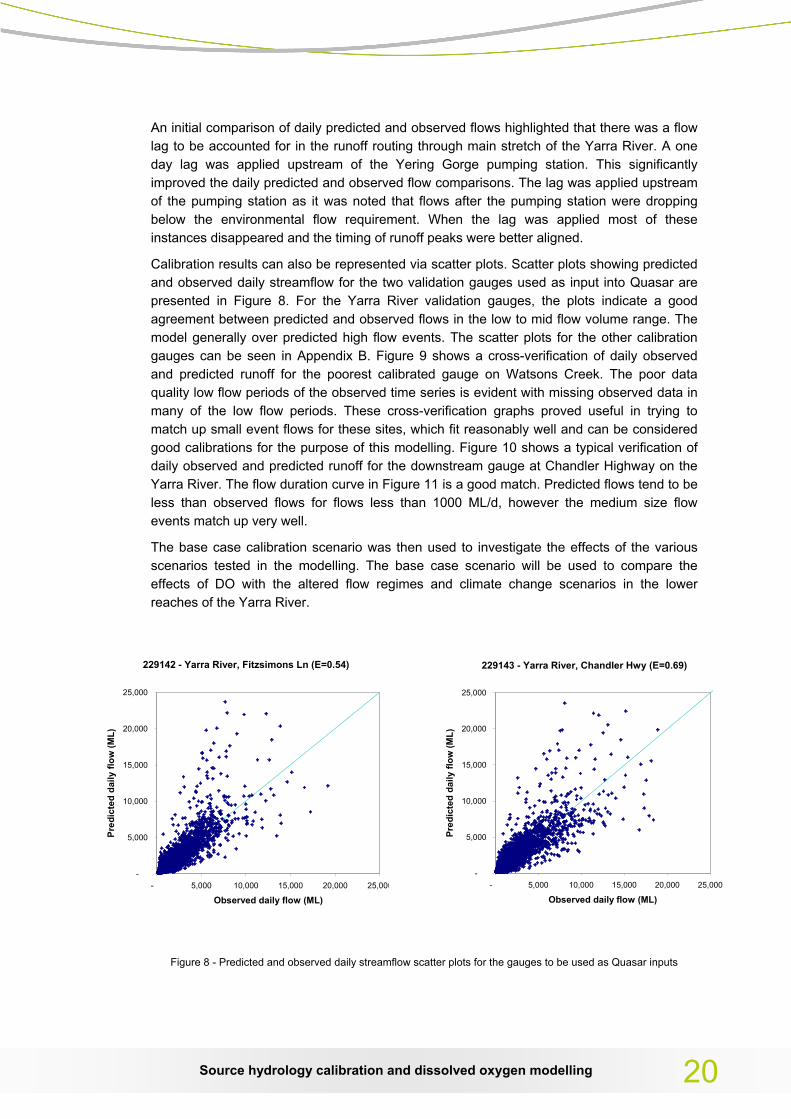
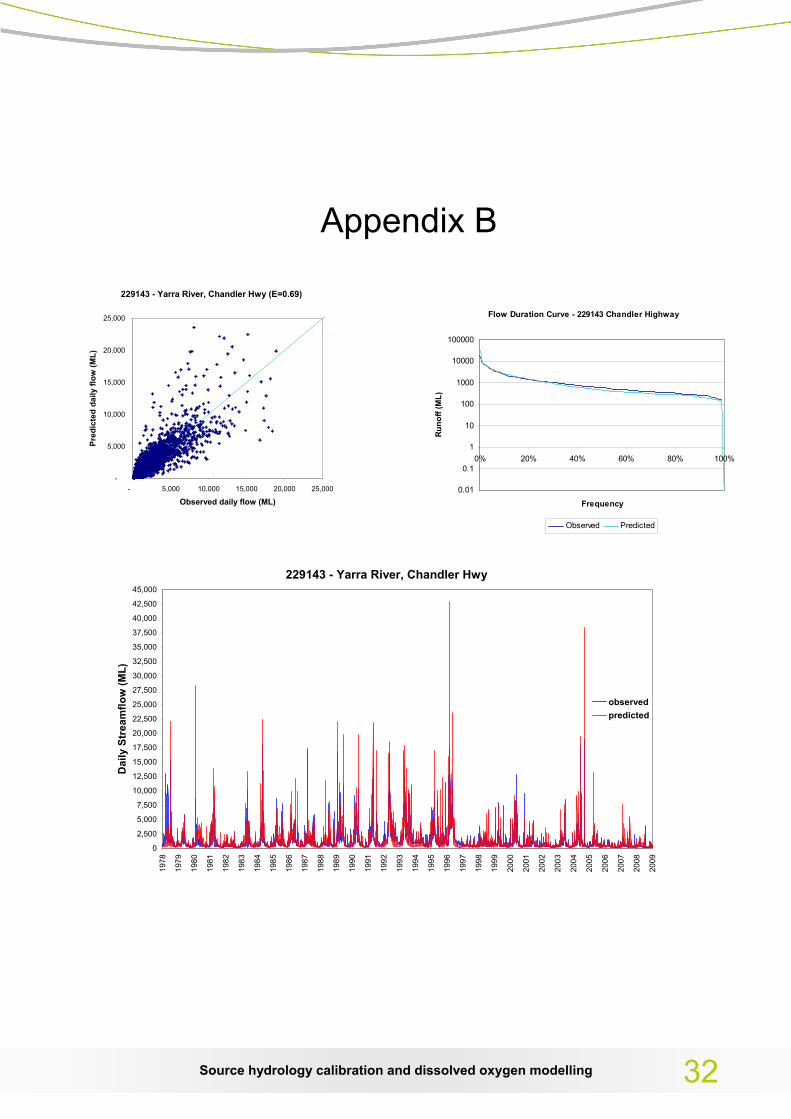
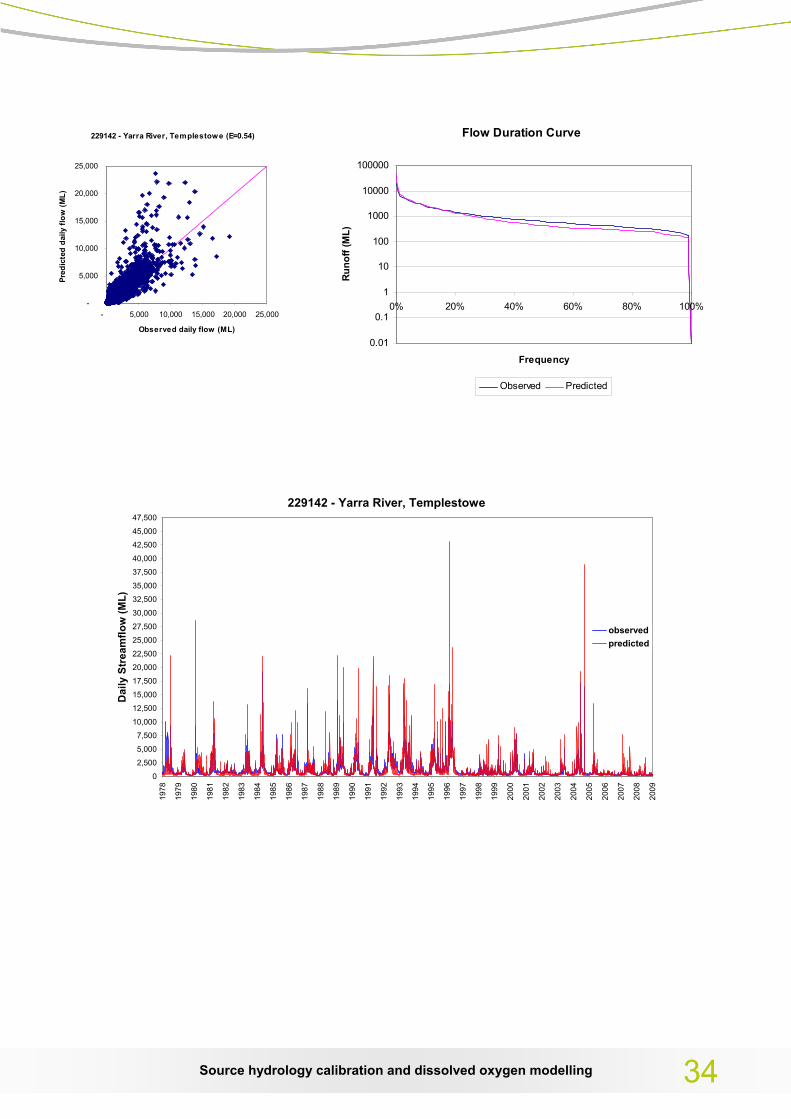
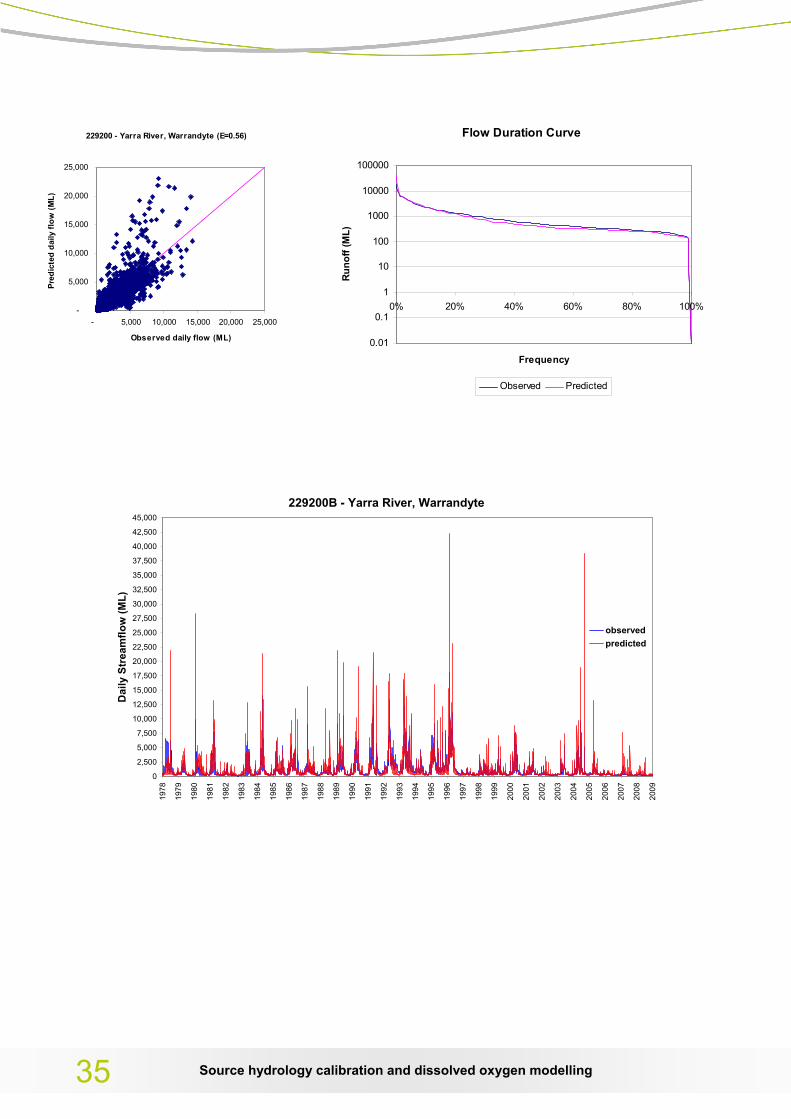
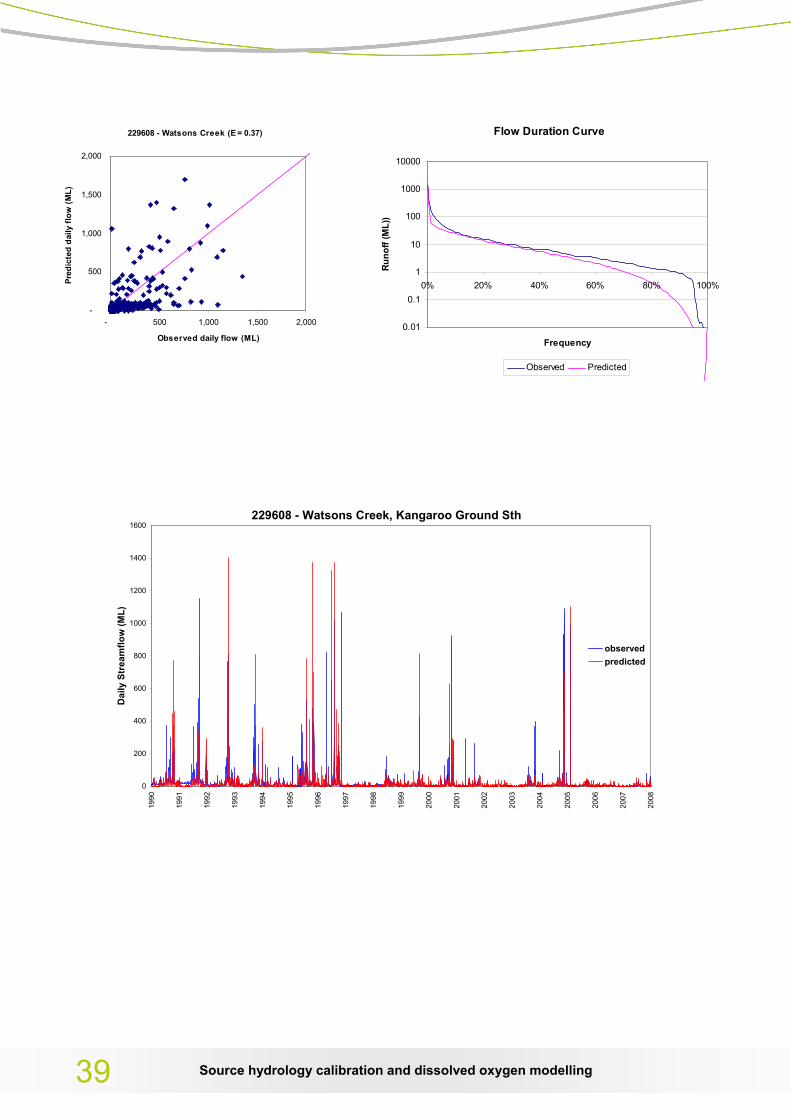
Calibration results can also be represented via scatter plots. Scatter plots showing predicted and observed daily streamflow for the two validation gauges used as input into Quasar are presented in Figure 8. For the Yarra River validation gauges, the plots indicate a good agreement between predicted and observed flows in the low to mid flow volume range. The model generally over predicted high flow events. The scatter plots for the other calibration gauges can be seen in Appendix B. Figure 9 shows a cross-verification of daily observed and predicted runoff for the poorest calibrated gauge on Watsons Creek. The poor data quality low flow periods of the observed time series is evident with missing observed data in many of the low flow periods. These cross-verification graphs proved useful in trying to match up small event flows for these sites, which fit reasonably well and can be considered good calibrations for the purpose of this modelling. Figure 10 shows a typical verification of daily observed and predicted runoff for the downstream gauge at Chandler Highway on the Yarra River. The flow duration curve in Figure 11 is a good match. Predicted flows tend to be less than observed flows for flows less than 1000 ML/d, however the medium size flow events match up very well.
The base case calibration scenario was then used to investigate the effects of the various scenarios tested in the modelling. The base case scenario will be used to compare the effects of DO with the altered flow regimes and climate change scenarios in the lower reaches of the Yarra River.
Figure 8 - Predicted and observed daily streamflow scatter plots for the gauges to be used as Quasar inputs

229608 - Watsons Creek, Kangaroo Ground Sth
0
20
40
60
80
100
120
140
160
180
200
01/1998 02/1998 03/1998 04/1998 05/1998 06/1998 07/1998 08/1998 09/1998 10/1998 11/1998 12/1998 01/1999
Dai
ly S
trea
mflo
w (M
L)
observedpredicted
Figure 9 - Daily hydrograph showing poor (deleted flat lining data) observed data quality in low flows
229143 - Yarra River, Chandler Highway
0
1,000
2,000
3,000
4,000
5,000
6,000
7,000
8,000
1/01/98 1/02/98 1/03/98 1/04/98 1/05/98 1/06/98 1/07/98 1/08/98 1/09/98 1/10/98 1/11/98 1/12/98 1/01/99
Dai
ly S
trea
mflo
w (M
L)
observed
predicted
Figure 10 - Typical cross verification daily hydrograph on the Yarra River
Source hydrology calibration and dissolved oxygen modelling 21

Flow Duration Curve - 229143 Chandler Highway
0.01
0.1
1
10
100
1000
10000
100000
0% 20% 40% 60% 80% 100%
Frequency
Run
off (
ML)
Observed Predicted
Figure 11 - Flow duration curve for Chandler Hwy showing a good calibration for daily flows
4.2 Quality of Observed and Predicted Data A recurring problem in attempting to calibrate many of tributary gauges was the availability of reliable gauge data. Many Melbourne Water gauging stations are used for Flood Warning systems only, therefore are not of high resolution at low flows. This creates problems when trying to calibrate these gauges especially the baseflow. As RRL tries to optimise the coefficient of efficiency (E) over the entire data set it tends to underestimate baseflow and overestimate peak events. With gauged baseflows being unreliable, good calibrations proved difficult when looking at the total predicted versus observed flow volumes as well as the E values. Manual adjustments were then used to match up the hydrographs a lot better in the small to medium sized event flows. This resulted in E values decreasing. However this was still a reasonable result as an aim of this project is to try and have reasonable results for baseflow and low to medium flow events as low flows are seen as a driver for low DO levels.
Annual volumes can vary greatly in the Yarra River, from over 1000 GL on a wet year to less than 200 GL on a dry year. Looking at annual total flow at Yarra Glen (Figure 12) which sits upstream of the Yering Gorge pumping stations, it can be noted that predicted flow is generally greater than the observed flows. The cause of the predicted flows being greater than the observed is possibly due to the fact that a number of potential losses from the system were not represented in the model, these include;
• Irrigation/Other Diversions
• Farm Dams
• Channel Losses
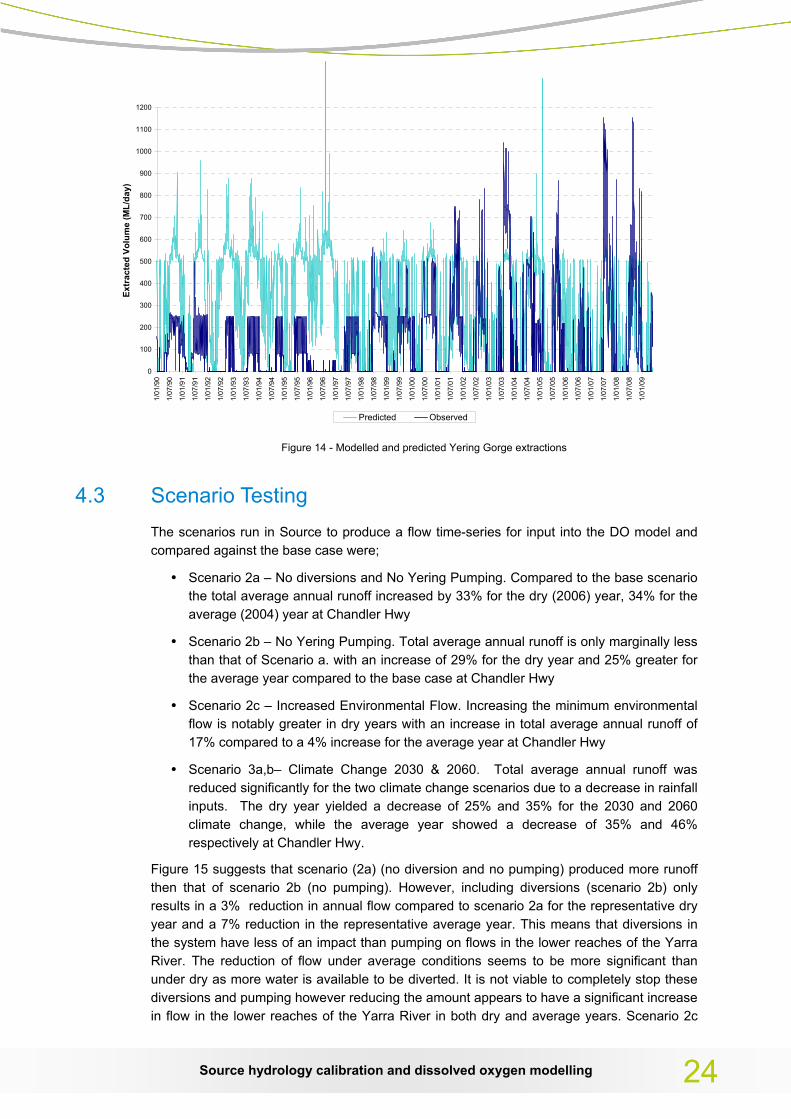
The chandler highway gauge downstream of Yering tends to have a higher annual observed flow then predicted flow (Figure 13). This is due the way the Yering pumps are actually run in the system compared to how they were modelled. Too much water is being extracted from the river in the model. Figure 14 shows the observed extractions from Yering Gorge and the extracted volume from the base case over time. It can be seen that the modelled extractions are significantly greater pre 1997, however match up a lot better in the drier years post 1997.
Source hydrology calibration and dissolved oxygen modelling 22

This is most likely due to Sugarloaf Reservoir being full pre 1997. To improve the extractions in the model, Sugarloaf Reservoir levels would need to be modelled. For the modelling purposes of this project this was still deemed suitable enough to test the effects of the Yering pumps on river flow and DO.
229206 - Yarra River, Yarra Glen
0
100
200
300
400
500
600
700
800
900
1000
1100
1992
1993
1994
1995
1996
1997
1998
1999
2000
2001
2002
2003
2004
2005
2006
2007
2008
Tota
l Ann
ual F
low
(GL)
ObservedPredicted
Figure 12 – Annual Flow Volumes at Yarra Glen, upstream of the Yering Gorge pumping station
229143 - Yarra River Chandler Highway
0
100
200
300
400
500
600
700
800
900
1,000
1,100
1,200
1992 1993 1994 1995 1996 1997 1998 1999 2000 2001 2002 2003 2004 2005 2006 2007 2008
Tota
l Ann
ual F
low
(GL)
ObservedPredicted
Figure 13 – Annual flow volumes at Chandler Hwy, downstream of the Yering Gorge pumping station
Source hydrology calibration and dissolved oxygen modelling 23
0
100
200
300
400
500
600
700
800
900
1000
1100
1200
1/01
/90
1/07
/90
1/01
/91
1/07
/91
1/01
/92
1/07
/92
1/01
/93
1/07
/93
1/01
/94
1/07
/94
1/01
/95
1/07
/95
1/01
/96
1/07
/96
1/01
/97
1/07
/97
1/01
/98
1/07
/98
1/01
/99
1/07
/99
1/01
/00
1/07
/00
1/01
/01
1/07
/01
1/01
/02
1/07
/02
1/01
/03
1/07
/03
1/01
/04
1/07
/04
1/01
/05
1/07
/05
1/01
/06
1/07
/06
1/01
/07
1/07
/07
1/01
/08
1/07
/08
1/01
/09
Extr
acte
d Vo
lum
e (M
L/da
y)
Predicted Observed
Figure 14 - Modelled and predicted Yering Gorge extractions
4.3 Scenario Testing The scenarios run in Source to produce a flow time-series for input into the DO model and compared against the base case were;
• Scenario 2a – No diversions and No Yering Pumping. Compared to the base scenario the total average annual runoff increased by 33% for the dry (2006) year, 34% for the average (2004) year at Chandler Hwy
• Scenario 2b – No Yering Pumping. Total average annual runoff is only marginally less than that of Scenario a. with an increase of 29% for the dry year and 25% greater for the average year compared to the base case at Chandler Hwy
• Scenario 2c – Increased Environmental Flow. Increasing the minimum environmental flow is notably greater in dry years with an increase in total average annual runoff of 17% compared to a 4% increase for the average year at Chandler Hwy
• Scenario 3a,b– Climate Change 2030 & 2060. Total average annual runoff was reduced significantly for the two climate change scenarios due to a decrease in rainfall inputs. The dry year yielded a decrease of 25% and 35% for the 2030 and 2060 climate change, while the average year showed a decrease of 35% and 46% respectively at Chandler Hwy.
Figure 15 suggests that scenario (2a) (no diversion and no pumping) produced more runoff then that of scenario 2b (no pumping). However, including diversions (scenario 2b) only results in a 3% reduction in annual flow compared to scenario 2a for the representative dry year and a 7% reduction in the representative average year. This means that diversions in the system have less of an impact than pumping on flows in the lower reaches of the Yarra River. The reduction of flow under average conditions seems to be more significant than under dry as more water is available to be diverted. It is not viable to completely stop these diversions and pumping however reducing the amount appears to have a significant increase in flow in the lower reaches of the Yarra River in both dry and average years. Scenario 2c
Source hydrology calibration and dissolved oxygen modelling 24

shows that by increasing the minimum environmental flow passing Yering, an increase in flow can be achieved. This increase is more notable during dry conditions where DO is also expected to be very low in the lower reaches. Further work may be required to examine these results more closely and to investigate whether the minimum environmental flow target at Yering needs to be increased. Both climate change scenarios 3a, b show a decrease in total annual flow with the average year 10% more than the dry year.
0
100
200
300
400
500
600
Base 2a 2b 2c 3a 3b
Scenario
Tota
l Flo
w (G
L)
Dry (2006) Average (2004)
Figure 15 – Total annual flow comparisons for the selected representative dry and average year at Chandler Hwy
DO modelling results for Chandler and Banksia reaches are presented as time series, exceedance plots and spells plots during a typical wet year, dry year, and average rainfall year. The results can be seen in Appendix C (Figures 18-31).
The DO modelling suggests that flow has a strong influence on DO and is the major driver. All years modelled show a variation of DO, being lower during the warmer months and higher during the cooler months. Figure 16 shows that there is not a large variation between the scenarios in the distribution of spells of DO below 6mg/L for the representative average year. This is also the case for the dry year (Figure 17). As expected the dry year has the longest durations of DO being below the threshold. Each of the altered flow regime scenarios showed higher DO than that of the base case as the input flow was nominally higher. The climate change scenario flows typically show lower DO than the base case and altered flow regime scenarios. Climate change is predicted to have the greatest impact on DO via reductions in flow that translate to increased periods / frequency of low DO occurrences, however further work is required to parameterise QUASAR with locally relevant rate constant data for the Yarra to improve estimates.
Source hydrology calibration and dissolved oxygen modelling 25

Source hydrology calibration and dissolved oxygen modelling 26
Figure 16 - Chandler Hwy Do spell durations of less than 6mg/L for an average (2004) and dry (2006) year
D istribution of Spel ls
Jan Feb Mar A pr May Jun Jul A ug Sep Oct N ov D ec2004
D istribut ion of Spel ls
Jan Feb Mar A pr May Jun Jul A ug Sep Oct N ov D ec2006
6.0 mg/L B ase 6.0 mg/L N o D iv 6.0 m g/L N o Y er D iv
6.0 mg/L I nc Env Flow s 6.0 mg/L CC 2030 6.0 m g/L CC 2060
6.0 mg/L Measured
5 Conclusions The Source model was built to assist in the establishment of appropriate trigger levels, to determine when and how to augment flow in the river to minimise low dissolved oxygen events and minimise ecological impacts. Hydrological time series of various scenarios from the Source model were able to provide input into the QUASAR DO model to help assess the subsequent impacts on river DO levels.
Acceptable calibration results were obtained within the catchment focus area. Predicted runoff volumes in the focus area of the lower Yarra River were within 5% of the observed flow, however improvements in gauged data from many of the tributaries are needed to improve the calibrations at low flows. The modelling of the Yering Gorge pumping station must also be improved to gain better calibration results.
The results suggest that flow is the major driver for DO in the river. Scenario modelling has shown that climate (dry versus average and wet years) has more influence on DO in the Yarra rather than specific altered flow scenarios. Climate change is predicted to reduce flow in the river, which results in more frequent and longer periods of low DO. Under climate change conditions various management options may need to be considered to combat a decline in DO in the Yarra. Further work is needed to establish what the critical limits are and how management options can keep DO at sustainable levels.
The work demonstrates that Source is a very useful and flexible modelling package that allows a variety of scenarios to be tested easily.
Source hydrology calibration and dissolved oxygen modelling 27

6 References Argent R. M. (2006) PortsE2: A Decision Support System for Water Quality Improvement in
Port Phillip and Western Port. CEAH Report 01/06.
BMT WBM (2008) PortsE2 Model Calibration and Extension Project: Draft Report. BMT WBM. Brisbane.
Commonwealth of Australia (2006) LandSat Imagery. Commonwealth of Australia.
Cox, B.A. (2003). A review of currently available in-stream water-quality models and their applicability for simulating dissolved oxygen in lowland rivers. The Science of the Total Environment 314 –316: 335–377.
CRC for Catchment Hydrology (2004) Rainfall Runoff Library – User Guide. CRC for Catchment Hydrology.
Chiew, F., and Scanlon, P. (2002). Estimation of Pollutant Concentrations for E2Modelling of the South-East Queensland Region. – Technical Report. Cooperative Research Centre for Catchment Hydrology. Available from http://www.catchment.crc.org.au/pdfs/technical200202.pdf
Connell Wagner (2006) Toorourrong Reservoir Capacity Survey Report – Reservoir Remedial Works. Connell Wagner. South Melbourne.
Delgado, P., Kelley, P., Murray, N. & Satheesh, A. (2011), Source User Guide, eWater Cooperative Research Centre, Canberra, Australia.
DSE (2005) Vicmap Elevation. Victorian Government – Department of Sustainability and Environment. Melbourne.
DSE (2007) Our Water Our Future – Next Stage of the Governments Water Plan. Victorian Government – Department of Sustainability and Environment. Melbourne
Eatherall, A., Boorman, D.B., Williams R.J., and Kowe, R. (1998). Modelling in-stream water quality in LOIS. The Science of the Total Environment 210/211 (1998) 499-517.
eWater (2008) Watercast: The Water and Contaminant Analysis and Simulation Tool for Modelling – User Guide. eWater CRC. Canberra.
eWater (2009) Yarra River Focus Catchment. eWater CRC. Canberra. Available through: http://www.ewatercrc.com.au/reports/Yarra%20focus%20catchment%20aug09-1.pdf
Lewis, D.R., Williams, R.J., Whitehead, P.G. (1997). Quality simulation along rivers (QUASAR): an application to the Yorkshire Ouse. The Science of the Total Environment 194/195 (1997) 399-418.
MMBW (1985) Toorourrong Reservoir Survey – Unpublished Records. Melbourne and Metropolitan Board of Works. Melbourne.
MWC (2003) Yan Yean Reservoir Data Sheet – Internal Document, Melbourne Water Corporation. Melbourne.
Source hydrology calibration and dissolved oxygen modelling 28

MWC and PPWCMA (2004a) Port Phillip and Westernport Regional River Health Strategy, Melbourne Water Corporation, Melbourne.
MWC and PPWCMA (2004b) Melbourne’s Rivers and Creeks 2004, Melbourne Water Corporation, Melbourne.
MWC (2007) Yarra River Extreme Drought Environmental Flows - Recommendations Report September 2007. Melbourne Water Corporation, Melbourne.
Nash, J.E., and Sutcliffe, J.V. (1970). River Forecasting Using Conceptual Models, 1.a A Discussion of Principles. Journal of Hydrology, 10: 282-290. http://www.elsevier.com/wps/find/journaldescription.cws_home/503343/description#
SILO – Queensland DERM (2009). The Silo Data Drill. Department of Environment and Natural Resource Management (DERM).
Victorian Government (2007) Water Act 1989 – Temporary Qualification of Rights in the Melbourne Water Supply System – Yarra October 2007. Victorian Government. Melbourne.
Waters D. (2008) Water quality monitoring and E2 modelling in the South West NRM Region, Queensland –Technical Report for South West NRM. Department of Natural Resources and Water. Coorparoo. ISBN 978-1741723175
Source hydrology calibration and dissolved oxygen modelling 29

Acknowledgements The author would like to acknowledge the contributions and assistance of the following people, without whose assistance the model would not have been completed.
• David Waters – eWater CRC. For all his assistance with regards to modelling and data requirements as well as reviewing and editing the report.
• Shane Haydon – Melbourne Water. For assisting with the modelling process.
• Phillip Jordan – SKM. Also for assisting with the modelling process.
• Ian S Watson – Melbourne Water. For providing information and data regarding water supply reservoirs and diversions.
• Steve Hosking – Melbourne Water. For providing assistance and data relating to Irrigation Diversions.
• Sholto Maud and Peter Waugh – Melbourne Water. For providing and assisting with Melbourne Water’s Hydstra database and gauging station information.
• Tam Hoang – Melbourne Water. For providing assistance with catchment area information.
• Christine Hughes – Melbourne Water. For providing information on Yarra environmental flow entitlements.
• Trevor Buckingham – Yarra Valley Water. For providing information and data on catchment STPs.
• Jacinta Burns and Ted Chylinski – Melbourne Water. For providing GIS data and assistance.
• Graham Rooney, Rhys Coleman and Melbourne Water’s Research and Technology Team for reviewing the paper.
• Yarra River Application Project Team, eWater CRC and Melbourne Water generally for all the assistance provided along the way.
• CSIRO for climate change data
• SKM for QUASAR water quality modelling
Source hydrology calibration and dissolved oxygen modelling 30
Appendix A
Gauge ID Catchment Baseflow
coeff. Impervious Threshold
Infiltration coeff.
Infiltration shape
Interflow coeff.
Pervious fraction RISC recharg
e coeff. SMSC
Darebin Creek 229612 0.186 5 400 4 0.05 0.88 2 0.422 297
Diamond Creek
229619 0.397 5 214 2.6 0.03 1 4.8 0.184 384 229618 0.2 5 88 1.7 0 0.91 5 0.309 400
Koonung Creek 229229 0.02 5 53 4 0 0.75 5 0.5 300
Mullum Mullum Creek 229648 0.114 3 362 5 0.3 0.8 0.3 0.4 180
Watsons Creek 229608 0.28 5 270 5 0.03 1 5 0.21 500
Olinda Creek 229690 0.065 5 397 1 0.08 1 5 0.4 500 Stringybark
Creek 229401 0.08 5 398 2.9 0.3 1 0.4 0.6 350
Yarra River 229206 0.158 5 120 0.8 0 1 2 0.8 190
Source hydrology calibration and dissolved oxygen modelling 31
Source hydrology calibration and dissolved oxygen modelling 32
Appendix B
Flow Duration Curve - 229143 Chandler Highway
0.01
0.1
1
10
100
1000
10000
100000
0% 20% 40% 60% 80% 100%
Frequency
Runo
ff (M
L)
Observed Predicted
229143 - Yarra River, Chandler Hwy
0
2,500
5,000
7,500
10,000
12,500
15,000
17,500
20,000
22,500
25,000
27,500
30,000
32,500
35,000
37,500
40,000
42,500
45,000
1978
1979
1980
1981
1982
1983
1984
1985
1986
1987
1988
1989
1990
1991
1992
1993
1994
1995
1996
1997
1998
1999
2000
2001
2002
2003
2004
2005
2006
2007
2008
2009
Dai
ly S
trea
mflo
w (M
L)
observedpredicted
229143 - Yarra River, Chandler Hwy (E=0.69)
-
5,000
10,000
15,000
20,000
25,000
- 5,000 10,000 15,000 20,000 25,000
Observed daily flow (ML)
Pred
icte
d da
ily fl
ow (M
L)

Source hydrology calibration and dissolved oxygen modelling 33
229135 - Yarra River, Heidelberg (E=0.65)
-
5,000
10,000
15,000
20,000
25,000
- 5,000 10,000 15,000 20,000 25,000
Observed daily flow (ML)
Pred
icte
d da
ily fl
ow (M
L)
Flow Duration Curve
0.01
0.1
1
10
100
1000
10000
100000
0% 20% 40% 60% 80% 100%
Frequency
Runo
ff (M
L)Observed Predicted
229135 - Yarra River, Heidelberg
0
2,500
5,000
7,500
10,000
12,500
15,000
17,500
20,000
22,500
25,000
27,500
30,000
32,500
35,000
37,500
40,000
42,500
45,000
47,500
1978
1979
1980
1981
1982
1983
1984
1985
1986
1987
1988
1989
1990
1991
1992
1993
1994
1995
1996
1997
1998
1999
2000
2001
2002
2003
2004
2005
2006
2007
2008
2009
Dai
ly S
trea
mflo
w (M
L)
observedpredicted
Source hydrology calibration and dissolved oxygen modelling 34
229142 - Yarra River, Templestowe (E=0.54)
-
5,000
10,000
15,000
20,000
25,000
- 5,000 10,000 15,000 20,000 25,000
Observed daily flow (ML)
Pred
icte
d da
ily fl
ow (M
L)
Flow Duration Curve
0.01
0.1
1
10
100
1000
10000
100000
0% 20% 40% 60% 80% 100%
FrequencyR
unof
f (M
L)
Observed Predicted
229142 - Yarra River, Templestowe
0
2,500
5,000
7,500
10,000
12,500
15,000
17,500
20,000
22,500
25,000
27,500
30,000
32,500
35,000
37,500
40,000
42,500
45,000
47,500
1978
1979
1980
1981
1982
1983
1984
1985
1986
1987
1988
1989
1990
1991
1992
1993
1994
1995
1996
1997
1998
1999
2000
2001
2002
2003
2004
2005
2006
2007
2008
2009
Dai
ly S
trea
mflo
w (M
L)
observedpredicted
Source hydrology calibration and dissolved oxygen modelling 35
229200 - Yarra River, Warrandyte (E=0.56)
-
5,000
10,000
15,000
20,000
25,000
- 5,000 10,000 15,000 20,000 25,000
Observed daily flow (ML)
Pred
icte
d da
ily fl
ow (M
L)
Flow Duration Curve
0.01
0.1
1
10
100
1000
10000
100000
0% 20% 40% 60% 80% 100%
FrequencyR
unof
f (M
L)
Observed Predicted
229200B - Yarra River, Warrandyte
0
2,500
5,000
7,500
10,000
12,500
15,000
17,500
20,000
22,500
25,000
27,500
30,000
32,500
35,000
37,500
40,000
42,500
45,000
1978
1979
1980
1981
1982
1983
1984
1985
1986
1987
1988
1989
1990
1991
1992
1993
1994
1995
1996
1997
1998
1999
2000
2001
2002
2003
2004
2005
2006
2007
2008
2009
Dai
ly S
trea
mflo
w (M
L)
observedpredicted

Source hydrology calibration and dissolved oxygen modelling 36
229206 - Yarra River, Yarra Glen (E=0.48)
-
5,000
10,000
15,000
20,000
25,000
- 5,000 10,000 15,000 20,000 25,000
Observed daily flow (ML)
Pred
icte
d da
ily fl
ow (M
L)
Flow Duration Curve
0.01
0.1
1
10
100
1000
10000
100000
0% 20% 40% 60% 80% 100%
FrequencyRu
noff
(ML)
Observed Predicted
229206 - Yarra River, Yarra Glen
0
2,500
5,000
7,500
10,000
12,500
15,000
17,500
20,000
22,500
25,000
27,500
30,000
32,500
35,000
37,500
40,000
42,500
45,000
47,500
1991 1992 1993 1994 1995 1996 1997 1998 1999 2000 2001 2002 2003 2004 2005 2006 2007 2008 2009
Dai
ly S
trea
mflo
w (M
L)
observedpredicted

Source hydrology calibration and dissolved oxygen modelling 37
229229 - Koonung Creek (E=0.51)
-
100
200
300
400
500
600
700
- 100 200 300 400 500 600 700
Observed daily flow (ML)
Pred
icte
d da
ily fl
ow (M
L)
Flow Duration Curve
0.01
0.1
1
10
100
1000
10000
0% 20% 40% 60% 80% 100%
Frequency
Runo
ff (M
L)
Observed Predicted
229229- Koonung Creek
0
500
1,000
1,500
2,000
2,500
3,000
3,500
4,000
4,500
1996
1996
1997
1997
1998
1998
1999
1999
2000
2000
2001
2001
2002
2002
2003
2003
2004
2004
2005
2005
2006
2006
2007
2007
2008
2008
2009
Dai
ly S
trea
mflo
w (M
L)
observedpredicted
Source hydrology calibration and dissolved oxygen modelling 38
229401 - Stringybark Creek (E=0.69)
-
20
40
60
80
100
- 20 40 60 80 100
Observed daily flow (ML)
Pred
icte
d da
ily fl
ow (M
L)
Flow Duration Curve
0.01
0.1
1
10
100
0% 20% 40% 60% 80% 100%
FrequencyR
unof
f (M
L)
Observed Predicted
229401 - Stringybark Creek
0
20
40
60
80
100
1999 2000 2001 2002 2003 2004 2005 2006 2007 2008 2009
Dai
ly S
trea
mflo
w (M
L)
observedpredicted
Source hydrology calibration and dissolved oxygen modelling 39
229608 - Watsons Creek (E = 0.37)
-
500
1,000
1,500
2,000
- 500 1,000 1,500 2,000
Observed daily flow (ML)
Pred
icte
d da
ily fl
ow (M
L)
Flow Duration Curve
0.01
0.1
1
10
100
1000
10000
0% 20% 40% 60% 80% 100%
Frequency
Runo
ff (M
L))
Observed Predicted
229608 - Watsons Creek, Kangaroo Ground Sth
0
200
400
600
800
1000
1200
1400
1600
1990
1991
1992
1993
1994
1995
1996
1997
1998
1999
2000
2001
2002
2003
2004
2005
2006
2007
2008
Dai
ly S
trea
mflo
w (M
L)
observedpredicted
Source hydrology calibration and dissolved oxygen modelling 40
229612 - Darebin Creek, Bundoora (E=0.6)
-
500
1,000
1,500
2,000
- 500 1,000 1,500 2,000
Observed daily flow (ML)
Pred
icte
d da
ily fl
ow (M
L)
Flow Duration Curve
0.01
0.1
1
10
100
1000
10000
0% 20% 40% 60% 80% 100%
Frequency
Run
off (
ML)
Observed Predicted
229612 - Darebin Creek, Bundoora
0
200
400
600
800
1000
1200
1400
1600
1800
2000
2200
2400
2600
1978
1979
1980
1981
1982
1983
1984
1985
1986
1987
1988
1989
1990
1991
1992
1993
1994
1995
1996
1997
1998
1999
2000
2001
2002
2003
2004
2005
2006
2007
2008
2009
Dai
ly S
trea
mflo
w (M
L)
observedpredicted

Source hydrology calibration and dissolved oxygen modelling 41
229618 - Diamond Creek, Eltham (E=0.61)
-
1,000
2,000
3,000
4,000
5,000
6,000
- 1,000 2,000 3,000 4,000 5,000 6,000
Observed daily flow (ML)
Pred
icte
d da
ily fl
ow (M
L)
Flow Duration Curve
0.01
0.1
1
10
100
1000
10000
0% 20% 40% 60% 80% 100%
Frequency
Runo
ff (M
L)Observed Predicted
229618 - Diamond Creek, Eltham
0
1000
2000
3000
4000
5000
6000
7000
8000
9000
1978
1979
1980
1981
1982
1983
1984
1985
1986
1987
1988
1989
1990
1991
1992
1993
1994
1995
1996
1997
1998
1999
2000
2001
2002
2003
2004
2005
2006
2007
2008
Dai
ly S
trea
mflo
w (M
L)
observedpredicted
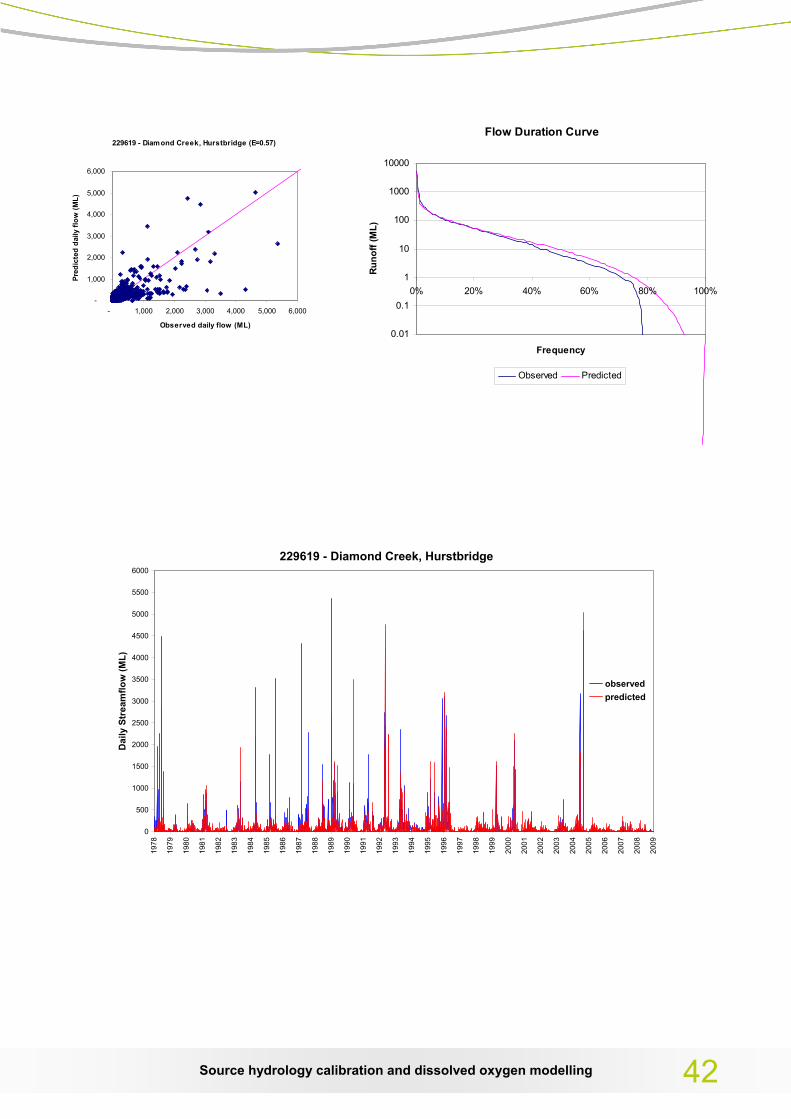
Source hydrology calibration and dissolved oxygen modelling 42
229619 - Diamond Creek, Hurstbridge (E=0.57)
-
1,000
2,000
3,000
4,000
5,000
6,000
- 1,000 2,000 3,000 4,000 5,000 6,000
Observed daily flow (ML)
Pred
icte
d da
ily fl
ow (M
L)
Flow Duration Curve
0.01
0.1
1
10
100
1000
10000
0% 20% 40% 60% 80% 100%
Frequency
Runo
ff (M
L)Observed Predicted
229619 - Diamond Creek, Hurstbridge
0
500
1000
1500
2000
2500
3000
3500
4000
4500
5000
5500
6000
1978
1979
1980
1981
1982
1983
1984
1985
1986
1987
1988
1989
1990
1991
1992
1993
1994
1995
1996
1997
1998
1999
2000
2001
2002
2003
2004
2005
2006
2007
2008
2009
Dai
ly S
trea
mflo
w (M
L)
observedpredicted
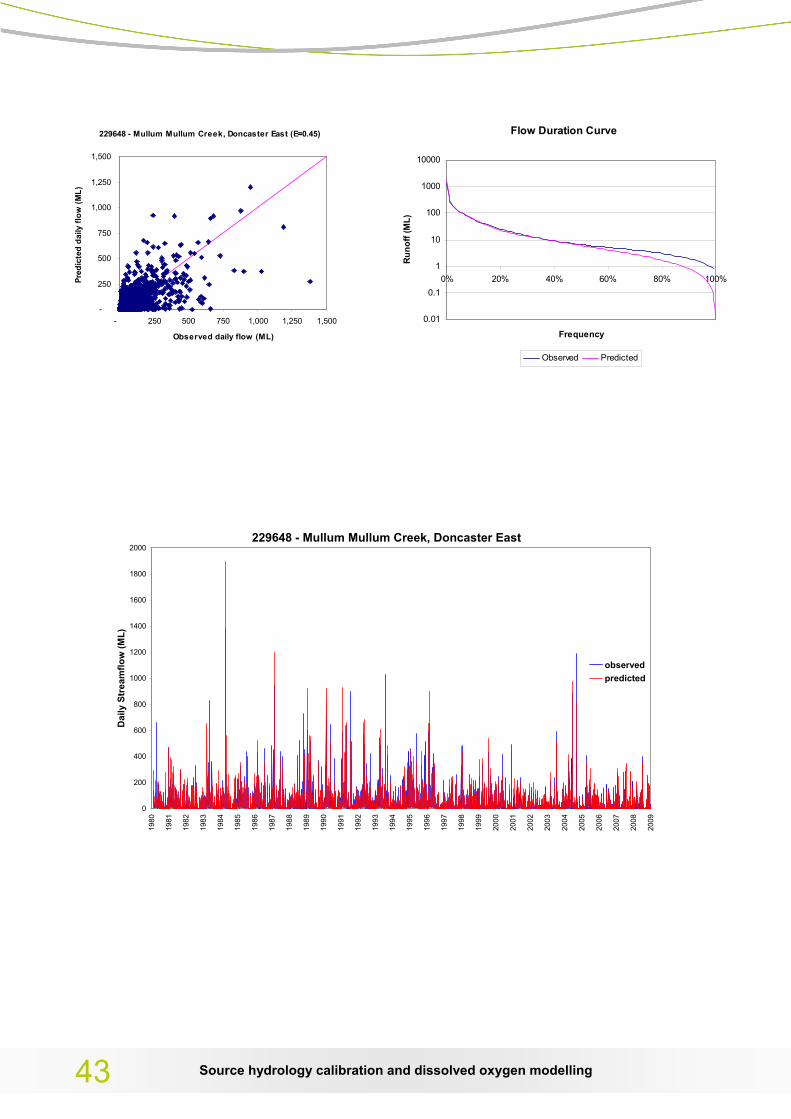
Source hydrology calibration and dissolved oxygen modelling 43
229648 - Mullum Mullum Creek, Doncaster East (E=0.45)
-
250
500
750
1,000
1,250
1,500
- 250 500 750 1,000 1,250 1,500
Observed daily flow (ML)
Pred
icte
d da
ily fl
ow (M
L)
Flow Duration Curve
0.01
0.1
1
10
100
1000
10000
0% 20% 40% 60% 80% 100%
Frequency
Run
off (
ML)
Observed Predicted
229648 - Mullum Mullum Creek, Doncaster East
0
200
400
600
800
1000
1200
1400
1600
1800
2000
1980
1981
1982
1983
1984
1985
1986
1987
1988
1989
1990
1991
1992
1993
1994
1995
1996
1997
1998
1999
2000
2001
2002
2003
2004
2005
2006
2007
2008
2009
Dai
ly S
trea
mflo
w (M
L)
observedpredicted
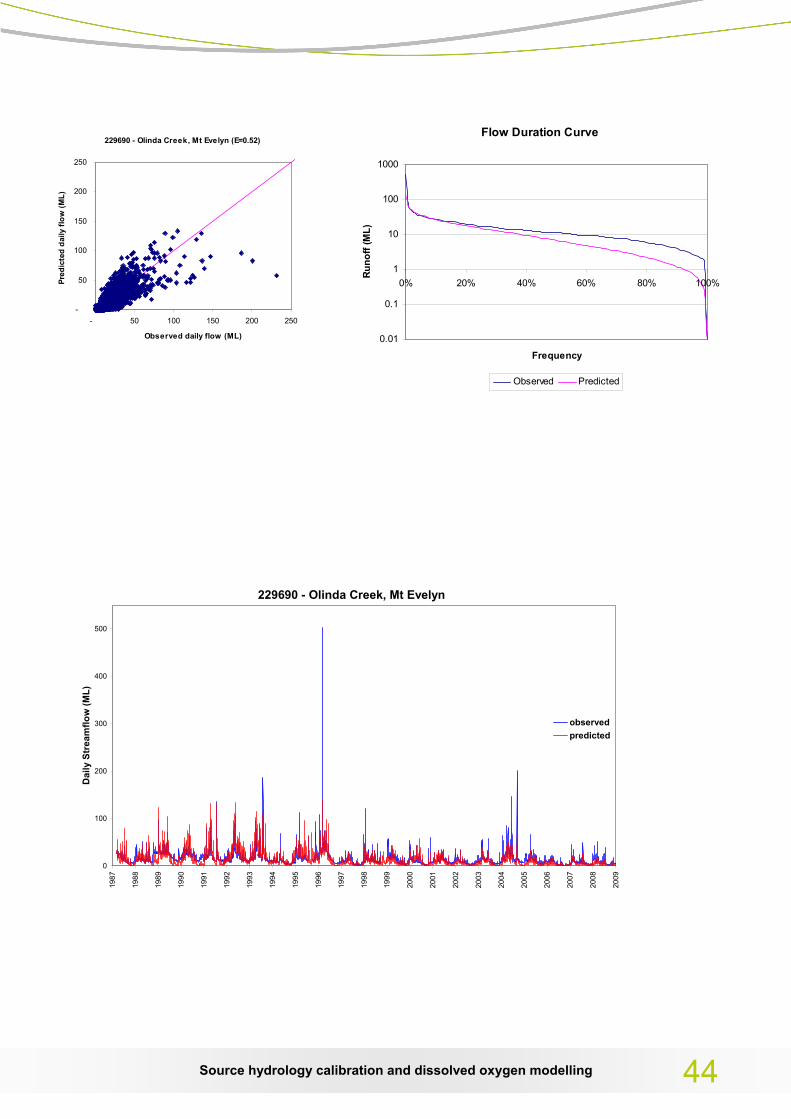
Source hydrology calibration and dissolved oxygen modelling 44
229690 - Olinda Creek, Mt Evelyn (E=0.52)
-
50
100
150
200
250
- 50 100 150 200 250
Observed daily flow (ML)
Pred
icte
d da
ily fl
ow (M
L)
Flow Duration Curve
0.01
0.1
1
10
100
1000
0% 20% 40% 60% 80% 100%
FrequencyRu
noff
(ML)
Observed Predicted
229690 - Olinda Creek, Mt Evelyn
0
100
200
300
400
500
1987
1988
1989
1990
1991
1992
1993
1994
1995
1996
1997
1998
1999
2000
2001
2002
2003
2004
2005
2006
2007
2008
2009
Dai
ly S
trea
mflo
w (M
L)
observedpredicted
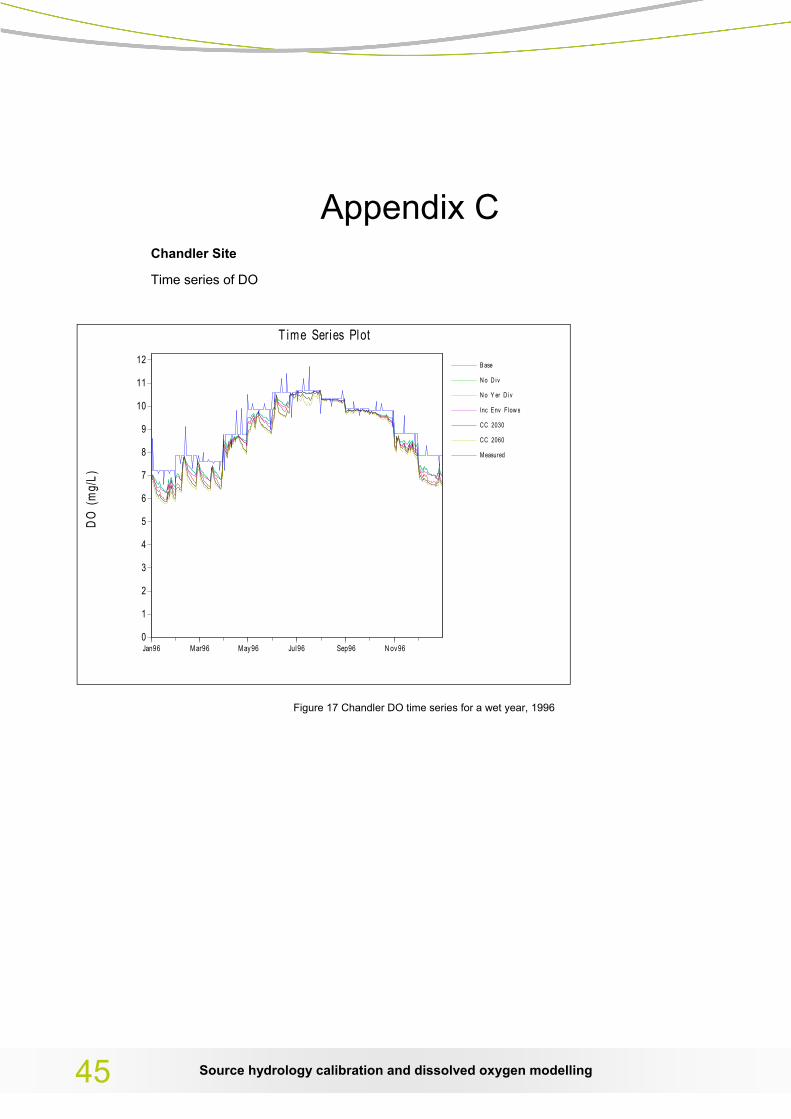
Appendix CChandler Site
Time series of DO
T ime Series Plot
DO
(m
g/L)
0
1
2
3
4
5
6
7
8
9
10
11
12
Jan96 Mar96 May96 Jul96 Sep96 N ov96
B ase
N o D iv
N o Y er D iv
I nc Env Flow s
CC 2030
CC 2060
Measured
Figure 17 Chandler DO time series for a wet year, 1996
Source hydrology calibration and dissolved oxygen modelling 45
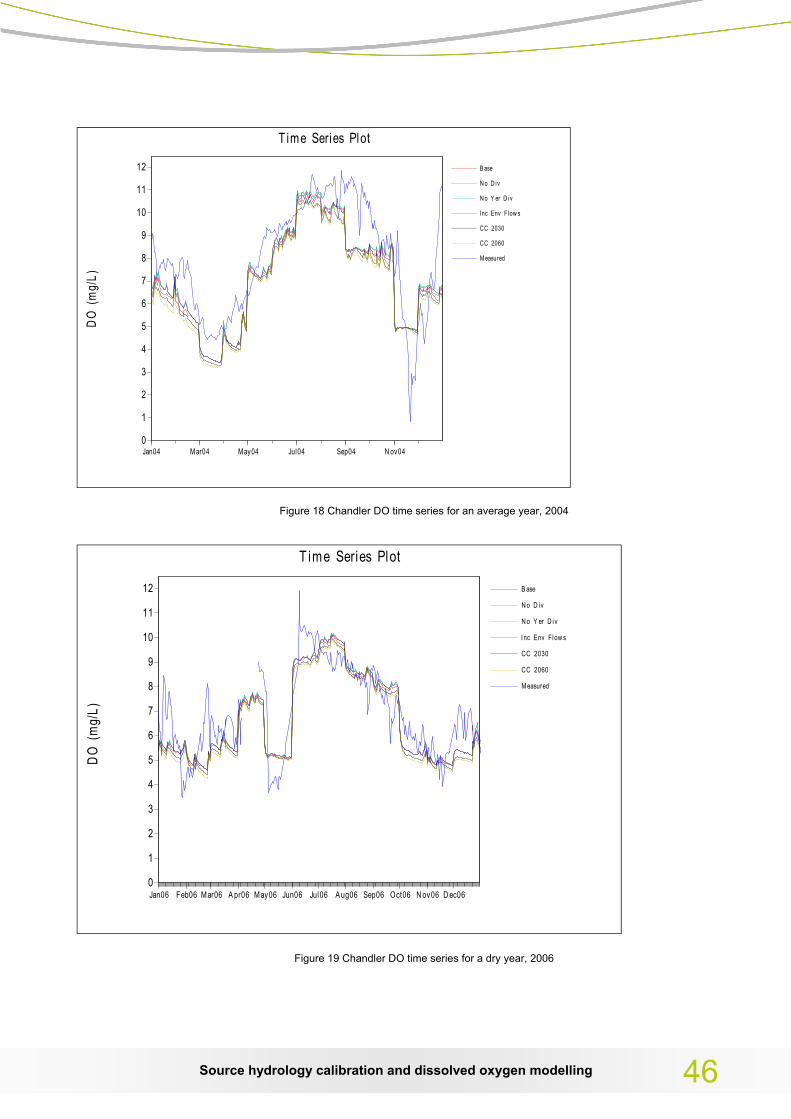
T ime Series Plot
DO
(m
g/L)
0
1
2
3
4
5
6
7
8
9
10
11
12
Jan04 Mar04 May04 Jul04 Sep04 N ov04
B ase
N o D iv
N o Y er D iv
I nc Env Flow s
CC 2030
CC 2060
Measured
Figure 18 Chandler DO time series for an average year, 2004
T ime Series Plot
DO
(m
g/L)
0
1
2
3
4
5
6
7
8
9
10
11
12
Jan06 Feb06 Mar06 A pr06 May06 Jun06 Jul06 A ug06 Sep06 Oct06 N ov06 D ec06
B ase
N o D iv
N o Y er D iv
I nc Env Flow s
CC 2030
CC 2060
Measured
Figure 19 Chandler DO time series for a dry year, 2006
Source hydrology calibration and dissolved oxygen modelling 46

DO exceedance curves
Exceedance Frequency Plot
T ime Exceeded (%)0 10 20 30 40 50 60 70 80 90 100
DO
(m
g/L)
6
7
8
9
10
11
12B ase
N o D iv
N o Y er D iv
Inc Env Flow s
CC 2030
CC 2060
Measured
Figure 20 Chandler DO exceedance plot for a wet year, 1996
Source hydrology calibration and dissolved oxygen modelling 47
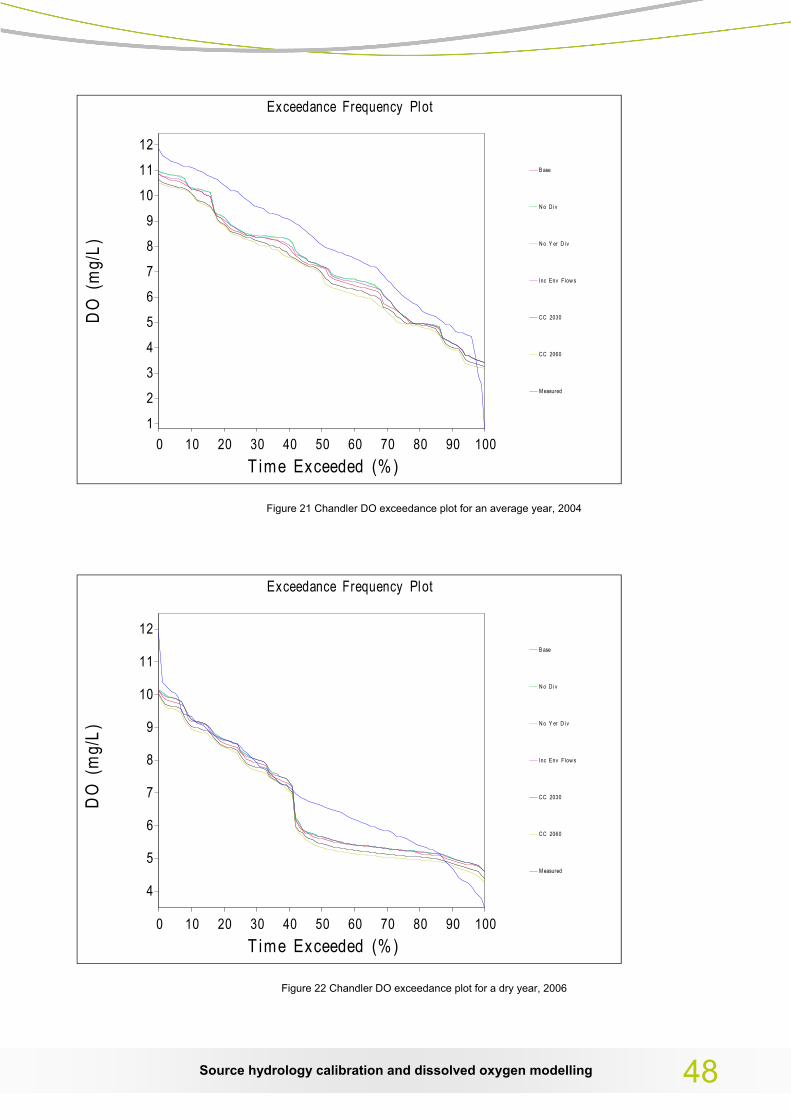
Exceedance Frequency Plot
T ime Exceeded (%)0 10 20 30 40 50 60 70 80 90 100
DO
(m
g/L)
1
2
3
4
5
6
7
8
9
10
11
12B ase
N o D iv
N o Y er D iv
Inc Env Flow s
CC 2030
CC 2060
Measured
Figure 21 Chandler DO exceedance plot for an average year, 2004
Exceedance Frequency Plot
T ime Exceeded (%)0 10 20 30 40 50 60 70 80 90 100
DO
(m
g/L)
4
5
6
7
8
9
10
11
12B ase
N o D iv
N o Y er D iv
Inc Env Flow s
CC 2030
CC 2060
Measured
Figure 22 Chandler DO exceedance plot for a dry year, 2006
Source hydrology calibration and dissolved oxygen modelling 48
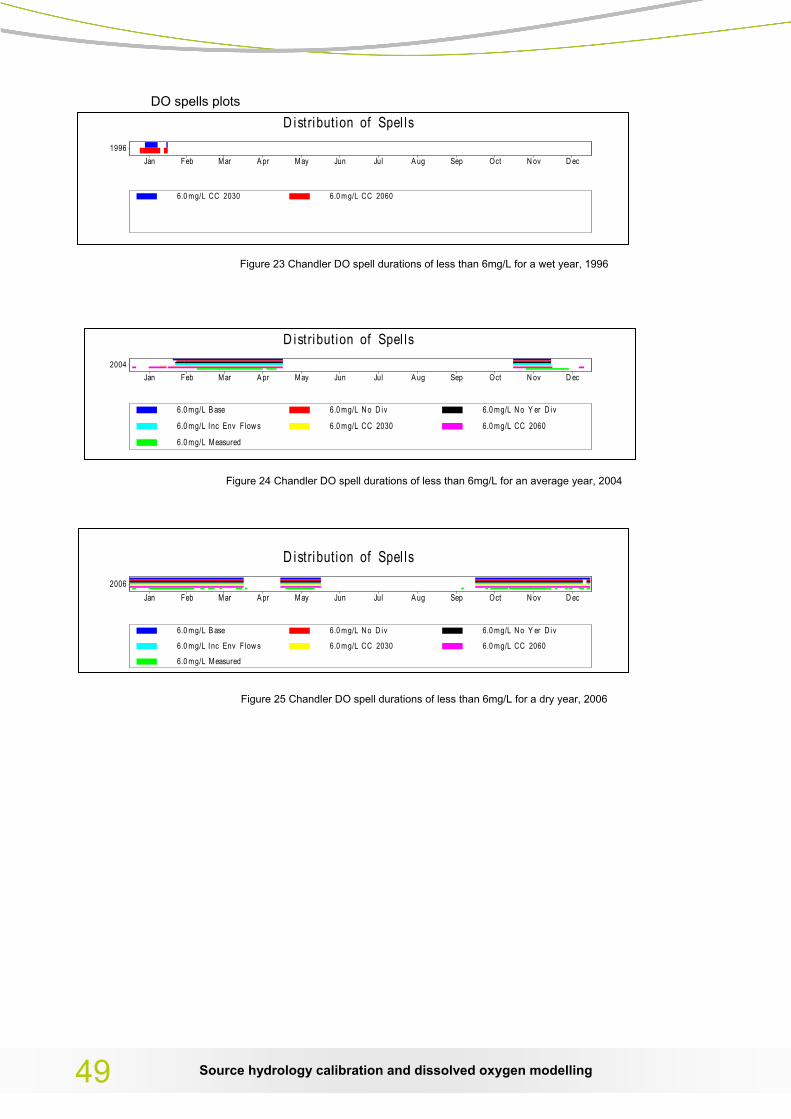
DO spells plots D istribut ion of Spel ls
Jan Feb Mar A pr May Jun Jul A ug Sep Oct N ov D ec1996
6.0 mg/L CC 2030 6.0 mg/L CC 2060
Figure 23 Chandler DO spell durations of less than 6mg/L for a wet year, 1996
D istribut ion of Spel ls
Jan Feb Mar A pr May Jun Jul A ug Sep Oct N ov D ec2004
6.0 mg/L B ase 6.0 mg/L N o D iv 6.0 mg/L N o Y er D iv
6.0 mg/L I nc Env Flow s 6.0 mg/L CC 2030 6.0 mg/L CC 2060
6.0 mg/L Measured
Figure 24 Chandler DO spell durations of less than 6mg/L for an average year, 2004
D istribut ion of Spel ls
Jan Feb Mar A pr May Jun Jul A ug Sep Oct N ov D ec2006
6.0 mg/L B ase 6.0 mg/L N o D iv 6.0 mg/L N o Y er D iv
6.0 mg/L I nc Env Flow s 6.0 mg/L CC 2030 6.0 mg/L CC 2060
6.0 mg/L Measured
Figure 25 Chandler DO spell durations of less than 6mg/L for a dry year, 2006
Source hydrology calibration and dissolved oxygen modelling 49
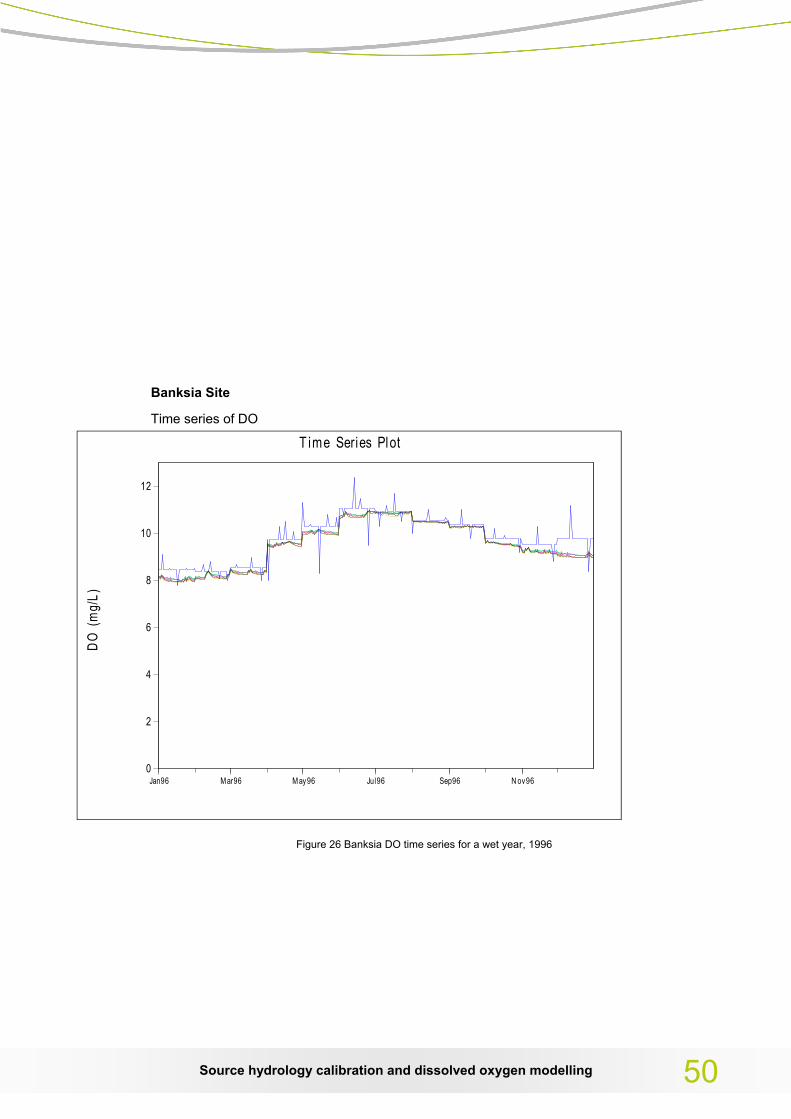
Banksia Site
Time series of DO
T ime Series Plot
DO
(m
g/L)
0
2
4
6
8
10
12
Jan96 Mar96 May96 Jul96 Sep96 N ov96
Figure 26 Banksia DO time series for a wet year, 1996
Source hydrology calibration and dissolved oxygen modelling 50
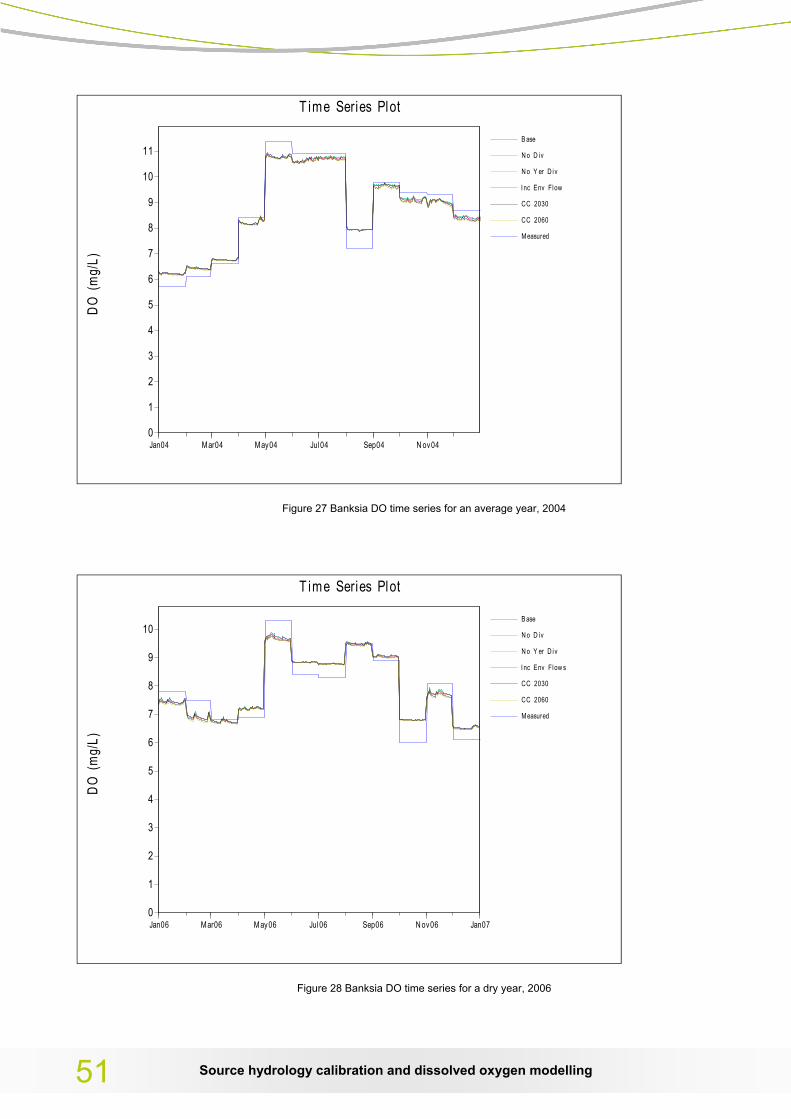
T ime Series PlotD
O (
mg/
L)
0
1
2
3
4
5
6
7
8
9
10
11
Jan04 Mar04 May04 Jul04 Sep04 N ov04
B ase
N o D iv
N o Y er D iv
I nc Env Flow
CC 2030
CC 2060
Measured
Figure 27 Banksia DO time series for an average year, 2004
T ime Series Plot
DO
(m
g/L)
0
1
2
3
4
5
6
7
8
9
10
Jan06 Mar06 May06 Jul06 Sep06 N ov06 Jan07
B ase
N o D iv
N o Y er D iv
I nc Env Flow s
CC 2030
CC 2060
Measured
Figure 28 Banksia DO time series for a dry year, 2006
Source hydrology calibration and dissolved oxygen modelling 51

DO exceedance curves
Exceedance Frequency Plot
T ime Exceeded (%)0 10 20 30 40 50 60 70 80 90 100
DO
(m
g/L)
8
8.5
9
9.5
10
10.5
11
11.5
12
12.5
13
B ase
N o D iv
N o Y er D iv
I nc Env Flow s
CC 2030
CC 2060
Measured
Figure 29 Banksia DO exceedance plot for a wet year, 1996
Exceedance Frequency Plot
T ime Exceeded (%)0 10 20 30 40 50 60 70 80 90 100
DO
(m
g/L)
66.5
77.5
88.5
99.510
10.511
11.5B ase
N o D iv
N o Y er D i v
I nc Env Flow
CC 2030
CC 2060
Measured
Figure 30 Banksia DO exceedance plot for an average year, 2004
Source hydrology calibration and dissolved oxygen modelling 52
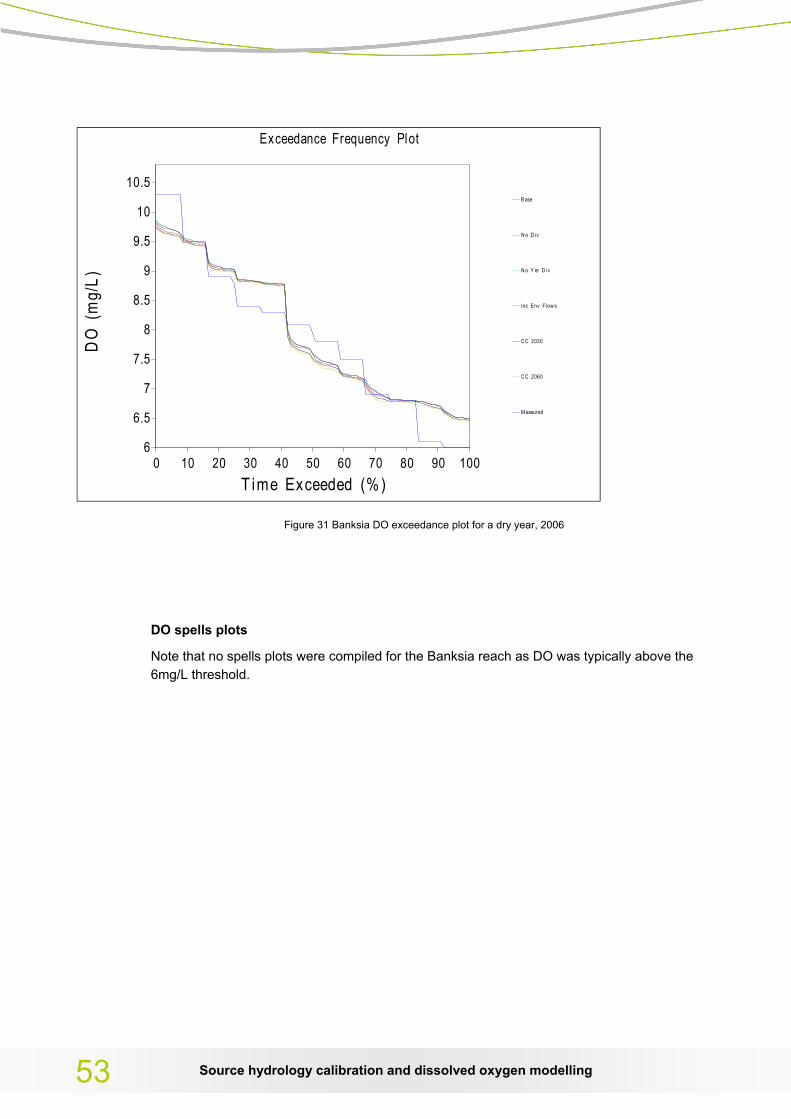
Exceedance Frequency Plot
T ime Exceeded (%)0 10 20 30 40 50 60 70 80 90 100
DO
(m
g/L)
6
6.5
7
7.5
8
8.5
9
9.5
10
10.5B ase
N o D iv
N o Y er D iv
I nc Env Flow s
CC 2030
CC 2060
Measured
Figure 31 Banksia DO exceedance plot for a dry year, 2006
DO spells plots
Note that no spells plots were compiled for the Banksia reach as DO was typically above the 6mg/L threshold.
Source hydrology calibration and dissolved oxygen modelling 53

Source hydrology calibration and dissolved oxygen modelling 54

Source hydrology calibration and dissolved oxygen modelling
55
eWater Limited ABN 47 115 422 903
UC Innovation Centre University Drive South
Bruce ACT 2617 Phone: +61 2 6201 5168 [email protected]
www.ewater.com.au
© 2012 eWater Ltd
eWater Cooperative Research Centre