
Yarn Export Watch Report - July, 2013.217.241.204
27
ISIEmergingMarketsPDF ro-kpmg6 from 62.217.241.204 on 2013-09-10 07:39:41 EDT. DownloadPDF. Downloaded by ro-kpmg6 from 62.217.241.204 at 2013-09-10 07:39:41 EDT. ISI Emerging Markets. Unauthorized Distribution Prohibited.
description
report
Transcript of Yarn Export Watch Report - July, 2013.217.241.204
ISIEmergingMarketsPDF ro-kpmg6 from 62.217.241.204 on 2013-09-10 07:39:41 EDT. DownloadPDF.
Downloaded by ro-kpmg6 from 62.217.241.204 at 2013-09-10 07:39:41 EDT. ISI Emerging Markets. Unauthorized Distribution Prohibited.
[YNFX – YARN EXPORTWATCH REPORT] A Monthly Digest on Indian Spun Yarn Exports
YnFx ‐ Yarn ExportWatch Report covers monthly analysis of the Indian spun yarn exports based on data from All ports. It covers spun yarns made of cotton, viscose, polyester, acrylic, and their blends. Volumes, value and unit price realization are the three major indicators analysed by counts and destinations.
ISIEmergingMarketsPDF ro-kpmg6 from 62.217.241.204 on 2013-09-10 07:39:41 EDT. DownloadPDF.
Downloaded by ro-kpmg6 from 62.217.241.204 at 2013-09-10 07:39:41 EDT. ISI Emerging Markets. Unauthorized Distribution Prohibited.
Yarn ExportWatch Report: June 2013 2
NOTES TO REPORT
Coverage
The report is based on data available from all 16 major ports (Air, Sea & ICDs) of India namely Bombay Air, Calcutta Sea, Cochin Sea, Delhi Air, Delhi PPG ICD, Delhi TKD ICD, Hyderabad ICD, JNPT, Ludhiana ICD, Madras Air, Madras Sea, Mundra, Pipavav, Pithampur ICD, Tuticorin Sea and Vizag Sea.
Notes to Report
While data on all spun yarns are covered in this report, detailed analysis is presented for yarns made of Cotton, Viscose, Polyester, Polyester/Cotton and Polyester/Viscose blended yarns only.
All volume units are expressed in ‘000 kg equivalent to One Metric Ton
All value units are expressed in Million US$.
Unit Price Realisation is a weighted average of FOB rate expressed in US$/kg. It includes com‐mission and interest element depending on the terms and conditions of the transaction.
Price Curve Chart plots the FOB price range on the X‐axis and volume of yarn exported on the Y‐axis for the two comparable months under review.
Confidentiality Statement
This document is confidential and has been made available to the individual to whom it is ad‐dressed to on the understanding that its content and copyrights will not be misused. Reproduc‐tion of any part of this work by any process whatsoever without written permission of YNFX.com is strictly prohibited.
Disclaimer
Information contained in this report is obtained from sources believed to be most reliable; however YNFX.com will accept no responsibility or liability for commercial decisions claimed to have been based on the content of the report.
The report contains analyzed data for the calendar month. This data is for the academic interest of the subscribers, and any commercial commitments made on this base, would be solely at the responsibility of the individual.
Copyright
No part or portion of this report should be reproduced for any purpose without prior written permission from Centerac Technologies Limited.
ISIEmergingMarketsPDF ro-kpmg6 from 62.217.241.204 on 2013-09-10 07:39:41 EDT. DownloadPDF.
Downloaded by ro-kpmg6 from 62.217.241.204 at 2013-09-10 07:39:41 EDT. ISI Emerging Markets. Unauthorized Distribution Prohibited.
Yarn ExportWatch Report: June 2013 3
CON T E N T S
Notes to Report ............................................................................................................................... 2
Executive Summary ......................................................................................................................... 5
Overall exports falls ........................................................................................................... 5
Demand for flexible labour laws ........................................................................................ 5
Hosiery makers want ban on cotton exports ..................................................................... 5
Spun Yarn Exports in June .................................................................................................. 5
Overall Trends in June 2013 ............................................................................................................ 7
Cotton Yarn ................................................................................................................................... 14
Viscose Yarn .................................................................................................................................. 17
Polyester Yarn ............................................................................................................................... 19
Poyester/cotton Blended Yarn...................................................................................................... 21
Polyester/viscose Blended Yarn .................................................................................................... 23
YNFX.COM ..................................................................................................................................... 25
ISIEmergingMarketsPDF ro-kpmg6 from 62.217.241.204 on 2013-09-10 07:39:41 EDT. DownloadPDF.
Downloaded by ro-kpmg6 from 62.217.241.204 at 2013-09-10 07:39:41 EDT. ISI Emerging Markets. Unauthorized Distribution Prohibited.
Yarn ExportWatch Report: June 2013 4
L I S T O F T A B L E S
Table 1.1. Spun Yarn Exports ‐ By Fibre Type ................................................................................. 7
Table 1.2. Spun Yarn Exports ‐ Major Destinations ........................................................................ 8
Table 1.3. Spun Yarn Exports ‐ Major Counts ................................................................................. 9
Table 1.4. Count‐wise Price Spread (Unit Realisation US$/kg) in June 2013 ................................ 10
Table 1.5. Spun Yarn Exports ‐ Country wise by Type of Fibre ('000 Kgs) in June 2013 ............... 11
Table 1.6. Speciality Yarn Exports ‐ By Type ................................................................................. 13
Table 2.1. Cotton Yarn Export: By Fibre Treatment and Coloring Category ................................. 14
Table 2.2. Yarn by Cotton Quality ................................................................................................. 14
Table 2.3. Cotton Yarn Exports ‐ Major Destinations ................................................................... 15
Table 2.4. Cotton Yarn Exports ‐ Major Counts ............................................................................ 16
Table 3.1. Viscose Yarn Exports ‐ Major Destinations .................................................................. 17
Table 3.2. Viscose Yarn Exports ‐ Major Counts ........................................................................... 18
Table 4.1. Polyester Yarn Exports ‐ Major Destinations ............................................................... 19
Table 4.2. Polyester Yarn Exports ‐ Major Counts ........................................................................ 20
Table 5.1. Polyester/Cotton Blended Yarn Exports ‐ Major Destinations .................................... 21
Table 5.2. Polyester/Cotton Blended Yarn Exports ‐ Major Counts ............................................. 22
Table 6.1. Polyester/Viscose Blended Yarn Exports ‐ Major Destinations.................................... 23
Table 6.2. Polyester/Viscose Blended Yarn Exports ‐ Major Counts ............................................ 24
ISIEmergingMarketsPDF ro-kpmg6 from 62.217.241.204 on 2013-09-10 07:39:41 EDT. DownloadPDF.
Downloaded by ro-kpmg6 from 62.217.241.204 at 2013-09-10 07:39:41 EDT. ISI Emerging Markets. Unauthorized Distribution Prohibited.
Yarn ExportWatch Report: June 2013 5
EXECUTIVE SUMMARY
OVERALL EXPORTS FALLS
India’s total exports in June, 2013 declined 4.6 per cent to US$23,786 million (Rs.138,902 crore) which was 4.56 per cent lower in US$ terms (0.53 per cent lower in Rupee terms) from US$24,923 million (Rs.139,645 crore) during June, 2012. Thus, cumulative value of exports for the period April‐June 2013‐14 was US$72,456 million (Rs.405,104 crore) as against US$73,492 million (Rs.397,884 crore) registering a fall of 1.41 per cent in US$ terms and increase of of 1.81 per cent in Rupee terms over the same period last year.
DEMAND FOR FLEXIBLE LABOUR LAWS
The textiles ministry has made a case for amending labour laws to allow women to work at night in apparel factories and provide overtime for workers to help make the sector globally competitive. According to the textiles Minister K Sambasiva Rao the sector needs flexibility in labour laws to allow overtime. Since textiles sector is seasonal, everybody has to work round the clock during a particular time of the year. Thus, there is a need to amend legislation in this regard as about 45 million workers are employed in the sector.
At a recent “High‐Level Committee on Manufacturing” meet, chaired by Prime Minister Manmohan Singh, a road map of measures was laid out to increase textile exports by 30 per‐cent, one of the steps being taken by the government to counter the declining rupee. The committee also discussed ways to boost the country's exports to over US$44 billion in 2013‐14 from about US$34 billion in the last fiscal.
India's apparel exports declined by 5 per cent in 2012‐13 due to weak demand in major markets such as the US and Europe. To reduce dependence on these markets, exporters are exploring new opportunities in Latin America, Australia and Japan.
HOSIERY MAKERS WANT BAN ON COTTON EXPORTS
The South India Hosiery Manufacturers Association (SIHMA) has urged the government to ban export of cotton in order to stabilize yarn prices. It also wants Cotton Corporation of India (CCI) to stop selling cotton online.
According to SIHMA President AC Eswaran the demand arises from the recent sharp rise in yarn and cotton prices and the ban would ensure sufficient cotton availability for domestic market for domestic consumption till start of the next cotton season in October.
CCI, SIHMA says should facilitate direct sale of cotton to domestic buyers, rather than indulging in online cotton sales. The move would ensure sufficient availability of cotton to textile mills for yarn production, and would also help in stabilizing the yarn prices. The depreciation in value of Indian rupee against US$ has led to a steep rise in cotton exports from the country in recent weeks, which has made cotton dearer in India.
SPUN YARN EXPORTS IN JUNE
In June 2013, 99 million kgs of spun yarn was exported valued at US$341 million or Rs 1,925 crore. In terms of YoY growth, volumes were up 22 per cent while US$ value increased 7.5 per cent reflecting the flat of unit price realisation since the Rupee depreciated 3.1 per cent against
ISIEmergingMarketsPDF ro-kpmg6 from 62.217.241.204 on 2013-09-10 07:39:41 EDT. DownloadPDF.
Downloaded by ro-kpmg6 from 62.217.241.204 at 2013-09-10 07:39:41 EDT. ISI Emerging Markets. Unauthorized Distribution Prohibited.
Yarn ExportWatch Report: June 2013 6
the US$ in the comparable months. Overall unit price realization averaged US$3.48 /kg was, US cents 6 lower than the realization a month ago and US cents 3 lower than last year.
Cotton yarn accounted for 87 per cent of the all spun yarn exported from India in June, while manmade fibre yarn, comprising polyester, viscose and acrylic yarns, contributed 5.7 per cent and blended spun yarn accounted for the remaining 7.3 per cent.
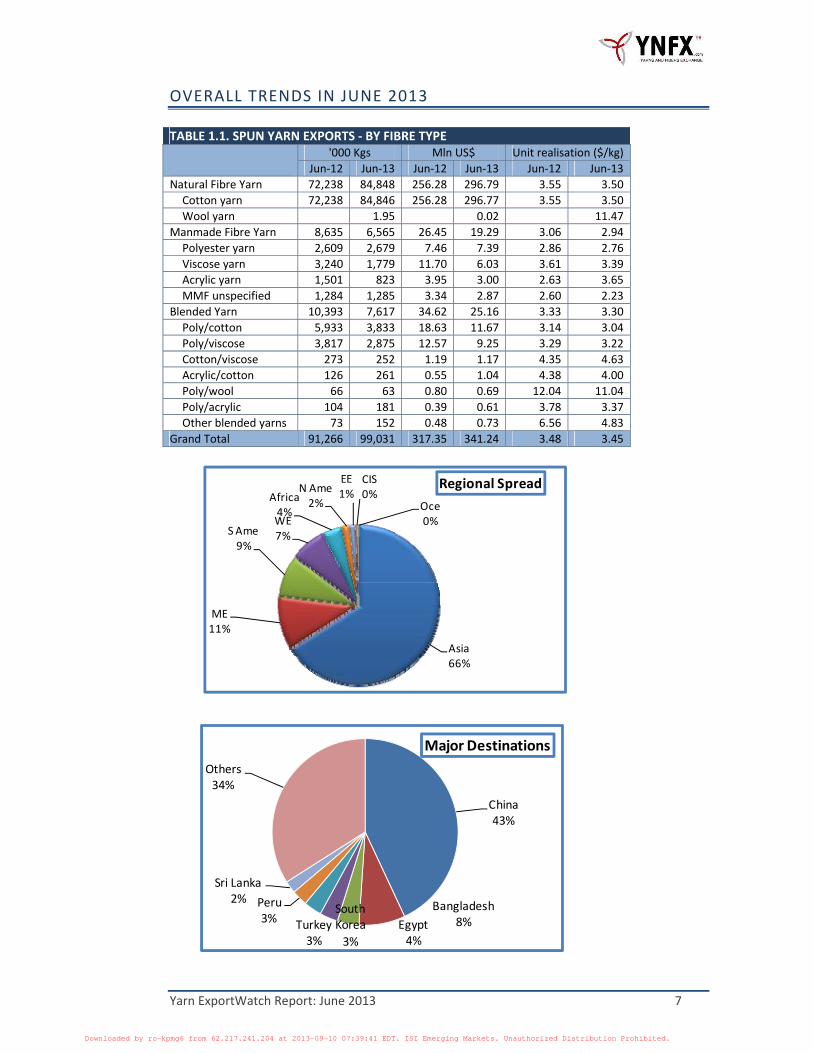
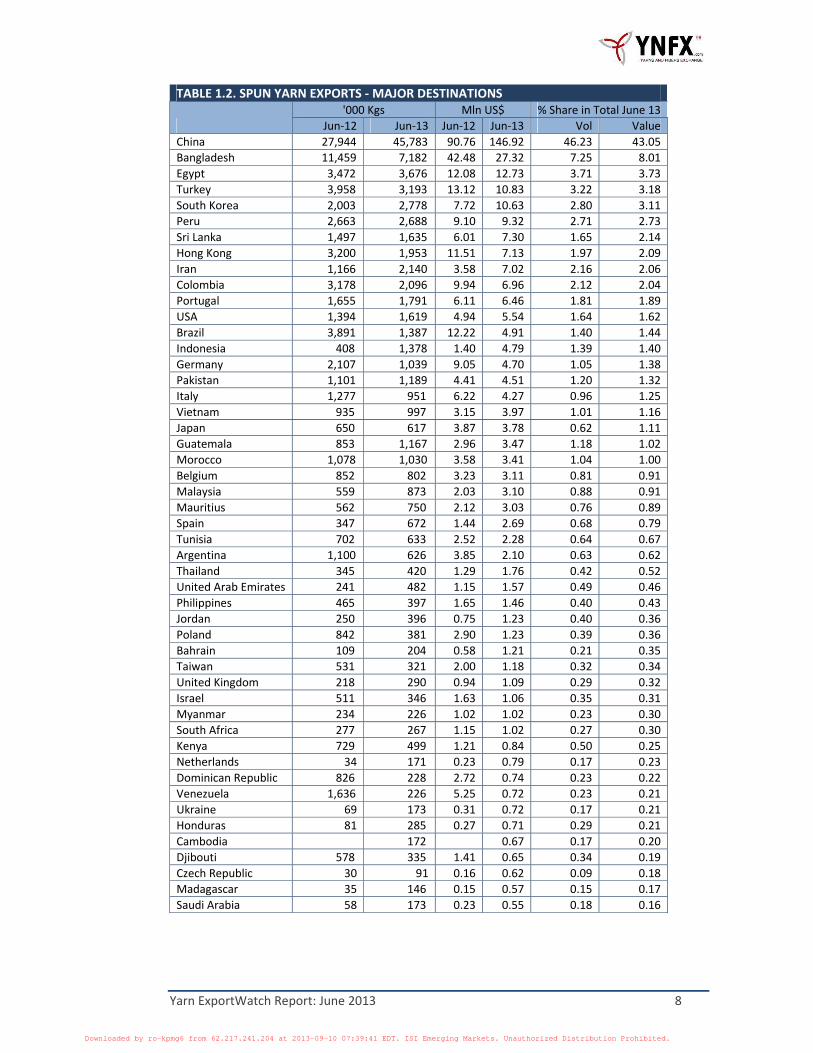
In June, spun yarns were exported to 83 countries as against 86 in June 2012. But only two countries accounted for more than 50 per cent of all spun yarn exported from India. They were China and Bangladesh.
Cotton yarn export was valued at US$297 million (Rs. 1,675 crore) implying unit price realiza‐tion of US$3.50 a kg on an average in June 2013. This was US cents 10 lower than previous month and US cents 5 down from previous year’s level. Combed cotton yarn export was at 46 million kgs accounting for 61 per cent of the all cotton yarn exported during the month in terms of value. Carded yarn export was at 27 million kgs. Their respective unit value realization was US$3.91 per kg and US$3.20 per kg. Open end yarn export was at 8.7 million kgs. Cotton yarn was exported to 72 countries in June 2013, of which, China and Bangladesh together accounted for close to 60 per cent of Indian cotton yarn exports with total volume at 52 million kgs worth US$172 million.
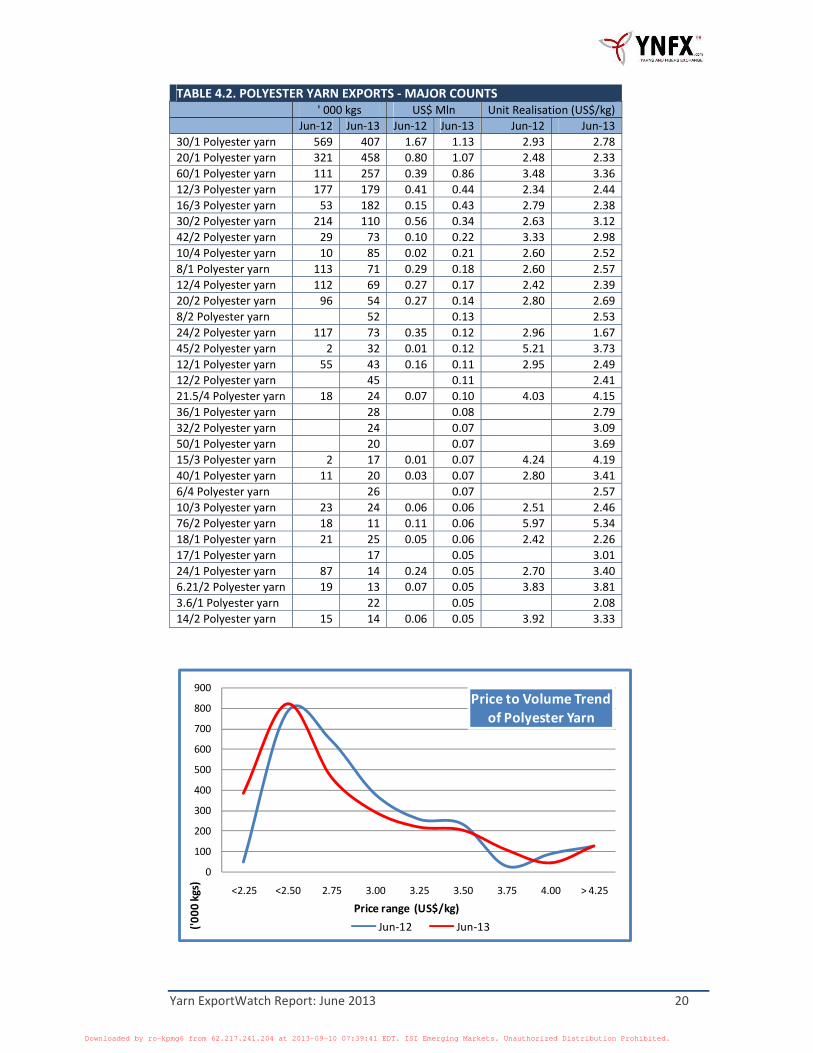
The fall in man‐made fibres prices did not help exports of their yarns in recent months. Export of spun yarns made from man‐made fibres continued to decline in June. A total of 6.56 million kgs of man‐made fibre spun yarns were exported in during the month, comprising 2.68 million kgs of polyester yarn, 1.78 million kgs of viscose yarn and 0.82 million kgs of acrylic yarn. About 1.28 million kgs of unspecified synthetic yarns were also exported. Polyester spun yarn export was valued at US$7.39 million with a unit price realization of US$2.76 on an average. Polyester spun yarn was exported to 42 countries with Turley topping the list. Viscose yarn export was valued at US$6.03 million, implying average unit price realization of US$3.39 per kg, US cent 22 lower than last year. Belgium continued to be the highest importer of Indian viscose yarn val‐ued at US$1.44 million followed by Iran with imports worth US$1.30 million. Around 20 coun‐tries imported viscose yarn from India in June 2013. Brazil, appears to have stopped importing viscose spun yarn from India. Last year, it had imported viscose spun yarn worth US$1.30 mil‐lion. Similarly, Argentina and Portugal also remained on the sidelines.
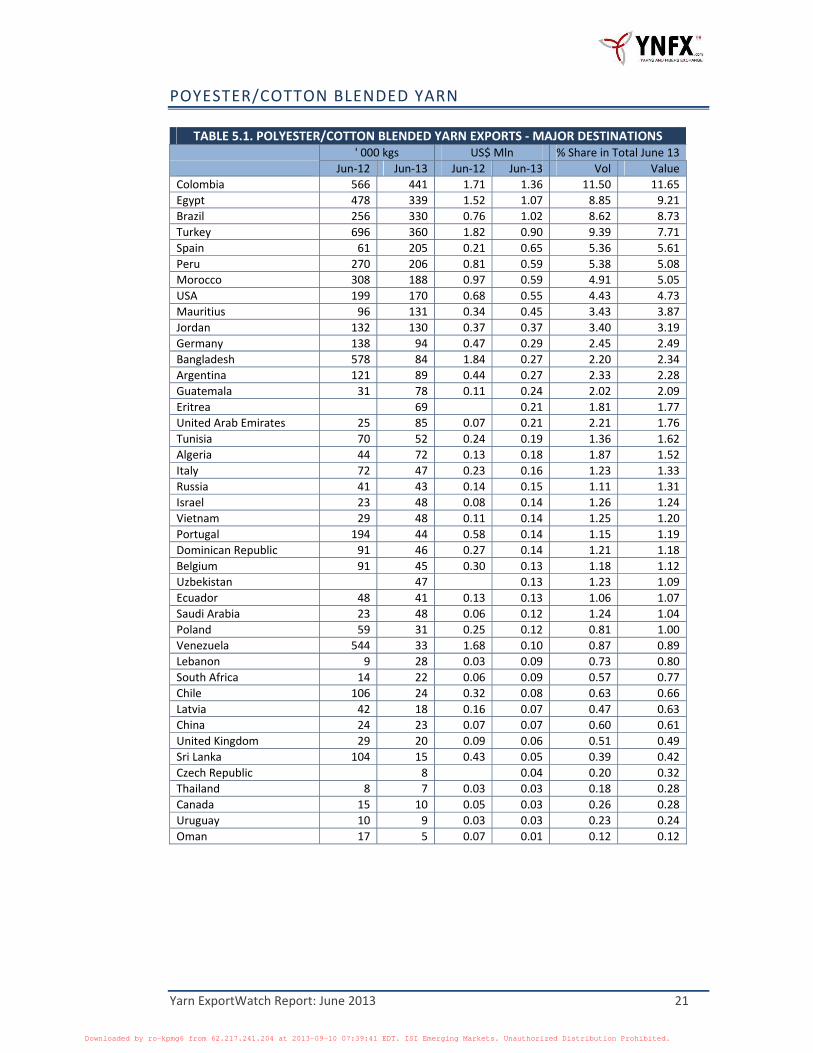
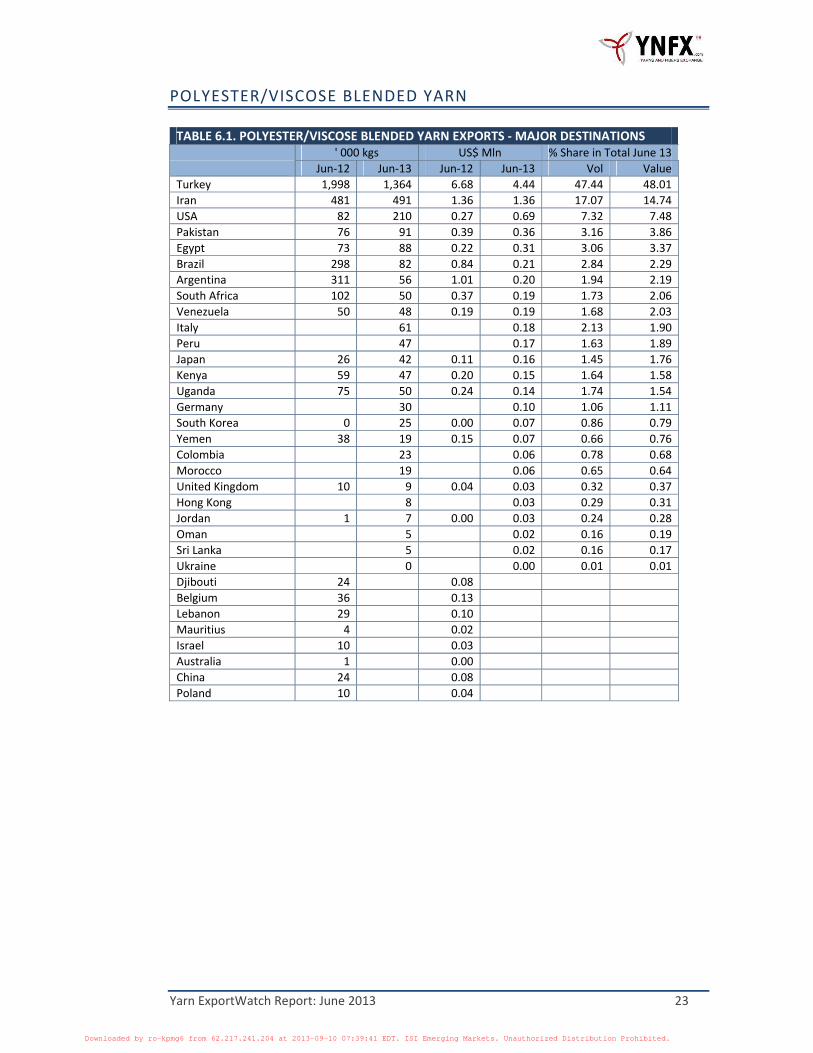
In June 2013, blended spun yarns exports aggregated 7.62 million kgs valued at US$25.16 mil‐lion. They mainly comprised 3.83 million kgs of PC yarns and 2.87 million kgs of PV yarns. While Colombia was the largest importer of PC yarn from India in June 2013, Turkey continued to be the largest importer of Indian PV yarns during the month. Cotton/viscose, acrylic/cotton, poly‐ester/wool and polyester/acrylic were the other major blended yarns exported from India in June.
ISIEmergingMarketsPDF ro-kpmg6 from 62.217.241.204 on 2013-09-10 07:39:41 EDT. DownloadPDF.
Downloaded by ro-kpmg6 from 62.217.241.204 at 2013-09-10 07:39:41 EDT. ISI Emerging Markets. Unauthorized Distribution Prohibited.
Yarn ExportWatch Report: June 2013 7
Asia66%
ME11%
S Ame9%
WE7%
Africa4%
N Ame2%
EE1%
CIS0%
Oce0%
Regional Spread
China43%
Bangladesh8%Egypt
4%Turkey3%
South Korea3%
Peru3%
Sri Lanka2%
Others34%
Major Destinations
OVERALL TRENDS IN JUNE 2013
TABLE 1.1. SPUN YARN EXPORTS ‐ BY FIBRE TYPE
'000 Kgs Mln US$ Unit realisation ($/kg)
Jun‐12 Jun‐13 Jun‐12 Jun‐13 Jun‐12 Jun‐13 Natural Fibre Yarn 72,238 84,848 256.28 296.79 3.55 3.50 Cotton yarn 72,238 84,846 256.28 296.77 3.55 3.50 Wool yarn 1.95 0.02 11.47
Manmade Fibre Yarn 8,635 6,565 26.45 19.29 3.06 2.94 Polyester yarn 2,609 2,679 7.46 7.39 2.86 2.76 Viscose yarn 3,240 1,779 11.70 6.03 3.61 3.39 Acrylic yarn 1,501 823 3.95 3.00 2.63 3.65 MMF unspecified 1,284 1,285 3.34 2.87 2.60 2.23
Blended Yarn 10,393 7,617 34.62 25.16 3.33 3.30 Poly/cotton 5,933 3,833 18.63 11.67 3.14 3.04 Poly/viscose 3,817 2,875 12.57 9.25 3.29 3.22 Cotton/viscose 273 252 1.19 1.17 4.35 4.63 Acrylic/cotton 126 261 0.55 1.04 4.38 4.00 Poly/wool 66 63 0.80 0.69 12.04 11.04 Poly/acrylic 104 181 0.39 0.61 3.78 3.37 Other blended yarns 73 152 0.48 0.73 6.56 4.83
Grand Total 91,266 99,031 317.35 341.24 3.48 3.45
ISIEmergingMarketsPDF ro-kpmg6 from 62.217.241.204 on 2013-09-10 07:39:41 EDT. DownloadPDF.
Downloaded by ro-kpmg6 from 62.217.241.204 at 2013-09-10 07:39:41 EDT. ISI Emerging Markets. Unauthorized Distribution Prohibited.
Yarn ExportWatch Report: June 2013 8
TABLE 1.2. SPUN YARN EXPORTS ‐ MAJOR DESTINATIONS
'000 Kgs Mln US$ % Share in Total June 13
Jun‐12 Jun‐13 Jun‐12 Jun‐13 Vol ValueChina 27,944 45,783 90.76 146.92 46.23 43.05Bangladesh 11,459 7,182 42.48 27.32 7.25 8.01Egypt 3,472 3,676 12.08 12.73 3.71 3.73Turkey 3,958 3,193 13.12 10.83 3.22 3.18South Korea 2,003 2,778 7.72 10.63 2.80 3.11Peru 2,663 2,688 9.10 9.32 2.71 2.73Sri Lanka 1,497 1,635 6.01 7.30 1.65 2.14Hong Kong 3,200 1,953 11.51 7.13 1.97 2.09Iran 1,166 2,140 3.58 7.02 2.16 2.06Colombia 3,178 2,096 9.94 6.96 2.12 2.04Portugal 1,655 1,791 6.11 6.46 1.81 1.89USA 1,394 1,619 4.94 5.54 1.64 1.62Brazil 3,891 1,387 12.22 4.91 1.40 1.44Indonesia 408 1,378 1.40 4.79 1.39 1.40Germany 2,107 1,039 9.05 4.70 1.05 1.38Pakistan 1,101 1,189 4.41 4.51 1.20 1.32Italy 1,277 951 6.22 4.27 0.96 1.25Vietnam 935 997 3.15 3.97 1.01 1.16Japan 650 617 3.87 3.78 0.62 1.11Guatemala 853 1,167 2.96 3.47 1.18 1.02Morocco 1,078 1,030 3.58 3.41 1.04 1.00Belgium 852 802 3.23 3.11 0.81 0.91Malaysia 559 873 2.03 3.10 0.88 0.91Mauritius 562 750 2.12 3.03 0.76 0.89Spain 347 672 1.44 2.69 0.68 0.79Tunisia 702 633 2.52 2.28 0.64 0.67Argentina 1,100 626 3.85 2.10 0.63 0.62Thailand 345 420 1.29 1.76 0.42 0.52United Arab Emirates 241 482 1.15 1.57 0.49 0.46Philippines 465 397 1.65 1.46 0.40 0.43Jordan 250 396 0.75 1.23 0.40 0.36Poland 842 381 2.90 1.23 0.39 0.36Bahrain 109 204 0.58 1.21 0.21 0.35Taiwan 531 321 2.00 1.18 0.32 0.34United Kingdom 218 290 0.94 1.09 0.29 0.32Israel 511 346 1.63 1.06 0.35 0.31Myanmar 234 226 1.02 1.02 0.23 0.30South Africa 277 267 1.15 1.02 0.27 0.30Kenya 729 499 1.21 0.84 0.50 0.25Netherlands 34 171 0.23 0.79 0.17 0.23Dominican Republic 826 228 2.72 0.74 0.23 0.22Venezuela 1,636 226 5.25 0.72 0.23 0.21Ukraine 69 173 0.31 0.72 0.17 0.21Honduras 81 285 0.27 0.71 0.29 0.21Cambodia 172 0.67 0.17 0.20Djibouti 578 335 1.41 0.65 0.34 0.19Czech Republic 30 91 0.16 0.62 0.09 0.18Madagascar 35 146 0.15 0.57 0.15 0.17Saudi Arabia 58 173 0.23 0.55 0.18 0.16
ISIEmergingMarketsPDF ro-kpmg6 from 62.217.241.204 on 2013-09-10 07:39:41 EDT. DownloadPDF.
Downloaded by ro-kpmg6 from 62.217.241.204 at 2013-09-10 07:39:41 EDT. ISI Emerging Markets. Unauthorized Distribution Prohibited.
Yarn ExportWatch Report: June 2013 9
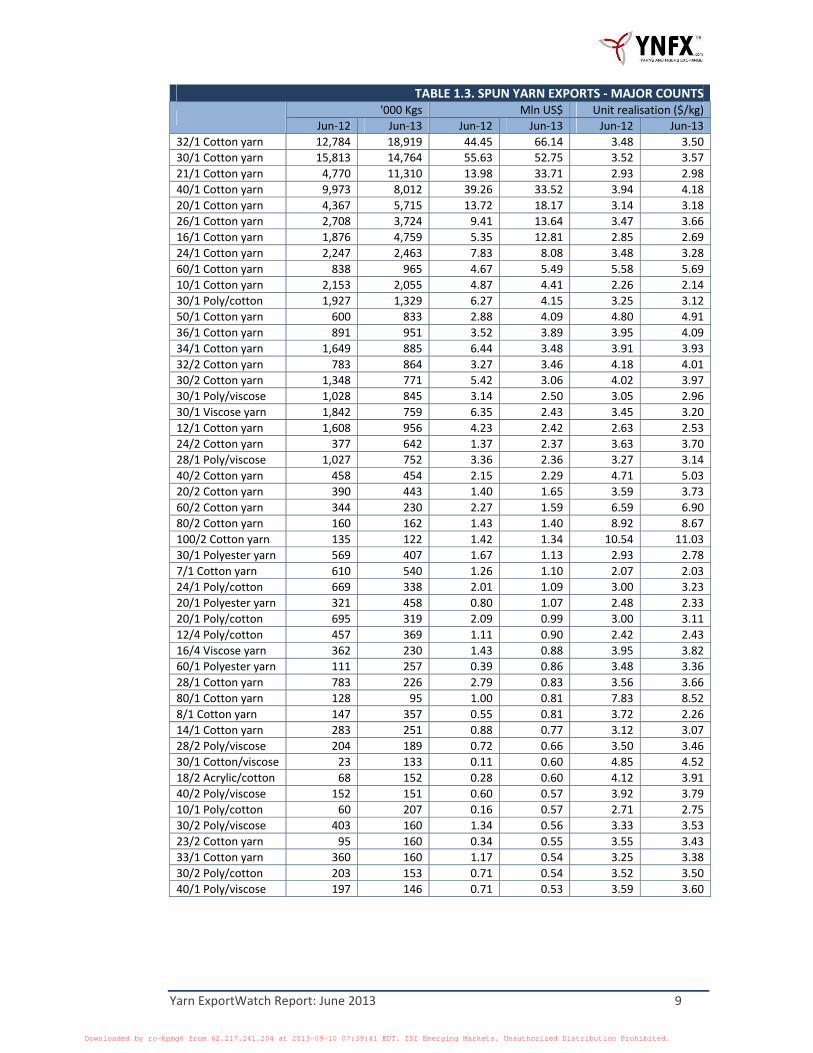
TABLE 1.3. SPUN YARN EXPORTS ‐ MAJOR COUNTS
'000 Kgs Mln US$ Unit realisation ($/kg)
Jun‐12 Jun‐13 Jun‐12 Jun‐13 Jun‐12 Jun‐1332/1 Cotton yarn 12,784 18,919 44.45 66.14 3.48 3.50 30/1 Cotton yarn 15,813 14,764 55.63 52.75 3.52 3.57 21/1 Cotton yarn 4,770 11,310 13.98 33.71 2.93 2.98 40/1 Cotton yarn 9,973 8,012 39.26 33.52 3.94 4.18 20/1 Cotton yarn 4,367 5,715 13.72 18.17 3.14 3.18 26/1 Cotton yarn 2,708 3,724 9.41 13.64 3.47 3.66 16/1 Cotton yarn 1,876 4,759 5.35 12.81 2.85 2.69 24/1 Cotton yarn 2,247 2,463 7.83 8.08 3.48 3.28 60/1 Cotton yarn 838 965 4.67 5.49 5.58 5.69 10/1 Cotton yarn 2,153 2,055 4.87 4.41 2.26 2.14 30/1 Poly/cotton 1,927 1,329 6.27 4.15 3.25 3.12 50/1 Cotton yarn 600 833 2.88 4.09 4.80 4.91 36/1 Cotton yarn 891 951 3.52 3.89 3.95 4.09 34/1 Cotton yarn 1,649 885 6.44 3.48 3.91 3.93 32/2 Cotton yarn 783 864 3.27 3.46 4.18 4.01 30/2 Cotton yarn 1,348 771 5.42 3.06 4.02 3.97 30/1 Poly/viscose 1,028 845 3.14 2.50 3.05 2.96 30/1 Viscose yarn 1,842 759 6.35 2.43 3.45 3.20 12/1 Cotton yarn 1,608 956 4.23 2.42 2.63 2.53 24/2 Cotton yarn 377 642 1.37 2.37 3.63 3.70 28/1 Poly/viscose 1,027 752 3.36 2.36 3.27 3.14 40/2 Cotton yarn 458 454 2.15 2.29 4.71 5.03 20/2 Cotton yarn 390 443 1.40 1.65 3.59 3.73 60/2 Cotton yarn 344 230 2.27 1.59 6.59 6.90 80/2 Cotton yarn 160 162 1.43 1.40 8.92 8.67 100/2 Cotton yarn 135 122 1.42 1.34 10.54 11.03 30/1 Polyester yarn 569 407 1.67 1.13 2.93 2.78 7/1 Cotton yarn 610 540 1.26 1.10 2.07 2.03 24/1 Poly/cotton 669 338 2.01 1.09 3.00 3.23 20/1 Polyester yarn 321 458 0.80 1.07 2.48 2.33 20/1 Poly/cotton 695 319 2.09 0.99 3.00 3.11 12/4 Poly/cotton 457 369 1.11 0.90 2.42 2.43 16/4 Viscose yarn 362 230 1.43 0.88 3.95 3.82 60/1 Polyester yarn 111 257 0.39 0.86 3.48 3.36 28/1 Cotton yarn 783 226 2.79 0.83 3.56 3.66 80/1 Cotton yarn 128 95 1.00 0.81 7.83 8.52 8/1 Cotton yarn 147 357 0.55 0.81 3.72 2.26 14/1 Cotton yarn 283 251 0.88 0.77 3.12 3.07 28/2 Poly/viscose 204 189 0.72 0.66 3.50 3.46 30/1 Cotton/viscose 23 133 0.11 0.60 4.85 4.52 18/2 Acrylic/cotton 68 152 0.28 0.60 4.12 3.91 40/2 Poly/viscose 152 151 0.60 0.57 3.92 3.79 10/1 Poly/cotton 60 207 0.16 0.57 2.71 2.75 30/2 Poly/viscose 403 160 1.34 0.56 3.33 3.53 23/2 Cotton yarn 95 160 0.34 0.55 3.55 3.43 33/1 Cotton yarn 360 160 1.17 0.54 3.25 3.38 30/2 Poly/cotton 203 153 0.71 0.54 3.52 3.50 40/1 Poly/viscose 197 146 0.71 0.53 3.59 3.60
ISIEmergingMarketsPDF ro-kpmg6 from 62.217.241.204 on 2013-09-10 07:39:41 EDT. DownloadPDF.
Downloaded by ro-kpmg6 from 62.217.241.204 at 2013-09-10 07:39:41 EDT. ISI Emerging Markets. Unauthorized Distribution Prohibited.
Yarn ExportWatch Report: June 2013 10
0.00
1.00
2.00
3.00
4.00
5.00
Cot Poly Vis Acry PC PV CV
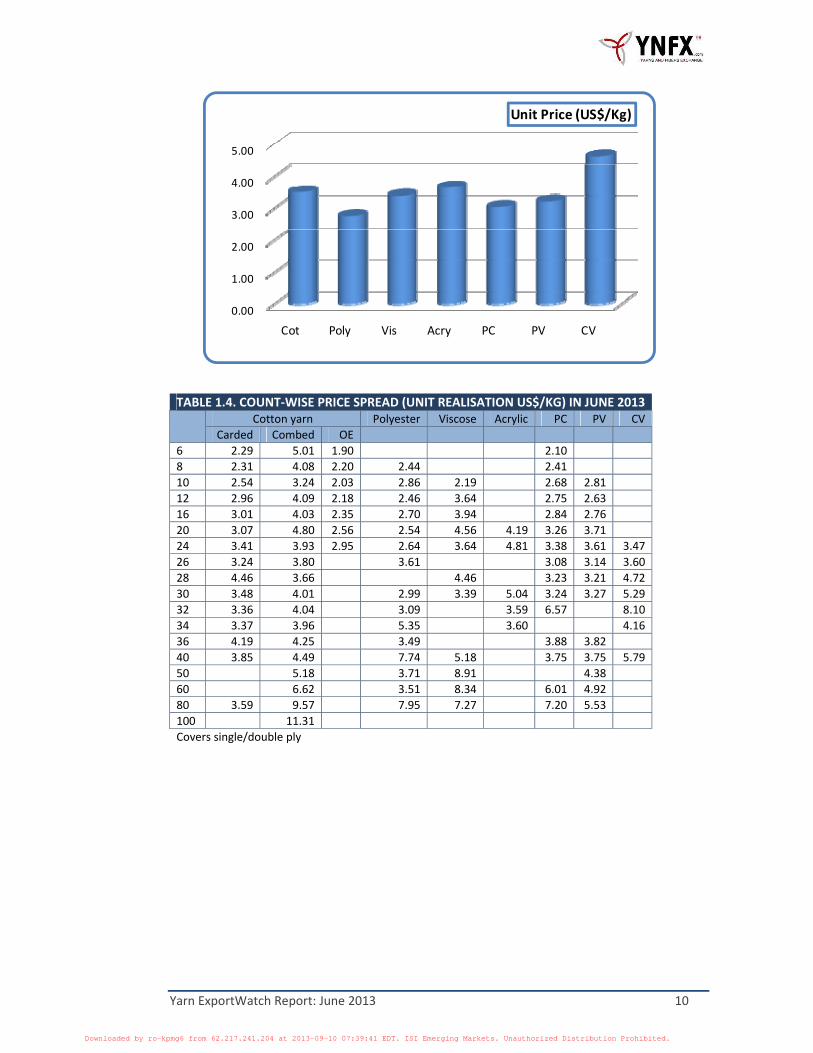
Unit Price (US$/Kg)
TABLE 1.4. COUNT‐WISE PRICE SPREAD (UNIT REALISATION US$/KG) IN JUNE 2013
Cotton yarn Polyester Viscose Acrylic PC PV CV
Carded Combed OE6 2.29 5.01 1.90 2.108 2.31 4.08 2.20 2.44 2.4110 2.54 3.24 2.03 2.86 2.19 2.68 2.81 12 2.96 4.09 2.18 2.46 3.64 2.75 2.63 16 3.01 4.03 2.35 2.70 3.94 2.84 2.76 20 3.07 4.80 2.56 2.54 4.56 4.19 3.26 3.71 24 3.41 3.93 2.95 2.64 3.64 4.81 3.38 3.61 3.47 26 3.24 3.80 3.61 3.08 3.14 3.60 28 4.46 3.66 4.46 3.23 3.21 4.72 30 3.48 4.01 2.99 3.39 5.04 3.24 3.27 5.29 32 3.36 4.04 3.09 3.59 6.57 8.10 34 3.37 3.96 5.35 3.60 4.16 36 4.19 4.25 3.49 3.88 3.82 40 3.85 4.49 7.74 5.18 3.75 3.75 5.79 50 5.18 3.71 8.91 4.38 60 6.62 3.51 8.34 6.01 4.92 80 3.59 9.57 7.95 7.27 7.20 5.53 100 11.31 Covers single/double ply
ISIEmergingMarketsPDF ro-kpmg6 from 62.217.241.204 on 2013-09-10 07:39:41 EDT. DownloadPDF.
Downloaded by ro-kpmg6 from 62.217.241.204 at 2013-09-10 07:39:41 EDT. ISI Emerging Markets. Unauthorized Distribution Prohibited.
Yarn ExportWatch Report: June 2013 11
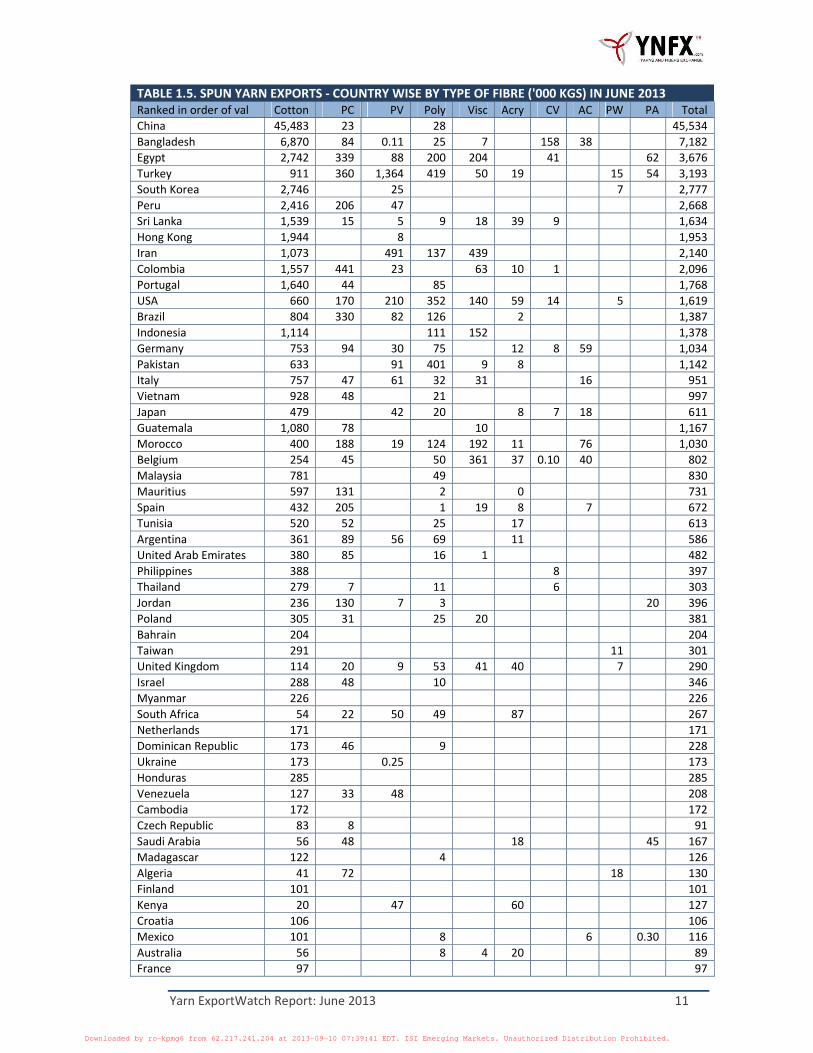
TABLE 1.5. SPUN YARN EXPORTS ‐ COUNTRY WISE BY TYPE OF FIBRE ('000 KGS) IN JUNE 2013 Ranked in order of val Cotton PC PV Poly Visc Acry CV AC PW PA TotalChina 45,483 23 28 45,534Bangladesh 6,870 84 0.11 25 7 158 38 7,182Egypt 2,742 339 88 200 204 41 62 3,676Turkey 911 360 1,364 419 50 19 15 54 3,193South Korea 2,746 25 7 2,777Peru 2,416 206 47 2,668Sri Lanka 1,539 15 5 9 18 39 9 1,634Hong Kong 1,944 8 1,953Iran 1,073 491 137 439 2,140Colombia 1,557 441 23 63 10 1 2,096Portugal 1,640 44 85 1,768USA 660 170 210 352 140 59 14 5 1,619Brazil 804 330 82 126 2 1,387Indonesia 1,114 111 152 1,378Germany 753 94 30 75 12 8 59 1,034Pakistan 633 91 401 9 8 1,142Italy 757 47 61 32 31 16 951Vietnam 928 48 21 997Japan 479 42 20 8 7 18 611Guatemala 1,080 78 10 1,167Morocco 400 188 19 124 192 11 76 1,030Belgium 254 45 50 361 37 0.10 40 802Malaysia 781 49 830Mauritius 597 131 2 0 731Spain 432 205 1 19 8 7 672Tunisia 520 52 25 17 613Argentina 361 89 56 69 11 586United Arab Emirates 380 85 16 1 482Philippines 388 8 397Thailand 279 7 11 6 303Jordan 236 130 7 3 20 396Poland 305 31 25 20 381Bahrain 204 204Taiwan 291 11 301United Kingdom 114 20 9 53 41 40 7 290Israel 288 48 10 346Myanmar 226 226South Africa 54 22 50 49 87 267Netherlands 171 171Dominican Republic 173 46 9 228Ukraine 173 0.25 173Honduras 285 285Venezuela 127 33 48 208Cambodia 172 172Czech Republic 83 8 91Saudi Arabia 56 48 18 45 167Madagascar 122 4 126Algeria 41 72 18 130Finland 101 101Kenya 20 47 60 127Croatia 106 106Mexico 101 8 6 0.30 116Australia 56 8 4 20 89France 97 97
ISIEmergingMarketsPDF ro-kpmg6 from 62.217.241.204 on 2013-09-10 07:39:41 EDT. DownloadPDF.
Downloaded by ro-kpmg6 from 62.217.241.204 at 2013-09-10 07:39:41 EDT. ISI Emerging Markets. Unauthorized Distribution Prohibited.
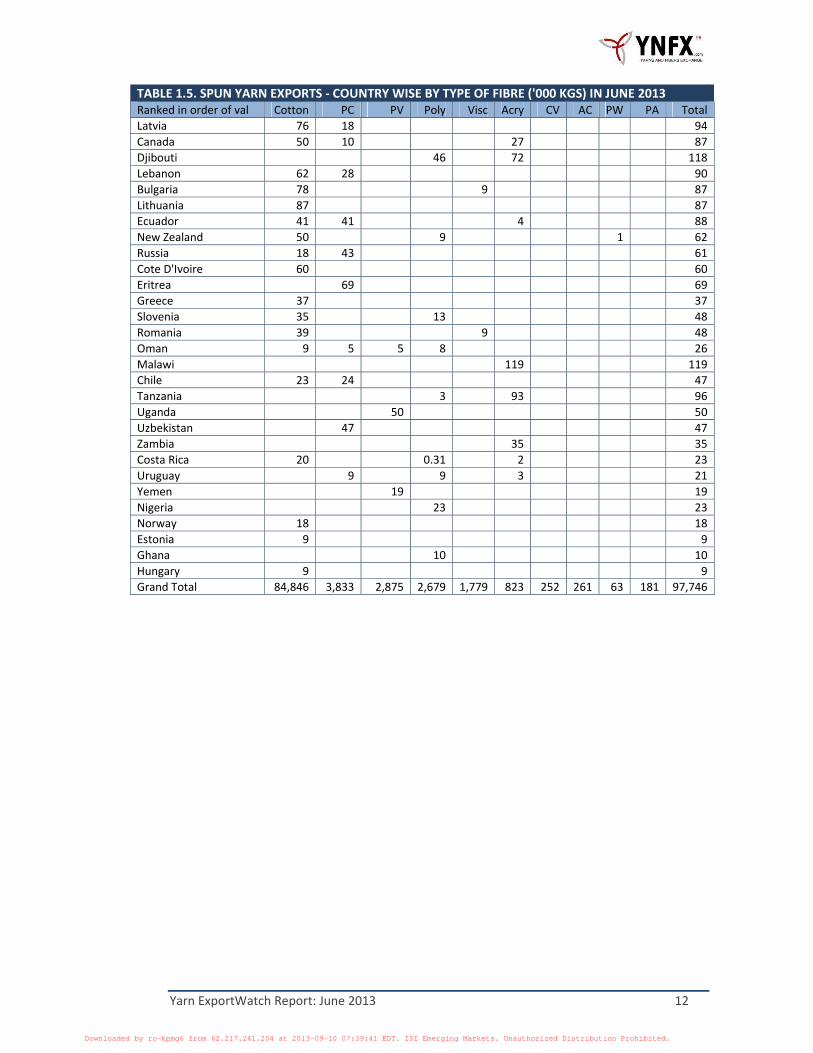
Yarn ExportWatch Report: June 2013 12
TABLE 1.5. SPUN YARN EXPORTS ‐ COUNTRY WISE BY TYPE OF FIBRE ('000 KGS) IN JUNE 2013 Ranked in order of val Cotton PC PV Poly Visc Acry CV AC PW PA TotalLatvia 76 18 94Canada 50 10 27 87Djibouti 46 72 118Lebanon 62 28 90Bulgaria 78 9 87Lithuania 87 87Ecuador 41 41 4 88New Zealand 50 9 1 62Russia 18 43 61Cote D'Ivoire 60 60Eritrea 69 69Greece 37 37Slovenia 35 13 48Romania 39 9 48Oman 9 5 5 8 26Malawi 119 119Chile 23 24 47Tanzania 3 93 96Uganda 50 50Uzbekistan 47 47Zambia 35 35Costa Rica 20 0.31 2 23Uruguay 9 9 3 21Yemen 19 19Nigeria 23 23Norway 18 18Estonia 9 9Ghana 10 10Hungary 9 9Grand Total 84,846 3,833 2,875 2,679 1,779 823 252 261 63 181 97,746
ISIEmergingMarketsPDF ro-kpmg6 from 62.217.241.204 on 2013-09-10 07:39:41 EDT. DownloadPDF.
Downloaded by ro-kpmg6 from 62.217.241.204 at 2013-09-10 07:39:41 EDT. ISI Emerging Markets. Unauthorized Distribution Prohibited.
Yarn ExportWatch Report: June 2013 13
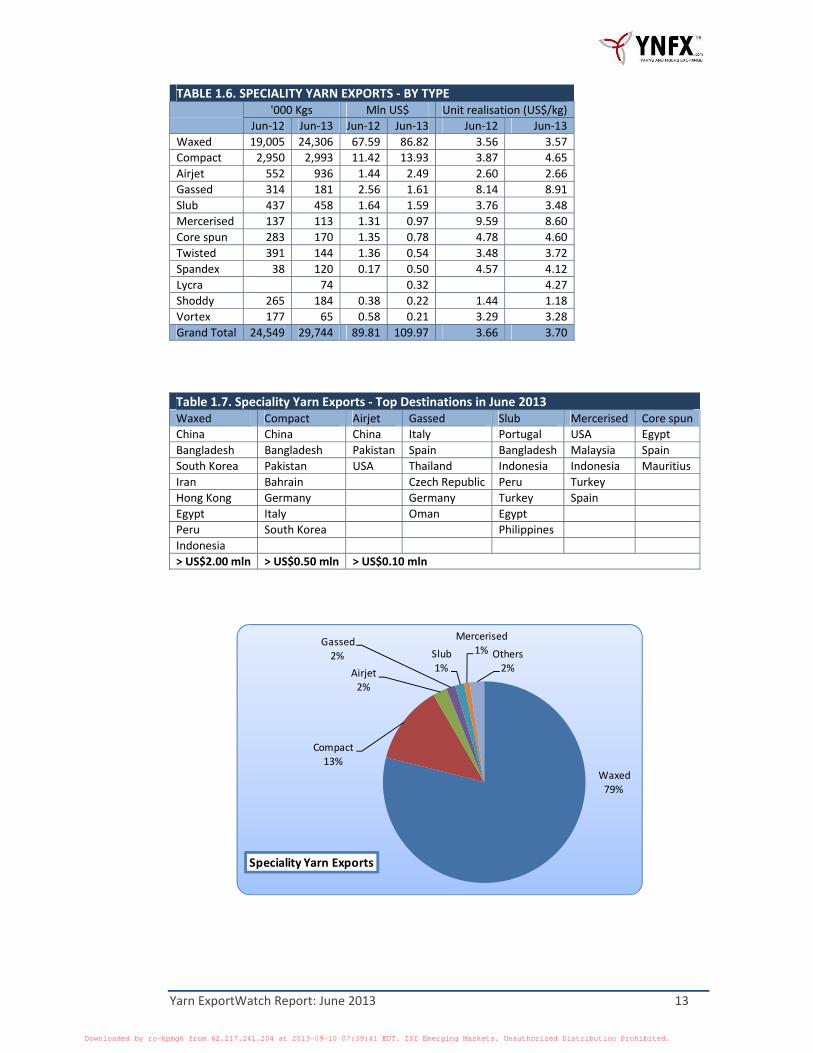
Waxed79%
Compact13%
Airjet2%
Gassed2% Slub
1%
Mercerised1% Others
2%
Speciality Yarn Exports
TABLE 1.6. SPECIALITY YARN EXPORTS ‐ BY TYPE '000 Kgs Mln US$ Unit realisation (US$/kg)
Jun‐12 Jun‐13 Jun‐12 Jun‐13 Jun‐12 Jun‐13Waxed 19,005 24,306 67.59 86.82 3.56 3.57Compact 2,950 2,993 11.42 13.93 3.87 4.65Airjet 552 936 1.44 2.49 2.60 2.66Gassed 314 181 2.56 1.61 8.14 8.91Slub 437 458 1.64 1.59 3.76 3.48Mercerised 137 113 1.31 0.97 9.59 8.60Core spun 283 170 1.35 0.78 4.78 4.60Twisted 391 144 1.36 0.54 3.48 3.72Spandex 38 120 0.17 0.50 4.57 4.12Lycra 74 0.32 4.27Shoddy 265 184 0.38 0.22 1.44 1.18Vortex 177 65 0.58 0.21 3.29 3.28Grand Total 24,549 29,744 89.81 109.97 3.66 3.70
Table 1.7. Speciality Yarn Exports ‐ Top Destinations in June 2013 Waxed Compact Airjet Gassed Slub Mercerised Core spunChina China China Italy Portugal USA EgyptBangladesh Bangladesh Pakistan Spain Bangladesh Malaysia SpainSouth Korea Pakistan USA Thailand Indonesia Indonesia MauritiusIran Bahrain Czech Republic Peru Turkey Hong Kong Germany Germany Turkey Spain Egypt Italy Oman EgyptPeru South Korea PhilippinesIndonesia > US$2.00 mln > US$0.50 mln > US$0.10 mln
ISIEmergingMarketsPDF ro-kpmg6 from 62.217.241.204 on 2013-09-10 07:39:41 EDT. DownloadPDF.
Downloaded by ro-kpmg6 from 62.217.241.204 at 2013-09-10 07:39:41 EDT. ISI Emerging Markets. Unauthorized Distribution Prohibited.
Yarn ExportWatch Report: June 2013 14
COTTON YARN
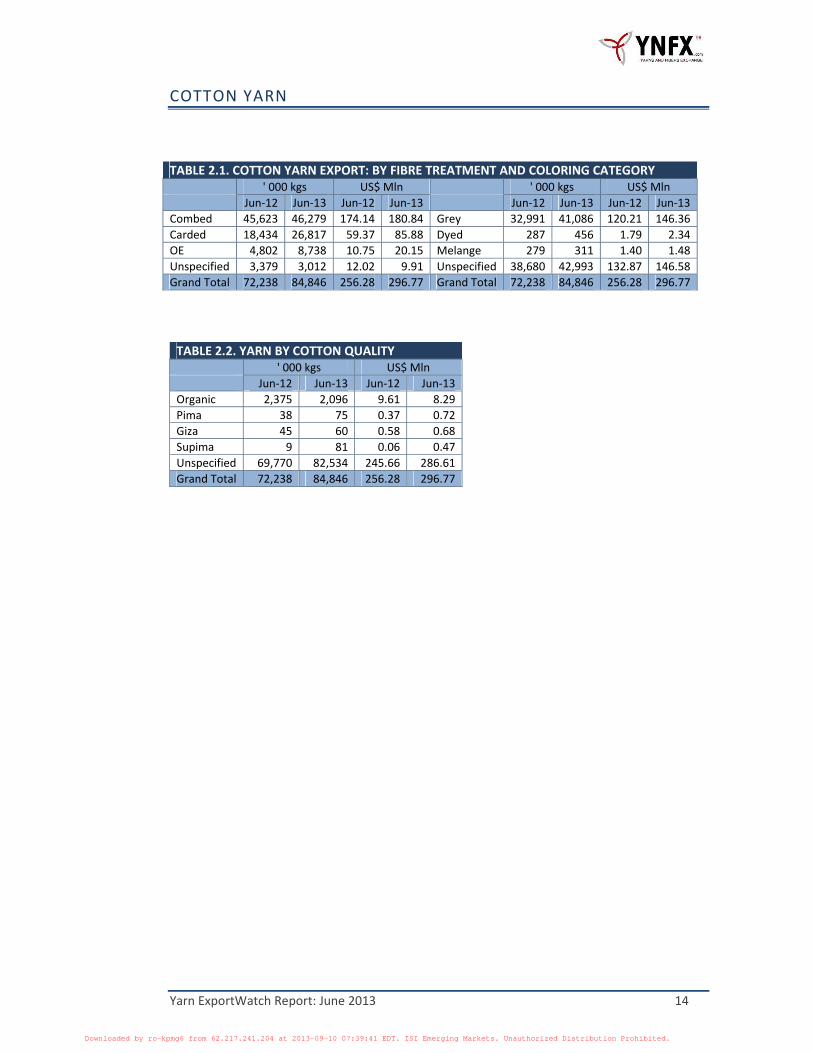
TABLE 2.1. COTTON YARN EXPORT: BY FIBRE TREATMENT AND COLORING CATEGORY ' 000 kgs US$ Mln ' 000 kgs US$ Mln
Jun‐12 Jun‐13 Jun‐12 Jun‐13 Jun‐12 Jun‐13 Jun‐12 Jun‐13Combed 45,623 46,279 174.14 180.84 Grey 32,991 41,086 120.21 146.36Carded 18,434 26,817 59.37 85.88 Dyed 287 456 1.79 2.34OE 4,802 8,738 10.75 20.15 Melange 279 311 1.40 1.48Unspecified 3,379 3,012 12.02 9.91 Unspecified 38,680 42,993 132.87 146.58Grand Total 72,238 84,846 256.28 296.77 Grand Total 72,238 84,846 256.28 296.77
TABLE 2.2. YARN BY COTTON QUALITY ' 000 kgs US$ Mln
Jun‐12 Jun‐13 Jun‐12 Jun‐13Organic 2,375 2,096 9.61 8.29Pima 38 75 0.37 0.72Giza 45 60 0.58 0.68Supima 9 81 0.06 0.47Unspecified 69,770 82,534 245.66 286.61Grand Total 72,238 84,846 256.28 296.77
ISIEmergingMarketsPDF ro-kpmg6 from 62.217.241.204 on 2013-09-10 07:39:41 EDT. DownloadPDF.
Downloaded by ro-kpmg6 from 62.217.241.204 at 2013-09-10 07:39:41 EDT. ISI Emerging Markets. Unauthorized Distribution Prohibited.
Yarn ExportWatch Report: June 2013 15
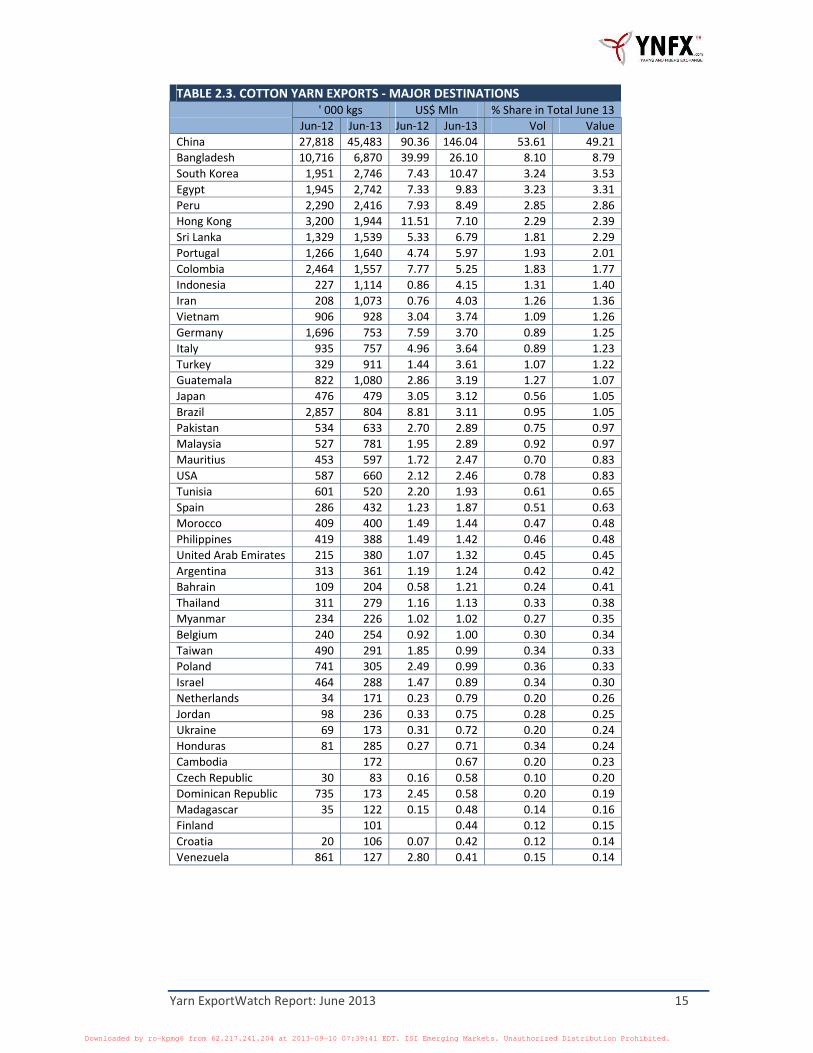
TABLE 2.3. COTTON YARN EXPORTS ‐ MAJOR DESTINATIONS ' 000 kgs US$ Mln % Share in Total June 13
Jun‐12 Jun‐13 Jun‐12 Jun‐13 Vol Value China 27,818 45,483 90.36 146.04 53.61 49.21 Bangladesh 10,716 6,870 39.99 26.10 8.10 8.79 South Korea 1,951 2,746 7.43 10.47 3.24 3.53 Egypt 1,945 2,742 7.33 9.83 3.23 3.31 Peru 2,290 2,416 7.93 8.49 2.85 2.86 Hong Kong 3,200 1,944 11.51 7.10 2.29 2.39 Sri Lanka 1,329 1,539 5.33 6.79 1.81 2.29 Portugal 1,266 1,640 4.74 5.97 1.93 2.01 Colombia 2,464 1,557 7.77 5.25 1.83 1.77 Indonesia 227 1,114 0.86 4.15 1.31 1.40 Iran 208 1,073 0.76 4.03 1.26 1.36 Vietnam 906 928 3.04 3.74 1.09 1.26 Germany 1,696 753 7.59 3.70 0.89 1.25 Italy 935 757 4.96 3.64 0.89 1.23 Turkey 329 911 1.44 3.61 1.07 1.22 Guatemala 822 1,080 2.86 3.19 1.27 1.07 Japan 476 479 3.05 3.12 0.56 1.05 Brazil 2,857 804 8.81 3.11 0.95 1.05 Pakistan 534 633 2.70 2.89 0.75 0.97 Malaysia 527 781 1.95 2.89 0.92 0.97 Mauritius 453 597 1.72 2.47 0.70 0.83 USA 587 660 2.12 2.46 0.78 0.83 Tunisia 601 520 2.20 1.93 0.61 0.65 Spain 286 432 1.23 1.87 0.51 0.63 Morocco 409 400 1.49 1.44 0.47 0.48 Philippines 419 388 1.49 1.42 0.46 0.48 United Arab Emirates 215 380 1.07 1.32 0.45 0.45 Argentina 313 361 1.19 1.24 0.42 0.42 Bahrain 109 204 0.58 1.21 0.24 0.41 Thailand 311 279 1.16 1.13 0.33 0.38 Myanmar 234 226 1.02 1.02 0.27 0.35 Belgium 240 254 0.92 1.00 0.30 0.34 Taiwan 490 291 1.85 0.99 0.34 0.33 Poland 741 305 2.49 0.99 0.36 0.33 Israel 464 288 1.47 0.89 0.34 0.30 Netherlands 34 171 0.23 0.79 0.20 0.26 Jordan 98 236 0.33 0.75 0.28 0.25 Ukraine 69 173 0.31 0.72 0.20 0.24 Honduras 81 285 0.27 0.71 0.34 0.24 Cambodia 172 0.67 0.20 0.23 Czech Republic 30 83 0.16 0.58 0.10 0.20 Dominican Republic 735 173 2.45 0.58 0.20 0.19 Madagascar 35 122 0.15 0.48 0.14 0.16 Finland 101 0.44 0.12 0.15 Croatia 20 106 0.07 0.42 0.12 0.14 Venezuela 861 127 2.80 0.41 0.15 0.14
ISIEmergingMarketsPDF ro-kpmg6 from 62.217.241.204 on 2013-09-10 07:39:41 EDT. DownloadPDF.
Downloaded by ro-kpmg6 from 62.217.241.204 at 2013-09-10 07:39:41 EDT. ISI Emerging Markets. Unauthorized Distribution Prohibited.
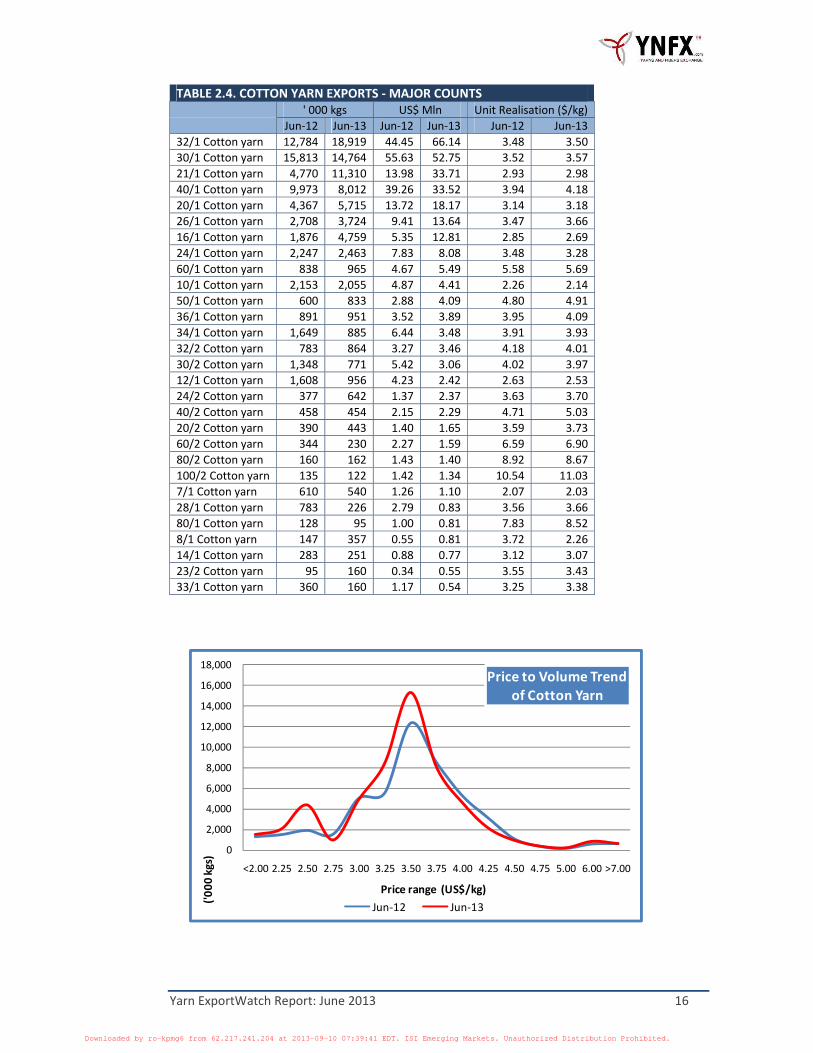
Yarn ExportWatch Report: June 2013 16
0
2,000
4,000
6,000
8,000
10,000
12,000
14,000
16,000
18,000
<2.00 2.25 2.50 2.75 3.00 3.25 3.50 3.75 4.00 4.25 4.50 4.75 5.00 6.00 >7.00
('000
kgs)
Price range (US$/kg)
Price to Volume Trendof Cotton Yarn
Jun‐12 Jun‐13
TABLE 2.4. COTTON YARN EXPORTS ‐ MAJOR COUNTS ' 000 kgs US$ Mln Unit Realisation ($/kg)
Jun‐12 Jun‐13 Jun‐12 Jun‐13 Jun‐12 Jun‐13 32/1 Cotton yarn 12,784 18,919 44.45 66.14 3.48 3.50 30/1 Cotton yarn 15,813 14,764 55.63 52.75 3.52 3.57 21/1 Cotton yarn 4,770 11,310 13.98 33.71 2.93 2.98 40/1 Cotton yarn 9,973 8,012 39.26 33.52 3.94 4.18 20/1 Cotton yarn 4,367 5,715 13.72 18.17 3.14 3.18 26/1 Cotton yarn 2,708 3,724 9.41 13.64 3.47 3.66 16/1 Cotton yarn 1,876 4,759 5.35 12.81 2.85 2.69 24/1 Cotton yarn 2,247 2,463 7.83 8.08 3.48 3.28 60/1 Cotton yarn 838 965 4.67 5.49 5.58 5.69 10/1 Cotton yarn 2,153 2,055 4.87 4.41 2.26 2.14 50/1 Cotton yarn 600 833 2.88 4.09 4.80 4.91 36/1 Cotton yarn 891 951 3.52 3.89 3.95 4.09 34/1 Cotton yarn 1,649 885 6.44 3.48 3.91 3.93 32/2 Cotton yarn 783 864 3.27 3.46 4.18 4.01 30/2 Cotton yarn 1,348 771 5.42 3.06 4.02 3.97 12/1 Cotton yarn 1,608 956 4.23 2.42 2.63 2.53 24/2 Cotton yarn 377 642 1.37 2.37 3.63 3.70 40/2 Cotton yarn 458 454 2.15 2.29 4.71 5.03 20/2 Cotton yarn 390 443 1.40 1.65 3.59 3.73 60/2 Cotton yarn 344 230 2.27 1.59 6.59 6.90 80/2 Cotton yarn 160 162 1.43 1.40 8.92 8.67 100/2 Cotton yarn 135 122 1.42 1.34 10.54 11.03 7/1 Cotton yarn 610 540 1.26 1.10 2.07 2.03 28/1 Cotton yarn 783 226 2.79 0.83 3.56 3.66 80/1 Cotton yarn 128 95 1.00 0.81 7.83 8.52 8/1 Cotton yarn 147 357 0.55 0.81 3.72 2.26 14/1 Cotton yarn 283 251 0.88 0.77 3.12 3.07 23/2 Cotton yarn 95 160 0.34 0.55 3.55 3.43 33/1 Cotton yarn 360 160 1.17 0.54 3.25 3.38
ISIEmergingMarketsPDF ro-kpmg6 from 62.217.241.204 on 2013-09-10 07:39:41 EDT. DownloadPDF.
Downloaded by ro-kpmg6 from 62.217.241.204 at 2013-09-10 07:39:41 EDT. ISI Emerging Markets. Unauthorized Distribution Prohibited.
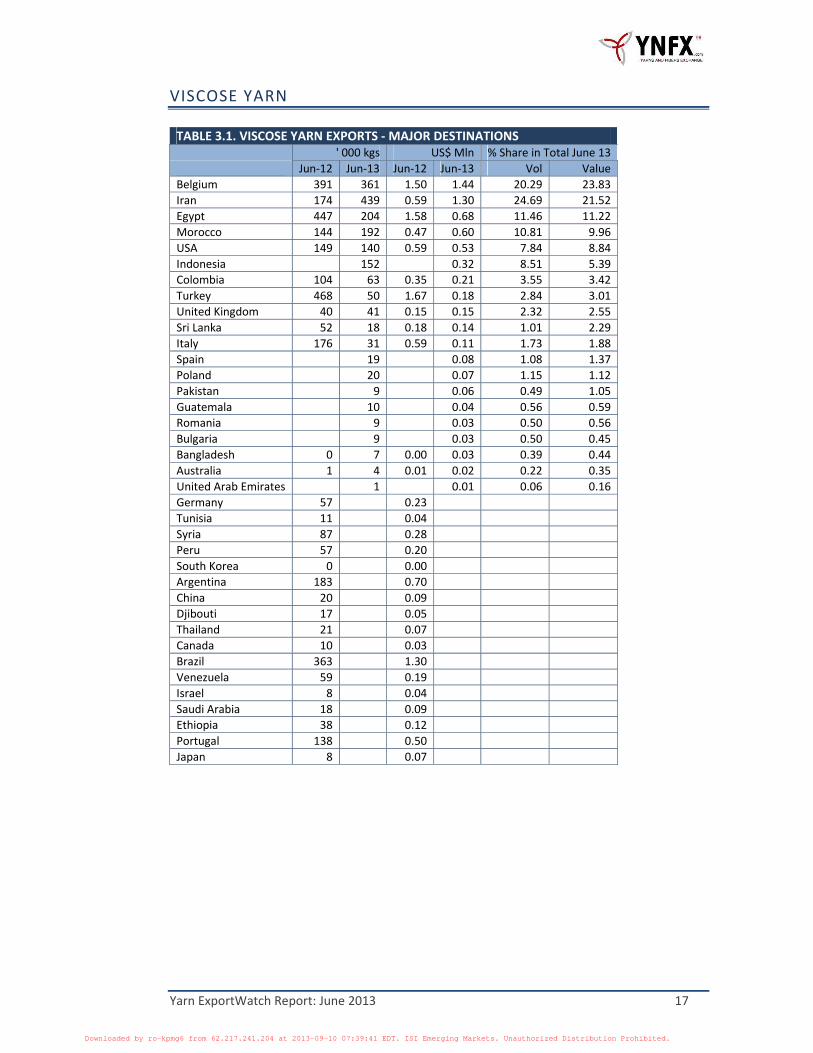
Yarn ExportWatch Report: June 2013 17
VISCOSE YARN
TABLE 3.1. VISCOSE YARN EXPORTS ‐MAJOR DESTINATIONS' 000 kgs US$ Mln % Share in Total June 13
Jun‐12 Jun‐13 Jun‐12 Jun‐13 Vol Value Belgium 391 361 1.50 1.44 20.29 23.83 Iran 174 439 0.59 1.30 24.69 21.52 Egypt 447 204 1.58 0.68 11.46 11.22 Morocco 144 192 0.47 0.60 10.81 9.96 USA 149 140 0.59 0.53 7.84 8.84 Indonesia 152 0.32 8.51 5.39 Colombia 104 63 0.35 0.21 3.55 3.42 Turkey 468 50 1.67 0.18 2.84 3.01 United Kingdom 40 41 0.15 0.15 2.32 2.55 Sri Lanka 52 18 0.18 0.14 1.01 2.29 Italy 176 31 0.59 0.11 1.73 1.88 Spain 19 0.08 1.08 1.37 Poland 20 0.07 1.15 1.12 Pakistan 9 0.06 0.49 1.05 Guatemala 10 0.04 0.56 0.59 Romania 9 0.03 0.50 0.56 Bulgaria 9 0.03 0.50 0.45 Bangladesh 0 7 0.00 0.03 0.39 0.44 Australia 1 4 0.01 0.02 0.22 0.35 United Arab Emirates 1 0.01 0.06 0.16 Germany 57 0.23Tunisia 11 0.04Syria 87 0.28Peru 57 0.20South Korea 0 0.00Argentina 183 0.70China 20 0.09Djibouti 17 0.05Thailand 21 0.07Canada 10 0.03Brazil 363 1.30Venezuela 59 0.19Israel 8 0.04Saudi Arabia 18 0.09Ethiopia 38 0.12Portugal 138 0.50Japan 8 0.07
ISIEmergingMarketsPDF ro-kpmg6 from 62.217.241.204 on 2013-09-10 07:39:41 EDT. DownloadPDF.
Downloaded by ro-kpmg6 from 62.217.241.204 at 2013-09-10 07:39:41 EDT. ISI Emerging Markets. Unauthorized Distribution Prohibited.
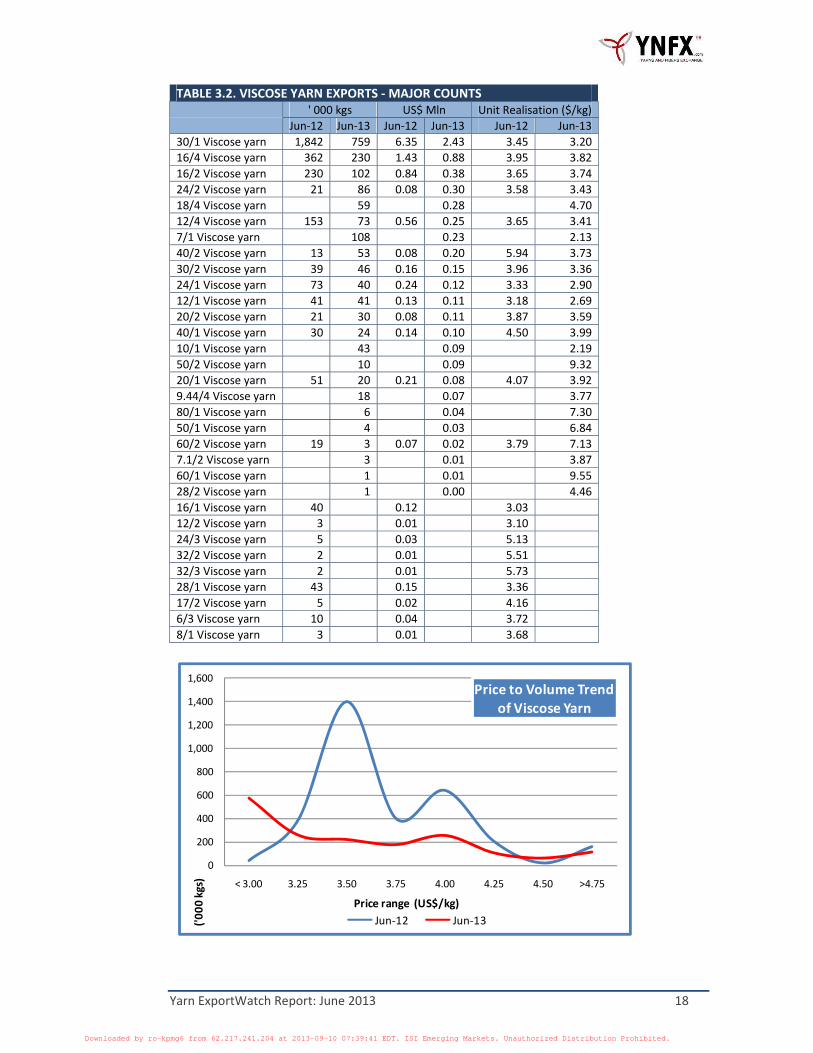
Yarn ExportWatch Report: June 2013 18
0
200
400
600
800
1,000
1,200
1,400
1,600
< 3.00 3.25 3.50 3.75 4.00 4.25 4.50 >4.75
('000
kgs)
Price range (US$/kg)
Price to Volume Trendof Viscose Yarn
Jun‐12 Jun‐13
TABLE 3.2. VISCOSE YARN EXPORTS ‐ MAJOR COUNTS ' 000 kgs US$ Mln Unit Realisation ($/kg)
Jun‐12 Jun‐13 Jun‐12 Jun‐13 Jun‐12 Jun‐13 30/1 Viscose yarn 1,842 759 6.35 2.43 3.45 3.20 16/4 Viscose yarn 362 230 1.43 0.88 3.95 3.82 16/2 Viscose yarn 230 102 0.84 0.38 3.65 3.74 24/2 Viscose yarn 21 86 0.08 0.30 3.58 3.43 18/4 Viscose yarn 59 0.28 4.70 12/4 Viscose yarn 153 73 0.56 0.25 3.65 3.41 7/1 Viscose yarn 108 0.23 2.13 40/2 Viscose yarn 13 53 0.08 0.20 5.94 3.73 30/2 Viscose yarn 39 46 0.16 0.15 3.96 3.36 24/1 Viscose yarn 73 40 0.24 0.12 3.33 2.90 12/1 Viscose yarn 41 41 0.13 0.11 3.18 2.69 20/2 Viscose yarn 21 30 0.08 0.11 3.87 3.59 40/1 Viscose yarn 30 24 0.14 0.10 4.50 3.99 10/1 Viscose yarn 43 0.09 2.19 50/2 Viscose yarn 10 0.09 9.32 20/1 Viscose yarn 51 20 0.21 0.08 4.07 3.92 9.44/4 Viscose yarn 18 0.07 3.77 80/1 Viscose yarn 6 0.04 7.30 50/1 Viscose yarn 4 0.03 6.84 60/2 Viscose yarn 19 3 0.07 0.02 3.79 7.13 7.1/2 Viscose yarn 3 0.01 3.87 60/1 Viscose yarn 1 0.01 9.55 28/2 Viscose yarn 1 0.00 4.46 16/1 Viscose yarn 40 0.12 3.0312/2 Viscose yarn 3 0.01 3.1024/3 Viscose yarn 5 0.03 5.1332/2 Viscose yarn 2 0.01 5.5132/3 Viscose yarn 2 0.01 5.7328/1 Viscose yarn 43 0.15 3.3617/2 Viscose yarn 5 0.02 4.166/3 Viscose yarn 10 0.04 3.728/1 Viscose yarn 3 0.01 3.68
ISIEmergingMarketsPDF ro-kpmg6 from 62.217.241.204 on 2013-09-10 07:39:41 EDT. DownloadPDF.
Downloaded by ro-kpmg6 from 62.217.241.204 at 2013-09-10 07:39:41 EDT. ISI Emerging Markets. Unauthorized Distribution Prohibited.
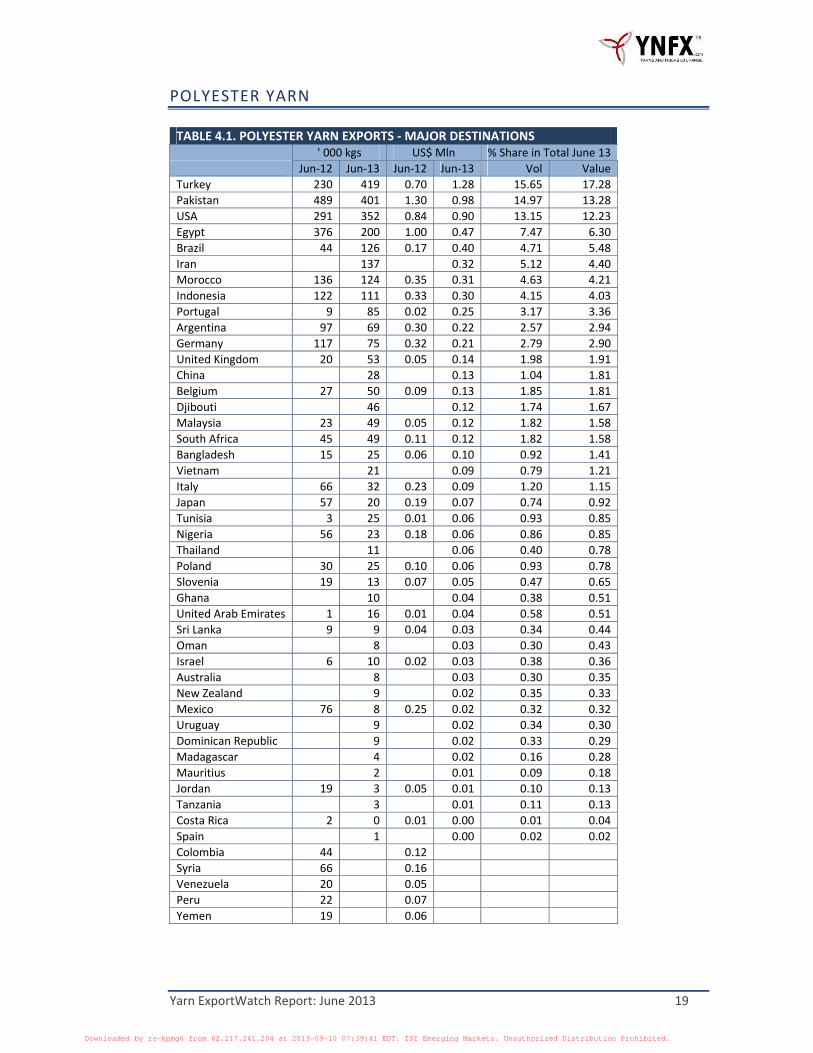
Yarn ExportWatch Report: June 2013 19
POLYESTER YARN
TABLE 4.1. POLYESTER YARN EXPORTS ‐MAJOR DESTINATIONS' 000 kgs US$ Mln % Share in Total June 13
Jun‐12 Jun‐13 Jun‐12 Jun‐13 Vol Value Turkey 230 419 0.70 1.28 15.65 17.28 Pakistan 489 401 1.30 0.98 14.97 13.28 USA 291 352 0.84 0.90 13.15 12.23 Egypt 376 200 1.00 0.47 7.47 6.30 Brazil 44 126 0.17 0.40 4.71 5.48 Iran 137 0.32 5.12 4.40 Morocco 136 124 0.35 0.31 4.63 4.21 Indonesia 122 111 0.33 0.30 4.15 4.03 Portugal 9 85 0.02 0.25 3.17 3.36 Argentina 97 69 0.30 0.22 2.57 2.94 Germany 117 75 0.32 0.21 2.79 2.90 United Kingdom 20 53 0.05 0.14 1.98 1.91 China 28 0.13 1.04 1.81 Belgium 27 50 0.09 0.13 1.85 1.81 Djibouti 46 0.12 1.74 1.67 Malaysia 23 49 0.05 0.12 1.82 1.58 South Africa 45 49 0.11 0.12 1.82 1.58 Bangladesh 15 25 0.06 0.10 0.92 1.41 Vietnam 21 0.09 0.79 1.21 Italy 66 32 0.23 0.09 1.20 1.15 Japan 57 20 0.19 0.07 0.74 0.92 Tunisia 3 25 0.01 0.06 0.93 0.85 Nigeria 56 23 0.18 0.06 0.86 0.85 Thailand 11 0.06 0.40 0.78 Poland 30 25 0.10 0.06 0.93 0.78 Slovenia 19 13 0.07 0.05 0.47 0.65 Ghana 10 0.04 0.38 0.51 United Arab Emirates 1 16 0.01 0.04 0.58 0.51 Sri Lanka 9 9 0.04 0.03 0.34 0.44 Oman 8 0.03 0.30 0.43 Israel 6 10 0.02 0.03 0.38 0.36 Australia 8 0.03 0.30 0.35 New Zealand 9 0.02 0.35 0.33 Mexico 76 8 0.25 0.02 0.32 0.32 Uruguay 9 0.02 0.34 0.30 Dominican Republic 9 0.02 0.33 0.29 Madagascar 4 0.02 0.16 0.28 Mauritius 2 0.01 0.09 0.18 Jordan 19 3 0.05 0.01 0.10 0.13 Tanzania 3 0.01 0.11 0.13 Costa Rica 2 0 0.01 0.00 0.01 0.04 Spain 1 0.00 0.02 0.02 Colombia 44 0.12Syria 66 0.16Venezuela 20 0.05Peru 22 0.07Yemen 19 0.06
ISIEmergingMarketsPDF ro-kpmg6 from 62.217.241.204 on 2013-09-10 07:39:41 EDT. DownloadPDF.
Downloaded by ro-kpmg6 from 62.217.241.204 at 2013-09-10 07:39:41 EDT. ISI Emerging Markets. Unauthorized Distribution Prohibited.
Yarn ExportWatch Report: June 2013 20
0
100
200
300
400
500
600
700
800
900
<2.25 <2.50 2.75 3.00 3.25 3.50 3.75 4.00 > 4.25
('000
kgs)
Price range (US$/kg)
Price to Volume Trendof Polyester Yarn
Jun‐12 Jun‐13
TABLE 4.2. POLYESTER YARN EXPORTS ‐ MAJOR COUNTS ' 000 kgs US$ Mln Unit Realisation (US$/kg)
Jun‐12 Jun‐13 Jun‐12 Jun‐13 Jun‐12 Jun‐13 30/1 Polyester yarn 569 407 1.67 1.13 2.93 2.78 20/1 Polyester yarn 321 458 0.80 1.07 2.48 2.33 60/1 Polyester yarn 111 257 0.39 0.86 3.48 3.36 12/3 Polyester yarn 177 179 0.41 0.44 2.34 2.44 16/3 Polyester yarn 53 182 0.15 0.43 2.79 2.38 30/2 Polyester yarn 214 110 0.56 0.34 2.63 3.12 42/2 Polyester yarn 29 73 0.10 0.22 3.33 2.98 10/4 Polyester yarn 10 85 0.02 0.21 2.60 2.52 8/1 Polyester yarn 113 71 0.29 0.18 2.60 2.57 12/4 Polyester yarn 112 69 0.27 0.17 2.42 2.39 20/2 Polyester yarn 96 54 0.27 0.14 2.80 2.69 8/2 Polyester yarn 52 0.13 2.53 24/2 Polyester yarn 117 73 0.35 0.12 2.96 1.67 45/2 Polyester yarn 2 32 0.01 0.12 5.21 3.73 12/1 Polyester yarn 55 43 0.16 0.11 2.95 2.49 12/2 Polyester yarn 45 0.11 2.41 21.5/4 Polyester yarn 18 24 0.07 0.10 4.03 4.15 36/1 Polyester yarn 28 0.08 2.79 32/2 Polyester yarn 24 0.07 3.09 50/1 Polyester yarn 20 0.07 3.69 15/3 Polyester yarn 2 17 0.01 0.07 4.24 4.19 40/1 Polyester yarn 11 20 0.03 0.07 2.80 3.41 6/4 Polyester yarn 26 0.07 2.57 10/3 Polyester yarn 23 24 0.06 0.06 2.51 2.46 76/2 Polyester yarn 18 11 0.11 0.06 5.97 5.34 18/1 Polyester yarn 21 25 0.05 0.06 2.42 2.26 17/1 Polyester yarn 17 0.05 3.01 24/1 Polyester yarn 87 14 0.24 0.05 2.70 3.40 6.21/2 Polyester yarn 19 13 0.07 0.05 3.83 3.81 3.6/1 Polyester yarn 22 0.05 2.08 14/2 Polyester yarn 15 14 0.06 0.05 3.92 3.33
ISIEmergingMarketsPDF ro-kpmg6 from 62.217.241.204 on 2013-09-10 07:39:41 EDT. DownloadPDF.
Downloaded by ro-kpmg6 from 62.217.241.204 at 2013-09-10 07:39:41 EDT. ISI Emerging Markets. Unauthorized Distribution Prohibited.
Yarn ExportWatch Report: June 2013 21
POYESTER/COTTON BLENDED YARN
TABLE 5.1. POLYESTER/COTTON BLENDED YARN EXPORTS ‐MAJOR DESTINATIONS' 000 kgs US$ Mln % Share in Total June 13
Jun‐12 Jun‐13 Jun‐12 Jun‐13 Vol ValueColombia 566 441 1.71 1.36 11.50 11.65Egypt 478 339 1.52 1.07 8.85 9.21Brazil 256 330 0.76 1.02 8.62 8.73Turkey 696 360 1.82 0.90 9.39 7.71Spain 61 205 0.21 0.65 5.36 5.61Peru 270 206 0.81 0.59 5.38 5.08Morocco 308 188 0.97 0.59 4.91 5.05USA 199 170 0.68 0.55 4.43 4.73Mauritius 96 131 0.34 0.45 3.43 3.87Jordan 132 130 0.37 0.37 3.40 3.19Germany 138 94 0.47 0.29 2.45 2.49Bangladesh 578 84 1.84 0.27 2.20 2.34Argentina 121 89 0.44 0.27 2.33 2.28Guatemala 31 78 0.11 0.24 2.02 2.09Eritrea 69 0.21 1.81 1.77United Arab Emirates 25 85 0.07 0.21 2.21 1.76Tunisia 70 52 0.24 0.19 1.36 1.62Algeria 44 72 0.13 0.18 1.87 1.52Italy 72 47 0.23 0.16 1.23 1.33Russia 41 43 0.14 0.15 1.11 1.31Israel 23 48 0.08 0.14 1.26 1.24Vietnam 29 48 0.11 0.14 1.25 1.20Portugal 194 44 0.58 0.14 1.15 1.19Dominican Republic 91 46 0.27 0.14 1.21 1.18Belgium 91 45 0.30 0.13 1.18 1.12Uzbekistan 47 0.13 1.23 1.09Ecuador 48 41 0.13 0.13 1.06 1.07Saudi Arabia 23 48 0.06 0.12 1.24 1.04Poland 59 31 0.25 0.12 0.81 1.00Venezuela 544 33 1.68 0.10 0.87 0.89Lebanon 9 28 0.03 0.09 0.73 0.80South Africa 14 22 0.06 0.09 0.57 0.77Chile 106 24 0.32 0.08 0.63 0.66Latvia 42 18 0.16 0.07 0.47 0.63China 24 23 0.07 0.07 0.60 0.61United Kingdom 29 20 0.09 0.06 0.51 0.49Sri Lanka 104 15 0.43 0.05 0.39 0.42Czech Republic 8 0.04 0.20 0.32Thailand 8 7 0.03 0.03 0.18 0.28Canada 15 10 0.05 0.03 0.26 0.28Uruguay 10 9 0.03 0.03 0.23 0.24Oman 17 5 0.07 0.01 0.12 0.12
ISIEmergingMarketsPDF ro-kpmg6 from 62.217.241.204 on 2013-09-10 07:39:41 EDT. DownloadPDF.
Downloaded by ro-kpmg6 from 62.217.241.204 at 2013-09-10 07:39:41 EDT. ISI Emerging Markets. Unauthorized Distribution Prohibited.
Yarn ExportWatch Report: June 2013 22
0
500
1,000
1,500
2,000
< 2.50 2.75 3.00 3.25 3.50 3.75 4.00 >4.25
('000
kgs)
Price range (US$/kg)
Price to Volume Trendof PC Yarn
Jun‐12 Jun‐13
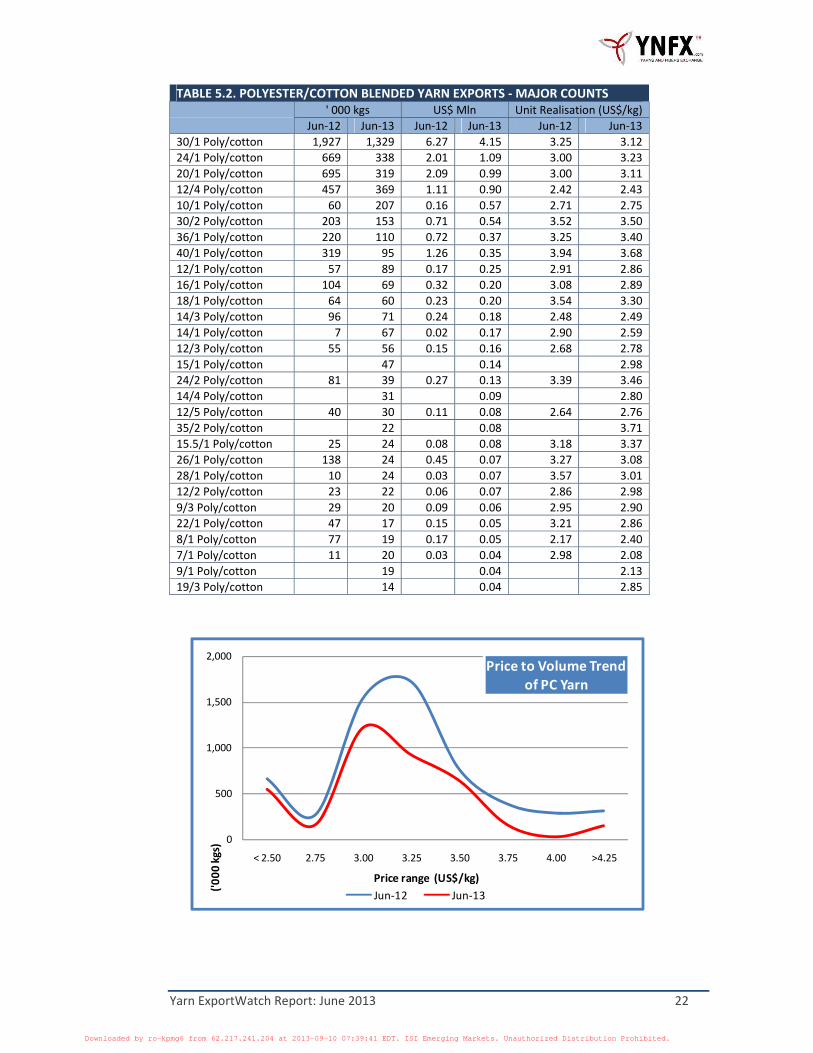
TABLE 5.2. POLYESTER/COTTON BLENDED YARN EXPORTS ‐ MAJOR COUNTS ' 000 kgs US$ Mln Unit Realisation (US$/kg)
Jun‐12 Jun‐13 Jun‐12 Jun‐13 Jun‐12 Jun‐13 30/1 Poly/cotton 1,927 1,329 6.27 4.15 3.25 3.12 24/1 Poly/cotton 669 338 2.01 1.09 3.00 3.23 20/1 Poly/cotton 695 319 2.09 0.99 3.00 3.11 12/4 Poly/cotton 457 369 1.11 0.90 2.42 2.43 10/1 Poly/cotton 60 207 0.16 0.57 2.71 2.75 30/2 Poly/cotton 203 153 0.71 0.54 3.52 3.50 36/1 Poly/cotton 220 110 0.72 0.37 3.25 3.40 40/1 Poly/cotton 319 95 1.26 0.35 3.94 3.68 12/1 Poly/cotton 57 89 0.17 0.25 2.91 2.86 16/1 Poly/cotton 104 69 0.32 0.20 3.08 2.89 18/1 Poly/cotton 64 60 0.23 0.20 3.54 3.30 14/3 Poly/cotton 96 71 0.24 0.18 2.48 2.49 14/1 Poly/cotton 7 67 0.02 0.17 2.90 2.59 12/3 Poly/cotton 55 56 0.15 0.16 2.68 2.78 15/1 Poly/cotton 47 0.14 2.98 24/2 Poly/cotton 81 39 0.27 0.13 3.39 3.46 14/4 Poly/cotton 31 0.09 2.80 12/5 Poly/cotton 40 30 0.11 0.08 2.64 2.76 35/2 Poly/cotton 22 0.08 3.71 15.5/1 Poly/cotton 25 24 0.08 0.08 3.18 3.37 26/1 Poly/cotton 138 24 0.45 0.07 3.27 3.08 28/1 Poly/cotton 10 24 0.03 0.07 3.57 3.01 12/2 Poly/cotton 23 22 0.06 0.07 2.86 2.98 9/3 Poly/cotton 29 20 0.09 0.06 2.95 2.90 22/1 Poly/cotton 47 17 0.15 0.05 3.21 2.86 8/1 Poly/cotton 77 19 0.17 0.05 2.17 2.40 7/1 Poly/cotton 11 20 0.03 0.04 2.98 2.08 9/1 Poly/cotton 19 0.04 2.13 19/3 Poly/cotton 14 0.04 2.85
ISIEmergingMarketsPDF ro-kpmg6 from 62.217.241.204 on 2013-09-10 07:39:41 EDT. DownloadPDF.
Downloaded by ro-kpmg6 from 62.217.241.204 at 2013-09-10 07:39:41 EDT. ISI Emerging Markets. Unauthorized Distribution Prohibited.
Yarn ExportWatch Report: June 2013 23
POLYESTER/VISCOSE BLENDED YARN
TABLE 6.1. POLYESTER/VISCOSE BLENDED YARN EXPORTS ‐MAJOR DESTINATIONS ' 000 kgs US$ Mln % Share in Total June 13
Jun‐12 Jun‐13 Jun‐12 Jun‐13 Vol ValueTurkey 1,998 1,364 6.68 4.44 47.44 48.01Iran 481 491 1.36 1.36 17.07 14.74USA 82 210 0.27 0.69 7.32 7.48Pakistan 76 91 0.39 0.36 3.16 3.86Egypt 73 88 0.22 0.31 3.06 3.37Brazil 298 82 0.84 0.21 2.84 2.29Argentina 311 56 1.01 0.20 1.94 2.19South Africa 102 50 0.37 0.19 1.73 2.06Venezuela 50 48 0.19 0.19 1.68 2.03Italy 61 0.18 2.13 1.90Peru 47 0.17 1.63 1.89Japan 26 42 0.11 0.16 1.45 1.76Kenya 59 47 0.20 0.15 1.64 1.58Uganda 75 50 0.24 0.14 1.74 1.54Germany 30 0.10 1.06 1.11South Korea 0 25 0.00 0.07 0.86 0.79Yemen 38 19 0.15 0.07 0.66 0.76Colombia 23 0.06 0.78 0.68Morocco 19 0.06 0.65 0.64United Kingdom 10 9 0.04 0.03 0.32 0.37Hong Kong 8 0.03 0.29 0.31Jordan 1 7 0.00 0.03 0.24 0.28Oman 5 0.02 0.16 0.19Sri Lanka 5 0.02 0.16 0.17Ukraine 0 0.00 0.01 0.01Djibouti 24 0.08Belgium 36 0.13Lebanon 29 0.10Mauritius 4 0.02Israel 10 0.03Australia 1 0.00China 24 0.08Poland 10 0.04
ISIEmergingMarketsPDF ro-kpmg6 from 62.217.241.204 on 2013-09-10 07:39:41 EDT. DownloadPDF.
Downloaded by ro-kpmg6 from 62.217.241.204 at 2013-09-10 07:39:41 EDT. ISI Emerging Markets. Unauthorized Distribution Prohibited.
Yarn ExportWatch Report: June 2013 24
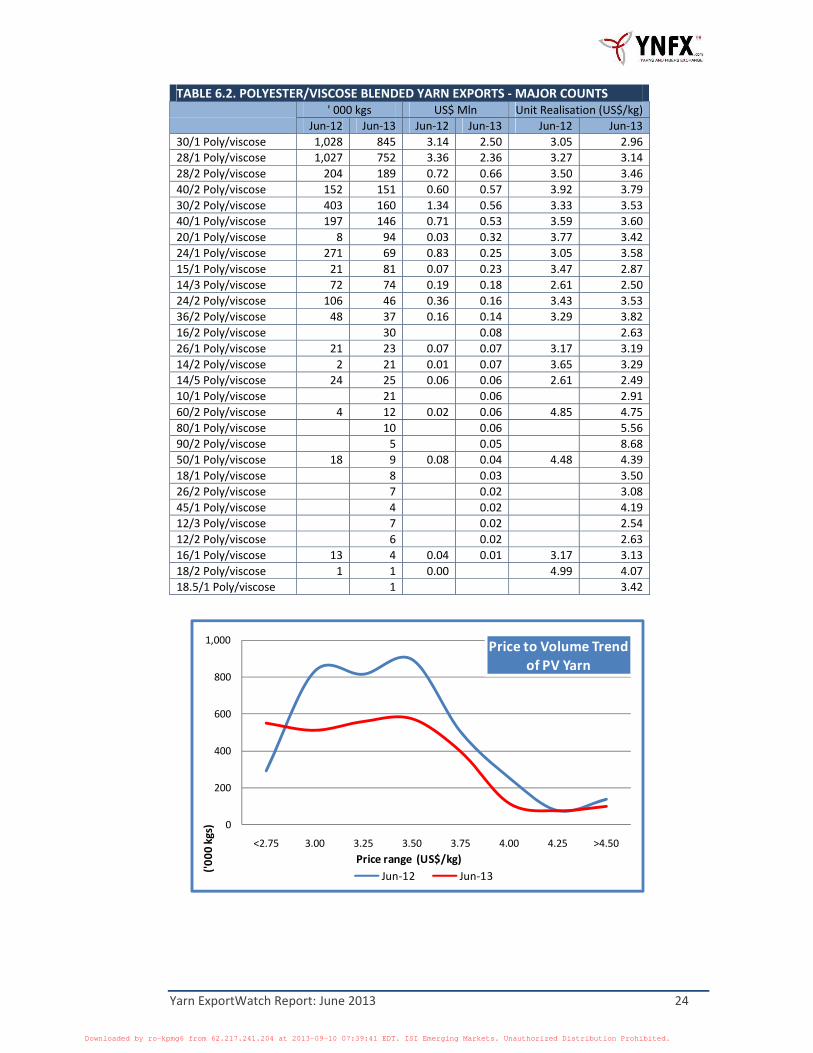
0
200
400
600
800
1,000
<2.75 3.00 3.25 3.50 3.75 4.00 4.25 >4.50
('000
kgs)
Price range (US$/kg)
Price to Volume Trendof PV Yarn
Jun‐12 Jun‐13
TABLE 6.2. POLYESTER/VISCOSE BLENDED YARN EXPORTS ‐ MAJOR COUNTS ' 000 kgs US$ Mln Unit Realisation (US$/kg)
Jun‐12 Jun‐13 Jun‐12 Jun‐13 Jun‐12 Jun‐13 30/1 Poly/viscose 1,028 845 3.14 2.50 3.05 2.96 28/1 Poly/viscose 1,027 752 3.36 2.36 3.27 3.14 28/2 Poly/viscose 204 189 0.72 0.66 3.50 3.46 40/2 Poly/viscose 152 151 0.60 0.57 3.92 3.79 30/2 Poly/viscose 403 160 1.34 0.56 3.33 3.53 40/1 Poly/viscose 197 146 0.71 0.53 3.59 3.60 20/1 Poly/viscose 8 94 0.03 0.32 3.77 3.42 24/1 Poly/viscose 271 69 0.83 0.25 3.05 3.58 15/1 Poly/viscose 21 81 0.07 0.23 3.47 2.87 14/3 Poly/viscose 72 74 0.19 0.18 2.61 2.50 24/2 Poly/viscose 106 46 0.36 0.16 3.43 3.53 36/2 Poly/viscose 48 37 0.16 0.14 3.29 3.82 16/2 Poly/viscose 30 0.08 2.63 26/1 Poly/viscose 21 23 0.07 0.07 3.17 3.19 14/2 Poly/viscose 2 21 0.01 0.07 3.65 3.29 14/5 Poly/viscose 24 25 0.06 0.06 2.61 2.49 10/1 Poly/viscose 21 0.06 2.91 60/2 Poly/viscose 4 12 0.02 0.06 4.85 4.75 80/1 Poly/viscose 10 0.06 5.56 90/2 Poly/viscose 5 0.05 8.68 50/1 Poly/viscose 18 9 0.08 0.04 4.48 4.39 18/1 Poly/viscose 8 0.03 3.50 26/2 Poly/viscose 7 0.02 3.08 45/1 Poly/viscose 4 0.02 4.19 12/3 Poly/viscose 7 0.02 2.54 12/2 Poly/viscose 6 0.02 2.63 16/1 Poly/viscose 13 4 0.04 0.01 3.17 3.13 18/2 Poly/viscose 1 1 0.00 4.99 4.07 18.5/1 Poly/viscose 1 3.42
ISIEmergingMarketsPDF ro-kpmg6 from 62.217.241.204 on 2013-09-10 07:39:41 EDT. DownloadPDF.
Downloaded by ro-kpmg6 from 62.217.241.204 at 2013-09-10 07:39:41 EDT. ISI Emerging Markets. Unauthorized Distribution Prohibited.
Yarn ExportWatch Report: June 2013 25
YNFX.COM
ABOUT YNFX.COM
www.YnFx.com is a leading provider of Textile Market Intelligence and Market Devel‐opment with a membership spread across more than 150 countries. YnFx.com is a part of Centerac Technologies Limited with office in Mumbai, India.
With 15 years of experience serving the textile industry YnFx.com has built a formidable base of clients globally. With an aspiration to be the one‐stop‐shop for the textile indus‐try, YarnsandFibers.com has evolved to YnFx.com. It covers a wide spectrum of the tex‐tile chain from Fibre to Fabric.
YNFX SERVICES
YnFx focuses on using online and offline mechanisms to bring people closer and deliver maximum value to members. YnFx understands business needs and builds an environ‐ment for textile professionals to conduct business providing users with highly targeted, easy‐to‐use interface, utilizing advanced Internet technology.
We offer two services:
MARKET INTELLIGENCE
From a stage of dearth of data, the excess of it overwhelms today’s decision maker. Much of the data is raw and not consumable to assist decision making process.
Market Intelligence team at YnFx senses and captures real‐time intelligence about the industry. The team has a variety of sources on the Internet and on the ground to com‐pile and provide members with authentic data. Our Market Intelligence service is deliv‐ered through channels
− PriceWatch Report − Yarn ExportWatch Report − Price Forecast Reports − Industry News & Reports − Historical Data & Statistics − Researched Reports − Customized Reports
MARKET DEVELOPMENT
YNFX also boosts of its “Preferred Supplier Program” – the most efficient lead genera‐tion program for the textile industry on the internet.
A uniquely designed Program aimed to provide buyers with an aggregate global supply base of yarns, fibers, fabrics
ISIEmergingMarketsPDF ro-kpmg6 from 62.217.241.204 on 2013-09-10 07:39:41 EDT. DownloadPDF.
Downloaded by ro-kpmg6 from 62.217.241.204 at 2013-09-10 07:39:41 EDT. ISI Emerging Markets. Unauthorized Distribution Prohibited.

ISIEmergingMarketsPDF ro-kpmg6 from 62.217.241.204 on 2013-09-10 07:39:41 EDT. DownloadPDF.
Downloaded by ro-kpmg6 from 62.217.241.204 at 2013-09-10 07:39:41 EDT. ISI Emerging Markets. Unauthorized Distribution Prohibited.


