Yangon’s Urban Transportation: Traffic Demand and … Paper Yangon’s Urban Transportation:...
20
Working Paper Yangon’s Urban Transportation: Traffic Demand and Its Quality of Service Momoko KOJIMA a , Takayoshi FUTOSE b , Phan Le BINH c , and Hironori KATO d a,b ALMEC Corporation, 5-5-3, Shinjuku, Shinjuku-ku, Tokyo 160-0022, Japan a E-mail: [email protected] b E-mail: [email protected] c Japan International Cooperation Agency, 5-25, Niban-cho, Chiyoda-ku, Tokyo 102-8012, Japan; E-mail: [email protected] d University of Tokyo, 7-3-1, Hongo, Bunkyo-ku, Tokyo 113-8656, Japan; E-mail: [email protected] Abstract: This paper reported the current traffic conditions in Yangon and discussed the issues with the mobility and the future direction of the urban transportation system. The achievements of the large-scale survey are so valuable that the traffic conditions have been successfully revealed for understanding the current problems and for planning the future transportation policy/network in Yangon. The evidence from these surveys are expected to contribute to the data-based approach in the urban transportation planning and decision-making process in Myanmar. Keywords: Motorcycle ban, bicycle ban, regulation on the import of used vehicle, Myanmar, person trip survey 1. INTRODUCTION Yangon, with a population of about 5.7 million as of 2013 (JICA, 2014), is the largest economic center in the Republic of the Union of Myanmar. It has experienced rapid urbanization and motorization along with the nation’s economic growth. The annual GDP growth rate in Myanmar is 6.7 % as of 2013 while the population in Yangon city has grown at an annual rate of 2.6 % from 1998 to 2011 (JICA, 2014). The central business district (CBD) of Yangon city is located at the city’s southern part, adjacent to the confluence of the Yangon River and the Bago River. The CBD was developed during the British colonial period where the grid-based road network was first developed. As the urban population increased, the urban area was extended from the CBD to the north due to geographical constraints, mainly the two rivers running at the southern part of the city. In addition, transportation infrastructure including highway and rail networks had been also developed to connect the CBD with the northern part of Yangon city. The main residential areas are located in the northeastern part of the city from which many commuters travel to their workplaces in the CBD. The five main types of transportation modes that are available in Yangon are the private car, rail, taxi, rickshaw, and bus. The so-called truck bus is one of the most popular public transportation options for commuters in Yangon (Kato et al., 2010). The government has introduced two unique transportation policies in Yangon city: one is the regulation of importing foreign second-hand motorized vehicles and the other is the motorcycle and bicycle ban. The former policy would have made the car ownership lower while the latter one would have encouraged people use public transportation. However, with higher levels of economic development, the number of automobiles has increased rapidly as shown in
Transcript of Yangon’s Urban Transportation: Traffic Demand and … Paper Yangon’s Urban Transportation:...
Working Paper
Yangon’s Urban Transportation: Traffic Demand and Its Quality of Service
Momoko KOJIMAa, Takayoshi FUTOSEb, Phan Le BINHc, and Hironori KATOd
a,b ALMEC Corporation, 5-5-3, Shinjuku, Shinjuku-ku, Tokyo 160-0022, Japan a E-mail: [email protected] b E-mail: [email protected] c Japan International Cooperation Agency, 5-25, Niban-cho, Chiyoda-ku, Tokyo 102-8012, Japan; E-mail: [email protected] d University of Tokyo, 7-3-1, Hongo, Bunkyo-ku, Tokyo 113-8656, Japan; E-mail: [email protected] Abstract: This paper reported the current traffic conditions in Yangon and discussed the issues with the mobility and the future direction of the urban transportation system. The achievements of the large-scale survey are so valuable that the traffic conditions have been successfully revealed for understanding the current problems and for planning the future transportation policy/network in Yangon. The evidence from these surveys are expected to contribute to the data-based approach in the urban transportation planning and decision-making process in Myanmar. Keywords: Motorcycle ban, bicycle ban, regulation on the import of used vehicle, Myanmar, person trip survey 1. INTRODUCTION Yangon, with a population of about 5.7 million as of 2013 (JICA, 2014), is the largest economic center in the Republic of the Union of Myanmar. It has experienced rapid urbanization and motorization along with the nation’s economic growth. The annual GDP growth rate in Myanmar is 6.7 % as of 2013 while the population in Yangon city has grown at an annual rate of 2.6 % from 1998 to 2011 (JICA, 2014).
The central business district (CBD) of Yangon city is located at the city’s southern part, adjacent to the confluence of the Yangon River and the Bago River. The CBD was developed during the British colonial period where the grid-based road network was first developed. As the urban population increased, the urban area was extended from the CBD to the north due to geographical constraints, mainly the two rivers running at the southern part of the city. In addition, transportation infrastructure including highway and rail networks had been also developed to connect the CBD with the northern part of Yangon city. The main residential areas are located in the northeastern part of the city from which many commuters travel to their workplaces in the CBD. The five main types of transportation modes that are available in Yangon are the private car, rail, taxi, rickshaw, and bus. The so-called truck bus is one of the most popular public transportation options for commuters in Yangon (Kato et al., 2010).
The government has introduced two unique transportation policies in Yangon city: one is the regulation of importing foreign second-hand motorized vehicles and the other is the motorcycle and bicycle ban. The former policy would have made the car ownership lower while the latter one would have encouraged people use public transportation. However, with higher levels of economic development, the number of automobiles has increased rapidly as shown in

Figure 1. As a result, traffic congestion that Yangon citizens have never experienced before arose in Yangon city. The local people have complained about the serious traffic congestion, air pollution, and poor safety in the Yangon city (JICA, 2013). The deteriorating urban transportation situation has become a serious concern in Yangon socially, politically, and environmentally. Although urban transportation is one of the most critical issues in Yangon city, it has been rarely reported or analyzed except in some ambitions studies (JICA, 2013; Zhang et al., 2008; Kato et al., 2011). This is mainly because of the difficulty in the collection of data. In our research, we surveyed urban transportation and person trips in Yangon as a part of the Project for Comprehensive Urban Transport Plan of Greater Yangon (YUTRA) by the Japan International Cooperation Agency (JICA), 2013.
This paper aims to reveal the unique traffic demand policies in Yangon and the Yangon citizens’ mobility. This paper is organized as follows: first, Section 2 introduces the outline of transportation surveys to collect the transportation data. Section 3 presents the two unique traffic policies and the effects using the results from the transportation surveys. Section 4 introduces citizen’s mobility with public transportation system in Yangon. Then, in Section 5, current issues on Yangon transportation are summarized. Finally, Section 6 shows conclusion and further issues. Note that this paper does not intend to develop a new method with regards to transportation surveys. It shows new evidences of Yangon’s urban transportation by applying a conventional approach rather than the development of a state-of-the-art approach. 2. DATA COLLECTION First, the YUTRA project team including the authors implemented eleven transportation/traffic surveys from February 2013 to August 2013 that included a large-scale person trip survey which had never been conducted in Yangon in the past. The surveys cover the Greater Yangon area as shown in Figure 2 and Table 1, including Yangon city and a part of the six adjacent townships: Thalyin, Hmawbi, Helgu, Htantabin, Twantay, and Kyauktan. The total survey area is approximately 1,500 km2 and the total population is about 5.7 million as of 2013. The outline of the eleven surveys is summarized in Table 2. The surveys intend to capture the travel patterns of local people, level of transportation services such as travel speed, traffic volume by
Note: Trawlergi is a kind of utility vehicles. Source: Road Transport Administration Department, as of July 4, 2013
Figure 1. Number of registered vehicles by type in Yangon city in 2013
Passenger Car
Two Wheeler
Truck (Light Duty)
Others
Truck (Heavy Duty)
Bus

transportation mode and the socio-economic attributes of trip makers including age, gender, occupation, car ownership, and income.
The YUTRA project team also collected necessary data and information regarding the existing transportation network, fare structure, institutions, financial system, etc., from local governments.
Additionally the YUTRA project team interviewed the traffic police agency to collect the traffic accident data in November 2013. This covers the annual traffic accidents by township, annual fatalities and injuries by township, and the type of vehicles involved in the traffic accidents by township.
Source: JICA (2014)
Figure 2. Study area of the project, the Greater Yangon
Table 1. Area and population of the YUTRA study area
Note: The survey area covers some parts of Dala and the Periphery Areas where the populations were estimated. Source: JICA (2014)
Sub-region Area (km2) Population (2013) CBD 6.9 252,535
Inner Urban Ring 37.8 852,441
Outer Ring 34.2 598,284
Northern Suburbs 185.2 841,061
Older Suburbs 49.4 784,018
South of CBD 110.5 172,976
New Suburbs 404.9 1,738,823
Periphery Area 705.8 475,961
Yangon city Total 828.9 5,240,137
Study Area Total 1,534.8 5,716,098
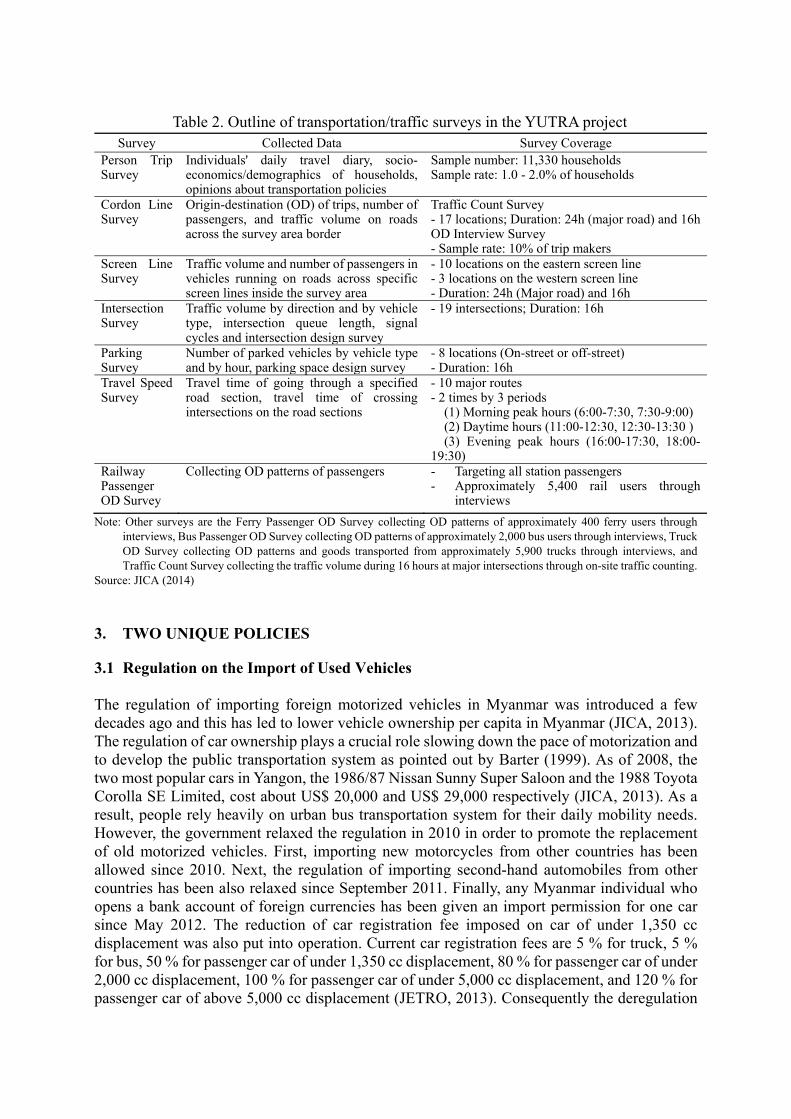
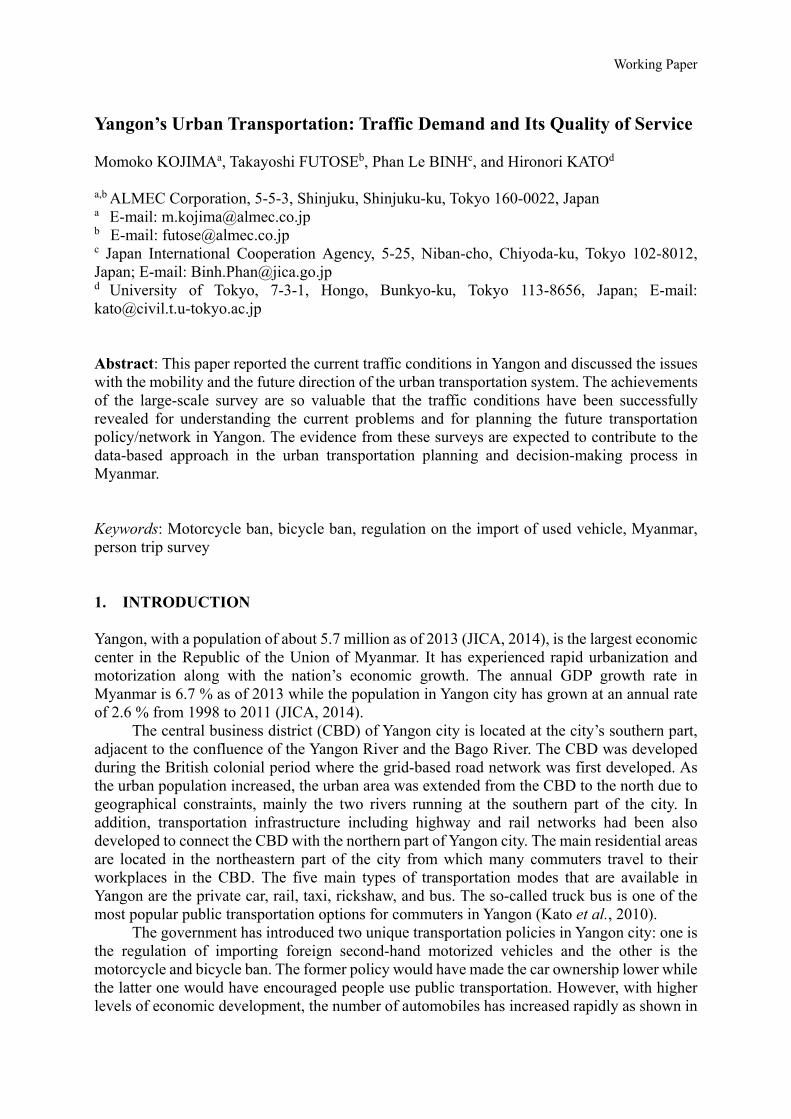
Table 2. Outline of transportation/traffic surveys in the YUTRA project
Note: Other surveys are the Ferry Passenger OD Survey collecting OD patterns of approximately 400 ferry users through interviews, Bus Passenger OD Survey collecting OD patterns of approximately 2,000 bus users through interviews, Truck OD Survey collecting OD patterns and goods transported from approximately 5,900 trucks through interviews, and Traffic Count Survey collecting the traffic volume during 16 hours at major intersections through on-site traffic counting.
Source: JICA (2014)
3. TWO UNIQUE POLICIES 3.1 Regulation on the Import of Used Vehicles The regulation of importing foreign motorized vehicles in Myanmar was introduced a few decades ago and this has led to lower vehicle ownership per capita in Myanmar (JICA, 2013). The regulation of car ownership plays a crucial role slowing down the pace of motorization and to develop the public transportation system as pointed out by Barter (1999). As of 2008, the two most popular cars in Yangon, the 1986/87 Nissan Sunny Super Saloon and the 1988 Toyota Corolla SE Limited, cost about US$ 20,000 and US$ 29,000 respectively (JICA, 2013). As a result, people rely heavily on urban bus transportation system for their daily mobility needs. However, the government relaxed the regulation in 2010 in order to promote the replacement of old motorized vehicles. First, importing new motorcycles from other countries has been allowed since 2010. Next, the regulation of importing second-hand automobiles from other countries has been also relaxed since September 2011. Finally, any Myanmar individual who opens a bank account of foreign currencies has been given an import permission for one car since May 2012. The reduction of car registration fee imposed on car of under 1,350 cc displacement was also put into operation. Current car registration fees are 5 % for truck, 5 % for bus, 50 % for passenger car of under 1,350 cc displacement, 80 % for passenger car of under 2,000 cc displacement, 100 % for passenger car of under 5,000 cc displacement, and 120 % for passenger car of above 5,000 cc displacement (JETRO, 2013). Consequently the deregulation
Survey Collected Data Survey Coverage Person Trip Survey
Individuals' daily travel diary, socio-economics/demographics of households, opinions about transportation policies
Sample number: 11,330 households Sample rate: 1.0 - 2.0% of households
Cordon Line Survey
Origin-destination (OD) of trips, number of passengers, and traffic volume on roads across the survey area border
Traffic Count Survey- 17 locations; Duration: 24h (major road) and 16hOD Interview Survey - Sample rate: 10% of trip makers
Screen Line Survey
Traffic volume and number of passengers in vehicles running on roads across specific screen lines inside the survey area
- 10 locations on the eastern screen line - 3 locations on the western screen line - Duration: 24h (Major road) and 16h
Intersection Survey
Traffic volume by direction and by vehicle type, intersection queue length, signal cycles and intersection design survey
- 19 intersections; Duration: 16h
Parking Survey
Number of parked vehicles by vehicle type and by hour, parking space design survey
- 8 locations (On-street or off-street) - Duration: 16h
Travel Speed Survey
Travel time of going through a specified road section, travel time of crossing intersections on the road sections
- 10 major routes- 2 times by 3 periods (1) Morning peak hours (6:00-7:30, 7:30-9:00) (2) Daytime hours (11:00-12:30, 12:30-13:30 ) (3) Evening peak hours (16:00-17:30, 18:00-19:30)
Railway Passenger OD Survey
Collecting OD patterns of passengers - Targeting all station passengers - Approximately 5,400 rail users through
interviews

of importing motorized vehicles has recently increased the number of registered passenger cars in the Yangon Region significantly from approximately 160,000 cars in 2011-12 to approximately 200,000 cars in 2012-13 as shown in Figure 1.
General Yangon citizen have a negative opinion of the regulation. The survey requested the respondents to answer a question: “Do you think the current limitation on the import of used vehicles should be continued?” The results show that half of the respondents disagreed with the regulation. As Figure 3 shows, 44 % of the respondents disagree the regulation of automobiles import. 58 % of the car owners do not think the regulation of automobiles import should be continued while 42 % of non-car owners disagree the regulation. Instead, there is no difference in the answers between high and low income households as shown in Figure 4. If the urban transportation policy is determined reflecting the opinions of local people, vehicle imports should be further deregulated; and this should lead to more demand of car usage in Yangon city. Traffic congestion will spread rapidly as dense cities such as Yangon motorize even if car use per capita remains low.
Interestingly, the result does not mean anyone who owns a car tends to disagree the regulation. 33 % of car owners agree the regulation while 24 % of respondents agree the regulation. The percentage of “Don’t know” of car owners and no car owners are 9 % and 34 % respectively. It suggests that the car owners tend to have a clearer attitude to the regulation, either positive or negative. Car owner can understand the number of car should be limited and understand the necessity. It implies that traffic demand management such as car
Source: JICA (2014) Note: The number of responses were expanded by the administrative ward in order to eliminate the unevenness of sample distribution.
Figure 3. The citizens’ opinion on the car import regulation in Yangon by car ownership
Source: JICA (2014) Note: The number of responses were expanded by the administrative ward in order to eliminate the unevenness of sample distribution.
Figure 4. The citizens’ opinion on the car import regulation in Yangon by monthly household income

ownership/usage control can be one of acceptable solutions in Yangon. Traffic congestion in Yangon will be mitigated if some traffic management policies are
introduced under the present condition, luckily at the beginning stage of motorization with the foundations for introducing the regulation of car ownership. However, Myanmar Government has deregulated the regulation of automobiles import as mentioned above. To make matters worse, Yangon Region Government or Yangon City Development Committee (YCDC), which should have responsibility of Yangon transportation, have no department in charge of transportation planning or traffic demand management. Further motorization will bring more traffic congestion, deterioration in traffic safety, and bad influences on daily economic activities if any effective measures are not taken. 3.2 Motorcycle and Bicycle Ban The motorcycle ban was introduced into Yangon city (31 townships only and areas south of the CBD, namely Dala and Seik Gyi Ka Naung Toe, were not included) in 2003 for reducing the number of traffic accidents in the Yangon city (Myanmar Times, 2014). Moreover, in addition to motorcycles, bicycles and any slow moving vehicles are prohibited in a part of the CBD and on some main roads such as Pyay Road, Kabaaye Pagoda Road, University Avenue Road, Uwizara Road, and around Kandawgyi Road as shown in Figure 5. The penalty is 20,000 Myanmar Kyats (MMK) (approximately 20 US$), and that for not wearing a helmet is 10,000 MMK (approximately 10 US$) (Myanmar Times, 2014).
As shown in Table 3, the ratio of registered motorcycles to registered vehicles in the Yangon Region is significantly lower than other states/divisions in Myanmar. This implies that motorcycles could be used more if the motorcycle and bicycle ban would be lifted in Yangon. More individuals may request a stoppage of the motorcycle and bicycle ban policy. Yangon citizens, however, have a positive opinion for the current motorcycle and bicycle ban policy unlike the vehicle import regulation. The person trip survey requested the respondents to answer a question: “Do you think the current limitation on the use of motorcycle in Yangon should be continued?” Figure 6 shows the results that 58 % of the respondents support the regulation that can impair the citizen’s convenience. Especially, the residents in the CBD and the surrounding areas tend to be in favor of the ban. It implies that people realize the motorcycle and bicycle ban improve traffic safety in the CBD. Figure 7 shows the answer by household income level in order to examine the effects on low income household’s mobility. There is no big difference
Source: Author made based on the interview from Traffic Police, 2014
Figure 5. Motorcycle and bicycle ban area in Yangon

in the answers between high income and low income levels. It suggests that motorcycle and bicycle are not critical issues for the Yangon citizens’ mobility. The possible reasons are first that public transportation connects CBD with the surrounding areas well and second that the lower income people who reside in the South of CBD across the Yangon River from CBD use entirely ferry to access CBD.
The motorcycle and bicycle ban should be respected as a challenging transportation policy. If only motorcycles had been prohibited, people would have used bicycles more as Deng et al. (2009) suggested. The ban used to work well for motivating the individuals who do not own cars to use public transportation. However, the effectiveness of the motorcycle and bicycle ban could be weaker under the current situation where the vehicle import regulation has been relaxed. It is feared that this may give an incentive for high income individuals to use private cars after relaxation of the vehicle import policy.
Table 3. Number of Registered Vehicles by State/Division in Myanmar (2010)
Source: JICA (2014) Note: The number of responses were expanded by the administrative ward in order to eliminate the unevenness of sample distribution.
Figure 6. The citizens’ opinion on the limitation on the use of motorcycle in Yangon by the residence area
State/Division Registered Vehicle
Registered Motorcycle
Registered Motorcycle/ Reg. Vehicle
Registered Vehicle/1000 Population
Mandaly Division 626,202 549,338 87.7% 75.0 Shan State 346,073 305,894 88.4% 61.2 Kachin State 80,953 70,016 86.5% 51.8 Kayah State 16,711 14,752 88.3% 48.0 Taninthayi Division 70,323 64,787 92.1% 41.6 Sagaing Division 252,986 237,225 93.8% 38.9 Yangon Division 253,904 50,401 19.8% 36.5 Mon State 103,119 92,586 89.8% 33.2 Myanmar Total 2,291,675 1,877,596 81.9% 38.5
Source: The Government of the Republic of the Union of Myanmar (2011)

Source: JICA (2014) Note: The number of responses were expanded by the administrative ward in order to eliminate the unevenness of sample distribution.
Figure 7. The citizens’ opinion on the limitation on the use of motorcycle in Yangon by the household income
4. MOBILITY 4.1 Bus Dominance
The distribution of modal share demonstrates that Yangon is a public transportation oriented city as shown in Figure 8. Especially, bus is the dominant transportation mode. The modal share of public transportation is 61 % and is composed of bus (49 %), taxi (8 %), rail (1 %), and water ferry (3 %); while that of private transportation is 8 % for cars/vans, 7 % for motorcycles and 23 % for bicycle. It is highly distinctive that rail, one of the mass transit systems in Yangon, accounts for the lowest share among all of the modes. It should be also noted that the modal share of motorcycles in Yangon is lower than other typical developing cities in Southeast Asia because the motorcycle has been prohibited in Yangon city (Hyodo et al., 2005: Koizumi et al., 2013).
Figure 9 shows the hourly distribution of departure times by travel mode. It reveals two peaks at around 7:00 am to 8:00 am and at around 5:00 pm. In addition, the number of trip departure decreases once at 10:00 am but once again increases slightly at 11:00 am. This is because most local schools have two shifts during a day in Yangon where the second course starts at 11:00 am. Buses are used almost constantly throughout the day while other transportation modes are used mainly at peak hours. This proves that travelers use bus services from early morning to late evening.
Figure 10 shows that the modal share by car ownership and by monthly household income. First, the modal share of bus is the highest at any income level in the non-car owner sub-group. Bicycle has the second highest share while the richer household tends to use taxi than bicycle. Since the lower income household cannot afford to pay the taxi fare, bicycle is reckoned to play an alternative to taxi.
In the car owner sub-group, the modal share of car/van is the highest at almost all income levels. On the other hand, the modal share of buses in the car owner sub-group still keeps 31 %. They use public transportation services even though they own cars: first because they use their cars not only for personal use but for commercial use such as taxi services, and second because few household members have their own car licenses, and finally because they often do not like
to spend money fueling up.
0
100,000
200,000
300,000
400,000
500,000
600,000
700,000
800,000
900,000
1 2 3 4 5 6 7 8 9 10 11 12 13 14 15 16 17 18 19 20 21 22 23 24
NU
MBE
R O
F TR
IPS
DEPARTURE TIME without WALK
OthersRailwayTruckBusTaxiCarMotorcycleBicycle
Railway
Bus
Taxi
MotorcycleBicycle
Others
Car
Source: JICA (2014)
Figure 8. Modal share excluding walk in Yangon (2013)
Figure 9. Distribution of departure time by travel mode in Yangon
Bicycle Car/VanMotorcycle Taxi Bus
Source: JICA (2014) Figure 10. Modal share excluding walk in Yangon by vehicle ownership and household
income level
Source: JICA (2014)

4.2 Travel Characteristics
Table 4 shows the modal share, travel time, and vehicle occupancy based on the person trip survey, screen line survey, and cordon line survey. The total trips are approximately 11 million on a weekday. The daily trip rate, which is defined as the daily trips divided by population, is 2.04 in a weekday. The average daily trip rate of males is 2.20 while that of females is 1.90. Travel time is estimated to be about 31.6 minutes on average. Note this was estimated using a weighted average of observed travel times by travel mode collected from the sample-based OD interview survey with the modal share collected from the person trip survey.
The average trip length of males is 6.44 km/trip and that of females is 5.65 km/trip. Note that they exclude short trips within zones whose lengths do not vary much between males and females. The modal share of the bus are about 30 % for both male and female travelers. 51.6 % of female travelers walk while 33.0 % and 16.6 % of male travelers walk and ride bicycles, respectively. The modal share of walking by female travelers aged between 19 and 59 is 47.8 %, which is much higher than that of male travelers (22.0 %). This is probably because fewer female workers commute to workplaces mainly located at the CBD and/or less females are involved in economic activities (JICA, 2013; Myanmar Government, 2010). Note that male and female workers in Yangon are 1,140,000 and 460,000, respectively as of 1990 (Myanmar Government, 2010); and male and female driving license holders are 620,383 and 55,999, respectively according to our interview with the Traffic Police in 2014.
The non-motorized modes account for over 70 % out of total trips for the individuals in the 5–18 age subgroups of both males and females, which is much higher than the average modal share of the non-motorized transportation mode (55.2 %). This is because the driving license for cars and motorcycles is not available for those who are under 18 years old.
Table 4. Travel time, modal share, and vehicle occupancy in Yangon by travel mode
Note: SLS denotes the Screen Line Survey and CLS denotes the Cordon Line Survey. “-” denotes no results. Source: JICA (2014)
Mode
Vehicle Occupancy (Passenger/Car)
Travel Time (min)
Modal Share (%) All Male (%) Female (%)
SLS CLS 5-18 19-59 60+ Total 5-18 19-59 60+ Total Walk - - 12.7 42.2 56.6 22.0 42.9 33.0 58.9 47.8 62.6 51.6Bicycle 1.14 1.71 16.2 13.0 18.0 16.8 12.6 16.6 12.2 8.5 7.8 9.4Motorcycle 1.45 1.94 15.2 4.2 3.1 7.4 2.9 5.8 2.6 2.5 2.9 2.6Car /Van
Passenger Car 2.22 2.86 36.8 4.7 2.4 7.2 8.7 6.2 2.1 3.4 4.3 3.1
Van 2.89 5.48
Taxi 2.30 5.10 39.4 4.4 0.5 7.6 6.0 5.6 0.9 3.7 6.4 3.2
Bus
Passenger Truck 18.60 12.84
39.7 28.5 17.9 34.4 23.6 29.0 22.1 31.6 14.6 28.0Small Bus 24.09 19.27 Large Bus 43.03 25.34
Truck
Pick Up 2.41 3.52
34.5 0.8 0.3 1.4 1.3 1.1 0.3 0.5 0.4 0.4Med. Truck 4.31 3.19 Large Truck 2.42 2.60 Trailer 2.38 2.57
Railway - - 33.5 0.6 0.3 0.8 1.1 0.7 0.2 0.7 0.5 0.6Water Ferry - - 45.8 1.4 0.9 2.3 0.9 1.8 0.8 1.2 0.5 1.1Others - - 40.9 0.1 0.1 0.2 0.1 0.2 0.0 0.1 0.1 0.1Total - - 31.6 100 100 100 100 100 100 100 100 100

Source: JICA (2014)
Figure 11. Trip distance and distribution in Yangon by travel mode
Finally, the cordon line survey, which collected the traffic data at the survey area borders, shows that the average vehicle occupancy of passenger cars/vans is 2.30 and that of taxis is 5.10 while the screen line survey, which collected the traffic data inside the survey area, shows that the average vehicle occupancy of passenger cars/vans is 2.22 and that of taxis is 2.86. High vehicle occupancy of taxis at the cordon line is probably because the public transportation service is so poor that individuals commuting from the suburbs to the CBD share the taxi service in the suburbs but they can change to using public transportation inside the city.
The average trip distances of all motorized vehicles, motorcycles, passenger cars, public transportation, and taxis are 9.25 km, 7.08 km, 7.70 km, 10.89 km, and 8.56 km, respectively. The trip distance of public transportation is longer than others because public transportation is used mainly for commuting from suburban areas to the CBD. Figure 11 illustrates that the motorcycle is used for traveling from one outskirt area not to the CBD but to other outskirt areas. This is mainly because the motorcycle is prohibited from entering the CBD due to the government’s regulation. Some motorcycle trips are observed even in the regulated area. This is probably because regulation of motorcycles inside the CBD is not strictly enforced. The trip distribution of passenger cars shows that many car users travel from outskirt areas in the northern part of the city to the CBD. The trip distribution of taxis is similar to that of the passenger car and public transportation. This may mean that the taxi is used instead of the private car rather than as a complement to public transportation. This could suggest that the motorcycle ban encourages lower income households to use public transportation while it also promotes higher income households to use their own cars. 4.3 Accessibility to Public Transportation 4.3.1 Coverage, Level of Service, and Fare System The four main types of public transportation modes are available in Yangon, namely the rail, ferry, taxi, and bus as summarized in Table 5. As mentioned above, bus is the main workhorse of public transportation in Yangon. The number of bus daily passengers (approximately two million and six hundred thousand) is the highest among the four public transportation modes. The second highest is the rail which transport only one hundred seventy six thousand passengers.
Rail fare used to be 20 MMK (approximately 0.02 US$) and it was raised to 100 MMK (approximately 0.10 US$) in November 2011. Ferry fare is also 100 MMK (approximately 0.10 US$). Bus operators introduces two bus fare systems, namely flat fare and distance-based fare systems which range from 200 to 300 MMK (approximately 0.20-0.30 US$) and from 50 MMK

(approximately 0.05 US$) to 300 MMK (approximately 0.30 US$) respectively. Basically, individual bus operators under bus supervision commettees introduce the distance-based fare system while private bus companies introduce both the flat fare and the distance-based fare systems (JICA, 2013).
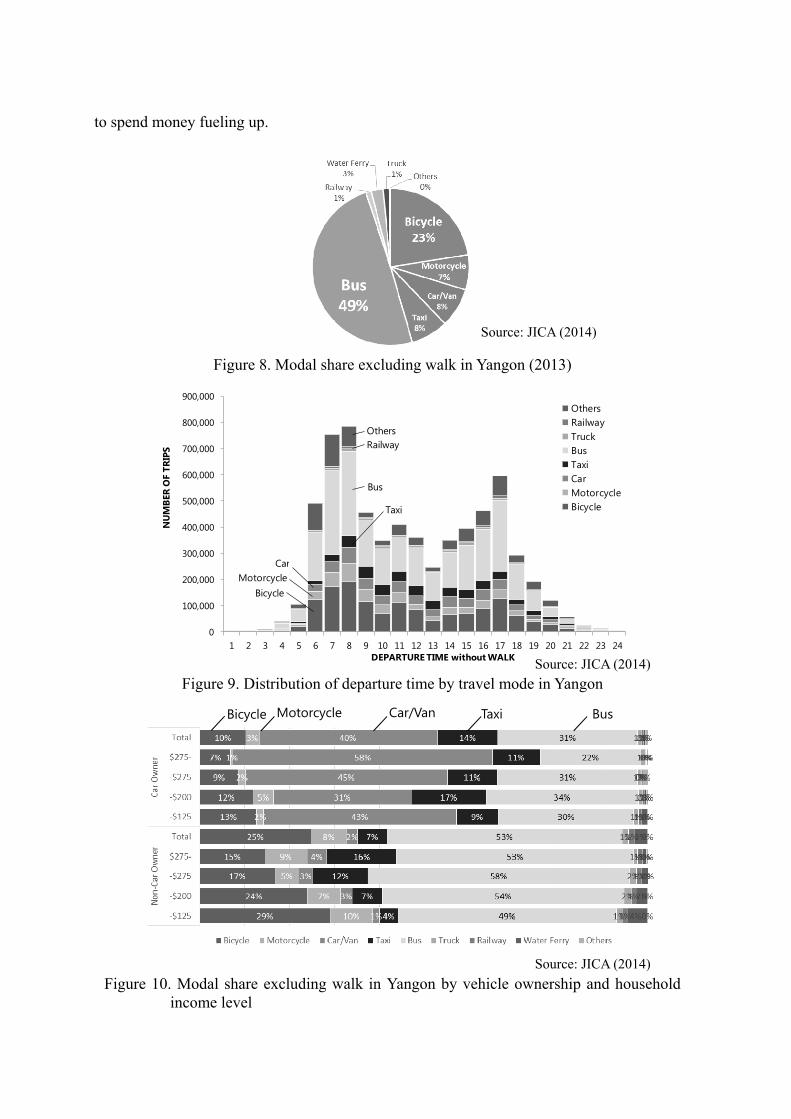
Figure 12 shows existing bus routes in Yangon. They run mainly along arterial roads, such as No. 1 Main Road, No. 3 Main Road, Pyay Road, and Bayint Naung Road. 6,473 buses are running in 389 routes in Yangon, provided by both public and private operators as of January 2013. Various types of vehicles ranging from conventional buses to converted light trucks and pickups are used for bus services. All buses run using Compressed Natural Gas (CNG), following the 2005 government decree to save money on imported petroleum (JICA, 2013). Every types of bus vehicle is old and they are imported from foreign second-hand bus markets (JICA, 2014). Note that the converted light truck bus fleets have been forbidden to run in the CBD since February 2010.
As reported by Kato et al. (2010) and JICA (2013), the urban bus transportation has a number of problems, such as poor/old bus vehicles, inadequate bus network, and unsatisfactory provision of service information as mentioned later. These problems cause the low quality of bus service. Since buses are mainly imported, second hand units from Japan and Korea, they are already old and poorly maintained. This situation is attributed to lack of resources, principally funding, as well as to inadequate workshop facilities, tools, equipment, and difficulties in obtaining spare parts. The shortage of mechanical skills due to poor educational standards and limited training facilities also contribute to poor maintenance of vehicles and equipment. This adversely affects safety and reliability of bus transportation and results in very high operating costs.
The current railway network and number of daily trains are illustrated in Figure 12. It is composed of eight lines, which include three main lines: the Yangon Circular Railway, Yangon-Mandalay Main Line and the Yangon-Pyay Main Line, and five branch lines including one exclusive freight rail line. The total length is 138.4 km and 56 stations are for passenger usage. 200 services are operated daily by Myanmar Railways and the Ministry of Rail Transportation. Yangon Circular Railway, which runs through the mostly urbanized area of Yangon, is used by mainly two types of commuters; relatively low income earners and poor farmers who bring their cultivated products from the northern part of Yangon City to sell in the CBD, according to the railway passenger OD survey. It seems that high to middle income people seldom use rail due to the low frequency, low punctuality, low comfortability, poor feeder service, and slow speed in spite of the low fare.
Table 5. Outline of public transportation in Yangon
Fare
No. of Daily
PassengerNote
Bus 50-300 MMK
(0.05-0.30 US$) 2,662,215
- 6,473 buses running along 389 routes - Bus fleets are imported from foreign second-hand bus markets.
Rail 100 MMK (0.10 US$)
176,000
- 56 stations in 8 lines (138.4km) - 200 services are operated daily - The average travel speed is only 5-10 km/h in other suburban lines due to poor track conditions.
Ferry 100 MMK
(0.10 US$) 35,870
Taxi 1,000 MMK or higher
(1.00 US$ or higher) Not
Available- The fare is subject to negotiation.
Source: JICA (2014)
Source: JICA (2014)
Figure 12. Existing bus and railway networks in Yangon
4.3.2 Transit Usability Although both rail and bus networks look covering well whole Yangon city, there is no connection between bus stops and rail stations except for some transfer stations such as Yangon Central Station. There is no space in front of the stations for taxis waiting for passengers. Railway Passenger OD survey reveals that most passengers need to walk to/from the stations as shown in Figure 13. Over 70 % of passengers access/egress the stations on foot in Yangon, which is much higher than that of Jakarta which has also a well-developed bus network like Yangon, as shown in Figure 14.
Sufficient information is hardly provided for passengers to access bus network. It is observed that the majority of bus stops mainly set by Yangon City Development Committee (YCDC) do not provide bus stop sign on a pole or flag in order to avoid passenger confusion as shown in Figure 15. Moreover, bus stop lay-bys are not also provided to enable buses to stop out of the traffic stream. Other bus stop infrastructure such as shelters, seating facilities for passengers waiting at bus stops are also limited except for some bus stops. Passengers complain about crowded bus and long waiting time at bus stops in the evening while they are relatively satisfied with the fare and the bus stop accessibility (JICA, 2013).
Most of small stations in the Yangon circular railway have no building except for small ticket counter. Large stations with several track sidings for express trains and freight trains have buildings with ticket counter, retail stores, etc. All rail stations have low-height platform in the Yangon circular railway and the suburban lines. The low-height platform may be still suitable at the stations in the rural area which has smaller number of trains and sufficient time for boarding/alighting as shown in Figure 16. Information of the rail network and the timetable are provided in each station. The trains are not operated punctually because of the manually operated crossing and slow down caused by poor track condition. The maximum travel speed is approximately 25-30 km/h even in the sections of relatively good track conditions, whereas
Bus Railway
No. of Bus Route

the maximum travel speed is only 5-10 km/h in other suburban lines due to poor track conditions. Travel time to make a round trip along the Yangon Circular Railway (47.5 km) is approximately three hours, which means the travel speed is approximately 15 km/h on average (JICA, 2014).
Source: JICA (2014)
Figure 13. Access/egress mode to/from rail station in Yangon
Source: JICS SITRAMP Home Visit Survey in Year 2002; JICA (2014); Public Transportation Census 2010,
Ministry of Land, Infrastructure, Transport and Tourism Japan
Figure 14. Access/egress mode to/from rail station in selected Asian cities
Note: (Left to right) typical bus stop, people taking of alighting the bus on road, people getting on board the
bus near an intersection Source: JICA (2014) and author
Figure 15. Typical bus stop and passenger behavior in Yangon
Foot Bicycle Motorcycle Car/Van
Taxi Bus
Foot Bicycle Motorcycle Car/Taxi Bus

Note: (Upper left to right) Station entrance, typical platform, low platform level, (Lower left to right) Time table on the wall, electric bulletin board in Yangon central station
Source: Author Figure 16. Typical rail station facilities in Yangon
4.4 Traffic Congestion 4.4.1 Travel speed The Travel Speed Survey revealed that the average travel speed along major roads connecting suburbs with the CBD varies from 20 to 40 km/h. For example, the average travel speed from the CBD to the suburbs along Pyay Road, Land Thit Road, and Bogyoke Aung San Road at 7:30 am–9:00 am, 12:30 am–1:30 pm, and 6:00 pm–7:30 pm are 15.3 km/h, 25.2 km/h, and 17.8 km/h, respectively whereas the average speed from the CBD to the suburbs along the above roads at 7:30 am–9:00 am, 12:30 am–1:30 pm, and 6:00 pm–7:30 pm are 32.9 km/h, 30.9 km/h, and 17.7 km/h, respectively. The outbound traffic from the CBD suffers from serious traffic congestion during evening peak hours while the inbound traffic to the CBD suffers from traffic congestion during both morning and evening peak hours. The inbound traffic congestion during the evening peak hours may be due to the poor traffic management and low capacity of intersections. 4.4.2 On-street Parking The Parking Survey revealed that off-street parking spaces are not readily available except in the newly constructed offices and commercial buildings. Although on-street parking is not allowed on 26 roads in Yangon city such as Pyay Road, Kabar Aye Pagoda Road, Bayln Naung Road, Strand Road, Baho Road, and Insen Road, it is often observed such as occupation of one lane, double parking by multiple parked cars, and on-street parking adjacent to intersections. These types of on-street parking could cause serious traffic congestion and traffic accidents.
On-street parking is observed typically at the following sites: (1) at schools where private cars and school buses stop near the school gate for escorting and picking up the school children. There are two peak hours of on-street parking demand at schools: in the morning and at noon, because most schools in Myanmar adopt a half-day school schedule in which two courses are provided at the same school during the day; (2) at major hospitals where the capacity of off-
street parking spaces is insufficient. High-income car users typically access these major hospitals; (3) at shopping centers and retailers where many taxis and pick-up cars compete for parking spaces near the entrances; (4) at auto dealers where many cars are displayed on the roadside; and (5) at religious facilities such as pagodas and mosques where many taxis and passenger trucks are waiting for visitors on the roadside.
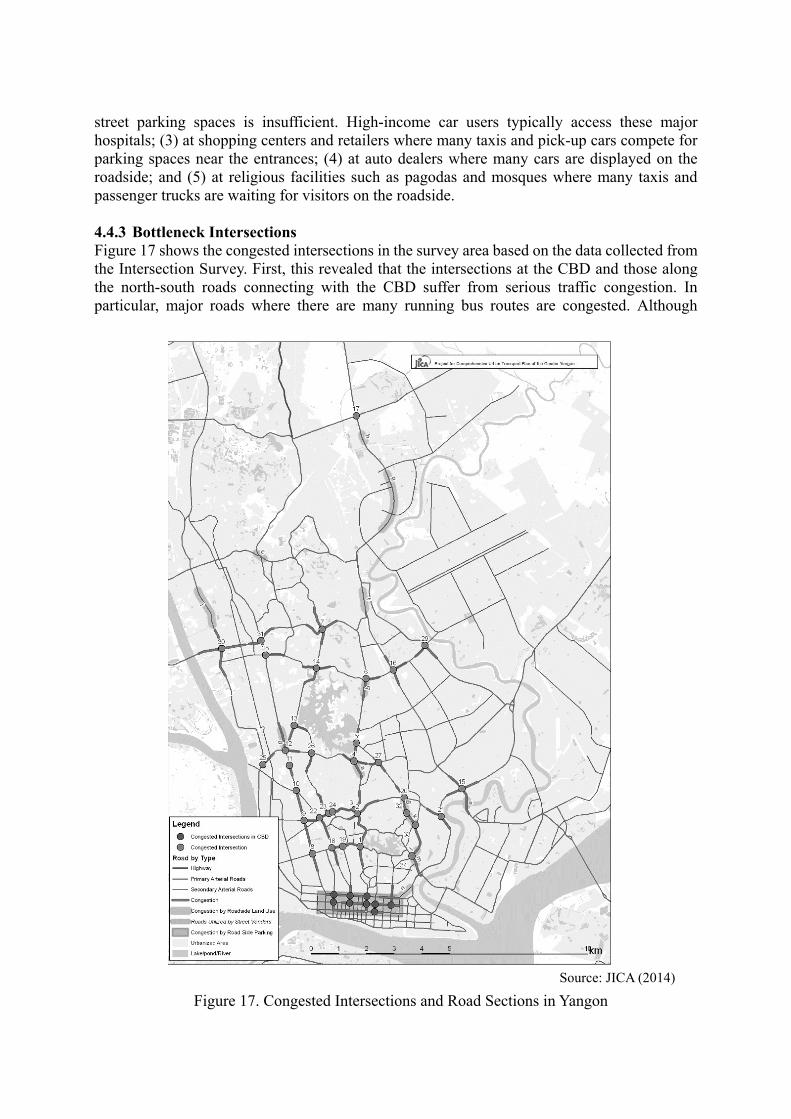
4.4.3 Bottleneck Intersections Figure 17 shows the congested intersections in the survey area based on the data collected from the Intersection Survey. First, this revealed that the intersections at the CBD and those along the north-south roads connecting with the CBD suffer from serious traffic congestion. In particular, major roads where there are many running bus routes are congested. Although
Source: JICA (2014)
Figure 17. Congested Intersections and Road Sections in Yangon

alternative routes may be available, they are rarely used because they are poorly paved or because they are not equipped with bridges to cross over the rivers. Second, two intersections near the bridges, No. 15 and 30 are also traffic bottlenecks. Both of them are located along roads connecting the suburban industrial areas with the CBD. Additionally a logistics center is located at the area around intersection No. 30, from which much traffic is generated and this causes traffic congestion at this intersection. Third, detailed investigations at 19 major intersections in Yangon city revealed that the saturation rates of eight intersections are over 0.85 during peak hours, which means that those intersections are heavily congested. The observation results also showed that the main reasons for traffic congestion are jaywalking of pedestrians, road construction, boarding and alighting of buses, and on-street parking near intersections. 4.5 Road Safety Table 6 shows the past trend of road accidents in 33 townships of Yangon by vehicle type, which were collected from interviews with the local police agency. This shows no significant tendency in the total number of accidents despite the increase of car ownership from 2008 to 2011. Both bus and private car are largely responsible for the fatal and injured traffic accidents as shown in Figure 18. Over 70% of the road traffic accidents with both fatalities and injuries were caused by buses and private cars each year. Fatal traffic accidents from buses and private cars account for 30 % and 43 %, respectively while injuries from traffic accidents from buses and private cars account for 45 % and 37 %, respectively in 2011. Figure 19 illustrates the accident-prone vehicle type in 2011. It is bus that caused 51.7 fatal accidents per 10,000 vehicles and 697.5 injuries from accidents per 10,000 vehicles, which are approximately five times more than the average number of fatal accidents (9.7) and eight times more than the average number of injuries from accidents (85.6) in 2011.
Drivers’ manners are comparatively good in a case of passenger cars. However, major reasons of the traffic accidents reported by the Traffic Police are the driver’s carelessness (55.6 %) and violation of traffic regulations by pedestrians (14.9 %) as of 2010 (The Government of the Republic of the Union of Myanmar, 2011). The problem is that buses, which often occupy one lane to pick up passengers alongside, occasionally standby for a long time until the bus is full. As discussed in 4.3.1, it is considered that the breakdown of aging bus fleet causes to increase the accidents rate. There was a bus explosion incident in September 2008 while the bus was in operation. The cause of the explosion was due to a faulty re-fitting of the bus to run on CNG instead of petrol or diesel that led to the explosion in gas tanks of the bus (JICA, 2013). The pedestrian priority rule is not strictly observed; therefore, crossing roads is often dangerous for pedestrians (JICA, 2013). In order to reduce the number of accidents, measures such as construction of pedestrian crossing bridges to separate vehicles and pedestrian movements, and establishment of bus bays are necessary in addition to traffic safety education.
Table 7 shows the number of road traffic accidents by sub-region as of 2011. First, the highest accident rate per 10,000 population is observed in the Northern Suburbs, followed by the Outer Ring Zone and by the CBD. This is because major corridors connecting with the CBD are running through these sub-regions with large traffic volumes. Next, the highest accident rate per square kilometer is observed in the CBD, followed by the Outer Ring Zone and by the Inter Ring Zone. This is simply because the road network is so dense that traffic accidents often occur in the area.

Table 6. Number of Road Traffic Accidents and Those per 10,000 Vehicles in Yangon by Vehicle Type from 2008 to 2011
Source: Interviews with the Traffic Police, Ministry of Home Affairs
Table 7. Number of Accidents in Yangon by Sub-region (2011)
Note: n.a. denotes not available. Source: Interviews with the Traffic Police, Ministry of Home Affairs
5. CURRENT ISSUES OF YANGON’S TRANSPORTATION Urban transportation problems in Yangon identified from the above large-scale surveys consist of the components typically observed in many other developing cities (Morichi and Acharya, 2012): traffic congestion, long travel time, poor public transportation service, mobility gap between high and low income individuals, low accessibility to public transportation, and serious traffic accidents. Major reasons for these problems can be summarized as follows: (1) the urban
Vehicle Type Fatal Injured 2008 2009 2010 2011 2008 2009 2010 2011
No. of
Accidents
Taxi 5 8 7 12 109 112 96 153Bus 64 63 71 61 609 778 501 823Private Car 58 98 65 90 358 597 504 679Container 19 26 23 35 66 99 91 142Others 7 11 9 10 43 33 59 33Total 153 206 175 208 1185 1619 1251 1830
No. of
Accidents P
er
Taxi 3.6 5.6 4.9 7.4 78.2 79 67.3 94.9Bus 59.5 59.1 63.2 51.7 566.5 730.0 446.1 697.5Private Car 4.6 7.4 4.6 6.1 28.2 45.0 35.7 46.0Container 8.1 10.7 8.6 13.0 28.0 40.6 34.0 52.8Others 7.0 10.7 8.0 8.8 43.2 32.1 52.3 28.9Average 8.3 10.7 8.6 9.7 64.1 84.3 61.1 85.6
Sub-region Per 10,000 pop. Per km2
CBD 5.11 18.0 Inner Urban Ring 4.35 6.0 South of CBD n.a. n.a. Older Suburbs Zone 2.07 3.2 Outer Ring Zone 5.30 8.7 Northern Suburbs 6.68 3.1 New Suburbs Zone 3.20 1.2 Total 3.96 2.6
Source: Interviews with the Traffic Police, Ministry of Home Affairs
Figure 18. Number of traffic accidents in Yangon by type (2011)
Figure 19. Number of traffic accidents per 10,000 vehicle in Yangon by type (2011)

travel demand has been growing fast due to the rapid economic development and population increase, (2) the capacity of road infrastructure is too low to handle the rapid growth of urban travel demand, (3) the rapid sprawl of the urban area increases the travel distance and travel time particularly for commuting to the CBD, (4) the public transportation service is not well organized and the public transportation infrastructure has been poorly invested in, (5) motorized travel modes are not readily available for low and middle income classes while they are highly available for the high income class, and (6) the transportation related education/knowledge is not well known among drivers and pedestrians.
Although there are many similarities in the urban transportation problems of Yangon to other developing cities, the following uniqueness of the recent history and transportation policy in Yangon should be noted: first the motorcycle and bicycle ban policy has led to a public transportation oriented city where bus service was widely used for accessing the CBD; second the regulation of vehicle imports has reduced the car ownership in Yangon and this also contributed to a high modal share of public transportation, which is approximately 61 % in public transportation. Note that the modal share of public transportation is 59 % in Manila as of 1996, 21.5 % in Surabaya as of 1996, and 6.2 % in Hanoi as of 2005 (JICA, 1996; Koizumi et al., 2013); third the deregulation of vehicle import constraints has also stimulated car usage in Yangon; and finally the recent lift of economic sanctions from the international community has started to boost Yangon’s economy, which has escalated the traffic demand growth, and as a consequence, the effectiveness of those unique policies may be questionable due to the recent rapid changes in socio-economics and socio-demographics.
Under the situation that the travel demand continues to increase at a high growth rate, solutions to the urban transportation problems in Yangon may be challenging. One of the reasons is that no government department is in charge of transportation planning. Lack of transportation planning capacity often causes poor coordination among transportation modes. This may be one of typical issues in developing countries. For example, MRT3 stations in the Philippines were designed without any space for passengers to transfer railway to bus. This led to long lines waiting for rail passengers under the stations and make traffic congestion worse along the EDSA Street. The government’s capacity of implementing appropriate transportation policies may also be poor in Myanmar. In addition, the Myanmar Government which allocates the public budget to the transportation sector has poor technical skills and knowledge about innovative financial methods for raising funds for infrastructure development. 6. CONCLUSION This paper reported the current traffic conditions in Yangon and discussed the issues with the mobility and the future direction of the urban transportation system. The achievements of the large-scale survey are so valuable that the traffic conditions have been successfully revealed for understanding the current problems and for planning the future transportation policy/network in Yangon. The evidence from these surveys are expected to contribute to the data-based approach in the urban transportation planning and decision-making process in Myanmar.
Further issues are summarized as follows: first a long-term urban transportation plan of Yangon should be officially developed by the Government. Note that the JICA has already proposed it through the YUTRA project; second, the institutional system for implementing the long-term transportation investment and management should be established. This may include the introduction of a new organization who is responsible for the implementation; and finally, the financial scheme for funding the transportation projects should be set up. This may include a new taxation system for transportation investment such as gas tax and a value capture system

using the property tax of the real estate adjacent to the public transportation facilities. ACKNOWLEDGEMETNS A series of local surveys were implemented under the support of the Ministry of Rail Transportation, Ministry of Transport, Myanmar Railways, Public Works under the Ministry of Construction, Traffic Police under the Ministry of Home Affairs, Yangon City Development Committee, and Yangon Region Government. We sincerely thank them for their kind support. REFERENCES Barter, P. A. (1999) An International Comparative Perspective on Urban Transport and Urban
Form in Pacific Asia: the Challenge of Rapid Motorisation in Dense Cities. Doctoral Dissertation, Murdoch University.
Deng, X., Xu, J., Wang, B. (2009) Traffic countermeasures research for Guangzhou City in traffic mode transferring period after “motorcycle forbidden ban effect.” Journal of Transportation Systems Engineering and Information Technology, 9(4), 145-150.
Hyodo, T., Montalbo, Jr. C. M., Fujiwara, A., Soehodho, S. (2005) Urban travel behavior characteristics of 13 cities based on household interview survey data. Journal of the Eastern Asia Society for Transportation Studies, 6, 23–38.
Japan External Trade Organization (JETRO) (2013) The Myanmar’s systems regarding export from Japan. http://www.jetro.go.jp/world/asia/mm/qa/01/04A-021209, last accessed on July 4, 2015. (in Japanese)
Japan International Corporation Agency (JICA) (1996) Metro Manila Urban Transportation Integration Study (MMUTIS), Tokyo.
Japan International Corporation Agency (JICA) (2013) Project for the Strategic Urban Development Plan of the Greater Yangon (SUDP), Tokyo.
Japan International Corporation Agency (JICA) (2014) Draft Report of Project for Comprehensive Urban Transport Plan of the Greater Yangon (YUTRA), Tokyo.
Kato, H., Saito, N., Inagi, A., Myint, U. A. (2010) Regulatory framework and operational system of urban bus transportation in Yangon, Myanmar, Paper presented at the Transportation Research Board 2010 Annual Meeting, Washington D. C. (U. S.), January, 2010.
Kato, H., Inagi, A., Saito, N., Htun, P. T. T. (2011) Feasibility analysis for the introduction of a bus rapid transit system in Yangon, Myanmar. Journal of the Eastern Asia Society for Transportation Studies, 9, 914–929.
Koizumi, Y., Nishimiya, N., Kaneko, M. (2013) Urban transportation characteristics and urban mass transit introduction in the cities of developing countries. Journal of the Eastern Asia Society for Transportation Studies, 10, 81–99.
Morichi, S., Acharya, S. R. (ed.) (2012) Transport Development in Asian Megacities: A New Perspective. Springer, Heidelberg.
Myanmar Times (2014) Ban on motorbikes lingers, 4 July 2014. http://www.mmtimes.com/index.php/special-features/162-wheels-2013/5788-ban-on-motorbikes-lingers.html, last accessed on July 4, 2015.
The Government of the Republic of the Union of Myanmar (2011) Myanmar Data. CD-ROM. 2010, Nay Pyi Taw, Myanmar.
Zhang, J., Fujiwara, A., Thein, S. (2008) Capturing traveler’s stated mode choice preferences under influence of income in Yangon city, Myanmar. Journal of Transportation Systems Engineering and Information Technology, 8(4), 49–62.