Yan Y. Kagan
33
Yan Y. Kagan Dept. Earth and Space Sciences, UCLA, Los Angeles, CA 90095-1567, [email protected], http://scec.ess.ucla.edu/ykagan.html Rules of the Western Pacific Natural Laboratory April 23, 2007 //moho.ess.ucla.edu/~kagan/CSEP04_0
-
Upload
boris-pickett -
Category
Documents
-
view
52 -
download
0
description
Yan Y. Kagan Dept. Earth and Space Sciences, UCLA, Los Angeles, CA 90095-1567, [email protected], http://scec.ess.ucla.edu/ykagan.html. Rules of the Western Pacific Natural Laboratory April 23, 2007. http://moho.ess.ucla.edu/~kagan/ CSEP04_07.ppt. - PowerPoint PPT Presentation
Transcript of Yan Y. Kagan

Yan Y. Kagan
Dept. Earth and Space Sciences, UCLA, Los Angeles, CA 90095-1567, [email protected],
http://scec.ess.ucla.edu/ykagan.html
Rules of the Western Pacific Natural Laboratory
April 23, 2007
http://moho.ess.ucla.edu/~kagan/CSEP04_07.ppt

Stochastic models of earthquake occurrence and forecasting
• Long-term models for earthquake occurrence, optimization of smoothing procedure and its testing (Kagan and Jackson, 1994, 2000).
• Empirical branching models (Kagan, 1973a,b; Kagan and Knopoff, 1987; Ogata, 1988, 1998; Kagan, 2006).
• Physical branching models – propagation of earthquake fault is simulated (Kagan and Knopoff, 1981; Kagan, 1982).

LiteratureKagan, Y. Y., 1973. Statistical methods in the study of the seismic process
(translated from Russian by D. Vere-Jones; with discussion: comments by M. S. Bartlett, A. G. Hawkes, and J. W. Tukey), Bull. Int. Statist. Inst., 45(3), 437-453.
Kagan, Y. Y., 1973. A probabilistic description of the seismic regime, Izv. Acad. Sci. USSR, Phys. Solid Earth, 213-219, (English translation).
Kagan, Y., and Knopoff, L., 1977. Earthquake risk prediction as a stochastic process, Phys. Earth Planet. Inter., 14, 97-108.
Kagan, Y. Y., and Knopoff, L., 1987. Statistical short-term earthquake prediction, Science, 236, 1563-1567.
Molchan, G. M., and Y. Y. Kagan, 1992. Earthquake prediction and its optimization, J. Geophys. Res., 97, 4823-4838.

LiteratureKagan, Y. Y., and D. D. Jackson, 1994. Long-term probabilistic forecasting of
earthquakes, J. Geophys. Res., 99, 13,685-13,700.
Jackson, D. D., and Y. Y. Kagan, 1999. Testable earthquake forecasts for 1999, Seism. Res. Lett., 70, 393-403.
Kagan, Y. Y., and D. D. Jackson, 2000. Probabilistic forecasting of earthquakes, (Leon Knopoff's Festschrift), Geophys. J. Int., 143, 438-453.
Kagan, Y. Y., Y. F. Rong, and D. D. Jackson, 2003. Probabilistic forecasting of seismicity, Chapter 5.2 in "EARTHQUAKE SCIENCE AND SEISMIC RISK REDUCTION", eds. F. Mulargia and R. J. Geller, pp. 185-200, Kluwer, Dordrecht.
Kagan, Y. Y., and D. D. Jackson, 2006. Comment on `Testing earthquake prediction methods: "The West Pacific short-term forecast of earthquakes with magnitude MwHRV >= 5.8"' by V. G. Kossobokov, Tectonophysics, (TECTO), 413(1-2), 33-38.

Kagan, Y. Y., 1973. Statistical methods in the study of the seismic process (translated from Russian by D. Vere-Jones; with discussion: comments by M. S. Bartlett, A. G.
Hawkes, and J. W. Tukey), Bull. Int. Statist. Inst., 45(3), 437-453.

Kagan, Y. Y., 1973. Statistical methods in the study of the seismic process (translated from Russian by D. Vere-Jones; with discussion: comments by M. S. Bartlett, A. G. Hawkes, and J. W. Tukey), Bull. Int. Statist. Inst., 45(3), 437-453.

Kagan, Y., and Knopoff, L., 1977. Earthquake risk prediction as astochastic process, PEPI, 14, 97-108.

(b) Point process: Branching along magnitude axis, introduced by Kagan (1973a;b), see also Kagan and Knopoff, 1977
(a) Earthquake catalog data
(c) Point process: Branching along time axis (Hawkes, 1971; Kagan & Knopoff, 1987; Ogata, 1988)

Kagan, Y. Y., and Knopoff, L., 1987. Statistical short-term earthquake prediction, Science, 236, 1563-1567.

CMT catalog: Shallow earthquakes, 1976-2005
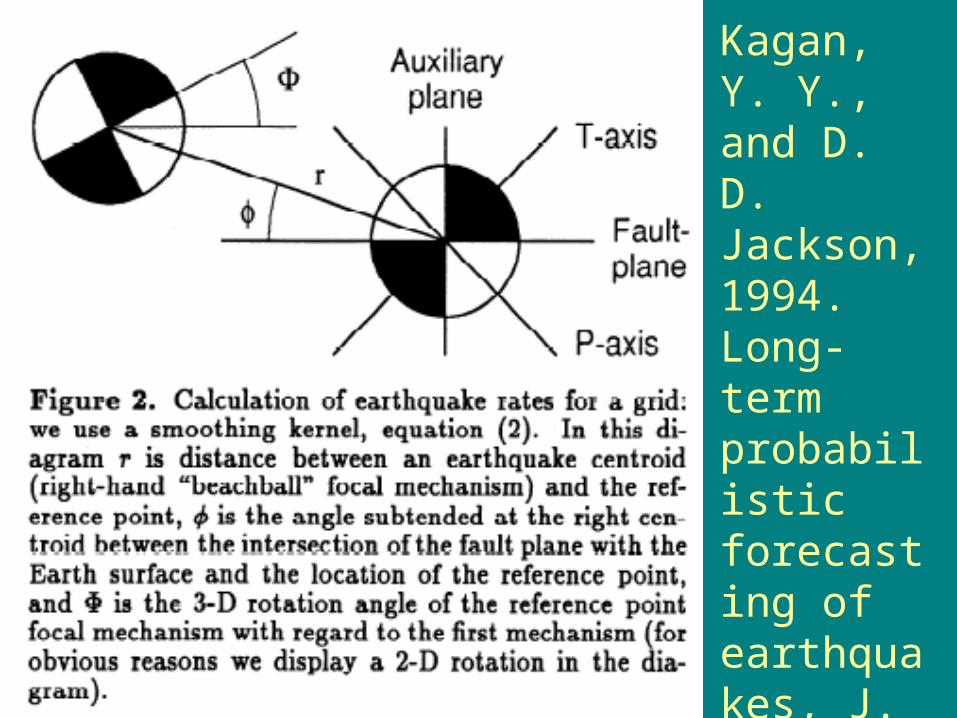
Kagan, Y. Y., and D. D. Jackson, 1994. Long-term probabilisticforecasting of earthquakes, J. Geophys. Res., 99, 13,685-13,700.

Long-term forecast: 1977-todaySpatial smoothing kernel is optimized by using the first part of a catalog to forecast its second part.Kagan, Y. Y., and D. D. Jackson, 2000. Probabilistic forecasting of earthquakes, Geophys. J. Int., 143, 438-453.


Time history of long-term and hybrid (short-term plus 0.8 *long-term) forecast for a point at latitude 39.47 N., 143.54 E. northwest of Honshu Island, Japan. Blue line is the long-term forecast; red line is the hybrid forecast.

The table below and accompanying plots are calculated on 2007/ 4/19at midnight Los Angeles time. The last earthquake with scalar seismic moment M>=10^17.7 Nm (Mw>=5.8) entered in the catalog occurred inthe region 0.0 > LAT. > -60.0, -170.0 > LONG. > 110.0 on2007/ 4/16 at latitude -57.89 and longitude 148.14, Mw = 6.42____________________________________________________________________
LONG-TERM FORECAST | SHORT-TERM Probability Focal mechanism | Probability Probability M>5.8 T-axis P-axis M>5.8 ratio eq/day*km^2 Pl Az Pl Az eq/day*km^2 Time-Longitude | | | Rotation Time- dependent/ | Latitude | | | angle dependent independent v v v v degree
……………………………………………………………………………………………………… 154.0 -7.5 1.49E-08 67 24 16 251 58.6 6.17E-11 4.13E-03 154.5 -7.5 2.02E-08 68 18 10 262 60.9 7.17E-11 3.54E-03 155.0 -7.5 2.60E-08 75 18 13 222 28.5 1.53E-09 5.88E-02 155.5 -7.5 3.51E-07 71 20 19 210 8.7 7.66E-07 2.2 156.0 -7.5 6.72E-08 76 20 14 216 20.0 8.49E-07 13. 156.5 -7.5 3.10E-08 76 28 13 231 41.4 5.12E-07 17. 157.0 -7.5 1.90E-08 1 327 16 236 44.7 1.37E-07 7.2 157.5 -7.5 8.92E-09 77 45 13 229 46.6 4.57E-09 0.51 158.0 -7.5 7.42E-09 79 60 11 228 45.3 9.06E-11 1.22E-02 158.5 -7.5 1.05E-08 49 147 4 52 54.2 1.66E-10 1.58E-02 159.0 -7.5 7.64E-09 47 147 4 242 58.8 1.07E-10 1.41E-02 ………………………………………………………………………………………………………

Short-term forecast uses Omori's law toextrapolate presentseismicity.
Forecast one day before the recent (2006/11/15) M8.3 Kuril Islands earthquake.

KURILE ISLANDS SEISMICITY 2005-PRESENT (2007/04/22) LATITUDE 40-50N, LONGITUDE 150-160E
1 2005 8 1 4 40 47.09 154.22 15.0 5.70 0.4 68 286 5 29 Thr 2 2005 10 15 10 6 46.85 154.33 46.0 6.17 1.8 64 289 1 22 Thr 3 2006 8 20 3 1 49.58 156.87 35.6 6.05 1.2 72 350 10 229 Thr 4 2006 9 28 1 36 46.45 153.66 12.0 6.00 1.0 71 278 18 122 Thr 5 2006 9 30 17 50 46.36 153.50 12.0 6.65 9.3 69 296 21 130 Thr 6 2006 9 30 17 56 46.19 153.35 16.4 6.03 1.1 72 291 18 122 Thr 7 2006 10 1 9 6 46.44 153.68 12.0 6.63 8.8 70 297 20 127 Thr 8 2006 10 13 13 47 46.15 153.73 12.0 5.90 0.7 70 287 19 129 Thr 9 2006 11 12 21 27 48.21 154.77 48.6 6.00 1.0 80 299 10 120 Thr 10 2006 11 15 11 15 46.75 154.32 13.4 8.35 3400.0 60 302 30 123 Thr 11 2006 11 16 6 20 46.41 154.68 12.0 6.00 1.0 4 314 82 190 Nor 12 2006 12 7 19 10 46.23 154.44 13.8 6.40 4.0 2 322 86 83 Nor 13 2006 12 26 15 19 48.18 155.20 38.0 6.00 1.0 77 340 11 133 Thr 14 2007 1 13 4 23 46.18 154.80 12.0 8.14 1650.0 10 150 67 264 Nor 15 2007 1 13 17 37 47.04 156.44 26.6 6.02 1.1 5 176 48 272 Nor 16 2007 4 9 10 18 48.21 155.17 33.0 5.83 0.6 73 318 16 124 Thr

Forecast one day after the recent (2006/11/15) M8.3 Kuril Islands earthquake.

Forecast one day before the recent (2007/01/13) M8.1 Kuril Islands earthquake.

Forecast one day after the recent (2007/01/13) M8.1 Kuril Islands earthquake.

Forecast one day before the recent (2007/4/1)M8.1 Solomon Islands earthquake.

Forecast one day after the recent (2007/4/1) M8.1 Solomon Islands earthquake

Long-term Forecast Efficiency Evaluation
• We simulate synthetic catalogs using smoothed seismicity map.
• Likelihood function for simulated catalogs and for real earthquakes in the time period of forecast is computed.
• If the `real earthquakes’ likelihood value is within 2.5—97.5% of synthetic distribution, the forecast is considered successful.
Kagan, Y. Y., and D. D. Jackson, 2000. Probabilistic forecasting of earthquakes, Geophys. J. Int., 143, 438-453.
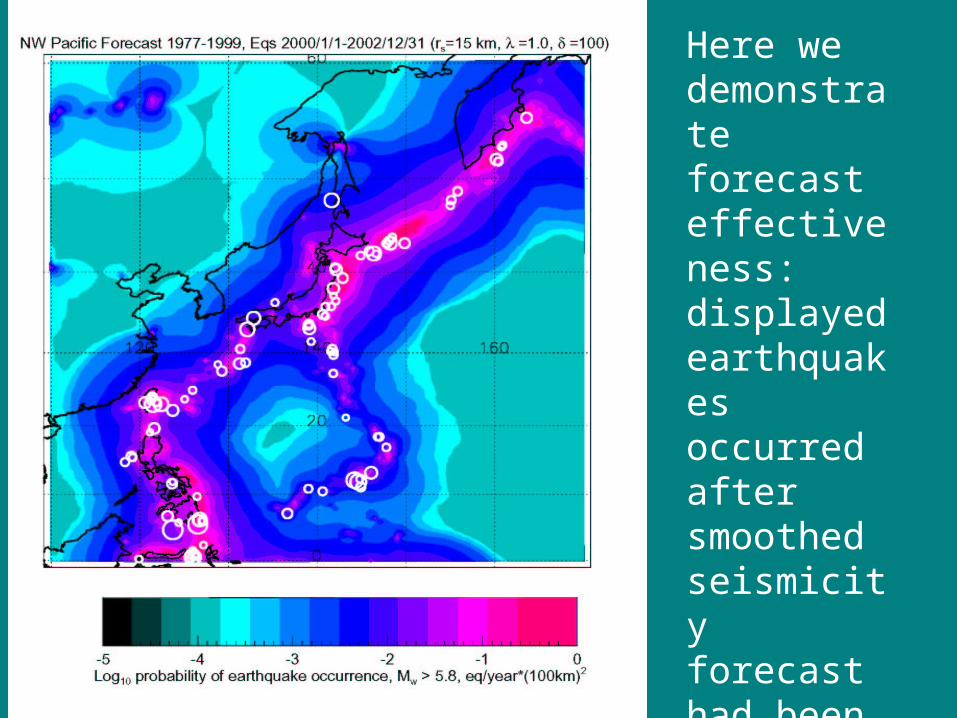
Here we demonstrate forecast effectiveness:displayed earthquakesoccurred aftersmoothed seismicity forecasthad been calculated.


Kossobokov, 2006. Testing earthquake prediction methods: ``The West Pacific short-term forecast of earthquakes with magnitude MwHRV \ge 5.8", Tectonophysics, 413(1-2), 25-31.
See also Kagan & Jackson, TECTO, 2006, pp. 33-38.

Likelihood ratio – information/eq
We approximate earthquake occurrence by Poisson cluster process and calculate the earthquake rate
),,(),(),,()(
MyxutMxMxt ii
M
i
i
Likelihood function is
dMxdtdMxtlMxt
),,(,,
),,(),,(ln,,
MxtdNMxtMxt

Likelihood ratio – information/eq
Similarly we obtain likelihood function for the null hypothesis model (Poisson process in time)
0lInformation content of a catalog :
)2ln/()( 0 NllI characterizes uncertainty reduction by use of aparticular model.
Kagan and Knopoff, PEPI, 1977; Kagan, GJI, 1991;Kagan and Jackson, GJI, 2000; Helmstetter, Kagan and Jackson, BSSA, 2006
(bits/earthquake)

Likelihood ratio – information/eq• Because of power-law dependence of earthquake rate
on time (Omori’s law), the likelihood function (l) approaches infinity when the prediction horizon is close to zero (i.e., for real-time earthquake prediction).
• Similarly, when spatial resolution of earthquake data increases, (l) again goes to infinity.
• Molchan diagram also approaches the ideal state
for the prediction horizon close to zero, or if the location accuracy significantly increases.
)0;0(

CSEP Questions -- Answers
• What kind of model do you have? Grid-based, fault-based, alarm-based? Grid-based, with focal mechanism predicted
• What is your testing area? West Pacific, potentially global• What is your input data and who is producing it? CMT• How is your input data preprocessed? FORTRAN• What tests do you apply? Likelihood, Error diagrams, Spatial
concentration diagrams• Do you imagine many other models with the same
specification? Need a catalog of focal mechanism solutions• When could your model be up and running in CSEP? It is
currently running at my Web site• What are your software needs? FORTRAN, IDL, but other
software would work as well

END
Thank you