Yaksic Tilton 90521 -...
33
Version: 90521 1 USING THE CUMULATIVE AVAILABIITY CURVE TO ASSESS THE THREAT OF MINERAL DEPLETION: THE CASE OF LITHIUM by Andrés Yaksic Beckdorf and John E. Tilton 1 Abstract The cumulative availability curve shows the quantities of a mineral commodity that can be recovered under current conditions from existing resources at various prices. The future availability of a mineral commodity depends on the shape of its cumulative availability curve (determined by geologic considerations, such as the nature and incidence of the available mineral deposits), the speed at which society moves up the curve (determined by future demand and the extent to which this demand is satisfied by recycling), and shifts in the curve (determined by cost-reducing technological change and other factors). While the shape of the curve for any given mineral commodity may or may not be known, it is knowable since the geologic processes responsible for the curve’s shape took place many years ago. In contrast, the factors governing how fast society moves up the curve and how the curve shifts over time are not only unknown but also unknowable. Using lithium as an example, this article shows that knowledge about the shape of the cumulative availability curve can by itself provide useful insights for some mineral commodities regarding the potential future threat of shortages due to depletion. Despite the inherent uncertainties surrounding the future growth in lithium demand as well as the uncertainties regarding the future cost-reducing effects of new production technologies, the shape of the lithium cumulative availability curve indicates that depletion is not likely to pose a serious problem over the rest of this century and well beyond. JEL Classifications: Q32; L72 Keywords: Mineral depletion, mineral availability, nonrenewable resources, cumulative availability curve, lithium 1 Andrés Yaksic Beckdorf ([email protected] ) was a graduate student in mineral economics at the Mining Center of the School of Engineering, Pontificia Universidad Católica de Chile at the time this study was conducted. John E. Tilton ([email protected] ) is Profesor de la Cátedra de Economía de Minerales at the Mining Centre of the School of Engineering, Pontificia Universidad Católica de Chile, and Research Professor in the Division of Economics and Business, Colorado School of Mines. He is also a University Fellow at Resources for the Future. They are grateful to John H. DeYoung, Jr., and Philip Maxwell for helpful comments.
-
Upload
nguyendung -
Category
Documents
-
view
215 -
download
0
Transcript of Yaksic Tilton 90521 -...
Version: 90521
1
USING THE CUMULATIVE AVAILABIITY CURVE TO ASSESS THE THREAT OF MINERAL DEPLETION: THE CASE OF LITHIUM
by
Andrés Yaksic Beckdorf and
John E. Tilton1
Abstract
The cumulative availability curve shows the quantities of a mineral commodity that can be recovered under current conditions from existing resources at various prices. The future availability of a mineral commodity depends on the shape of its cumulative availability curve (determined by geologic considerations, such as the nature and incidence of the available mineral deposits), the speed at which society moves up the curve (determined by future demand and the extent to which this demand is satisfied by recycling), and shifts in the curve (determined by cost-reducing technological change and other factors). While the shape of the curve for any given mineral commodity may or may not be known, it is knowable since the geologic processes responsible for the curve’s shape took place many years ago. In contrast, the factors governing how fast society moves up the curve and how the curve shifts over time are not only unknown but also unknowable.
Using lithium as an example, this article shows that knowledge about the shape of the cumulative availability curve can by itself provide useful insights for some mineral commodities regarding the potential future threat of shortages due to depletion. Despite the inherent uncertainties surrounding the future growth in lithium demand as well as the uncertainties regarding the future cost-reducing effects of new production technologies, the shape of the lithium cumulative availability curve indicates that depletion is not likely to pose a serious problem over the rest of this century and well beyond. JEL Classifications: Q32; L72 Keywords: Mineral depletion, mineral availability, nonrenewable resources, cumulative availability curve, lithium 1 Andrés Yaksic Beckdorf ([email protected]) was a graduate student in mineral economics at the Mining Center of the School of Engineering, Pontificia Universidad Católica de Chile at the time this study was conducted. John E. Tilton ([email protected]) is Profesor de la Cátedra de Economía de Minerales at the Mining Centre of the School of Engineering, Pontificia Universidad Católica de Chile, and Research Professor in the Division of Economics and Business, Colorado School of Mines. He is also a University Fellow at Resources for the Future. They are grateful to John H. DeYoung, Jr., and Philip Maxwell for helpful comments.
Version: 90521
2
Introduction
Although depletion has not yet caused severe shortages, the rapid growth in
demand for mineral commodities over the past century—coupled with the growth
expected over the next century as the economies of China and other developing
countries expand—have many pondering how long this benevolent situation can
continue. Although scholars and others have debated this issue for some time, they
remain divided. Nevertheless, we have learned a great deal about mineral depletion and
the nature of the threat it poses.
Still needed, however, are reliable indicators for individual mineral commodities
of the potential for depletion to produce serious scarcity in the future—what some have
called a ‘red list’ of depletion-threatened commodities, or what one might think of as an
early warning system. In his book On Borrowed Time, Tilton (2003) proposes such a
measure—the cumulative availability curve.2 Yaksic (2008) in his MS thesis Análisis de
la Disponibilidad de Litio en el Largo Plazo has recently attempted to illustrate the
usefulness of this methodology by applying it to the long-run availability of lithium.
This article describes this analysis and its major findings.3
Before doing so, however, Section 2, which follows this introduction, briefly
highlights the important findings of particular relevance for our purposes flowing from
the on-going debate over mineral depletion. Section 3 then describes the cumulative
availability curve and its usefulness. Sections 4 estimates the cumulative supply curve
for lithium and discusses the insights it provides regarding the future availability of this
mineral commodity. Finally, Section 5 reviews the major findings and explores some of
2 On Borrowed Time uses the term cumulative supply curve. Since this curve is quite different from the conventional supply curve, to avoid confusion we now refer to this curve as the cumulative availability curve. 3 The only other application of the cumulative availability curve of which we are aware is Aguilera and others (2009). This study assesses the threat that depletion poses for petroleum products.

Version: 90521
3
their implications for assessing the threat of depletion for mineral commodities in
general.
Depletion and the Long-Run Availability of Mineral Commodities
Shortages of mineral commodities can arise for a variety of different reasons—
wars, embargos, cartels and other market manipulations, natural disasters, accidents,
cyclical booms in global demand, inadequate investment in new mines and processing
facilities, and resource depletion.4 This last—resource depletion—it is important to note
differs from all the other causes in at least two important respects. First, shortages due
to depletion are likely to arise slowly and persistently, and to be permanent or at least of
very long duration. Shortages due to business cycle fluctuations, wars, accidents, and so
on are likely to arise suddenly, often without much warning. Despite a few exceptions—
the DeBeers cartel, for example, probably kept diamond prices artificially high for over
a century—such shortages are also temporary, lasting no more than a decade and often
only a couple of years or less.
Second, shortages of mineral commodities arising for reasons other than
resource depletion are quite common. Surging demand for mineral commodities in India
and especially China coupled with insufficient investment in new production capacity
over the past decade or two, for example, have recently created global shortages for
petroleum, copper, iron ore, tin, and a host of other mineral commodities. On the other
hand, to our knowledge there is not yet a documented case of resource depletion causing
significant shortages of mineral commodities.
4A shortage, as the term is often used, reflects a surplus of the demand for a mineral commodity over its supply at the prevailing market price. For our purposes, however, this definition is too narrow, since it is always possible to bring demand and supply into balance by allowing price to rise. As a result, a shortage is defined here to include situations where rising and substantially higher prices are required to equate supply and demand. The terms shortage and scarcity are used interchangeably, and both imply a lack of availability.

Version: 90521
4
That depletion has not been a problem in the past, of course, does not mean this
favorable situation will continue indefinitely in the future. Indeed, as noted earlier,
many have argued and continue to argue that resource depletion poses a substantial
threat to the long-run availability of mineral commodities. Others have challenged this
view, and a lively debate over this issue continues to this day. We will not review this
debate here, as Tilton (2003, 2006) has done so elsewhere.
Suffice it to say that we have learned much from the exchange of views over the
past 40 years. We know now, for example, that the world will never literally run out of
mineral commodities despite their nonrenewable nature. This is in part because some
mineral commodities, the metals for example, are not destroyed when used and so at
some cost are available for reuse. In the case of petroleum and other energy resources,
the substitution of cheaper alternatives, including solar and other renewable sources,
will occur long before the highest-cost nonrenewable resources are extracted and
consumed.
The debate has also highlighted the serious shortcomings of using physical or
fixed stock measures of mineral resources to assess the threat of depletion, even though
the use of these measures somehow manages to persevere despite their shortcomings.
The fixed-stock approach typically takes estimates of the reserves, resources, or
resource base for a mineral commodity, and assumes they reflect a nonrenewable, fixed
stock of what remains for society to consume.5 Estimates of future consumption are
5 Reserves indicate the amount of a mineral commodity contained in deposits that are both known (that is, discovered) and economic to exploit under current conditions. Resources encompass reserves plus the quantity of a mineral commodity contained (a) in deposits that are as yet undiscovered but which would be economic or potentially economic once discovered, and (b) in known deposits whose exploitation though not currently economic is potentially economic. The U.S. Geological Survey (2008, Appendix C) defines a resource as “a concentration of naturally occurring solid, liquid, or gaseous material in or on the Earth’s crust in such form and amount that economic extraction of a commodity from the concentration is currently or potentially feasible.” The resource base includes all of a mineral commodity found in the earth’s crust. It encompasses resources, as well as a great deal of other mineral occurrences not now considered potentially feasible for future exploitation. The U.S. Geological Survey (2008, Appendix C) does not use the term resource base. However, the resource base encompasses what the USGS calls

Version: 90521
5
then typically used to estimate how many years remain before the available stock is
exhausted.
Neither reserves nor resources, however, are really a fixed stock. This
shortcoming is widely recognized in the case of reserves, since new discoveries and new
technologies are constantly adding to mineral reserves.6 Though less appreciated, the
same is true as well for resources. As Tilton and Lagos (2007) have documented, the
U.S. Geological Survey has over the past several decades increased its estimates of
global copper resources from 1.6 to 3.7 billion tonnes. Some of this increase came from
the realization that new technology made seabed nodules a potential source of copper in
the future, but most represents a reassessment in light of changes in technology,
geologic science concepts, and other conditions of what is potentially available from
land-based deposits.
While a stronger case can be made that the resource base does indeed represent a
fixed stock, it is of little use in assessing the long-run availability of mineral
commodities for other reasons. In particular, long before the last barrel of oil or the last
ton of copper were extracted from the earth’s crust, the cost of production would
become prohibitive, causing demand to decline to zero. As a result, while the life
expectancies of reserves and resources are unduly pessimistic, those based on the
resource base are unduly optimistic. In the case of lithium, for example, the resource
resources (which include reserves) and other occurrences. The USGS defines other occurrences as “materials that are too low grade or for other reasons are not considered potentially economic.” It also notes that the boundary between other occurrences and resources is “obviously uncertain, but limits may be specified in terms of grade, quality, thickness, depth, percent extractable, or other economic-feasibility variables.” 6 Moreover, within the mining industry it is widely recognized that there exists little economic incentive to identify reserves beyond 20 to 30 years of consumption, given the costs of such efforts and the time value of money.

Version: 90521
6
base estimated at 4.8 x 10¹⁴ tonnes would at current rates of consumption last for some
23 billion years.7
As a result, it is now widely (though not universally) accepted that economic
measures of mineral scarcity are more useful than physical measures. Economic
measures reflect the opportunity costs, or what society has to give up, to obtain one
more ton of a mineral commodity. Real mineral commodity prices are the most
frequently encountered economic measures.8 A rise over time in the real price of, for
example, iron ore implies growing scarcity, while a decline implies growing
availability.
While generally considered far superior to physical measures of scarcity, trends
in real prices do have their own shortcomings and limitations.9 For example, as noted
earlier, scarcity and shortages can arise for reasons other than resource depletion. As a
result, mineral commodity prices fluctuate considerably, particularly over the short run.
For this reason, price trends over the long run offer the most useful insights regarding
mineral depletion.
In addition, prices reflect only those environmental and other social costs that
producers and ultimately consumers actually pay. This means trends in real prices will
overestimate the rise in scarcity if government policies are forcing producers to
7 The concentration of lithium in the earth’s crust is estimated at between 20 and 65 ppm and the weight of the earth’s crust at 2.4 x 10¹⁹ tonnes. See Erickson (1973). Using 20 ppm produces the resource base estimate of 4.8 x 10¹⁴ tonnes of lithium. In addition, the oceans contain 0.17 ppm of lithium, suggesting that this resource contains an additional 2.5 x 10¹¹ tonnes of lithium. See Steinberg and Dang (1975). 8 Other economic measures include the real production costs of marginal producers and user costs. User costs, which are also called Hotelling rents and scarcity rents, reflect the net present value of the lost future profits associated with producing one more unit of a mineral commodity now rather than in the future. Under given conditions, user costs reflect the value of the marginal reserves in the ground required to produce one more unit of a mineral commodity. Data on production costs and user costs are difficult to obtain. For this and other reasons, the real prices of mineral commodities are by far the most widely used of the economic measures of mineral scarcity. 9 For a more complete discussion of the shortcomings of the economic measures of resource scarcity, see Tilton (2003), ch. 3.

Version: 90521
7
internalize an increasing share of the total social costs and underestimate the rise in
scarcity if the opposite is the case.
Perhaps the greatest shortcoming of trends in real prices as an indicator of the
future threat of depletion is that the prices we have are historical. As a result, they
largely reflect conditions in the past. Of course, where the market anticipates future
scarcities current prices will rise as consumers and others build up their stocks. Still,
given the long-run nature of the threat from mineral depletion, it is far from clear to
what extent and how far into the future current prices anticipate scarcity. What we
would like to know are the long-run trends in real mineral commodity prices far into the
future. Here, as the next section shows, the cumulative availability curve can be of some
help.
The Cumulative Availability Curve
The cumulative availability curve shows the amount of a mineral commodity
that can be recovered profitably at various prices from different types of mineral
deposits under current conditions (that is, current technology, prevailing labor and other
input prices, and so on).10 One would like the cumulative availability curve to reflect
estimates of both known (discovered) and unknown mineral deposits. Some times this is
possible, as Aguilera and others (2009) in their attempt to construct cumulative
availability curves for petroleum resources show. However, normally reliable
10 The cumulative availability curve differs from the common supply curve in economics in two important respects. First, the conventional supply curve indicates how much of a commodity will be supplied to the market during a given time period, such as a year or month, while the cumulative availability curve shows how much could be supplied cumulatively over all time. The former is a flow variable, the latter a stock variable. The cumulative availability curve only makes sense for commodities produced from nonrenewable resources. The cumulative availability of corn, television sets, and trucks at prices at or above production costs is presumably infinite. Second, the conventional supply curve indicates how much suppliers will actually provide to the market at various prices, which due to market power and other considerations may deviate from what they could supply profitably at various prices. The first reference, of which we are aware, to the cumulative availability curve is found in Tilton and Skinner (1987), where it is called the cumulative supply curve. For more on the cumulative availability curve, also see Tilton (2003) and Tilton (2006).

Version: 90521
8
information on unknown deposits is not available, as is the case for lithium. In this
situation, cumulative availability curves can be estimated on the basis of known
deposits, as long as one keeps in mind new discoveries are likely to shift the curve down
and to the right over time.
The slope of the cumulative availability curve is positive, since higher prices
permit the profitable exploitation of poorer quality and so higher cost deposits.
However, as Figure 1 indicates, a positive slope is consistent with a variety of shapes
with very different implications for future resource availability. The gradually rising
curve shown in Figure 1a implies that substantial future increases in output are possible
with only modest increases in production costs and prices. The curves shown in Figures
1b and 1c are far less benign. Both suggest at some point substantial increases in costs
will occur making much higher prices necessary.
The cumulative availability curve is a useful expository device for grouping the
many different factors governing future mineral commodity prices. The first group
determines the shape of the cumulative availability curve. It encompasses the various
geologic factors affecting future costs and prices, such as the nature and incidence of
mineral occurrences. The second group determines how quickly the world moves up the
cumulative availability curve. It includes all the factors that affect current and future
demand for the mineral commodity, including growth in per capita income and
population. It also encompasses the government policies and other factors influencing
recycling and secondary production. The third group determines to what extent the
cumulative availability curve shifts over time. It includes changes in factor costs and the
forces behind such changes, and as well the effects of innovation and technological
change on the costs of finding and producing mineral commodities. In addition, as noted

Version: 90521
9
above, if the cumulative availability curve is estimated on the basis of identified
resources only, the discovery of new deposits also belongs to this group.
In the past, we know that the cost-reducing effects of new technology have for
most mineral commodities offset, at least over the longer run, any upward pressure on
costs caused by higher factor prices. As a result, the cumulative availability curve has
tended to shift downward over time. For a number of mineral commodities, the cost-
reducing effects of new technology, reflected in the downward shift of the cumulative
availability curve, have more than offset the cost-increasing effects of depletion,
reflected in the movement over time up the curve. In such cases, the trends in real prices
over the past century or more have been downward, suggesting growing rather than
declining availability, mineral depletion notwithstanding. For most mineral
commodities, the two countervailing forces have more or less offset each other, and
their trends in real prices have been relatively flat. Significantly upward sloping, real
price trends are harder to find over the past century, which is why, as noted earlier, there
are few if any documented cases of depletion having caused shortages or scarcity of
mineral commodities in the past.
The future, of course, could be different, and our interest here lies with possible
future scarcities and thus with expected future price trends. To assess the latter, we
would like to know (a) the shape of the cumulative availability curve, (b) the speed at
which society will move up the curve, and (c) extent to which the curve will shift with
time. With a fair amount of certainty (which is rare when talking about the future), we
know there is little hope of reliably predicting either of the last two developments. The
extent to which the cumulative availability curve will shift depends on the introduction
and diffusion of new technologies. Both are notoriously difficult to predict over the near
term let alone over the next century. Similarly, how rapidly society will move up the
Version: 90521
10
curve hinges on changing consumer preferences for mineral-intensive products,
population growth, per capita income growth, and trends in recycling, all of which are
similarly difficult to anticipate over the longer term.
Fortunately, the shape of the cumulative availability curve—the first
consideration—is more tractable, since it depends on the nature and incidence of
existing mineral occurrences. It is true that our knowledge of subeconomic resources for
many mineral commodities is quite limited, since exploration is largely carried out by
firms focused on finding economic and particularly highly economic deposits.
However, it is clearly possible to obtain more information on subeconomic mineral
occurrences. These resources were created in the past, in many cases hundreds of
millions of years ago, and ignorance about them largely reflects a lack of interest on the
part of exploration firms because such deposits are uneconomic at the present time.
Moreover, as pointed out earlier, the shape of the cumulative availability curve
can provide useful insights about the potential threat of depletion. This is true even
though reliable information regarding how fast society will move up the curve and to
what extent the curve will shift over time is unknown.
The curve shown in Figure 1a implies, as cumulative production proceeds over
time, that the price needed to elicit additional supply increases but at a decreasing rate.
When this is the shape of the curve, new technology should find it increasingly easy to
offset the cost-increasing effects of depletion. However, the cumulative availability
curve, at least for a number of mineral commodities, may be less benevolent than the
one shown in Figure 1a.
For instance, the costs of mineral commodities produced as by-products and co-
products, such as indium, gallium, cobalt, the platinum-group metals, and of particular
importance here lithium, are lower because a substantial share of the total mining and

Version: 90521
11
processing costs are borne by the associated joint products. Should demand at some
point exceed the supply available from by-product and co-product output, these
commodities would have to be produced as main products. At this point, a substantial
jump in the price may be required, implying a sharp surge or a discrete break in the
cumulative availability curve, as shown in Figures 1b and 1c.
Moreover, according to Skinner (1976) and Gordon and others (1987), even
copper and other major metals currently produced as main products may have
cumulative availability curves similar to those shown in Figures 1b and 1c. This, they
contend, is due to the geochemical processes that created the mineral deposits for these
metals millions of years ago, which they believe are unlikely to have produced a
benevolent unimodal relationship between the grade and quantity of metal. Rather they
suspect this relationship may possess two or more peaks in the available quantity of
metal as grade declines. In this case, once the rich (high-grade) deposits are exploited,
society may have to turn to much lower grade, and thus much more costly, deposits for
additional supplies.
In addition, the processing methods required to liberate the copper and other
metals in very low grade deposits may be quite different from those employed today. In
particular, the use of mechanical and chemical processes for concentrating the ore may
not be feasible. As a result, the energy required could be one or several orders of
magnitude greater, also causing a sharp jump in costs.
As Skinner himself points out, his thesis is largely based on theoretical
considerations. Very little empirical work has been carried out on the costs incurred in
processing very low grade deposits, largely because the latter are of little commercial
interest.

Version: 90521
12
Lithium11
The Swedish scientist Johan August Arfwedson discovered lithium, a minor
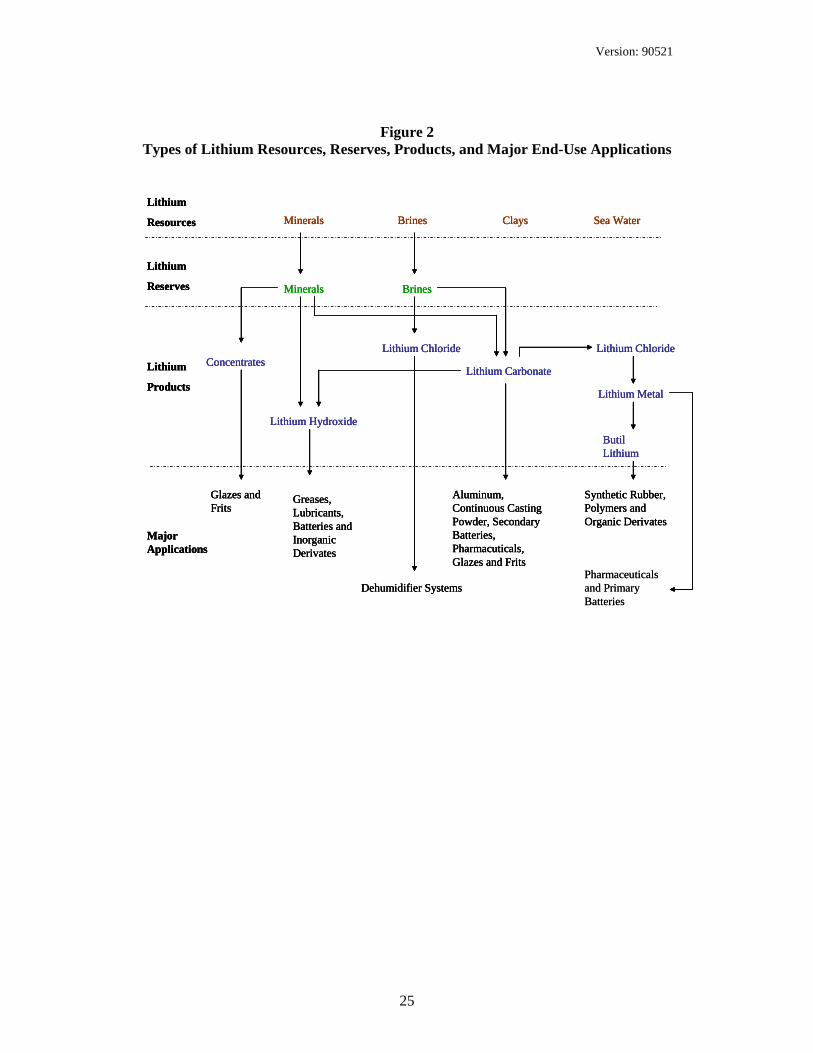
metal, in 1817. Today the world extracts lithium from two types of resources—brines
and minerals—to produce lithium carbonate, lithium hydroxide, lithium chloride,
lithium metal, and the other lithium-containing products shown in Figure 2. The major
end-use industries consuming these lithium products, as Figure 3 shows, produce
batteries, lubricating greases, frits, glass, air conditioners, aluminum, and
pharmaceutical products. The annual output of these products contains about 21,800
tonnes of lithium. Chile, Australia, Argentina, China, and the United States are the
major producing countries accounting for 43, 25, 13, 6, and 4 percent respectively of the
lithium extracted from brines and minerals.12
As Figure 4 shows, the real price of lithium carbonate (the most important
lithium product and the one for which a long-run price series exists) has declined since
1953 (the first year figures are available) due largely to new, low cost sources of lithium
supply and new production technologies. As a result, lithium has over the past half
century become less, not more, scarce, and depletion has not been a problem.
Nevertheless, the expected growth in demand over the coming century for lithium
batteries to power hybrid and fully electric automobiles has raised some concern about
the future availability of lithium (Tahil, 2007; Tahil, 2008; Bradbury, 2008).13
11 This section is based on Yaksic (2008) and the sources cited there. Also, see Ebensperger and others (2005) for an overview of the lithium industry that examines the industry’s resources, production, end-use consumption, and prices as well as its future prospects. 12 The figure of 21,800 tonnes for annual lithium production and the country shares cited are estimates based on Ober (2008), Sernageomin (2006), Roskill (2006), and other sources. The estimate of 21,800 tonnes for total lithium production is slightly below estimates found elsewhere for the reasons noted in Yaksic (2008, pp. 25-28). The country production figures reflect extraction from natural resources. China and other countries that import and then further process lithium products have larger market shares when the total value of lithium production is considered. 13 Others, however, are less concerned. See, for example, Evans (2008a and 2008b). It is also worth noting that the current concern is not the first time that scientists and others have worried about the long-run availability of lithium. In the 1970s an expected surge in lithium demand for use in nuclear fusion raised fears that inadequate lithium resources could curtail the development of this new source of energy. See Hammond (1976).

Version: 90521
13
In addition to brines and mineral deposits, lithium can be extracted from clays
and seawater. Brines—currently the most important and cheapest sources of lithium—
are largely associated with dry lakes, such as the Salar de Atacama in the altiplano of
northern Chile. Brines are also found with geothermal deposits as well as oil fields.
Hard rock mineral deposits, as noted, constitute the other type of resource from which
lithium is currently extracted. Although lithium is found in some 145 different minerals,
only a few (spodumene, lepidolite, petalite, amblygonite, and eucriptite) are sources of
lithium in deposits that have economic value. Clays (especially hectorite) and seawater
are both potential sources of supply.
Cumulative Availability Curves
With the assistance of various industry and government officials and an
extensive review of the available historical documents and studies, Yaksic (2008) has
compiled a listing of known lithium resources along with estimates of their quantities
and production costs (see Appendix). With this information, one can construct the
cumulative availability curves for lithium shown in Figure 5. Estimating production
costs is challenging, in part because many producing firms consider the costs of their
on-going operations proprietary and in part because one can only approximate the costs
of resources not currently being exploited. For this reason, Figure 5 shows production
costs under two scenarios—a high cost or pessimistic scenario (the top curve) and a low
cost or optimistic scenario (the bottom curve).
The costs, shown on the vertical axis of Figure 5, and hence the prices needed to
cover production costs are in terms of dollars per pound of lithium carbonate, the most
important lithium chemical. The horizontal axis shows the available resources,
measured in tonnes of contained lithium (rather than tonnes of lithium carbonate

Version: 90521
14
equivalent),14 whose production costs are at or below various prices. For our purposes,
this difference in indicated units is unimportant.
What is important is that the curves shown are incomplete. In particular, only a
small part of the cumulative availability curves associated with lithium production from
seawater (that is, the horizontal segment at 10 dollars for the top curve and at 7 dollars
for the bottom curve) are shown.15 This is because the quantity of lithium recoverable
from seawater is huge—44.8 billion tonnes.16 Including all this tonnage in Figure 5
would increase the length of the cumulative availability curves by more than a thousand
fold.
Implications for Depletion
Having estimated cumulative availability curves for lithium, we can consider
next the future demand for lithium and how rapidly society is likely to move up these
curves. As pointed out earlier, predictions of future mineral demand are rarely accurate
since they depend on technological change, shifting consumer preferences, population
growth, and other variables that are difficult to estimate accurately in the longer run. For
this reason, we consider a high growth scenario, which is likely to overestimate the
growth in demand and so represents a worse-case scenario for lithium depletion. Table 1
identifies the specific assumptions on which this scenario rests. In general, it assumes
that the demand for lithium in automobile batteries surges over the coming decades and 14 5.323 metric tonnes of lithium carbonate (Li2CO3) contain one metric ton of lithium (Li). 15 The estimated production costs of 7 to 10 dollars per pound of lithium carbonate are based on Steinberg and Dang (1975). During the 1970s the expected growth in electric power generation from nuclear fusion was expected to increase greatly the demand for lithium, raising concerns about its long-run availability. Various researchers conducted laboratory scale studies to estimate the costs of recovering lithium from geothermal brines, oil field brines, and other potential resources. As part of this effort, Steinberg and Dang (1975) carried out an economic analysis for the extraction of lithium from seawater, estimating production costs for the process in the range of 22 to 32 (1974) dollars per kilogram of lithium metal. This compares with a selling price of lithium metal from conventional mineral sources of about 20 dollars per kilogram at the time. We then increased the estimated costs of 22 to 32 dollars for subsequent inflation, and then converted them from lithium metal to lithium carbonate and from kilograms to pounds to obtain the estimated costs of 7 to 10 dollars per pound of lithium carbonate from seawater. This approach, it is important to point out, does not take into account any reduction in production costs due to technological progress since the time of the Steinberg and Dang study. 16 This figure assumes that 20 percent of the lithium in seawater is recoverable.

Version: 90521
15
that the demand for lithium grows briskly in its traditional end uses (other than for
aluminum production where lithium use is expected to be phased out over the next
couple of decades).
Under these conditions, the cumulative output of lithium required from 2008 to
2100 totals 17.5 million tonnes. This figure reflects only the needed primary lithium
production, since recycled lithium or secondary production does not deplete lithium
resources and thus does not move society up the cumulative availability curve.17
Under this worse case scenario, at some point in the 22nd century the world
could find it attractive to extract lithium from seawater.18 The costs of producing
lithium from this source are between 7.00 and 10.00 dollars per pound of lithium
carbonate. Since the current price is around 2.80 dollars per pound (see Figure 4), at
most depletion might drive the price up by 7.20 dollars a pound over the next century.
Moreover, at that price an estimated 44.8 billion tonnes of lithium are available (see
Appendix Table 3), which for all practical purposes is an unlimited source of supply.
An increase of 7.20 dollars would not significantly curtail the use of lithium in
automobile batteries. A 9 kWh lithium battery today requires approximately 15 pounds
(6.75 kilograms) of lithium carbonate equivalent. As result, the lithium used in the
battery today costs approximately 42 dollars.19 This would increase to 150 dollars if the
price were to rise to 10.00 dollars per pound of lithium carbonate. This is but a small
fraction of the total cost of the battery, which can exceed five thousand dollars, and of
the total cost of the car, estimated at 20 to 30 thousand dollars.
17 Under the assumed conditions, annual production in the year 2100 is estimated at 330,000 tonnes of lithium equivalent or 1.76 million tonnes of lithium carbonate equivalent. 18 Actually, given our likely overestimation of demand and the many known resources of lithium we have not considered, either because resources estimates or costs estimates are not available, we doubt that lithium will be produced from seawater in the 22nd century unless costs of extracting lithium from seawater fall substantially. 19 The figure of 42 dollars is an estimate only, since the lithium products used in lithium batteries are not just lithium carbonate.

Version: 90521
16
The cumulative availability curves shown in Figure 5 similarly make it difficult
to argue that depletion is behind the recent jump in lithium carbonate prices from
around 1.50 dollars a pound in 2005 to 3.00 dollars a pound in 2007, as lithium can be
extracted from many, currently available sources at less than 2.00 dollars a pound.
Finally, it is worth highlighting two caveats that tend to reinforce the above
findings. First, the discovery of new lithium deposits and new technologies that reduce
production costs may well shift the cumulative availability curves shown in Figure 5
downward over time. Second, the cumulative availability curves shown in Figure 5 are
based on conservative assumptions and estimates. The assumed recovery rates for
various resources, for example, are quite low. In the case of seawater, for instance, only
20 percent of the 224 billion tonnes of lithium in this source is considered recoverable.
In addition, a number of known but uneconomic sources of lithium are excluded from
the curves due to the lack of reliable estimates for availability or costs.20 Overall, these
caveats strengthen the conclusion that depletion does not pose a significant threat to the
long-run availability of lithium.
Conclusions
Over the long run, as society consumes its high quality, low cost mineral
resources, depletion could cause the real prices of mineral commodities to rise,
threatening the high living standards currently enjoyed in many countries around the
world. Whether this will actually take place, it is now known, depends largely on a race
between the cost-increasing effects of depletion and the cost-reducing effects of new
technology. We also know that in the past new technology has successfully offset the
20 These resources include various dry lakes in Chile, Argentina, and Bolivia that are known to contain important volumes of lithium but have not been explored in detail (see notes to Appendix Table 2). The same holds for a number of lithium mineral deposits recently discovered in Australia and Canada. Marginal geothermal brines in New Zealand, Italy, Japan, Iceland, and France are also not considered, nor the lithium resources in North Dakota and Utah in the United States associated with oil fields.

Version: 90521
17
tendency for depletion to push prices higher. What we do not know, given the inherent
uncertainties surrounding the future course of technological change and the other
determinants of mineral commodity prices, is whether this favorable situation will
continue in the future.
Despite such uncertainties, lithium shows that in some instances information
about the shape of the cumulative availability curve can provide useful insights into the
likely future threat of mineral depletion. Where the curve rises gradually and eventually
becomes relatively flat (as is the case for lithium, particularly once extraction from
seawater takes place), some assessment of the maximum long-run price is possible
under any plausible scenario of future demand growth. In the case of lithium, for
example, it appears that almost unlimited supplies can be extract from seawater for
between 7.00 and 10.00 dollars per pound of lithium carbonate. As the current price is
about 2.80 per pound, these figures suggest that depletion will not be a serious threat,
even if lithium is widely used over the coming century in hybrid and fully electric
automobiles.
Not all mineral commodities, of course, may have such benevolent cumulative
availability curves. Mineral commodities whose cumulative availability curves rise
steeply or have discrete breaks are more exposed to the threat of depletion.
In this regard, however, there is an important asymmetry between mineral
commodities with gradually rising cumulative availability curves and those with steep
slopes or with discrete breaks in terms of the implications for depletion. In the case of
the former, if the relatively flat portion of the curve occurs at prices close to current
prices, as is the case for lithium, one can confidently conclude that depletion will not be
a serious threat. In the case of the latter, however, one cannot conclude that depletion
will necessarily be a problem. The reason being in such cases we have no way of
Version: 90521
18
knowing how much of the upward pressure on costs likely to arise from depletion will
be offset by the cost-reducing effects of new innovations and technology.
Finally, for some mineral commodities the information needed to construct
cumulative availability curves is not available. This, as we have seen, is the case for
copper. On this issue, however, it is useful to highlight the difference between
information that is unknown and unknowable and information that is unknown but
knowable. Information on technological change, population growth, changes in future
consumer preferences, and the other determinants governing how rapidly society will
move up the cumulative availability curve and to what extent the curve will shift down
over time is not just unknown. It is also essentially unknowable. In contrast, the
geologic information needed to estimate cumulative availability curves, though it may
currently be unknown for many mineral commodities, is knowable. At some cost and
effort, it can be obtained. And, as the case of lithium illustrates, knowledge of the shape
of cumulative availability curves can by itself provide useful insights into the future
threat of depletion for some mineral commodities.

Version: 90521
19
References
Admiralty Resources, 2008, Rincon salar, Argentina - The resource. Available at http://www.ady.com.au/admirality_resources_ricon_salar_resources.php (accessed on August 21, 2008).
Aguilera, R.F., Eggert, R.G., Lagos, G., and Tilton, J.E., 2009, Depletion and the future
availability of petroleum resources: Energy Journal, v. 30, p. 141-174. Anstett, T.F., Krauss, U.H., Ober, J.A., and Schmidt, H.W., 1990, International
Strategic Minerals Inventory Report—Lithium, U.S. Geological Survey Circular 930-I: Washington, DC, Government Printing Office.
Avalon Ventures, 2008, Separation Rapids lithium-tantalum project: Kenora, Ontario.
Available at http://www.avalonventures.com/projects/rare/separation_rapids/ (accessed on August 26, 2008).
Ballivián, O., and Risacher, F., 1981, Los salares del altiplano boliviano: O.R.S.T.O.M.
and Universidad Mayor San Andrés, Paris, p. 123. Black Pearl Minerals, 2008a, Thompson Bros. lithium project. Available at
http://www.blackpearlminerals.com/property_thompson_bros.php (accessed on August 25, 2008).
Black Pearl Minerals, 2008b, Quebec lithium project. Available at
http://www.blackpearlminerals.com/property_quebec_lithium.php (accessed on August 25, 2008).
Bradbury, D., 2008, What is going to power our cars? The Guardian, July 31. Available
at www.guardian.co.uk/ technology/2008/jul/31/motoring.energy (accessed on August 10, 2008).
Ebensperger, A., Maxwell, P., and Moscoso, C., 2005, The lithium industry: Its recent
evolution and future prospects: Resources Policy, v. 30, p. 218-231. Erickson, R.L., 1973, Crustal abundance of elements, and mineral reserves and
resources, in Brobst, D.A., and Pratt, W.P., eds., United States Mineral Resources, U.S. Geological Survey Professional Paper 820: Washington, DC, Government Printing Office, p. 21-25.
Evans, R.K., 1986, Reservas y recursos de litio en el mundo occidental, in Lagos, G.,
ed., El Litio, Un Nuevo Recurso para Chile: Santiago, Chile, Editorial Universidad de Chile, p. 45-52.
Evans, R.K., 2008a, An abundance of lithium: Unpublished paper, March. Available at
www.worldlithium.com/An_Abundance_of_Lithium_1.html (accessed on August 10, 2008).

Version: 90521
20
Evans, R.K., 2008b, An abundance of lithium: Part two: Unpublished paper, July. Available at www.worldlithium.com/An_Abundance_of_Lithium_-_Part_2.html (accessed on August 10, 2008).
Galaxy Resources, 2008, Ravensthorpe - Mt Cattlin. Available at
http://www.galaxyresources.com.au/projects-r-mtcattlin.php (accessed on August 25, 2008).
Garrett, D.E., 2004, Handbook of Lithium and Natural Calcium Chloride: London,
Elsevier Ltd., p. 1–223. Geoscience Australia, 2008, Australia's identified mineral resources 2008. Available at
http://www.ga.gov.au/minerals/exploration/resources_advice/Table1_AIMR08.jsp (accessed on August 25, 2008).
Gordon, R.B., Koopmans, T.C., Nordhaus, W.D., and Skinner, B.J., 1987. Toward a
New Iron Age? Quantitative Modeling of Resource Exhaustion: Cambridge, Massachusetts, Harvard University Press, p. 1-173.
Hammond, A.L., 1976, Research news: Lithium: Will short supply constrain energy
technologies? Science, March 12, v. 191, p. 1037-1038. Industrial Minerals, 1999, SQM raises Li2CO3 prices: Industrial Minerals, no. 386,
November, p. 90. Industrial Minerals, 2000, Chemetall and FMC raise lithium prices: Industrial Minerals,
no. 399, December, p. 30. Industrial Minerals, 2007, Between a rock and a salt lake: Industrial Minerals, no. 477,
June, p. 58–69. Kunasz, I.A.,1994, Lithium resources, in Carr, D.D., ed., Industrial Minerals and Rocks:
Littleton, CO: Society for Mining, Metallurgy, and Exploration, p. 631–642. Norton, J.J., 1973, Lithium, cesium, and rubidium—The rare alkali metals, in Brobst,
D.A., and Pratt, W.P., eds., United States Mineral Resources, Geological Survey Professional Paper 820: Washington, DC, Government Printing Office, p.365-378.
Ober, J.A., 1994 – 2006, Lithium, in Minerals Yearbook: Washington, DC, U.S.
Geological Survey. Ober, J.A., 2000, Lithium, in Mineral Commodity Summaries 2000: Washington, DC,
U.S. Geological Survey, p. 100-101. Also available at http://minerals.usgs.gov/minerals/pubs/commodity/lithium/450400.pdf (accessed on August 26, 2008).
Ober, J.A., 2008, Lithium, in Mineral Commodity Summaries 2008: Washington, DC,
U.S. Geological Survey, p. 98-99. Also available at

Version: 90521
21
http://minerals.er.usgs.gov/minerals/pubs/mcs/2008/mcs2008.pdf (accessed on August 9, 2008).
Orocobre, 2008, Olaroz lithium project. Available at
http://www.orocobre.com.au/Projects_Olaroz.htm (accessed on August 25, 2008).
Pavlovic, P., 2002, Capítulo 2.1 Reservas de litio, in Estudio Económico-Jurídico de
una Eventual Liberalización de la Explotación y Comercialización del Litio: unpublished study, Santiago, Chile, Ministerio de Minería.
Roskill, 2006, The economics of lithium: London, Roskill Information Services. Sernageomin, 2006, Anuario de la minería chilena: Santiago, Chile, Servicio Nacional
de Geología y Minería. Also available at http://www.sernageomin.cl/pdf/publicaciones/anuario2006.pdf (accessed on October 1, 2007).
Skinner, B.J., 1976, A second iron age ahead? American Scientist, v. 64, p. 158-169. SQM, 2007, Annual report: Santiago, Chile, Sociedad Química y Minera de Chile S.A.
Also available at http://www.sqm.com/PDF/Investors/AnnualReport/SQM-Annual_Report_2007_EN.pdf (accessed on September 23, 2008).
SQM, 2009, Lithium resources and view of the lithium industry, paper presented at the
Lithium Supply and Markets Conference 2009, Industrial Minerals, Santiago, Chile. Available at http://www.metalbulletin.com/events/Details/Element.aspx?eventId=736&typeId=3 (accessed on February 3, 2009).
Steinberg, M., and Dang, V., 1975, Preliminary design and analysis of a process for the
extraction of lithium from seawater, Technical Report 20535-R: Upton, NY: Brookhaven National Laboratory. Also available at http://www.osti.gov/energycitations/product.biblio.jsp?osti_id=7351225 (accessed on December 9, 2008).
Tahil, W., 2007, The trouble with lithium: Implications of the future PHEV production
for lithium demand: Martainville, France, Meridian International Research. Available at http://www.meridian-int-res.com/Projects/Lithium_Problem_2.pdf (accessed on August 10, 2008).
Tahil, W., 2008, The trouble with lithium 2: Under the Microscope: Martainville,
France, Meridian International Research. Available at http://www.meridian-int res.com/Projects/Lithium_Microscope.pdf (accessed on September 24, 2008).
Tilton, J.E., 2003, On Borrowed Time? Assessing the Threat of Mineral Depletion:
Washington, DC, Resources for the Future, p. 1-158.

Version: 90521
22
Tilton, J.E., 2006, Depletion and the long-run availability of mineral commodities, in Doggett, M.E., and Parry, J.R., eds., Wealth Creation in the Minerals Industry: Integrating Science, Business and Education: Littleton, Colorado, Society of Economic Geologists Special Publication 12, p. 61-70.
Tilton, J.E., and Lagos, G., 2007, Assessing the long-run availability of copper:
Resources Policy, v. 32, p. 19-23. Tilton, J.E., and Skinner, B.J., 1987, The meaning of resources, in McLaren, D.J., and
Skinner, B.J., eds., Resources and World Development: New York, John Wiley & Sons, p. 13-27.
U.S. Bureau of Mines, 1953 – 1993, Minerals Yearbook: Washington, DC, U.S.
Government Printing Office and U.S. Bureau of Mines. Vine, J.D., ed., 1976, Lithium Resources and Requirements by the Year 2000, U.S.
Geological Survey Professional Paper 1005: Washington, DC, Government Printing Office.
Western Lithium Corporation, 2008. Available at http://www.westernlithium.com/
(accessed on September 24, 2008). Yaksic Beckdorf, A., 2008, Análisis de la disponibilidad de litio en el largo plazo:
Unpublished M.S. thesis, Santiago, Pontificia Universidad Católica de Chile, p. 1-150.

Version: 90521
23
Table 1
Lithium 2008 to 2100 Demand Forecast Assumptions by Major End Use Markets
End Use Market Assumptions Automobile Batteries 1) World population will grow according UN
estimations from 6.5 billion people in 2008 to 9.0 billion people in 2100.
2) The global ratio of people per automobile will fall from 8 in 2008 to 3 in 2100.
3) Annual battery production equals the growth in the world vehicle fleet plus the replacement of old car batteries (10 year average life assumed).
4) The percentage of hybrid and fully electric automobiles will increase from its 2008 level of under 1 to 100 percent by 2050 where it will remain for the rest of the century.
5) Hybrid and fully electric automobiles on average will use 9 kWh lithium batteries.
6) Lithium batteries will on average last for 10 years.
7) Lithium batteries will be recycled, recovering 80% of the lithium.
Secondary Batteries (rechargeable - portable devices)
15% growth for ten years; then 10% growth for ten years more; 3% growth until 2050; 1% growth from 2051 to 2100.
Primary Batteries (non-rechargeable - portable devices)
8% growth for ten years; then 5% growth for ten years more; 3% growth until 2050; 1% growth from 2051 to 2100.
Lubricating Greases 5% growth for next ten years; then 3% growth for the next twenty years; finally 1% growth until 2100.
Frits and Glass 3% growth for ten years; then 2% growth for the next twenty years; finally 0.5% growth until 2100.
Air Conditioning 5% growth for ten years; 3% growth for the next ten years; finally 1% growth until 2100.
Aluminum 0% growth for ten years; 5% reduction over the next ten years; no lithium consumption after 20 years.
Others 4% growth for ten years; 2% growth in the next ten years, finally 1% growth until 2100.
Notes:
aThese assumptions are likely to produce demand forecasts that exceed the actual growth in lithium consumption over the 21st century for the following reasons: (1)The ratio of people per automobile is unlike to reach 3 by the end of the century. (2) The assumed rate of growth of hybrid and electric vehicles—4.5 million by 2010, 27 million by 2020, 146 million by 2050, and 308 million by 2100—is optimistic, in part because all automobiles may not be hybrid or fully electric by 2050. (3) Some hybrid

Version: 90521
24
automobiles may use smaller batteries than the assumed 9 kWh battery, containing less lithium. For example, the Toyota Prius HEV uses a battery of 1.3 kWh. (4) New technologies may reduce the amount of lithium needed per battery. (5) The assumption that the use of lithium in secondary batteries, which are used in portable devices such as cell phones, will grow between 10 and 15 percent per year over the next 20 years is optimistic. (6) The forecasts only consider the recycling of automobile batteries, though other lithium batteries may be recycled as well. (7) The forecasts assume that demand for the other lithium applications (excluding aluminum production) will grow for more than 90 years without leveling off.
Figure 1 Illustrative Cumulative Availability Curves
Source: Tilton and Skinner (1987), and Tilton (2003).
a. Slowly rising slope due to gradual increase in costs.
Price and costs
Cumulative output
b. Discontinuity in slope due to jump in costs.
Price and costs
Cumulative output
Price and costs
Cumulative output
c. Sharply rising slope due to rapid increase in costs
Version: 90521
25
Figure 2 Types of Lithium Resources, Reserves, Products, and Major End-Use Applications
Pharmaceuticals and Primary Batteries
Lithium
Resources Minerals Brines Clays Sea Water
Lithium
Reserves Minerals Brines
Lithium
ProductsLithium Carbonate
Lithium Hydroxide
Concentrates
Lithium Metal
Butil Lithium
Major Applications
Glazes and Frits
Greases, Lubricants, Batteries and Inorganic Derivates
Aluminum, Continuous Casting Powder, Secondary Batteries, Pharmacuticals, Glazes and Frits
Lithium Chloride
Dehumidifier Systems
Synthetic Rubber, Polymers and Organic Derivates
Lithium Chloride
Lithium
Resources Minerals Brines Clays Sea Water
Lithium
Reserves Minerals Brines
Lithium
ProductsLithium Carbonate
Lithium Hydroxide
Concentrates
Lithium Metal
Butil Lithium
Major Applications
Glazes and Frits
Greases, Lubricants, Batteries and Inorganic Derivates
Aluminum, Continuous Casting Powder, Secondary Batteries, Pharmacuticals, Glazes and Frits
Lithium Chloride
Dehumidifier Systems
Synthetic Rubber, Polymers and Organic Derivates
Lithium Chloride

Version: 90521
26
Figure 3 Major End Uses of Lithium
Continuous Casting
3%
Chemical Processing
3%
Glass8%
Frits10%
Lubricating Greases
12%
Batteries25%
Aluminum4%
Air Conditioning
6%
Polymers4%
Pharmaceuticals3%
Others22%
Source: SQM (2007).
Figure 4 Average Lithium Carbonate Prices, 1953-2008
0
1
2
3
4
5
6
7
1953 1958 1963 1968 1973 1978 1983 1988 1993 1998 2003 2008
Dol
lars
per
pou
nd
Current Dollars 2008 Dollars

Version: 90521
27
Sources: Industrial Minerals (1999, 2000), Ober (1994 – 2006), U.S. Bureau of Mines (1953 – 1993), Yaksic (2008).
Figure 5
Cumulative Availability Curves for Lithium Under High and Low Cost Scenarios With Predicted Cumulative Demand from 2008 to 2100a
-
2
4
6
8
10
0 5 10 15 20 25 30 35 40Availability (Million tons of Lithium)
Cos
t (U
S$/lb
. lith
ium
carb
onat
e)
High Cost Scenario
Low Cost Scenario
Predicted Cumulative Lithium Demand 2008 – 2100
2100
Note: aThe reported data take into account losses that occur during processing. See Appendix Table 3.

Version: 90521
28
Appendix
Appendix Table 1 Lithium Resources in Minerals by Country and Deposit
COUNTRY DEPOSIT /PROVINCE
RESOURCESa (tonnes of lithium equivalent)
AUSTRALIA Greenbushes 255,000 Mount Cattlin 64,500 Mount Marion 19,800
AUSTRIA Koralpa 100,000 BRAZIL Minas Gerais 85,000
CANADA Bernic Lake 18,600 Barraute, Quebec 106,000 La Motte 22,600 Thompson Brothers 26,000 Yellowknife 129,000 Separation Rapids 72,200
CHINA Jaijika 450,000 Gajika 560,000 Maerkang 220,000
FINLAND Lantta 12,800 MALI Various 26,000
NAMIBIA Various 11,500 PORTUGAL Barroso - Alvao 10,000
RUSSIA Various 1,160,000 USA Kings Mountain 200,000
Cherryville 335,000
North Carolina Undeveloped
2,600,000
ZAIRE Manono - Kitololo 2,300,000 ZIMBABWE Masvingo 56,700
TOTAL 8,800,000
Notes: aLithium mineral resources include reserves. The figures are in-situ resources. As a result, they reflect the lithium in the ground before processing losses. It is recognized that there are more lithium mineral resources in other places of the world (e.g., China). However, there is no information to quantify them.

Version: 90521
29
Sources: Anstett and others (1990), Avalon Ventures (2008), Black Pearl Minerals (2008a, 2008b), Evans (2008a, 2008b), Galaxy Resources (2008), Garrett (2004), Geoscience Australia (2008), Norton (1973), Industrial Minerals (2007), Pavlovic (2002), Roskill (2006), Ober (2000), Vine (1976), Yaksic (2008).

Version: 90521
30
Appendix Table 2 Lithium Resources in Brines by Country and Deposits
COUNTRY DEPOSIT /PROVINCE
RESOURCESa (tonnes of lithium equivalent)
ARGENTINAb Hombre Muerto 815,000a Rincon 1,870,000g Olaroz 325,000h
BOLIVIAc Uyuni 5,500,000a CHILEd Atacama 35,700,000i
Maricunga 220,000a CHINA AND
TIBET Zhabuye 1,530,000a
DXC 140,600a Taijinaier 260,000a
Qaidam Basin, Qinghai 2,020,000j ISRAEL Dead Sea 2,000,000
USA Silver Peak 40,000a Searles Lake 31,600 Great Salt Lake 526,000 Salton Seae 1,000,000 Smackoverf 1,000,000
TOTAL 52,300,000
Notes: aLithium brine resources include reserves. The figures reflect the lithium in the ground before processing losses. Other resources of lithium brines are known to exist elsewhere (e.g., northern Chile and Argentina). However, the information needed to quantify them is not available. Figures for Hombre Muerto, Uyuni, Maricunga, Zhabuye, DXC, Taijinaier, and Silver Peak only include reserves. As a result, their total resources are much greater than the reported figures. bOnly three dry lakes are included. Other lithium containing salars in the Argentinian altiplano are Pastos Grandes, Ratones, Antofalla, Centenario, Pozuelos, Cauchari, Salinas Grandes, Jama, and others. cOnly one dry lake is included. There are other lithium containing salars in the Bolivian altiplano including Empexa, Coipasa, and Pastos Grandes. dOnly two dry lakes are included, while there are many lithium containing salars in the Chilean altiplano.

Version: 90521
31
eOnly one geothermal brine is included. fOnly one oilfield brine is included. g1.40 million tonnes after 75% recovery is equivalent to 1.87 million tonnes in-situ. hPreliminary estimation. iSeven million tonnes are lithium reserves. jThe Qaidam Basin has about 33 salt lakes, consisting of more than 13.92 million tonnes of lithium chloride resource. Taijinaier is included in the total figure. Sources: Admiralty Resources (2008), Ballivián and Risacher (1981), Evans (2008a, 2008b), Garrett (2004), Industrial Minerals (2007), Pavlovic (2002), Orocobre (2008), SQM (2009), Yaksic (2008).
Appendix Table 3 Total Lithium Resources in Minerals, Brines, Clays, and Oceans
IN SITU
(million tonnes of lithium equivalent)
RECOVERABLEa (million tonnes of
lithium equivalent) Minerals 8.8 4.4 Brines 52.3 23.5
Hectoritesb 2.0 1.0 Jaderitesc 0.9 0.5
Total (without oceans) 64.0 29.4
Oceans 224,000 44,800
Notes: aThe figures shown in this column are after processing losses. They assume a 50 percent recovery rate for hectorites and jaderites, a 50 percent recovery rate for pegmatites, a 45 percent recovery rate for brines, and a 20 percent recovery rate for oceans. An important portion of the lithium not recovered during processing could be recovered by re-processing, though production costs would be higher. Such recovery, however, is not considered in the figures reported in this column. bThe figures for hectorites may not include all the identified resources in the United States. See Evans (1986) and Kunasz (1994). cLithium in jaderites is not considered in the cumulative availability curve because cost data for this resource are not available. Sources: Evans (2008b), Western Lithium Corporation (2008), Yaksic (2008).

Version: 90521
32
Appendix Table 4 Lithium Reserves and Resources by Country and Deposits, Ranked by Production
Costs, With Grades, Evaporation Rates, and Magnesium to Lithium Ratios
R A NK I NG
DEPOSIT, PROVINCE OR
COUNTRY COUNTRY
GRADE (percent lithium)
RATIOS (magnesium to lithium)
EVAPORATION RATE
(mm per year)
RANGE OF COSTS
(dollars per pound)
1 Atacama Chile 0.15 6.4 3,700 0.70 – 1.00 2 DXC China (Tibet) 0.04-0.05 0.22 2,300 1.00 – 1.20
Zhabuye China (Tibet) 0.05-0.1 0.001 2,300 1.00 – 1.20 4 Taijinaier China 0.03 34 3,560 1.10 – 1.30
Hombre Muerto Argentina 0.06 1.37 2,600 1.10 – 1.30 Olaroz Argentina 0.09 2 2,600 1.10 – 1.30 Silver Peak USA 0.023 1.5 1,000 1.10 – 1.30
8 Rincon Argentina 0.04 8.5 2,600 1.20 – 1.50 Maricunga Chile 0.092 8 2,600 1.20 – 1.50 Greenbushes Australia 3.00 n/a n/a 1.20 – 1.50
11 Uyuni Bolivia 0.04 19 1,500 1.30 – 1.80
Masvingo (Bikita) Zimbabwe 1.4 n/a n/a 1.30 – 1.80
Bernic Lake Canada 1.28 n/a n/a 1.30 – 1.80 Cherryville USA 0.68 n/a n/a 1.30 – 1.80
15 Barroso-Alvao and Covas de
Barroso Portugal 0.37-0.77
and 0.72 n/a n/a 1.40 – 2.00
Gajika China n/d n/a n/a 1.40 – 2.00 Maerkang China n/d n/a n/a 1.40 – 2.00
18 Brazil Brazil n/d n/a n/a 1.50 – 2.00
19 Separation Rapids Canada 0.62 n/a n/a 1.80 – 2.20
20 Quebec Canada 0.53 n/a n/a 1.90 – 2.30 Jaijika China 0.59 n/a n/a 1.90 – 2.30
22 Qaidam Basin China n/d n/d n/d 1.50 – 2.50 23 Searles Lake USA 0.0065 125 1,000 2.00 – 2.50
Kings Mountain USA 0.69 n/a n/a 2.00 – 2.50 25 Etykinskoe Russia 0.23-0.79 n/a n/a 2.10 – 2.70 26 Namibia Namibia n/d n/a n/a 2.20 – 2.80
Salton Sea USA 0.022 1.3 1,800 2.20 – 2.80 Great Salt Lake USA 0.004 250 1,800 2.20 – 2.80

Version: 90521
33
29 Dead Sea Israel - Jordan 0.002 2,000 n/d 2.40 – 3.00
Manono - Kitololo Zaire 0.58 n/a n/a 2.40 – 3.00
Bougouni Area Mali 1.4 n/a n/a 2.40 – 3.00 32 Yellowknife Canada 0.66 n/a n/a 2.50 – 3.00
33 McDermitt USA 0.24 – 0.53 n/a n/a 3.50 – 4.70
North Carolina USA n/d n/a n/a 3.50 – 4.70
Russian pegmatites Russia n/d n/a n/a 3.50 – 4.70
36 Smackover USA 0.0386/ 0.0365 20 n/d 5.00 – 6.40
37 Oceans n/a 0.000017 n/a n/a 7.00 – 10.00
Notes: n/d = no data are available.
n/a = not applicable, either because the evaporation rate and ratio of magnesium to lithium are not relevant for lithium extracted from hard-rock mineral deposits or for other reasons.
Source: Yaksic (2008) and the sources cited there. Production costs are estimates by Yaksic (2008) based on a variety of industry sources.