Y Z D A S METCHEV BEN W. P. LEW GLENN SCHNEIDER … · draft version january 25, 2018 typeset using...
11
DRAFT VERSION JANUARY 25, 2018 Typeset using L A T E X twocolumn style in AASTeX61 CLOUD ATLAS: ROTATIONAL MODULATIONS IN THE L/T TRANSITION BROWN DWARF COMPANION HN PEG B YIFAN ZHOU, 1, * D´ ANIEL APAI , 1, 2, 3 STANIMIR METCHEV, 4 BEN W. P. LEW, 1, 3 GLENN SCHNEIDER, 1 MARK S. MARLEY, 5 THEODORA KARALIDI , 6 ELENA MANJAVACAS, 1 LUIGI R. BEDIN, 7 NICOLAS B. COWAN, 8 PAULO A. MILES-P´ AEZ, 4, 1 PATRICK J. LOWRANCE, 9 JACQUELINE RADIGAN, 10 AND ADAM J. BURGASSER 11 1 Department of Astronomy/Steward Observatory, The University of Arizona, 933 N. Cherry Avenue, Tucson, AZ, 85721, USA 2 Earths in Other Solar Systems Team, NASA Nexus for Exoplanet System Science. 3 Department of Planetary Science/Lunar and Planetary Laboratory, The University of Arizona, 1640 E. University Boulevard, Tucson, AZ, 85718, USA 4 Department of Physics & Astronomy and Centre for Planetary Science and Exploration, The University of Western Ontario, London, Ontario N6A 3K7, Canada 5 NASA Ames Research Center, Mail Stop 245-3, Moffett Field, CA 94035, USA 6 Department of Astronomy and Astrophysics, University of California Santa Cruz, 1156 High Street, Santa Cruz, CA 95064, USA 7 INAF Osservatorio Astronomico di Padova, Vicolo dell’Osservatorio 5, I-35122 Padova, Italy 8 Department of Earth & Planetary Sciences and Department of Physics, McGill University, 3550 Rue University, Montr´ eal, Quebec H3A 0E8, Canada 9 IPAC-Spitzer, MC 314-6, California Institute of Technology, Pasadena, CA 91125, USA 10 Utah Valley University, 800 West University Parkway, Orem, UT 84058, USA 11 Center for Astrophysics and Space Science, University of California San Diego, La Jolla, CA 92093, USA ABSTRACT Time-resolved observations of brown dwarfs’ rotational modulations provide powerful insights into the properties of conden- sate clouds in ultra-cool atmospheres. Multi-wavelength light curves reveal cloud vertical structures, condensate particle sizes, and cloud morphology, which directly constrain condensate cloud and atmospheric circulation models. We report results from Hubble Space Telescope/Wide Field Camera 3 near-infrared G141 taken in six consecutive orbits observations of HNPegB, an L/T transition brown dwarf companion to a G0V type star. The best-fit sine wave to the 1.1 - 1.7μm broadband light curve has the amplitude of and period of hr. The modulation amplitude has no detectable wavelength dependence except in the 1.4 μm water absorption band, indicating that the characteristic condensate particle sizes are large (> 1μm). We detect significantly (4.4σ) lower modulation amplitude in the 1.4μm water absorption band, and find that HN Peg B’s spectral modulation resembles those of early T type brown dwarfs. We also describe a new empirical interpolation method to remove spectral contamination from the bright host star. This method may be applied in other high-contrast time-resolved observations with WFC3. Keywords: brown dwarfs — stars: atmospheres — methods: observational Corresponding author: Yifan Zhou [email protected] * NASA Earth and Space Science Fellow https://ntrs.nasa.gov/search.jsp?R=20180001206 2019-02-02T09:43:52+00:00Z
Transcript of Y Z D A S METCHEV BEN W. P. LEW GLENN SCHNEIDER … · draft version january 25, 2018 typeset using...

DRAFT VERSION JANUARY 25, 2018Typeset using LATEX twocolumn style in AASTeX61
CLOUD ATLAS: ROTATIONAL MODULATIONS IN THE L/T TRANSITION BROWN DWARF COMPANION HN PEG B
YIFAN ZHOU,1 , ∗ DANIEL APAI,1, 2, 3 STANIMIR METCHEV,4 BEN W. P. LEW,1, 3 GLENN SCHNEIDER,1 MARK S. MARLEY,5
THEODORA KARALIDI,6 ELENA MANJAVACAS,1 LUIGI R. BEDIN,7 NICOLAS B. COWAN,8 PAULO A. MILES-PAEZ,4, 1
PATRICK J. LOWRANCE,9 JACQUELINE RADIGAN,10 AND ADAM J. BURGASSER11
1Department of Astronomy/Steward Observatory, The University of Arizona, 933 N. Cherry Avenue, Tucson, AZ, 85721, USA2Earths in Other Solar Systems Team, NASA Nexus for Exoplanet System Science.3Department of Planetary Science/Lunar and Planetary Laboratory, The University of Arizona, 1640 E. University Boulevard, Tucson, AZ, 85718, USA4Department of Physics & Astronomy and Centre for Planetary Science and Exploration, The University of Western Ontario, London, Ontario N6A 3K7, Canada5NASA Ames Research Center, Mail Stop 245-3, Moffett Field, CA 94035, USA6Department of Astronomy and Astrophysics, University of California Santa Cruz, 1156 High Street, Santa Cruz, CA 95064, USA7INAF Osservatorio Astronomico di Padova, Vicolo dell’Osservatorio 5, I-35122 Padova, Italy8Department of Earth & Planetary Sciences and Department of Physics, McGill University, 3550 Rue University, Montreal, Quebec H3A 0E8, Canada9IPAC-Spitzer, MC 314-6, California Institute of Technology, Pasadena, CA 91125, USA10Utah Valley University, 800 West University Parkway, Orem, UT 84058, USA11Center for Astrophysics and Space Science, University of California San Diego, La Jolla, CA 92093, USA
ABSTRACT
Time-resolved observations of brown dwarfs’ rotational modulations provide powerful insights into the properties of conden-sate clouds in ultra-cool atmospheres. Multi-wavelength light curves reveal cloud vertical structures, condensate particle sizes,and cloud morphology, which directly constrain condensate cloud and atmospheric circulation models. We report results fromHubble Space Telescope/Wide Field Camera 3 near-infrared G141 taken in six consecutive orbits observations of HN Peg B, anL/T transition brown dwarf companion to a G0V type star. The best-fit sine wave to the 1.1 − 1.7µm broadband light curvehas the amplitude of and period of hr. The modulation amplitude has no detectable wavelength dependence except in the 1.4µm water absorption band, indicating that the characteristic condensate particle sizes are large (> 1µm). We detect significantly(4.4σ) lower modulation amplitude in the 1.4µm water absorption band, and find that HN Peg B’s spectral modulation resemblesthose of early T type brown dwarfs. We also describe a new empirical interpolation method to remove spectral contaminationfrom the bright host star. This method may be applied in other high-contrast time-resolved observations with WFC3.
Keywords: brown dwarfs — stars: atmospheres — methods: observational
Corresponding author: Yifan [email protected]
∗ NASA Earth and Space Science Fellow
https://ntrs.nasa.gov/search.jsp?R=20180001206 2019-02-02T09:43:52+00:00Z

2 ZHOU ET AL.
1. INTRODUCTION
Condensate clouds fundamentally impact the spectra, thepressure-temperature structure, the luminosity evolution,longitudinal and latitudinal temperature distribution, andenergy transfer in the atmospheres of most transiting exo-planets (e.g., Kreidberg et al. 2014; Sing et al. 2016; Steven-son 2016), directly imaged exoplanets (e.g., Skemer et al.2014; Ingraham et al. 2014; Bonnefoy et al. 2016) and browndwarfs (e.g., Marley et al. 2002; Burgasser et al. 2002; Knappet al. 2004). Therefore, parametrized cloud models are an es-sential but not well tested component of atmospheric models.They play a particularly important role in many atmosphericretrieval studies (e.g. Benneke & Seager 2012; Line et al.2012, 2015; Burningham et al. 2017). However, cloud prop-erties are highly degenerate in disk-integrated observationswith other global and difficult-to-measure parameters (e.g.,bulk composition, vertical mixing rate, surface gravity, non-equilibrium chemistry). Time-resolved observations of rota-tional modulations enable disentangling the effects of globalparameters (constant for a given object) from locally vary-ing parameters (primarily cloud coverage), thus providing apowerful method for testing cloud models. An importantprediction of most cloud models is that surface gravity –through its impacts on pressure scale height and dust settlingrate – will have profound effects on cloud thickness. Indeed,exceptionally thick clouds have been proposed as the originof the very red colors and low near-infrared luminosity ofseveral directly imaged exoplanets (e.g., Skemer et al. 2011;Marley et al. 2012).
Recent results further increased the potential of time-resolved observations and rotational mapping for browndwarf and exoplanet atmospheric characterization. Karalidiet al. (2015) developed Aeolus that retrieves two-dimensionaltop-of-the-atmosphere maps from disk-integrated lightcurves. Apai et al. (2017) identified bands and spots in browndwarf atmospheres, and demonstrated similarities betweenatmospheric circulations in L/T transition brown dwarfs andin Neptune. The discovery of rotational modulations in di-rectly imaged exoplanets/planetary mass objects (Biller et al.2015; Zhou et al. 2016) allows comparative studies of con-densate clouds in brown dwarfs and exoplanets.
Cloud Atlas is a Hubble Space Telescope (HST) Wide fieldCamera 3 (WFC3) Large Treasury program (Program No.:14241; PI: Apai). The primary goal of the Cloud Atlasproject is to identify the role of surface gravity in setting theproperties of condensate clouds. To achieve this goal, theproject selected 21 brown dwarfs and planetary mass com-panions that were divided into four groups, (i) high effectivetemperature (Teff ) and high surface gravity (g), (ii) high Teff
and low g, (iii) low Teff and high g, and (iv) low Teff andlow g. We scheduled time-resolved spectroscopic observa-tions for and photometric observations for Each object was
initially observed in two consecutive HST orbits to assess thepresence of amplitude variability, then down-selecting a sub-set of objects to study with deep-look observations (DLO)with 6 to 12 follow-on consecutive orbits. We paid particularattention to the difference in rotational modulations in andout of the 1.4µm water absorption band because it is a sen-sible probe to cloud vertical structure (Yang et al. 2015). HNPeg B was among the targets we selected for six consecutiveorbits DLO.
HN Peg B (Luhman et al. 2007) is T2.5 type brown dwarfcompanion to its G0V type host star. HN Peg B has a pro-jected angular separation of 43.2 ± 0.4′′ from its host star,which corresponds to project physical distance of 795 ± 15
au (Luhman et al. 2007). HN Peg B and HN Peg A havea brightness contrast of 11.07 magnitude in J band. Themass of HN Peg B is estimated to be 12 – 30 MJup basedon evolutionary tracks (Luhman et al. 2007; Leggett et al.2008). Upon its discovery, Luhman et al. (2007) classifiedHN Peg B to be low or intermediate surface gravity based onthe youth of the host star (e.g., Gaidos 1998, 200-800 Myr;Barnes 2007, 237± 33Myr). However, Leggett et al. (2008)found that the near infrared spectra of HN Peg B agree bet-ter with higher gravity template (log g = 4.81), which castsdoubt on the original low surface gravity classification.
Using Spitzer Space Telescope time-resolved photometryMetchev et al. (2015) discovered rotational modulations inboth the [3.6] and the [4.5] channels, broad-band light curvesof HN Peg B. Metchev et al. (2015) classified the variabil-ity period type as long and used a Fourier series fit to deter-mine the rotation period to be hr, close to the total observa-tion length. The discovery of its rotational modulations madeHN Peg B an ideal brown dwarf companion for time-resolvedspectroscopy.
2. OBSERVATIONS AND DATA REDUCTION
We observed HN Peg B using Hubble Space Telescope/WideField Camera 3 near infrared (HST/WFC3/IR) channel onMay 16, 2017 as part of the HST Treasury program Cloud At-las. We monitored the target using the G141 low-resolution(R ∼ 130 at 1.4µm) grism in six consecutive orbits (8.6hours time baseline).
In order to minimize the contamination to HN Peg B’s ob-served spectrum by its host star we constrained the roll angleof the telescope to separate the primary and companion spec-tra on the detector. However, instrumentally-scattered grism-dispersed light from the bright host star is also distributedin a complex band-like pattern across the field-of-view thatcontaminates the traditional sky background at the locationof the companion spectrum (see Figure 1). At the location ofthe maximum, HN Peg A’s contamination pattern contributesabout 25% of the pixel counts and, without mitigation, de-grades the precision of the spectral and variability measure-

HST ROTATIONAL MODULATIONS OF HN PEG B 3
ments. In § 2.1, we describe in detail how we removed thecontamination band pattern.
Most data reduction procedures were done using aXe(Kummel et al. 2009) based pipeline following previousHST/WFC3 brown dwarf time-resolved spectral observationstudies (e.g., Apai et al. 2013; Lew et al. 2016). However, af-ter the sky background subtraction we included an additionalstep (described below) to remove the band pattern. After thisstep we followed the regular reduction approach, i.e., we fedthe band-subtracted frames to aXe and extracted the spectralsequence.
The extracted light curve for HN Peg B showed easily rec-ognizable signatures of ramp effect systematics. These sys-tematics were widely reported in time-resolved HST/WFC3observations(e.g., Berta et al. 2012; Apai et al. 2013; Dem-ing et al. 2014). We successfully removed these systemat-ics in the band subtracted light curves using the solid statephysics-motivated RECTE charge trap correction method(Zhou et al. 2017).
2.1. Primary Star Contamination Removal: Procedures
Thanks to the well-defined and repeatable spatial varia-tions of the contamination pattern, we successfully removedthem using an empirical interpolation method.
Our band subtraction algorithm includes three steps: (1)band recognition, (2) mapping the bands to a coordinate sys-tem that established based on band structure gradient and(3) interpolation. Image processing tasks that we used areavailable in python package scikit-image (van der Walt et al.2014). First, the algorithm recognizes and isolates the bandsfrom the rest of the image structure. To avoid the confusionof bands with the spectrum of HN Peg B we pre-processedevery frame by conservatively masking the spectral trace’sof HN Peg B and background stars (Figure 1 panel B). Wethen use ”inpainting” algorithms (Bertalmio et al. 2001) tointerpolate masked image regions. “inpainting” algorithmsreconstruct masked pixels based on non-masked region, andimprove the precision in recognizing the bands. We thensegmented the bands and the background using locally op-timized thresholding method. The algorithm computed athreshold mask based on local pixel neighborhood, which ef-fectively marked the foreground pixels (band pattern) as “1”and background pixels as “0” (Figure 1 panel C). Contourson the binary images were then used to identify individualbands. To filter out low SNR detection, we selected contoursthat were entirely included in the image and had enclosedsizes that are larger than 30 percentile of those of all detectedcontours. This procedure resulted in eight bands identifiedper frame (Figure 1 panel D).
Second, we regularized the selected bands and mappedthem with a unified coordinate system. For each band westarted the regularization by identifying the “semi-major
axis”, defined as the semi-major axis of an ellipse with thesame normalized second central moment as the band region.The “semi-major axis” measurement is a good estimate of thelength and orientation of the bands (Chaumette 2004). Weassumed that the top and bottom endpoints of each “semi-major axis” lay on two lines. Therefore we performed linearregressions to the top and bottom axis endpoints. The end-points were then adjusted along the axes such that the respec-tive points joined contiguously and co-linearly without anydiscontinuity. We then established an orthogonal coordinatesystem for each band. We converted the (x, y) image coor-dinates of each pixel to coordinates (ρ, r) in which ρ is thedistance from the upper end of the band in the “semi-majoraxis” direction and r is the distance from the point to thesemi-major-axis. In addition, we normalized ρ to the lengthof the semi-major-axis to account for the individual lengthof each band. The new coordinate systems were establishedfor individual bands, and the axes of the coordinate systemswere aligned with gradients of the surface brightness of eachband.
Third, we used empirically-determined interpolation func-tions to calculate the pixel values where bands and astrophys-ical spectra overlapped; i.e. in the regions masked as shownin Figure 1 panel B. We fit a bi-cubic spline surface to eachband. Numbers of knots for the cubic splines were 5 and 4for r and ρ direction, respectively. Finally, the best-fittingspline surface was the model for band intensity distribution(Figure 1 panel E) and was used for its subtraction (Figure 1panel F).
2.2. Contamination Removal: Error Analysis
We evaluated the band subtraction quality by injecting syn-thetic spectra to the original data and then measuring the dif-ference of the injected and extracted signals with and with-out band subtraction. Using the software aXeSIM (Kummelet al. 2009) We injected simulated rotational modulationsignals by multiplying the synthetic spectra with a sinusoidaltime series and adding the products to the original frames.We then processed the synthetic datasets in two ways, oncewith band removal and the once without it. We performedten iterations in a Monte Carlo fashion. For each iteration,the injected sinusoidal signal had random amplitude, period,and phase. The results are presented in Figure 2.
3. KECK/NIRSPEC OBSERVATIONS OF HN PEG B
We also present here a moderate-resolution (R ≈ 2300)J-band spectrum of HN Peg B that was obtained withKeck/NIRSPEC on 8 July 2008. We used the N3 (1.143–1.375 µm) filter with a two-pixel (0.′′38) wide slit, and ex-posed for a single ABBA sequence totalling 40 min of in-tegration time. Standard stars and arc lamps were observedafter the target. We performed the preliminary data reduction

4 ZHOU ET AL.
Figure 1. An example for original flt frame, intermediate product, and the result after band subtraction. The order of the images correspondsto the sequence of reduction steps. The Images are: A) image before band subtraction; B) high S/N bands with astrophysical signal maskedout; C) thresholding results, foreground pixels are plotted in white; D) coordinate regularization and re-mapping; E) empirically interpolatedsurface; F) image after band subtraction.

HST ROTATIONAL MODULATIONS OF HN PEG B 5
0.4
0.6
0.8
1.0
Nor
mal
ized
flux
Spectral Precision Test
CorrectedUncorrected
1.1 1.2 1.3 1.4 1.5 1.6Wavelength [ m]
0.10.00.1
0.96 0.98 1.00 1.02 1.04Injected Relative Photometry
0.96
0.98
1.00
1.02
1.04
Mea
sure
d R
elat
ive
Pho
tom
etry
Photometric Precision Test - white band
0.96 0.98 1.00 1.02 1.04Injected Relative Photometry
0.96
0.98
1.00
1.02
1.04
Mea
sure
d R
elat
ive
Pho
tom
etry
Photometric Precision Test - J band
0.96 0.98 1.00 1.02 1.04Injected Relative Photometry
0.96
0.98
1.00
1.02
1.04
Mea
sure
d R
elat
ive
Pho
tom
etry
Photometric Precision Test - water band
0.96 0.98 1.00 1.02 1.04Injected Relative Photometry
0.96
0.98
1.00
1.02
1.04
Mea
sure
d R
elat
ive
Pho
tom
etry
Photometric Precision Test - H band
Figure 2. The effect of band subtraction. Upper left: comparison of spectral recovery. Blue curves are extracted spectra after band subtractionand orange curves are those without band subtraction. Injected spectra are plotted in black lines. Upper right: comparison of broad-bandphotometry recovery. Extracted relative broadband photometry is plotted against the injected signal. Perfect recoveries (1:1) are plotted in graydashed lines for references.
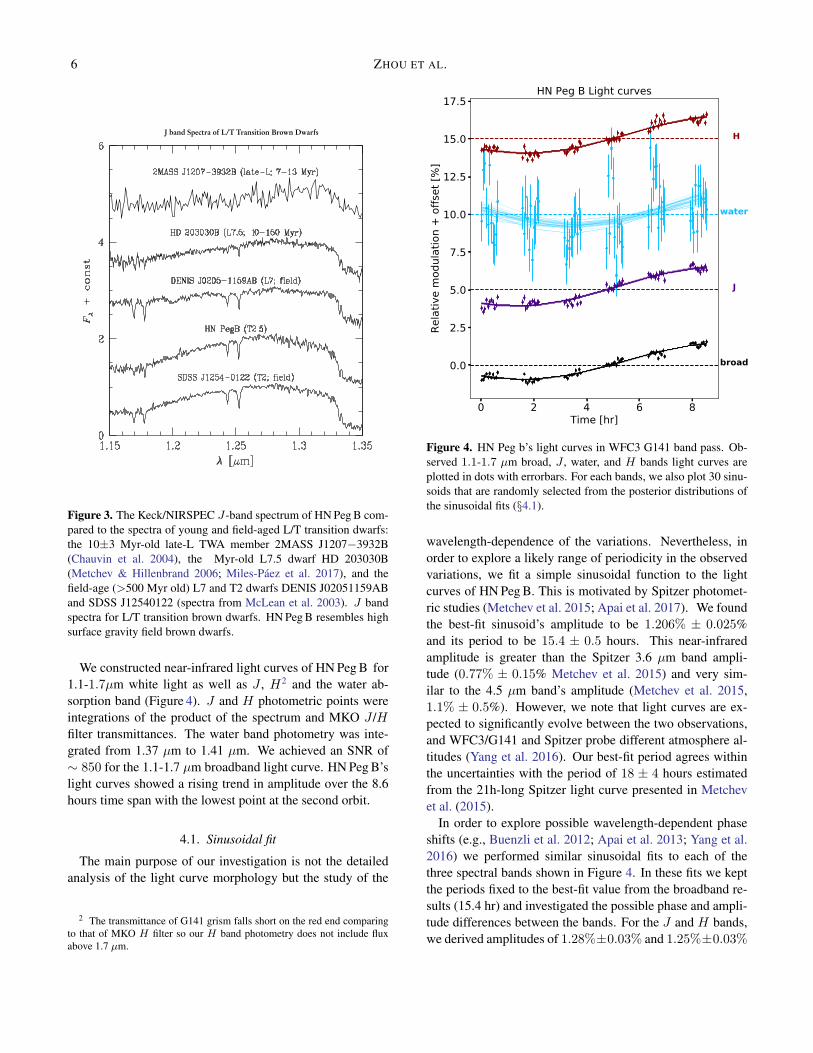
with the REDSPEC pipeline (Prato et al. 2002, REDSPECData Reduction Manual1). Individual exposures were flat-fielded, rectified, and wavelength calibrated. Optimal extrac-tion of the spectra was done with the IRAF APALL package.After correcting for telluric absorption the individual spectrawere median combined. The final NIRSPEC N3 spectrumof HN Peg B is shown in Figure 3, where it is compared tothe spectra of 100-150 Myr-old late-L dwarfs and of field(>500 Myr-old) L7 and T2 dwarfs.
As shown in Figure 3, the two K I absorption doublets atλ ≃ 1.1692-1.1778µm and λ ≃ 1.2437-1.2529µm are well-established surface gravity-sensitive diagnostics for distin-guishing young (≲150 Myr-old) from field-aged (≳500 Myr)ultra-cool dwarfs (Allers & Liu 2013; Liu et al. 2016). Thecomparison among the J-band spectra (Figure 3) shows theselines in HN Peg B to be comparable in strength to the field-aged objects, and much stronger (more pressure-broadened)than in the young objects. We therefore conclude that the
1 http://www2.keck.hawaii.edu/inst/nirspec/redspec.html
age of HN Peg B is likely ≳500 Myr. This is consistent withthe findings of Luhman et al. (2007), who assign a 100-500Myr age for the primary HN Peg A from chromospheric ac-tivity and space kinematics arguments. The age also agreeswell with the conclusions of (Leggett et al. 2008), whereinthey find best-fit to 1 - 4 micron spectral models (e.g., theirFig 4) with moderately high surface gravities (log g =4.8)in the older end of the age range 100-500 Myr. Evolutionmodel calculations of Leggett et al. (2008) predict a mass of28MJup for an age of 500 Myr.
4. RESULTS
We obtained high-quality G141 spectral time series forHN Peg B. Our spectra cover the wavelength range from 1.1to 1.7µm including the J photometric band and most of thethe H band, as well as the water and methane absorptionbands. The spectra of HN Peg B were dominated by waterabsorption near 1.1 and 1.4µm, which is consistent with anL/T transitional spectral type. The SNRs of the spectral are∼ 170 at the bright J and H band peaks and ∼ 40 at the faint1.4µm water absorption bands.
6 ZHOU ET AL.
J band Spectra of L/T Transition Brown Dwarfs
Figure 3. The Keck/NIRSPEC J-band spectrum of HN Peg B com-pared to the spectra of young and field-aged L/T transition dwarfs:the 10±3 Myr-old late-L TWA member 2MASS J1207−3932B(Chauvin et al. 2004), the Myr-old L7.5 dwarf HD 203030B(Metchev & Hillenbrand 2006; Miles-Paez et al. 2017), and thefield-age (>500 Myr old) L7 and T2 dwarfs DENIS J02051159ABand SDSS J12540122 (spectra from McLean et al. 2003). J bandspectra for L/T transition brown dwarfs. HN Peg B resembles highsurface gravity field brown dwarfs.
We constructed near-infrared light curves of HN Peg B for1.1-1.7µm white light as well as J , H2 and the water ab-sorption band (Figure 4). J and H photometric points wereintegrations of the product of the spectrum and MKO J /Hfilter transmittances. The water band photometry was inte-grated from 1.37 µm to 1.41 µm. We achieved an SNR of∼ 850 for the 1.1-1.7 µm broadband light curve. HN Peg B’slight curves showed a rising trend in amplitude over the 8.6hours time span with the lowest point at the second orbit.
4.1. Sinusoidal fit
The main purpose of our investigation is not the detailedanalysis of the light curve morphology but the study of the
2 The transmittance of G141 grism falls short on the red end comparingto that of MKO H filter so our H band photometry does not include fluxabove 1.7 µm.
Figure 4. HN Peg b’s light curves in WFC3 G141 band pass. Ob-served 1.1-1.7 µm broad, J , water, and H bands light curves areplotted in dots with errorbars. For each bands, we also plot 30 sinu-soids that are randomly selected from the posterior distributions ofthe sinusoidal fits (§4.1).
wavelength-dependence of the variations. Nevertheless, inorder to explore a likely range of periodicity in the observedvariations, we fit a simple sinusoidal function to the lightcurves of HN Peg B. This is motivated by Spitzer photomet-ric studies (Metchev et al. 2015; Apai et al. 2017). We foundthe best-fit sinusoid’s amplitude to be 1.206% ± 0.025%and its period to be 15.4 ± 0.5 hours. This near-infraredamplitude is greater than the Spitzer 3.6 µm band ampli-tude (0.77% ± 0.15% Metchev et al. 2015) and very sim-ilar to the 4.5 µm band’s amplitude (Metchev et al. 2015,1.1% ± 0.5%). However, we note that light curves are ex-pected to significantly evolve between the two observations,and WFC3/G141 and Spitzer probe different atmosphere al-titudes (Yang et al. 2016). Our best-fit period agrees withinthe uncertainties with the period of 18 ± 4 hours estimatedfrom the 21h-long Spitzer light curve presented in Metchevet al. (2015).
In order to explore possible wavelength-dependent phaseshifts (e.g., Buenzli et al. 2012; Apai et al. 2013; Yang et al.2016) we performed similar sinusoidal fits to each of thethree spectral bands shown in Figure 4. In these fits we keptthe periods fixed to the best-fit value from the broadband re-sults (15.4 hr) and investigated the possible phase and ampli-tude differences between the bands. For the J and H bands,we derived amplitudes of 1.28%±0.03% and 1.25%±0.03%

HST ROTATIONAL MODULATIONS OF HN PEG B 7
0.2
0.4
0.6
0.8
1.0
Norm
alize
d flu
x
Max&Min Spectra and Their DifferenceMaxMin
J Peak
Water
H Peak
1.1 1.2 1.3 1.4 1.5 1.6Wavelength ( m)
2
0
2
4
6
F/F
[%]
Figure 5. Wavelength dependence of HN Peg B’s rotational modu-lation amplitudes. We median combined the 8 brightest (blue) and8 faintest (orange) spectra, and calculated their difference based onEquation 1. Three sub-panels highlight J , water, and H bands.Spectra and their difference are all smoothed using a Gaussian ker-nel with σ = 1.5 pixels.
and phases of 0.663±0.005 and 0.639±0.005, respectively.Therefore, the sinusoidal amplitudes of J and H bands arestatistically identical within 1σ and are slightly larger thanthe broad-band value. J and H bands have a phase differ-ence of 2.4% . However, we consider this possible phase dif-ference tentative given the very basic light curve modelingapplied here, which also affects our uncertainty estimates. Incontrast to the J/H bands the 1.4µm water band light curvedoes not have enough precision to produce a reliable phasemeasurement (see Figure 4).
4.2. Spectral modulations
The high SNR spectral time series allowed us to investi-gate the wavelength dependence of the rotational modula-tions. Following a method introduced by Apai et al. (2013)we selected the eight spectra closest to the brightest segmentand the eight spectra closest to the faintest segment of thelightcurve and median-combined each sets. In Figure 5 weplot the two median spectra and their relative difference. Fol-lowing Buenzli et al. (2015), we defined spectral modulation
as∆Fλ
Fλ
∆Fλ
Fλ=
Fλ,max − Fλ,min
Fλ,mean(1)
and plot it in the bottom panel of Figure 5. Two key re-sults are immediately apparent from Figure 5. First, the spec-tral modulations are very gray, essentially identical in theJ- and H-bands. Second, the amplitude is significantly re-duced in the 1.4µm water absorption band: The relative waterband maximum-to-minimum difference (wavelengths rang-ing from 1.37 to 1.41µm) is only 0.80 ± 0.41% while thisdifference outside the water absorption band is 2.56±0.06%.The difference in the water band (1.37µm < λ < 1.41µm)is 4.36σ below that outside of water band and only 1.9σ
level above zero. Similar reductions of modulation ampli-tude in water absorption band have been previously found inall three L/T transition brown dwarfs with HST/G141 time-resolved spectroscopy (Apai et al. 2013; Yang et al. 2015;Buenzli et al. 2015).
5. DISCUSSION
5.1. Spectral slopes and Amplitudes
Our WFC3/G141 time-resolved spectroscopy of HN Peg Benlarges the small sample (size of 3) of L/T transition browndwarfs that have precise spectro-photometric rotational mod-ulation measurements. In addition, HN Peg B is differentfrom the existing sample of field L/T transition brown dwarfsbecause it is a companion to a star, with a star-to-companionmass ratio estimated to be > 30. Here we compare HN Peg Bwith L/T transition brown dwarfs 2M2139, SIMP0136 (Apaiet al. 2013; Yang et al. 2015), and Luhman16 B (Buenzliet al. 2015) to explore the wavelength dependence of theirrotational modulations. We compiled the four objects’ spec-tral modulation curves in Figure 6. The spectral modulationcurves of 2M2139, SIMP0136, and Luhman 16 B are repro-duced from literature. The four objects’ broadband modula-tions amplitudes range from 2.56% to 24.9%, however, theirmodulations all follow a similar pattern. Each of the four ro-tational amplitude curves show a significant decrease in the1.4 µm water absorption band. We identify three quantitiesto characterize spectral modulations: the 1.1 – 1.7 µm broad-band modulation amplitude, the difference in the 1.4 µm wa-ter absorption with respect to the adjacent continuum bands∆Fout
Fout− ∆Fin
Fin, and the
∆Fλ
Fλmodulations’ spectral slope
measured outside of the water absorption band. We follow
Yang et al. (2015) to define∆Fin
Finas the weighted average
∆Fλ
Fλwith HST/WFC3 filter F139M’s throughput and with
that of filter F127M and F153M (Dressel 2017). The resultsare listed in Table 1.
Among the four brown dwarfs HN Peg B has the lowestmodulation amplitude as well as the flattest spectral modula-tion slope. HN Peg B’s measured spectral modulation slope –outside of 1.4µm molecular absorption bands – agrees withwavelength-independent modulations. The broadband am-

8 ZHOU ET AL.
Table 1. Spectral modulation characteristics in the four L/T transition brown dwarfs with HST/G141time-resolved spectroscopy.
Object Spec. Type J-H Broadband amplitude Slope∆Fout
Fout− ∆Fin
FinRef.
mag (%) (%/µm) (%)
HN Peg Ba T2.5 0.46 2.56± 0.06 −0.13± 0.28 1.7± 0.4 1, 2
2M2139 L8.5+T3.5 0.55 24.91± 0.02 −9.52± 0.13 11.6± 0.1 3, 4
SIMP0136 T2.5 0.69 5.23± 0.03 −0.55± 0.13 1.6± 0.2 4, 5
Luhman16B T0.5 0.83 9.9± 0.03 −3.94± 0.14 3.2± 0.2 6aHN Peg b’s modulation amplitude should be considered a minimum since our observations covered only∼50-60% of the rotational phase space.
References—(1) Luhman et al. (2007); (2) Leggett et al. (2008); (3) Burgasser et al. (2010); (4) Cutriet al. (2003); (5) Faherty et al. (2009); (6) Burgasser et al. (2013)
plitudes and spectral modulation-wavelength slopes of L/Ttransition brown dwarfs follow a correlation that was initiallyrecognized by Lew et al. (2016) using a sample of six browndwarfs that have WFC3/G141 rotational modulation mea-surements. The low amplitude and flat spectral modulationspectral slope of HN Peg B further reinforces this empiricaltrend.
5.2. Cloud top heights
The lower modulation amplitude in the 1.4µm water ab-sorption band can be explained by a model proposed byYang et al. (2015) (sample including L and L/T transitionbrown dwarfs), who used an analytical approximation aswell as a radiative transfer model to demonstrate the mech-anism. In this model the relative modulation amplitude in-and out of the water absorption band is approximately givenby ϵ = exp(τcont. − τwater), where τcont. and τwater are theoptical depths measured from the top of atmosphere to thecloud layer that introduces the modulations. We exploredthe implications of this model in the context of the spectralslopes observed in Table 1. Along with their spectra in Fig-ure 6, we also plot the pressure levels the different wave-lengths probe the atmospheres — 80% of the flux emergefrom the gray shaded region and above in lower panel of Fig-ure 6. We adopt the same pressure level results for SIMP0136from Yang et al. (2016), because of the similarities of spectraltype between HN Peg B and SIMP0136. For example, in theJ-band continuum window observations will typically probedown to about 7-9 bar pressures, while in the 1.4µm waterband observations probe only down to about 2-4 bar pres-sure levels. Therefore, the effective top of atmosphere near1.4µm is ∼ 3 bar lower in pressure than it is in the contin-uum band. This in turn implies that τcont.−τwater is negativeand modulation in water absorption band is smaller than it is
in the continuum band. The relative modulations in- and outof the 1.4 µm water absorption band for HN Peg B agree well(within 1σ uncertainty) with those reported for the other threeL/T transition brown dwarfs. This similarity suggests that thevertical cloud structure for HN Peg B is not different from thethree L/T transition brown dwarfs studied previously.
5.3. Constraints on Cloud Particle Sizes
We also investigate the characteristic particle size in thecondensate clouds assuming that Mie scattering extinction isthe primary source of modulations, following Hiranaka et al.(2016). While the best constraints on atmospheric aerosolparticle sizes come from broad wavelength coverage, the flatslope over our WFC3 spectral range does allow us to place aconstraint on the minimum particle size of the clouds. Weused the same model as Schlawin et al. (2017) in whichclouds that introduce the modulations are made of spheri-cal forsterite grains and optically thin, and the dust particlesize is described by a log-normal distribution characterizedby the median grain radius r and the scale parameter σs. Inthis model the spectral modulation amplitudes linearly scalewith the Mie extinction coefficients. We find that in order toreproduce a flat modulation spectral slope, the model requiresrelatively large characteristic particle sizes (r > 1.0µm). Theparticle size we find for HN Peg B is significantly greater thanthose for dusty late L-type brown dwarfs (∼ 0.2 − 0.4µm,Schlawin et al. 2017; Lew et al. 2016), but similar to someless-varying L dwarfs (2M1507, Yang et al. 2015, LP261-B,Manjavacas et al. 2017).
5.4. Toward High-Contrast Time-resolved Spectroscopy
In addition to the astrophysical results our study illustratesthe complicating factors (contamination and complex spec-trally dispersed point spread function) introduced by nearby

HST ROTATIONAL MODULATIONS OF HN PEG B 9
Cloud base
Cloud top
clo
ud la
yer
Figure 6. Comparison of HN Peg B with L/T transition browndwarfs that have WFC3 G141 time-resolved observations. Upper:Spectral modulations defined in equation 1 are plotted. Lines arebest-fit linear trends for spectral modulations out of 1.4µm waterabsorption band. Lower: Vertical spans of the atmosphere that areprobed by different wavelength light curves are indicated in gray.(Pressure levels are calculated specifically for SIMP0136. Wave-length ranges that were not listed in Yang et al. (2016) are interpo-lated with adjacent bands. Red solid and dashed line show cloudbase and top, respectively.)
bright companions in WFC3 G141 observations. Impor-tantly, even though the bright source HN Peg A was morethan 40′′ away, well outside the field of view, these effects,without mitigation in post-processing as detailed in §2.1,would have seriously impacted our observations. To reme-diate, we demonstrate that empirical interpolation can effec-tively correct for such systematics and allows nearly photon-noise limited precision. We describe a spatially periodic lightpattern on the detector and present two lines of evidence sup-porting that it originates from a spectrally dispersed Fraun-hofer diffraction pattern from a circular aperture. First, thetraces of the stripes converge to the same point (outside our
images). Second, we show that the median brightness of thestripes decay as 1/N3, where N is the stripe number. There-fore, an optical contamination correction model will likelyimprove WFC3/G141 time-resolved observations for whichthe targets are close binaries (e.g., Buenzli et al. 2015; Beattyet al. 2017) or have nearby bright sources. Future versions ofWFC3/G141 PSF simulators (e.g., aXeSIM, Kummel et al.2009; Wayne, Varley et al. 2017) may also take this effectinto account.
6. SUMMARY
The key results of our study are as follows:(i) Our study demonstrates an empirical image processing
method that can remove the contamination from the spec-trally dispersed side lobes of the point spread functions ofbright, close companions to the target in G141 observations.
(ii) We present time-resolved spectroscopy of the rota-tional modulations in the L/T transition brown dwarf masscompanion HN Peg B. We confirm the presence of rotationalmodulations in the light curve of HN Peg B. The 1.1µm-1.7µm broadband modulation amplitude and period are1.206±0.025% and 15.4±0.5 hours, respectively, which areconsistent with those reported in the Spitzer Space Telescopephotometric study by Metchev et al. (2015), considering thedifferent wavelengths of observation. The temporal base-line of our observations corresponds to about 60% of theestimated rotational period of HN Peg B. Our light curve ap-pears to probe the minimum of the light curve, but not itspeak.
(iii) We found that the rotational amplitude outside the wa-ter absorption band is nearly independent of wavelength: ourmeasurements are consistent with an amplitude of 1.25% inthe λ = 1.1− 1.65µm wavelength range, with the exceptionof the 1.4µm water band. We found a significantly reducedvariability amplitude in the water band. The modulation am-plitude in the water absorption band is lower than that of thecontinuum by more than 4σ level.
(iv) HN Peg B is a non-tidally locked brown dwarf com-panion for which rotational spectral mapping is possible. Wefound that its rotational modulations resemble closely thoseobserved in higher-gravity and (presumably) older T2 browndwarfs (2M2139: Apai et al. 2013; Luhman 16: Buenzliet al. 2015) and that of the likely planetary-mass but unboundbrown dwarf SIMP0136 (Apai et al. 2013).
(v) Assuming Mie scattering, the fact that HN Peg B’s ro-tational modulation amplitude is very close to wavelength-independent argues for the characteristic dust particle size ofthe cloud to exceed 1µm).
Our study increased the small sample of L/T transitionbrown dwarfs with time-resolved spectroscopy. We showthat the nature of the rotational modulations in the first L/Tcompanion to a star resembles those observed in field brown

10 ZHOU ET AL.
dwarfs, suggesting that cloud vertical structures are similarfor companions to stars and for individual brown dwarfs.
We acknowledge the anonymous referee for a construc-tive report that improves the manuscript. We acknowledgeDr. Sandy Leggett for valuable discussion on HN PegB’s spectral fitting and Dr. Peter McCullough for help-ful discussion on the cause of the image contamination.Y.Z. acknowledges support in part by the NASA Earth andSpace Science Fellowship Program - Grant NNX16AP54H.D.A. acknowledges support by NASA under agreement No.NNX15AD94G for the program Earths in Other Solar Sys-
tems. Support for Program number 14241 was provided byNASA through a grant from the Space Telescope ScienceInstitute, which is operated by the Association of Universi-ties for Research in Astronomy, Incorporated, under NASAcontract NAS5-26555. Based on observations made withthe NASA/ESA Hubble Space Telescope, obtained in GOprogram 14241 at the Space Telescope Science Institute.
Software: , Numpy&Scipy (van der Walt et al. 2011),Matplotlib (Hunter 2007), IPython (Perez & Granger 2007),Astropy (Robitaille et al. 2013), scikit-image (van der Waltet al. 2014)
REFERENCES
Allers, K. N., & Liu, M. C. 2013, ApJ, 772, 79Apai, D., Radigan, J., Buenzli, E., et al. 2013, ApJ, 768, 121Apai, D., Karalidi, T., Marley, M., et al. 2017, Science, 357, 683Barnes, S. A. 2007, ApJ, 669, 1167Beatty, T. G., Madhusudhan, N., Tsiaras, A., et al. 2017, AJ, 154,
158Benneke, B., & Seager, S. 2012, The Astrophysical Journal, 753,
100Berta, Z. K., Charbonneau, D., Desert, J.-M., et al. 2012, ApJ, 747,
35Bertalmio, M., Bertozzi, A. L., & Sapiro, G. 2001, in Computer
Vision and Pattern Recognition, 2001. CVPR 2001. Proceedingsof the 2001 IEEE Computer Society Conference on, Vol. 1,IEEE, I–I
Biller, B. A., Vos, J., Bonavita, M., et al. 2015, ApJL, 813, L23Bonnefoy, M., Zurlo, A., Baudino, J., et al. 2016, Astronomy &
Astrophysics, 587, A58Buenzli, E., Saumon, D., Marley, M. S., et al. 2015, ApJ, 798, 127Buenzli, E., Apai, D., Morley, C. V., et al. 2012, The Astrophysical
Journal Letters, 760, L31Burgasser, A. J., Cruz, K. L., Cushing, M., et al. 2010, ApJ, 710,
1142Burgasser, A. J., Marley, M. S., Ackerman, A. S., et al. 2002, The
Astrophysical Journal Letters, 571, L151Burgasser, A. J., Sheppard, S. S., & Luhman, K. L. 2013, ApJ, 772,
129Burningham, B., Marley, M. S., Line, M. R., et al. 2017, Monthly
Notices of the Royal Astronomical Society, 470, 1177Chaumette, F. 2004, IEEE Transactions on Robotics, 20, 713Chauvin, G., Lagrange, A.-M., Dumas, C., et al. 2004, A&A, 425,
L29Cutri, R. M., Skrutskie, M. F., van Dyk, S., et al. 2003, VizieR
Online Data Catalog, 2246Deming, D., Knutson, H., Kammer, J., et al. 2014, 28Dressel, L. 2017, Wide Field Camera 3, HST Instrument Handbook
Faherty, J. K., Burgasser, A. J., Cruz, K. L., et al. 2009, AJ, 137, 1
Gaidos, E. J. 1998, PASP, 110, 1259
Hiranaka, K., Cruz, K. L., Douglas, S. T., Marley, M. S., &Baldassare, V. F. 2016, ApJ, 830, 96
Hunter, J. D. 2007, Comput. Sci. Eng., 9, 90
Ingraham, P., Marley, M. S., Saumon, D., et al. 2014, TheAstrophysical Journal Letters, 794, L15
Karalidi, T., Apai, D., Schneider, G., Hanson, J. R., & Pasachoff,J. M. 2015, ApJ, 814, 65
Knapp, G., Leggett, S. K., Fan, X., et al. 2004, The AstronomicalJournal, 127, 3553
Kreidberg, L., Bean, J. L., Desert, J.-M., et al. 2014, Nature, 505,69
Kummel, M., Walsh, J. R., Pirzkal, N., Kuntschner, H., & Pasquali,A. 2009, PASP, 121, 59
Leggett, S., Saumon, D., Albert, L., et al. 2008, The AstrophysicalJournal, 682, 1256
Lew, B. W. P., Apai, D., Zhou, Y., et al. 2016, ApJ, 829, L32
Line, M. R., Teske, J., Burningham, B., Fortney, J. J., & Marley,M. S. 2015, The Astrophysical Journal, 807, 183
Line, M. R., Zhang, X., Vasisht, G., et al. 2012, The AstrophysicalJournal, 749, 93
Liu, M. C., Dupuy, T. J., & Allers, K. N. 2016, ApJ, 833, 96
Luhman, K., Patten, B., Marengo, M., et al. 2007, TheAstrophysical Journal, 654, 570
Manjavacas, E., Apai, D., Zhou, Y., et al. 2017, AJ, 155, 11
Marley, M. S., Saumon, D., Cushing, M., et al. 2012, TheAstrophysical Journal, 754, 135
Marley, M. S., Seager, S., Saumon, D., et al. 2002, TheAstrophysical Journal, 568, 335
McLean, I. S., McGovern, M. R., Burgasser, A. J., et al. 2003, ApJ,596, 561
Metchev, S. A., & Hillenbrand, L. A. 2006, ApJ, 651, 1166
Metchev, S. A., Heinze, A., Apai, D., et al. 2015, ApJ, 799, 154

HST ROTATIONAL MODULATIONS OF HN PEG B 11
Miles-Paez, P. A., Metchev, S., Luhman, K. L., Marengo, M., &
Hulsebus, A. 2017, The Astronomical Journal, 154, 262
Perez, F., & Granger, B. E. 2007, Comput. Sci. Eng., 9, 21
Prato, L., Simon, M., Mazeh, T., Zucker, S., & McLean, I. 2002,
The Astrophysical Journal Letters, 579, L99
Robitaille, T. P., Tollerud, E. J., Greenfield, P., et al. 2013, A&A,
558, A33
Schlawin, E., Burgasser, A. J., Karalidi, T., Gizis, J. E., & Teske, J.
2017
Sing, D. K., Fortney, J. J., Nikolov, N., et al. 2016, Nature, 529, 59
Skemer, A. J., Close, L. M., Szcs, L., et al. 2011, ApJ, 732, 107
Skemer, A. J., Marley, M. S., Hinz, P. M., et al. 2014, The
Astrophysical Journal, 792, 17
Stevenson, K. B. 2016, The Astrophysical Journal Letters, 817,L16
van der Walt, S., Colbert, S. C., & Varoquaux, G. 2011, Comput.Sci. Eng., 13, 22
van der Walt, S., Schonberger, J. L., Nunez-Iglesias, J., et al. 2014,PeerJ, 2, e453
Varley, R., Tsiaras, A., & Karpouzas, K. 2017, The AstrophysicalJournal Supplement Series, 231, 15pp
Yang, H., Apai, D., Marley, M. S., et al. 2015, ApJ, 798, L13—. 2016, ApJ, 826, doi:10.3847/0004-637X/826/1/8Zhou, Y., Apai, D., Lew, B. W. P., & Schneider, G. 2017, AJ, 153,
243Zhou, Y., Apai, D., Schneider, G. H., Marley, M. S., & Showman,
A. P. 2016, ApJ, 818, 176
![K T arXiv:1909.02028v1 [astro-ph.GA] 4 Sep 2019 · draft version september 6, 2019 typeset using latex twocolumn style in aastex61 a radio-to-millimeter census of star-forming galaxies](https://static.fdocuments.net/doc/165x107/6021d0cc03eebc3b9d4566bd/k-t-arxiv190902028v1-astro-phga-4-sep-2019-draft-version-september-6-2019.jpg)


![arXiv:1810.10558v1 [astro-ph.GA] 24 Oct 2018Draft version October 26, 2018 Typeset using LATEX twocolumn style in AASTeX61 REVEALING ENVIRONMENTAL DEPENDENCE OF MOLECULAR GAS CONTENT](https://static.fdocuments.net/doc/165x107/6015e8adf2793d6ec50f984a/arxiv181010558v1-astro-phga-24-oct-2018-draft-version-october-26-2018-typeset.jpg)


![2 M M. LDRAFT VERSION SEPTEMBER 6, 2019 Typeset using LATEX twocolumn style in AASTeX61 FIRST [NII]122 mLINE DETECTION IN A QSO-SMG PAIR BRI 1202-0725 AT Z=4.69 MINJU M. LEE,1, 2,](https://static.fdocuments.net/doc/165x107/60cc24ecce95f4445b4e1826/2-m-m-l-draft-version-september-6-2019-typeset-using-latex-twocolumn-style-in.jpg)

![arXiv:1710.05088v1 [astro-ph.SR] 13 Oct 2017 · 2017. 10. 17. · Draft version October 17, 2017 Typeset using LATEX twocolumn style in AASTeX61 THE MAGNETIC FUTURE OF THE SUN Philip](https://static.fdocuments.net/doc/165x107/60b7c1f57e4cc422be1f113e/arxiv171005088v1-astro-phsr-13-oct-2017-2017-10-17-draft-version-october.jpg)

![DRAFT VERSION JUNE A twocolumn style in AASTeX62 · 2021. 6. 9. · arXiv:2106.04158v1 [astro-ph.GA] 8 Jun 2021 DRAFT VERSION JUNE 9, 2021 Typeset using LATEX twocolumn style in AASTeX62](https://static.fdocuments.net/doc/165x107/61360bd60ad5d2067647c439/draft-version-june-a-twocolumn-style-in-aastex62-2021-6-9-arxiv210604158v1.jpg)