INDIAN OIL CORPORATION LIMITED - Bombay Stock … Document Indian Oil Corporation Limited
Upload
nguyenminhCategory
view
226download
0
Bankers’ Meet
7th August 2014

IOCL – An Important Pillar in the Indian Economy
Key Credit Considerations
Indian Economy
Oil Industry in India
IOCL’s Core Operations
Strategic Initiatives
Financial Performance
Ongoing Projects
IOCL – An Overview

#
Indian Oil Corporation Limited – A prelude
India’s largest crude oil refiner - 31% market share with 65.70
MMTPA capacity
India’s largest downstream pipeline network - 47% market
share with length of over 11,000 km
India’s largest oil marketing company - 42% market share with
over 41,500 touch points
India’s only downstream oil company to have a state of art R&D
Centre
India’s top ranked Fortune Global 500 Company – 96th rank
India’s largest integrated oil company - petroleum,
petrochemical, gas, exploration & production, renewable
energy, nuclear energy
India’s largest commercial enterprise - turnover of USD 76.36
billion
#

Flagship national oil company and downstream petroleum major
“Maharatna” status – another jewel in the crown
Contribution to Exchequer US$ 14.38 billion for FY 2013-14
Major supplier to core sector
Supplier of fuel to Government organizations i.e. railways, army, air force & navy
Key sectors like fertilizer, power & aviation are largely supplied by IOCL
Credit Profile
International:
Baa3 : by Moody’s
BBB- : by Fitch
Domestic
Long Term: AAA; by CRISIL, ICRA, India Ratings & Research (Fitch), CARE
Short Term: A1+ by CRISIL & ICRA
IOCL – An Important Pillar in the Indian Economy
Note: US$-INR: 59.92(as on 31st March 2014) 3

4
0
2
4
6
8
10
12
0
10
20
30
40
50
60
70
80
Turnover Net Worth
Turnover 0.01
Networth 0.01
Turnover 76.36
Networth 11.01
US$ Billion… From a humble beginning to an OIL GIANT
Saga of Growth
US$-INR: 59.92 (as on 31st March 2014)
2014 1965

IOCL – An Important Pillar in the Indian Economy
Key Credit Considerations
Indian Economy
Oil Industry in India
IOCL’s Core Operations
Strategic Initiatives
Financial Performance
Ongoing Projects
IOCL – An Overview

6
Indian Economy
Still One of the Fastest Growing Economies of the World
World’s third largest economy in Purchasing Power Parity (PPP)
Global growth has slowed down and India is no exception. However………
Source: IMF, World Economic Outlook , April 2014
Legends:
• ASEAN-5: Indonesia, Malaysia, Philippines, Thailand and Vietnam
• MENA: Middle East & North Africa
• P denotes Projection
6.3
4.74.4
5.4
6.4
0.5
3.5
6.5
9.5
2011 2012 2013 2014 P 2015 P
China
India
ASEAN-5
Russia
Brazil
MENA
% GDP Growth (YoY)

IOCL – An Important Pillar in the Indian Economy
Key Credit Considerations
Indian Economy
Oil Industry in India
IOCL’s Core Operations
Strategic Initiatives
Financial Performance
Ongoing Projects
IOCL – An Overview

UPSTREAM
(Exploration &
Production)
DOWNSTREAM
(Refining, Marketing
& Pipelines)
GAS (Transport &
Distribution)
Oil Industry in India – An Overview
Oil & Natural Gas Corporation Ltd. (ONGC) 2
Oil India Ltd.
Indian Oil Corporation Ltd.
Hindustan Petroleum Corporation Ltd. (HPCL)3
Bharat Petroleum Corporation Ltd. (BPCL) 4
GAIL (India) Ltd.
Reliance, Cairn Energy, HOEC, Premier Oil etc
Reliance Industries Ltd. (RIL) / Essar Oil Ltd. / Shell
1 – includes subsidiary Chennai Petroleum Corporation Ltd. (CPCL); 2 –includes subsidiary ONGC Videsh Ltd (OVL); 3 --- includes Bathinda Refinery (HPCL-Mittal Energy
Limited ) 4 – includes subsidiary Numaligarh Refinery Ltd & Bina Refinery (Bharat Oman Refineries Limited).; 5 – a subsidiary of ONGC Ltd.
Mangalore Refinery & Petrochemicals Ltd (MRPL) 5
IndianOil Corporation Ltd.
Reliance Industries Ltd. (RIL)
Gujarat State Petroleum Corporation (GSPC)
Indraprastha Gas Ltd (IGL)
Mahanagar Gas Ltd (MGL)
8
Indian Oil Corporation Ltd. 1

100
115
130
145
160
FY09 FY10 FY11 FY12 FY13 FY14
134138 141
148
157 158Consumption (MMT)
Source: Petroleum Planning & Analysis Cell, Ministry of Petroleum & Natural Gas, Govt. of India
Consumption of petroleum products grew at CAGR of 3.44% in last five years
Growing Oil Demand
9
IOCL – An Important Pillar in the Indian Economy
Key Credit Considerations
Indian Economy
Oil Industry in India
IOCL’s Core Operations
Strategic Initiatives
Financial Performance
Ongoing Projects
IOCL – An Overview

11
One of the Government of India’s
“Maharatnas” i.e. valuable jewel
Being a Government Company, IOCL
is governed by provisions of Section
619 of Company’s Act (India) –
Statutory Auditors are appointed by
the Comptroller and Auditor General
of India
Under the administrative control of
Ministry of Petroleum and Natural
Gas (MOP&NG), Govt. of India
Positions for non-executive nominee
Directors from MOP&NG
* Others include individuals, banks etc.
A Government Company
Government has no intention to dilute its majority shareholding in IOCL due to
its strategic importance to India’s energy and socio-economic development
Shareholding pattern as on 31st March 14
68.57%
6.61%
5.00%
6.05%
13.77%
GOI ONGC OIL Insurance/MF/FII Others*

12
Government Ownership and support in all spheres of the Company’s operations
* Total equity ownership including equity stake directly held by the Government (68.57%) and that held indirectly through ONGC (13.77%)
and OIL (5.00%).
Performance:
Annual MoU
with Govt. for
performance
Capital
Raising:
Government
Approval Board
Control:
Members
Nominated to
IOC Board
Pricing:
Select
petroleum
products
based on
Govt.
initiative
Functional
Directors:
Appointment
by President
of India
Equity
Control:
87.34%*
Government Of India’s Ownership & Support

Operating Structure
…. also diversified into E&P, Gas, Wind, Solar, Nuclear Power and Bio-fuels
Downstream & Petrochemical Operations
Refining Pipeline Transportation
Fuel Marketing
Research & Development
Petrochemicals
13

14
BPCL
14%HPCL
11%
ONGC
7%
IOCL
31%
Essar
9%
RIL
28%
IOCL’s Dominance in Downstream Oil Sector
Source: Petroleum Planning & Analysis Cell , IOCL; All figures for FYE 2014
Key: BPCL – Bharat Petroleum Corporation Limited Group; HPCL – Hindustan Petroleum Corporation Limited; ONGC – Oil and Natural Gas Corporation Limited; RIL –
Reliance Industries Limited;
*Provisional
** Industry data of IOCL
BPCL
26%
HPCL
28%
IOCL
46%
21%
19%
6%
12%
42%IOCL
BPCL
HPCL
RIL
Others
Refining Share Products Pipelines Share
Industry Capacity –
215.07 MMT*
Downstream Industry Capacity –
80.59 MMT
Petroleum Products Market Share**
Industry Size –
158 MMT

IOCL – An Important Pillar in the Indian Economy
Key Credit Considerations
Indian Economy
Oil Industry in India
IOCL’s Core Operations
Strategic Initiatives
Financial Performance
Ongoing Projects
IOCL – An Overview

16
Refining – Portfolio
Controls 10 refineries spread across
the country (65.70 MMT – 31% of
Industry)
Three of the Refineries with maximum
capacity are located in high
consumption North / West Indian
region
Refining Industry Capacity 215.07
MMTPA
IOCL’s share of Total Capacity 31%
IOCL’s share among PSUs 49%
Mumbai Vizag
Chennai
Cochin Narimanam
Bongaigaon
Mangalore
Panipat
Guwahati
Haldia
Barauni
Mathura
Koyali
Digboi
Jamnagar
Tatipaka
Numaligarh
IndianOil Existing (54.20 MMT) Subsidiary Cos. (11.50 MMT) Under construction (15.00 MMT)
Other Companies
Existing (149.37 MMT)
Bina
Paradip
• Access to high demand
market of North / West India
• Largest capacity in this
region Bathinda
Source: Petroleum Planning & Analysis Cell; All figures for FYE 2014

IOC Refineries – Nelson Complexity Index
17 Figures as of 31st March 2014
Refinery Index
Digboi 11.0
Panipat 10.5
Haldia 10.4
Gujarat 10.0
Mathura 8.4
Bongaigaon 8.2
Barauni 7.8
Guwahati 6.7
Total 9.6
Paradip 12.2
CPCL 8.2

18
Sourcing of Imported Crude Oil
Middle East
65.2%
Africa
25.9%
South East Asia
4.2%
Figures for FYE 2014 Total crude oil import : 51.40 MMT (including 8.85 MMT for Chennai Petroleum Corporation Ltd.)
Latin America
2.2%
North America
0.3%
Central Asia
2.2%

Refinery Projects – Crossing Milestones
19
Strengthening Downstream Integration
• Cost: US$167 million; Commissioned: January, 2014
• Unit capacity enhanced to 1.5 MMTPA from 1.3 MMTPA
• Improved profitability
• Maximized production of value-added Propylene
Styrene Butadiene Rubber Plant at Panipat
• Cost: US$ 149 million; Commissioned: November, 2013
• 120 TMTPA capacity
• 1st SBR plant in India
• 100% import substitution
• Cost: US$ 57 million; Commissioned: October, 2013
• 138 TMTPA capacity
• Feedstock for SBR
• Cost: US$ 32 million; Commissioned: March, 2014
• 20 TMTPA capacity
• Reduced import and forex expense
Fluidized Catalytic Cracking unit Revamp
at Mathura
Butadiene Extraction Unit at Panipat
Butene-1 unit at Panipat
US$-INR: 59.92 (as on 31st March 2014)
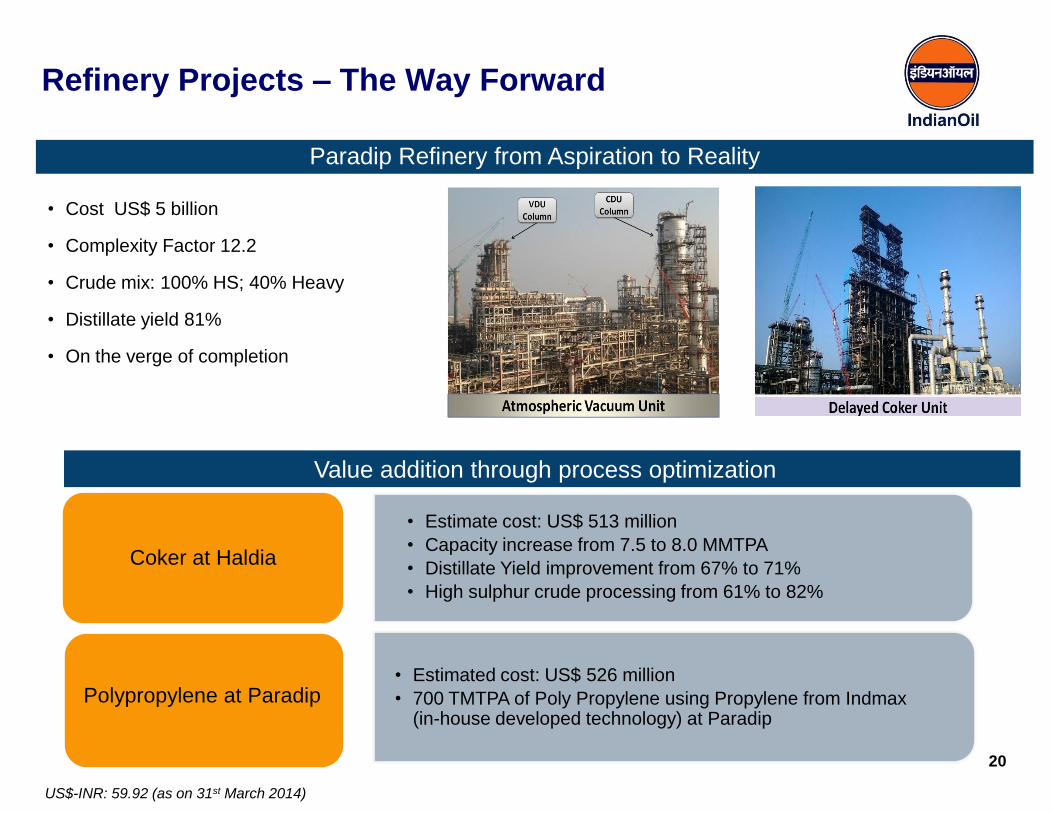
Refinery Projects – The Way Forward
20
Value addition through process optimization
Coker at Haldia
• Estimate cost: US$ 513 million
• Capacity increase from 7.5 to 8.0 MMTPA
• Distillate Yield improvement from 67% to 71%
• High sulphur crude processing from 61% to 82%
• Estimated cost: US$ 526 million
• 700 TMTPA of Poly Propylene using Propylene from Indmax (in-house developed technology) at Paradip
Polypropylene at Paradip
• Cost US$ 5 billion
• Complexity Factor 12.2
• Crude mix: 100% HS; 40% Heavy
• Distillate yield 81%
• On the verge of completion
Paradip Refinery from Aspiration to Reality
US$-INR: 59.92 (as on 31st March 2014)

21
Largest liquid pipeline network
134 km of gas pipeline with a capacity of 9.5
MMSCMD
Provides low cost of transportation
Wide Network of Cross Country Pipelines
Length
(KM)
Capacity
(MMTPA)
Market Share
Downstream
(MMTPA)
Crude Oil
Pipelines
4,448 40.40 73%
Product
Pipelines
6,632 37.09 46%
Total 11,080 77.49 57%
Figures as on FYE 2014
Vadinar
Chaksu
Mundra
Kandla
Guwahati
Bongaigaon Digboi
Tinsukia
Jalandhar
Delhi Meerut
Tundla
Najibabad
Roorkee Ambala
Mathura
Kot Sidhpur Ahmedabad
Jodhpur
Navagam
Sanganer Ajmer
Dahej
Chittaurgarh
Koyali
Bhatinda
Sangrur Panipat
Rewari
Haldia
Barauni Kanpur
Lucknow
Mourigram
Rajbandh
Chennai
Sankari Asanur
Trichy
Madurai
Chittoor Product
Crude Oil
Gas
Oil Refinery
Legend
Bangalore
Bangalore AFS
Paradip
Ratlam
Chennai AFS
Hazira
Bharatpur
Patna
Siliguri Mgs
Albd
Figures of IOC Group including Gas

22
Marketing – Reach in Every Part of India
Over 41,600 touch points (51.5% of
industry)
Cross country retail network
comprising of 23,993 (45.9%) outlets
Continued Rural thrust : 6,002 Kisan
Seva Kendras
LPG supply to over 81 million
households with over 7,000 (50.6%)
LPG distributorship
Reaching the doors of bulk
customers : Bulk Customer Pumps
6,359(86.0%)
Source: Industry Data of IOCL;
Figures in () indicate % share in industry; All figures as on 31st March 2014
Over 41,600
Customer touch-
points
LPG Bottling
Plants 90
LPG Distributorships
7,035
SKO / LDO Dealerships
3,930
Terminal / Depots
135
Aviation Fuel
Stations 98
Retail Outlets
23,993
Bulk Consumer Pumps
6,359
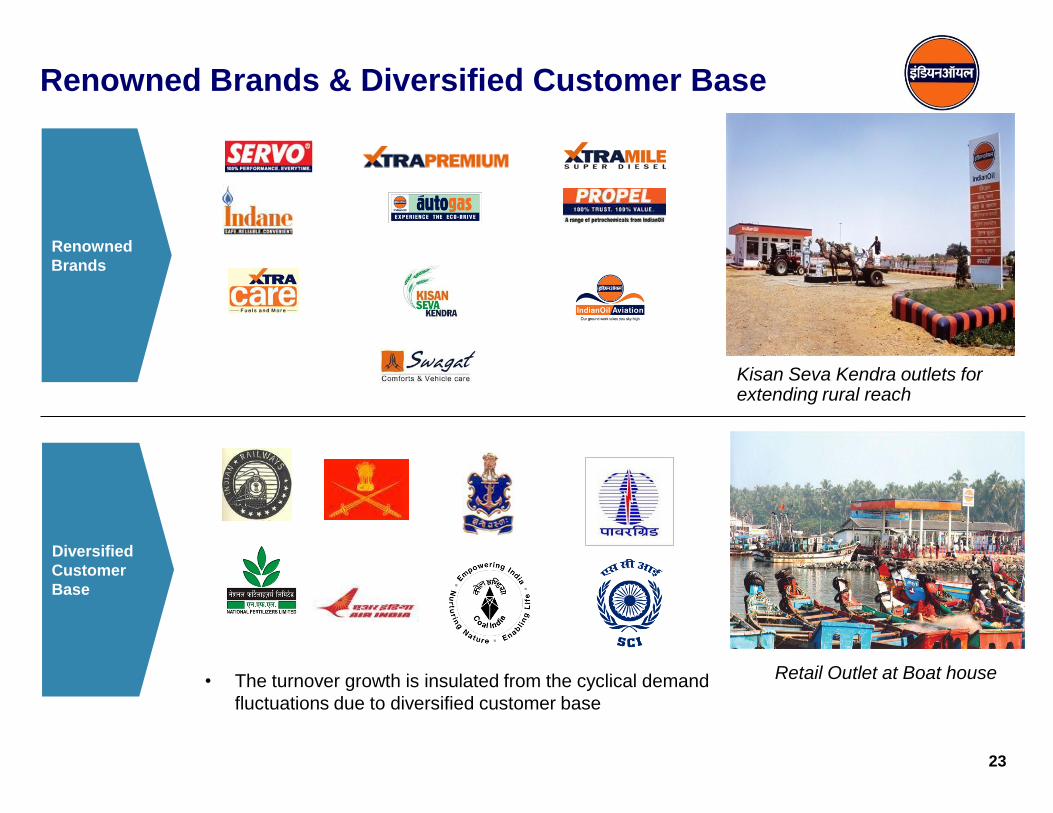
Renowned Brands & Diversified Customer Base
23
Renowned
Brands
Kisan Seva Kendra outlets for extending rural reach
Retail Outlet at Boat house • The turnover growth is insulated from the cyclical demand
fluctuations due to diversified customer base
Diversified
Customer
Base

IOCL – An Important Pillar in the Indian Economy
Key Credit Considerations
Indian Economy
Oil Industry in India
IOCL’s Core Operations
Strategic Initiatives
Financial Performance
Ongoing Projects
IOCL – An Overview
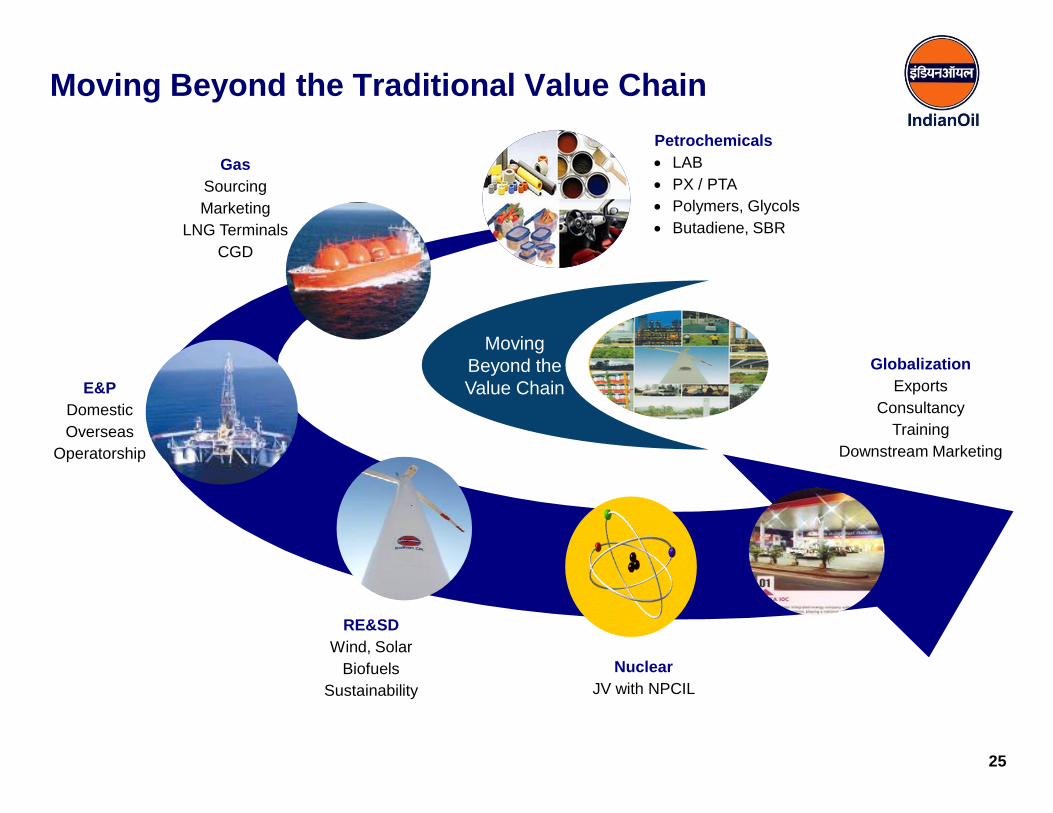
Moving Beyond the Traditional Value Chain
25
Petrochemicals
LAB
PX / PTA
Polymers, Glycols
Butadiene, SBR
Moving
Beyond the
Value Chain
Gas
Sourcing
Marketing
LNG Terminals
CGD
E&P
Domestic
Overseas
Operatorship
RE&SD
Wind, Solar
Biofuels
Sustainability
Nuclear
JV with NPCIL
Globalization
Exports
Consultancy
Training
Downstream Marketing
^

Petrochemical Capacity Growth
26 2nd largest petrochemicals player in the country
Capex (US$ million)
LAB, Gujarat 199
PX/PTA Panipat 761
Naphtha Cracker, Panipat 2340
SBR 29
Butadiene Extraction Unit 35
Butene-1 21
Total 3385
FY 2003-04 FY 2013-14
Polymers, 1250
PTA, 553
Glycols, 325
Butadien, 138
SBR, 120
LAB, 120 Others, 155
LAB, 120
KTA – ‘000 tons per annum; US$-INR: 59.92 (as on 31st March 2014)
Total Capacity: 120 KTA Total Capacity: 2661 KTA

27
Key: LAB: Linear Alkyl Benzene; PTA: Purified Terephthalic Acid; MEG: Monoethylene Glycol; DEG : Diethylene Glycol
* Includes Benzene, Toluene and Propylene
US$-INR: 59.92(as on 31st March 2014)
Market share & position in domestic market
LAB: 31.2% (2nd position);
PTA: 10.9% (3rd position);
Polymers: 19.7% (2nd position);
MEG/DEG: 26.6% (2nd position);
Overall: 17.7% (2nd position)
FYE 13 FYE 14
253 289119 106
552 408
842 986
312 327MEG/DEG
Polymers
PTA
LAB
Others*
FYE 13 FYE 14
2,939
3,434
2078 2116
Turnover (US$ million)
Forward Integration
EBITDA (US$ million)
FYE 13 FYE 14
254
340
Volume (TMT)

E&P Capabilities
Backward Integration
Stake in 23 exploration blocks
13 Domestic blocks
– With ONGC / OIL / GAIL / GSPC /
Petrogas / HPCL / HOEC / AWEL (20-
100% participating interest)
– Including 2 Coal Bed Methane
(CBM) blocks with ONGC (20%
participating interest)
10 International blocks
– Libya (3), Yemen (2) , Nigeria (1),
Gabon (1), Venezuela (1), Canada (1)
& USA (1)
Status of Blocks
Domestic Overseas
2
3
3
5
1
3
3
3
CBM Non-operated Under Exploration Discovery Under Production

Acquisition of LNG Assets in British Columbia, Canada
Upstream Segment:
Lands (mineral and surface) - approximate
area 1.16 million acres
Downstream Segment
LNG liquefaction development of initial 2
trains x 6 MMTPA at Lelu Island, Prince
Rupert
Minimum operational life of 40 years
Provision of one more train of 6 MMTPA in
future
Reserves
Total Potential : 46.35 Tcfe
2P Reserves : 8.35 Tcfe
IOC Share
Reserve (10%): 4.6 Tcfe
LNG Terminal : 1.2 MMTPA off take from
2019
IOC’s expected Share of Capex including
acquisition cost : about CAD 4 billion till 2018
Tcfe: Trillion Cubic Feet Equivalents
MMTPA: Million Metric Tonne Per Annum

Diversified Across Geographies and Energy Sources
30
• Aviation, terminal &
retail business
• 24,000 MT Storage
Terminal
• Market Share : 25.20%
Indian Oil Mauritius
Ltd.
(100% Stake)
• Storage, terminal &
retail business
• 161 retail outlets
• Market Share : 19.40%
Lanka IOC Plc.
(75.11% Stake)
• Marketing of Lubes &
POL
IOC Middle East FZE
(100% Stake)
Solar
Biofuels
Nuclear
Wind Power
Gas ● Gas
• 42.6% revenue growth, US$ 1,490 million
• JVs for City Gas Distribution
• 5 MMTPA LNG import, storage and re-
gassification terminal planned
● Nuclear
● 26% JV with Nuclear Power Corporation of
India Limited to establish nuclear plant at
Rawatbhatta; Investment of US$160 million
● Wind
• 21MW plant at Kachchh;
• Second plant of 48.3MW capacity in AP,
South India (42 MW operational)
● Bio-fuels – plantation in wasteland
• Chhatisgarh Project: 30,000 hectare
• MP Project: 2.000 hectare
• UP Project: Limited Liability Partnership with
Ruchi Soya Industries
● Solar
• 5MW solar plant in Rajasthan
• 1266 off-grid solar plants at Retail Outlets
Other overseas subsidiaries include IOC Sweden AB, IOC (USA) Inc. and Ind Oil
Gloval B.V. Netherland (facilitating overseas upstream operations)
Geographical Diversification Diversification Across Sources
US$-INR: 59.92 (as on 31st March 2014)
IOCL – An Important Pillar in the Indian Economy
Key Credit Considerations
Indian Economy
Oil Industry in India
IOCL’s Core Operations
Strategic Initiatives
Financial Performance
Ongoing Projects
IOCL – An Overview

FYE 12 FYE 13 FYE 14
68.40 69.24
76.36
Strong Results - Annual
Net Profit Turnover
Net Worth EBITDA
(US$ billion)
CAGR 5.66%
Turnover grew at 5.66% CAGR over last 2 years - growth rate higher than that of Indian Economy
FYE 12 FYE 13 FYE 14
0.660.84
1.17
FYE 12 FYE 13 FYE 14
3.662.88
3.17
(US$ billion)
(US$ billion) (US$ billion)
US$-INR: 59.92 (as on 31st March 2014) 32
FYE 12 FYE 13 FYE 14
9.66 10.2011.01

FYE 12 FYE 13 FYE 14 Apr-Jun 14(P)
5.9 6.4 6.27.4
3.54.0
3.1 1.0
1.2
12.613.5
13.9**
11.0**
*Investments include Market Value of shares held in ONGC Ltd., GAIL (India) Ltd., OIL India Ltd., shares held in Trust and
Special Oil Bonds
** Excluding finance lease of US$ 0.5 billion
## Net under realisation (gross under realisation less upstream discount) for which subsidy is yet to be announced
(P) denotes provisional figure
Debt vis-à-vis Investments & Cash Receivable from Govt.
(US$ billion)
Figures in Chart as on 31st March every year;
US$-INR: 59.92 (as on 31st March 2014)
9.4 10.4
9.3
# FYE 12 : Compensation of USD 3.5 billion received by August 12
FYE 13: Compensation of USD 4.0 billion received by August 13
FYE 14: Compensation of USD 2.1 billion received by July 14
33
9.6
Debt Investments* Cash recoverable from Govt # Net under realisation ##

1.30 1.32 1.26*
FYE 12 FYE 13 FYE 14
DEBT / EQUITY
Strong Financials with Conservative Capital Structure
CORE DEBT** / EQUITY
0.94 0.94 0.98
FYE 12 FYE 13 FYE 14
*Debt excluding finance lease (Debt /Equity including finance lease : 1.31)
**Core Debt = Debt less Cash Receivable from Govt. 34

March 2014
65
35Short Term #
Long Term ##
USD 9.0 bn USD 4.9 bn
Borrowing Breakup March 2014 Borrowing : USD 13.9 billion
%
# Short-Term borrowing refers to loans maturing within 1 year.
## Long-Term borrowing refers to loans maturing beyond 1 year; weighted maturity profile of long-term loans is 4.99 years from
FY 15-16 through FY 23-24
March 2014
34
66
Rupee
USD
USD 5.0 bn USD 8.9 bn
March 2014
21
79
Secured
UnsecuredUSD 2.9 bn USD 11.0 bn
35 US$-INR: 59.92 (as on 31st March 2014)

EBITDA Breakup FYE 2014 EBITDA : USD 3174 million
36
* Others:
Gas: USD 25 million; Wind & Solar : USD 6 million; Explosives & Cryogenics : USD 3 million; E&P: USD (45) million
2018 827 340
Petroleum (Refining & Marketing) Petroleum Transportation (Pipelines) Petrochemicals Others*
-11 US$ million
US$-INR: 59.92 (as on 31st March 2014)
63.6% 26.1% 10.7% (0.4%)

Solid Infrastructure Base
37
US$ billion
FYE 12 FYE 13 FYE 14
18.8421.78
24.32
Gross Fixed Assets
including CWIP
US$-INR: 59.92 (as on 31st March 2014)

IOCL – An Important Pillar in the Indian Economy
Key Credit Considerations
Indian Economy
Oil Industry in India
IOCL’s Core Operations
Strategic Initiatives
Financial Performance – Under Realization
Ongoing Projects
IOCL – An Overview

Indian Refining & Marketing sector stands deregulated w.e.f. 2002
Products of far reaching impact on Indian growth story & masses
HSD: India is a dieselized economy : HSD accounts for 43% of petroleum products consumption
LPG (Domestic): used by masses for cooking
SKO (PDS): used mainly by poor population
Govt intends to insulate Indian growth story and masses from volatility in international crude oil prices
and controls prices of above mentioned three products
Under realization: Difference between Desired Price (based on international price) and Controlled Price
Sharing of Under realization by:
Govt. (in terms of cash Compensation)
National Oil Producing Companies (in terms of discount on crude oil prices)
Refining & Marketing Companies (balance)
Share of Refining & Marketing Companies finalized by the Govt. on annual basis considering that these
companies remain in sound financial condition
Annual finalization of under recovery sharing results into occasional quarterly losses shown by
Refining & Marketing Companies
39
Under Realization & its Compensation : A Conceptual Framework
HSD : High Speed Diesel, LPG: Liquefied Petroleum Gas , SKO (PDS): Superior Kerosene Oil (Public Distribution System)

HSD
Steps taken on 18th January 2013: Dual pricing introduced
Market Determined Prices for Bulk Customers (e.g. Railway, Defense, State Transport etc)
Subsidized Prices for Retail Consumers (vehicle owners)
OMCs authorised to increase the retail price by about 40-50 paisa per litre per month
Outcomes:
Retail prices increased by Rs 9.84 per liter (excluding VAT) since 18th January 2013 till 1st Aug 2014
LPG (Domestic)
Step taken on 18th January 2013: Cap of 9 cylinders in a financial year on supply of subsidised LPG cylinders for domestic
use to each house hold / consumer (earlier in September 2012, Govt had announced cap of 6 cylinders). On 30th January 2014
cap increased to 12 cylinders with effect from FY 2014-15.
Outcomes:
Sale of Subsidised LPG reduced due to capping
Trend of Subsidised LPG sales volume:
2012-13 : 6.38 MMT (89% of total LPG sales)
2013-14 : 6.50 MMT (86% of total LPG sales)
MS: No under realization on MS
40
Rationalization of under realization: Recent steps
HSD : High Speed Diesel ; LPG: Liquefied Petroleum Gas; MS: Motor Spirit

41
Sharing Pattern of Under realization
Under Realization: Difference between Desired Market Price and Controlled Price of sensitive products, i.e. Superior Kerosene Oil (Public
Distribution System) , High Speed Diesel, and Liquefied Petroleum Gas (Domestic).
FYE 12 FYE 13 FYE 14
Gross Under-realization 12.6 14.3 12.2
Upstream Discount 5.0
(40%)
5.3
(37%)
5.8
(48%)
Cash Compensation
7.6
(60%)
8.9
(62%)
6.2
(51%)
Net Under-realization
0.0
(0%)
0.1
(1%)
0.2
(1%)
Govt. Support
US$ billion
US$-INR: 59.92 (as on 31st March 2014)
Finalization of under recovery sharing on annual basis

IOCL – An Important Pillar in the Indian Economy
Key Credit Considerations
Indian Economy
Oil Industry in India
IOCL’s Core Operations
Strategic Initiatives
Financial Performance
Ongoing Projects
IOCL – An Overview

43
TOTAL CAPEX Outlay :
US$ 2002 Mn
* Includes refineries’ capacity additions, yield & quality improvement
** Includes R&D and diversifications such as LNG and E&P etc.
Plan Capex Outlay: 2013-14 Major Planned Projects
Major Ongoing Projects & Outlay
Project Estimated Cost
(US$ mn)
Anticipated
Completion
15 MMTPA Paradip Refinery
Project
4969 December 2014
onwards
Paradip – Raipur – Ranchi
Pipeline Project
299 August 2015
Debottlenecking of Salaya-
Mathura Pipeline
264 August 2015
Augmentation of Paradip-
Haldia-Barauni Pipeline
98 August 2015
Paradip Haldia Durgapur
LPG Pipeline
152 December 2015
Distillate Yield Improvement
(Coker) at Haldia
513 September 2017
Paradip Petrochemicals
Phase-I, Polypropylene
Project
526 September 2017
US$-INR: 59.92 (as on 31st March 2014)

Investing In Future Growth
44
XI Plan Capex: 2007-08 to 2011-12
US$ 8,120 million US$ 9,379 million
XII Plan Capex : 2012-13 to 2016-17(1)
Ref, 60% Pipelines,
8%
Mkting, 1%
E&P, 3%
Petchem, 27%
Others, 1%
Ref, 47%
Pipelines, 12%
Mkting, 3%
E&P, 28%
Petchem, 4%
Others, 5%
(1) Capex for future periods subject to change
US$-INR: 59.92 (as on 31st March 2014)

IOCL – An Important Pillar in the Indian Economy
Key Credit Considerations
Indian Economy
Oil Industry in India
IOCL’s Core Operations
Strategic Initiatives
Financial Performance
Ongoing Projects
IOCL – An Overview

46
Key Credit Considerations
India’s Largest Commercial Enterprise
Market Leader Across Various Industry Segments
Strong Brand Equity and Product Diversity
Integrated Operations and Diversity of Assets and Revenues
International Outreach
With strong support from the Government of India

Q&A

Thank You