XPV: Cross Phase Verification - … Cross Phase Verification ... My research project focuses on...
14
University of Michigan – Ann Arbor Electrical Engineering and Computer Science Department XPV: Cross Phase Verification Jialin Li Valeria Bertacco
-
Upload
trinhtuong -
Category
Documents
-
view
217 -
download
1
Transcript of XPV: Cross Phase Verification - … Cross Phase Verification ... My research project focuses on...
University of Michigan – Ann Arbor
Electrical Engineering and Computer Science Department
XPV: Cross Phase Verification
Jialin Li
Valeria Bertacco
Table of Contents
I. Introduction ............................................................................................................................. 3
II. Inferno ...................................................................................................................................... 3
A. Introduction ....................................................................................................................... 3
B. Protocol Diagrams ............................................................................................................ 4
C. Transaction Diagram ........................................................................................................ 5
III. Bug Localization Using Transactions ..................................................................................... 6
A. Introduction ....................................................................................................................... 6
B. Testing Environment .......................................................................................................... 6
C. Approved Transactions Database ..................................................................................... 7
D. Results ............................................................................................................................... 8
IV. Verification Using Protocol Diagram ..................................................................................... 9
A. Introduction ....................................................................................................................... 9
B. Protocol Diagram ........................................................................................................... 10
C. Results ............................................................................................................................. 10
V. Conclusion .............................................................................................................................. 13
VI. Reference ................................................................................................................................ 14
I. Introduction
The complexity of digital hardware design has grown dramatically in the past few
decades [1]. As the demand for higher computing power and efficiency increases,
hardware designers are trying to accommodate more transistors on the CPU as well as
using more advanced architectures, for example, out of order processors and
multi-core processors. However, such advancement in hardware design has greatly
exacerbated the difficulties of verification and debugging. Many hardware companies
are spending more resources on verification than the design itself.
The traditional way of debugging is through a waveform viewer which displays
individual signal transitions over time. As the number of signals to analyze and the
length of simulation traces increase dramatically, using waveform viewer has become
a very tedious and time-consuming task. In addition, the complexity of hardware
design has introduced more unpredictable electrical bugs which exacerbate the
challenges of verification.
Therefore, there is a need for creative verification solutions that automate or
semi-automate the debugging process. My project is one of such attempt. It is based
on the Inferno [1], software that extracts behavioral transactions from simulations data,
and further locates the bug in the hardware design by analyzing the transactions. I will
show later that our attempt is highly automated and produces good bug detection
results both in terms of time and space.
II. Inferno
A. Introduction
Inferno is a software tool that automatically extracts the semantic protocol and
transaction diagram of any interface in a hardware design from simulation data. The
interface is usually selected signals from design that represent specific modules or
communication between functional units. Transaction diagrams are representations of
high-level behavior of the design which consist of basic sequences of activity.
Verification engineers could easily understand the functionality of the design based on
the transaction diagrams extracted by Inferno, and locate buggy behaviors by
inspecting unusual transactions.
B. Protocol Diagrams
Inferno takes in two inputs: a configuration file and a simulation trace. The
configuration file consists of all the signals the verification engineers want to analyze
including the clock and reset signals. The simulation trace is generated by running
chosen test case on simulation of hardware design. Inferno then generates a protocol
diagram – a single diagram that shows all the behavior of the design. The protocol
diagram contains vertices and edges. The vertices are the states of the simulation
which indicates a unique signal combination, and the edges are transitions between
different states. All approved behaviors are represented by this protocol diagram.
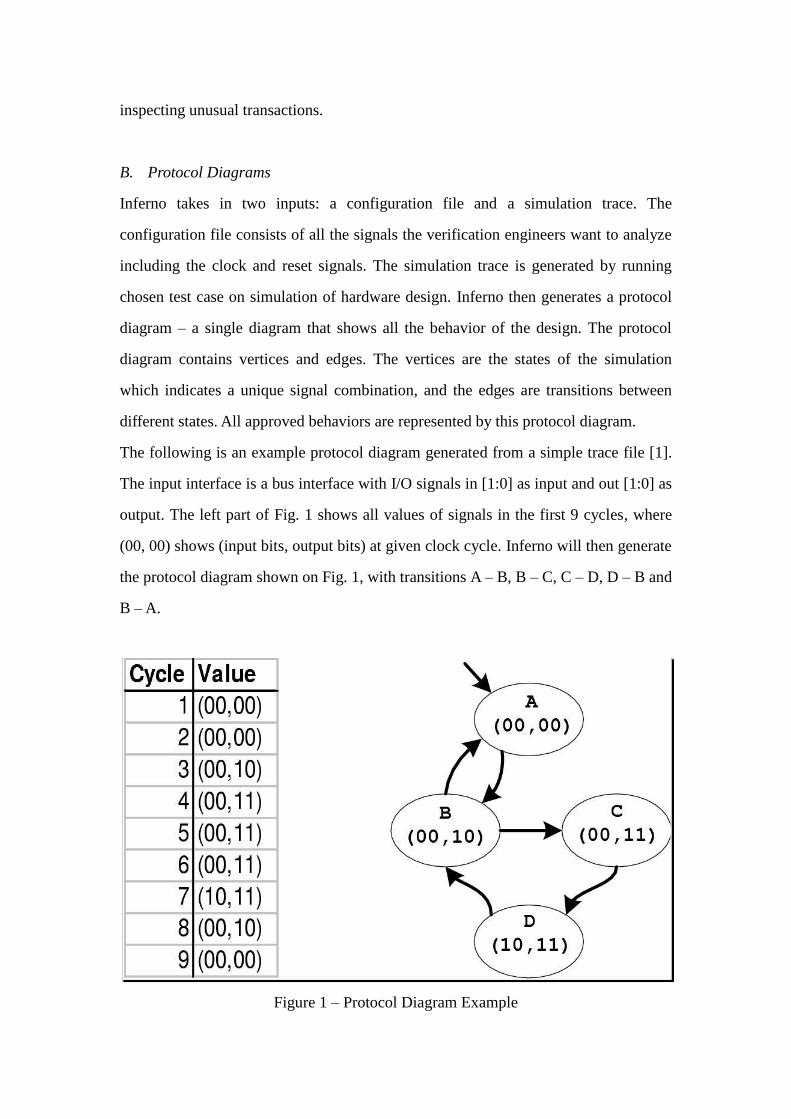
The following is an example protocol diagram generated from a simple trace file [1].
The input interface is a bus interface with I/O signals in [1:0] as input and out [1:0] as
output. The left part of Fig. 1 shows all values of signals in the first 9 cycles, where
(00, 00) shows (input bits, output bits) at given clock cycle. Inferno will then generate
the protocol diagram shown on Fig. 1, with transitions A – B, B – C, C – D, D – B and
B – A.
Figure 1 – Protocol Diagram Example
C. Transaction Diagram
After generating a protocol diagram, a sequence of state IDs (A, B, C and D in Fig 1)
of the simulation trace file will also be encoded. Inferno then will extract transactions
from this state ID sequence. The transaction diagrams are strict sub-graphs of the
protocol diagram. The algorithm Inferno uses has three steps [1]:
a) Boundary identification and labeling
b) Repetition folding
c) Boundary refinement
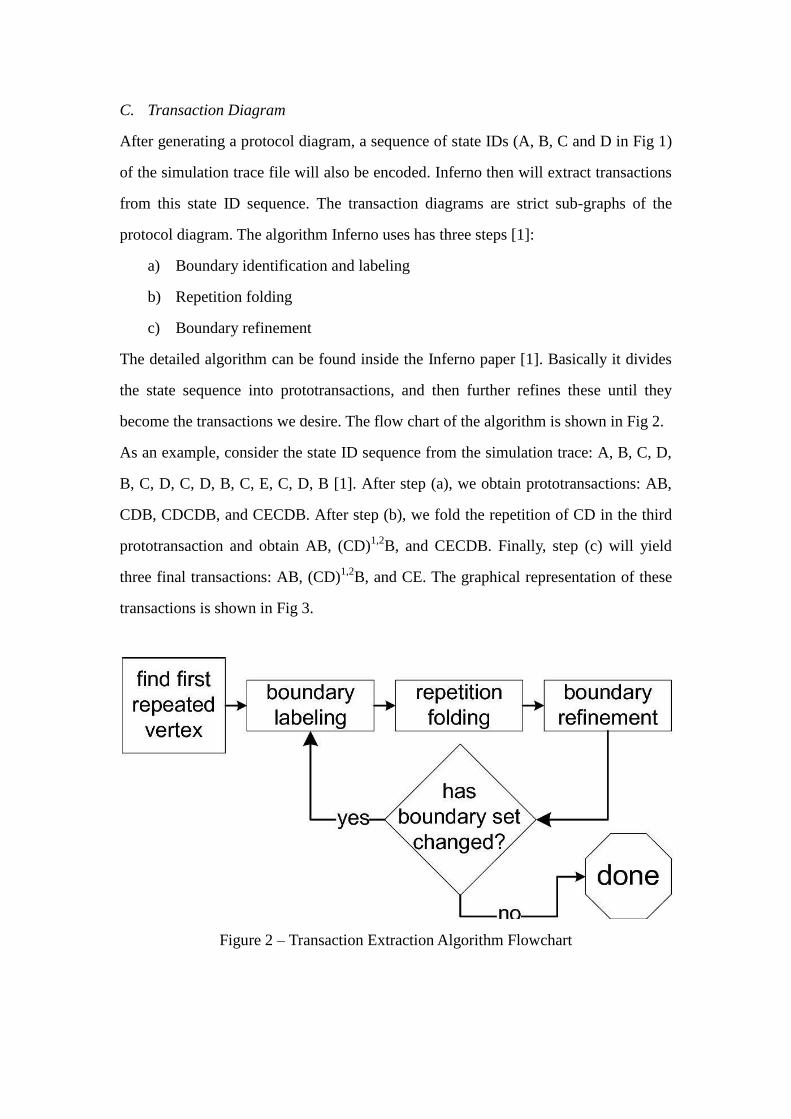
The detailed algorithm can be found inside the Inferno paper [1]. Basically it divides
the state sequence into prototransactions, and then further refines these until they
become the transactions we desire. The flow chart of the algorithm is shown in Fig 2.
As an example, consider the state ID sequence from the simulation trace: A, B, C, D,
B, C, D, C, D, B, C, E, C, D, B [1]. After step (a), we obtain prototransactions: AB,
CDB, CDCDB, and CECDB. After step (b), we fold the repetition of CD in the third
prototransaction and obtain AB, (CD)1,2
B, and CECDB. Finally, step (c) will yield
three final transactions: AB, (CD)1,2
B, and CE. The graphical representation of these
transactions is shown in Fig 3.
Figure 2 – Transaction Extraction Algorithm Flowchart
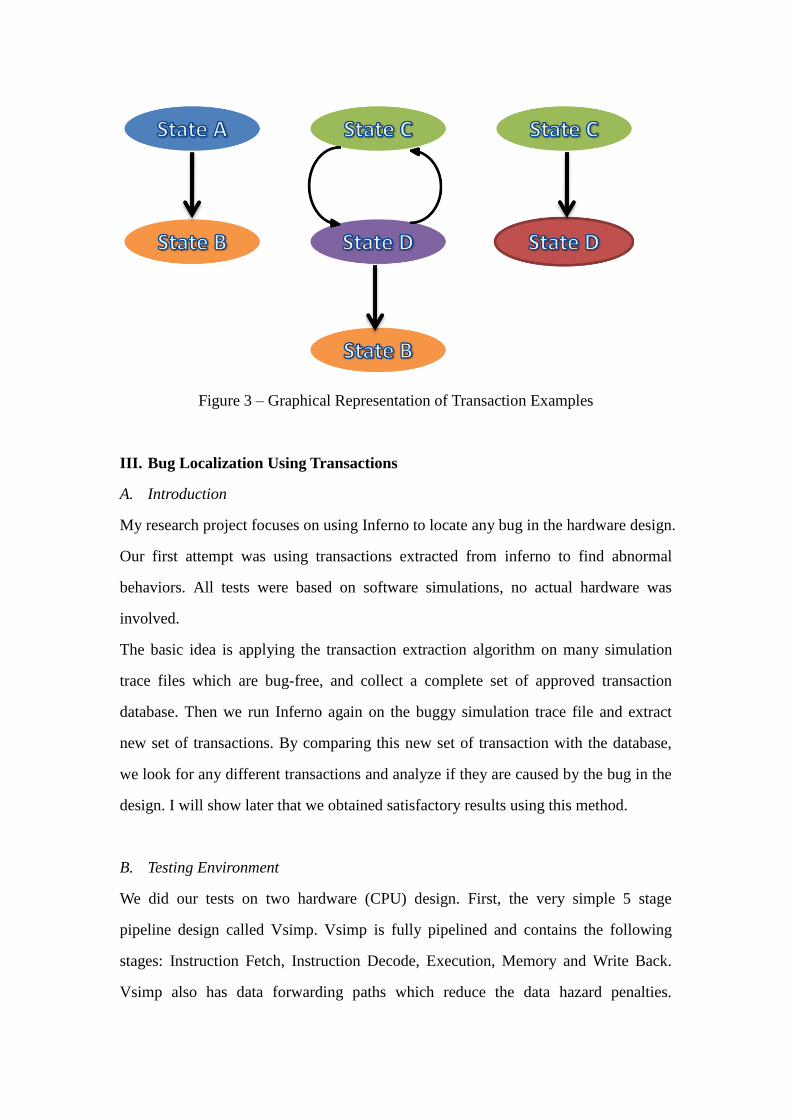
Figure 3 – Graphical Representation of Transaction Examples
III. Bug Localization Using Transactions
A. Introduction
My research project focuses on using Inferno to locate any bug in the hardware design.
Our first attempt was using transactions extracted from inferno to find abnormal
behaviors. All tests were based on software simulations, no actual hardware was
involved.
The basic idea is applying the transaction extraction algorithm on many simulation
trace files which are bug-free, and collect a complete set of approved transaction
database. Then we run Inferno again on the buggy simulation trace file and extract
new set of transactions. By comparing this new set of transaction with the database,
we look for any different transactions and analyze if they are caused by the bug in the
design. I will show later that we obtained satisfactory results using this method.
B. Testing Environment
We did our tests on two hardware (CPU) design. First, the very simple 5 stage
pipeline design called Vsimp. Vsimp is fully pipelined and contains the following
stages: Instruction Fetch, Instruction Decode, Execution, Memory and Write Back.
Vsimp also has data forwarding paths which reduce the data hazard penalties.
However, compare to other designs, especially those available on the market, Vsimp
is a very basic design but fit our purpose since the results are relatively easy to
analyze.
As mentioned in section II – A, a set of interfaces need to be selected for each design.
For Vsimp, I came up with 10 interfaces which provide a good coverage of the whole
design. These interfaces are branch, decoder, fetch, halt_illegal, mem_com, memory,
op, pipe, reg and wb.
The second design we use is the Opensparc T2 by Sun Microsystems. Opensparc T2
is a single chip multi-threaded (CMT) processor [2] which contains eight SPARC
cores. Compare to Vsimp, Opensparc T2 is a much more complex design and is very
close to real world processors on the market. Therefore, a good result against
Opensparc T2 would prove our verification solution to be useful.
The interfaces I select for Opensparc T2 are the following: ccx_core, ccx_pio_rand,
exu_branch, l1_dcache_bypass_win and tlu_TLB.
C. Approved Transactions Database
We collected one approved transactions database for each interface mentioned in the
previous section. One database is obtained by using Inferno with input files:
a) Configuration file that contains all the signals in the interface
b) Trace file of a particular test case simulation on the design
For part b), we have ten existing test cases for each design: Bubblesort, Combrec, Fib,
Hanoi, Insert, Knapsack, Matmult, Merge, Quick and Saxpy for Vsimp;
Mpgen_smc_2, Ldst_sync_fc0, Fp_addsub0_n2, Fp_muldiv0_a_n2, Isa2_basic_fc0,
Isa3_asr_pr_hpr_f5_bps, Isa3_window3_f1_bps, Tlu_rand02_ind_09,
N2_lsu_asi_ring_01 and Blimp_rand1_8t_4527139 for Opensparc T2.
Each run will produce some transactions for one interface. We then merge all the
transactions obtained from ten test cases to get one transaction database. The merging
of transactions is simple as adding element to a set: there are no duplicates in the
database.
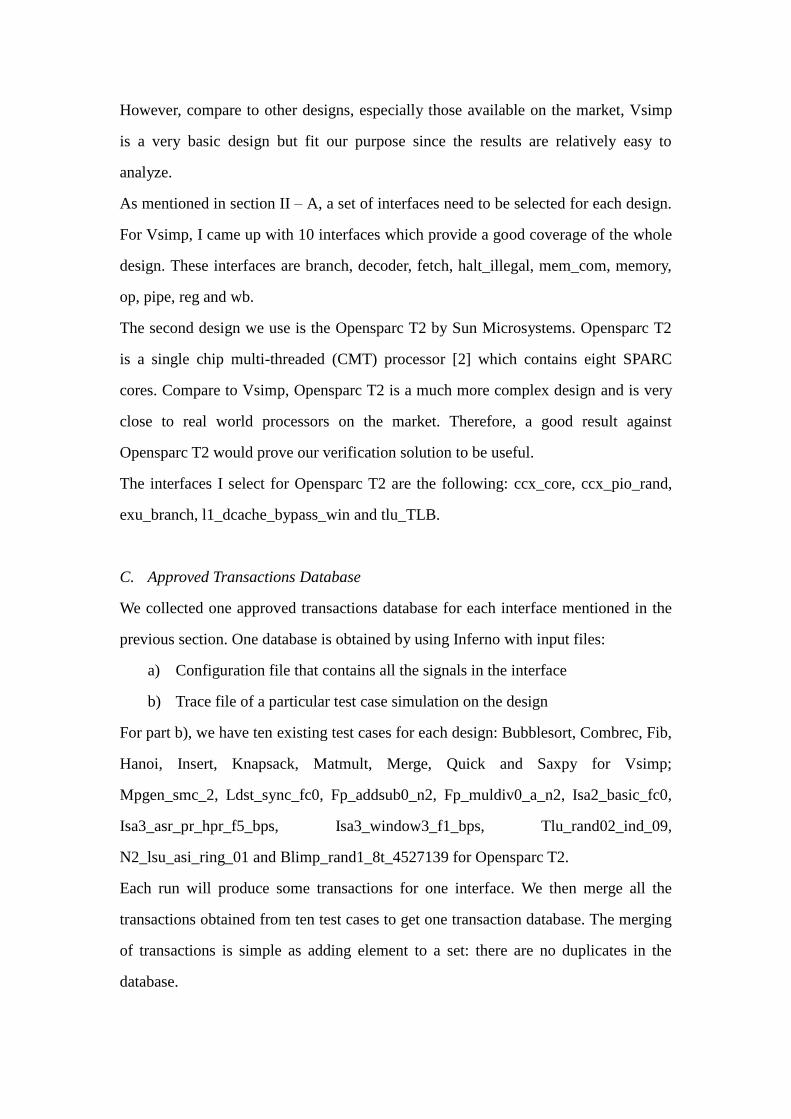
D. Results
The last step of verification is to run Inferno on a trace file obtained from simulation
of a buggy design. These buggy designs were generated from injecting bug signals
into Vsimp and Opensparc T2. We then compared the new sets of transactions to the
corresponding approved transactions database. Any different transactions will be
recorded together with their first occurrence cycle time.
We assert that the first different transaction should be directly or indirectly affected by
the bug. It means that either the bug signals are in the interface, or very close to the
interface. To justify our assertion, we choose the first different transaction based on
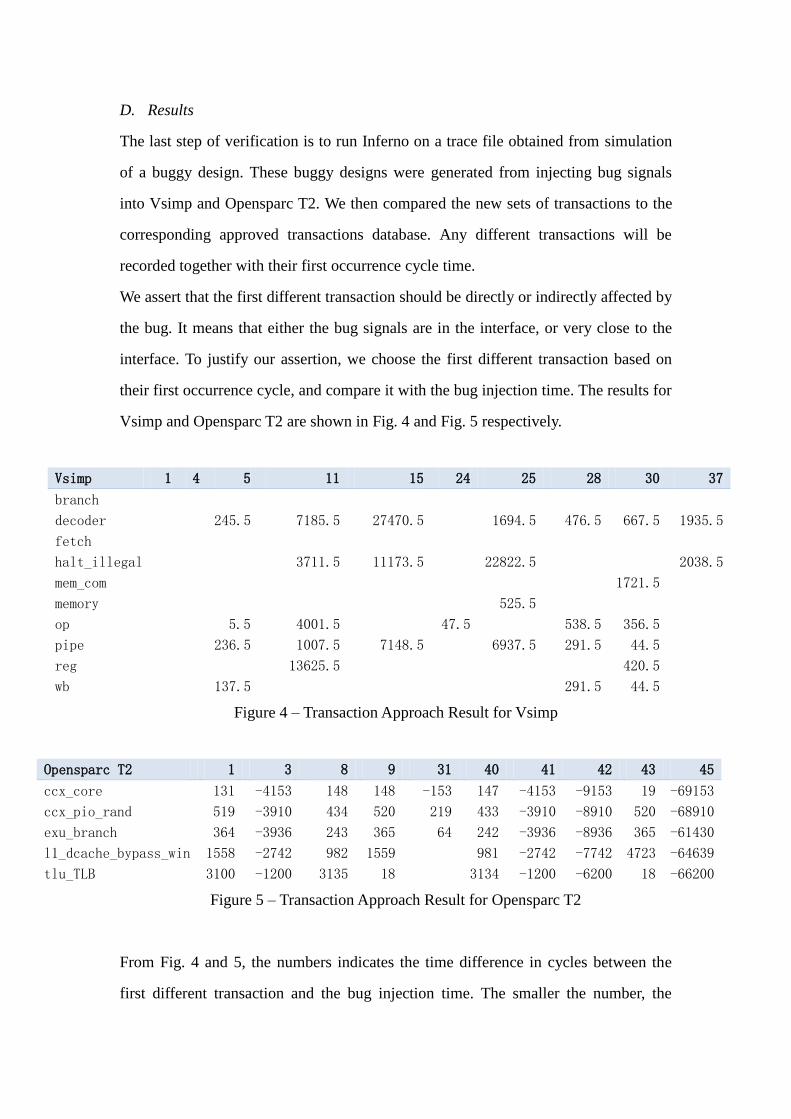
their first occurrence cycle, and compare it with the bug injection time. The results for
Vsimp and Opensparc T2 are shown in Fig. 4 and Fig. 5 respectively.
Vsimp 1 4 5 11 15 24 25 28 30 37
branch
decoder
245.5 7185.5 27470.5
1694.5 476.5 667.5 1935.5
fetch
halt_illegal
3711.5 11173.5
22822.5
2038.5
mem_com
1721.5
memory
525.5
op
5.5 4001.5
47.5
538.5 356.5
pipe
236.5 1007.5 7148.5
6937.5 291.5 44.5
reg
13625.5
420.5
wb
137.5
291.5 44.5
Figure 4 – Transaction Approach Result for Vsimp
Opensparc T2 1 3 8 9 31 40 41 42 43 45
ccx_core 131 -4153 148 148 -153 147 -4153 -9153 19 -69153
ccx_pio_rand 519 -3910 434 520 219 433 -3910 -8910 520 -68910
exu_branch 364 -3936 243 365 64 242 -3936 -8936 365 -61430
l1_dcache_bypass_win 1558 -2742 982 1559
981 -2742 -7742 4723 -64639
tlu_TLB 3100 -1200 3135 18
3134 -1200 -6200 18 -66200
Figure 5 – Transaction Approach Result for Opensparc T2
From Fig. 4 and 5, the numbers indicates the time difference in cycles between the
first different transaction and the bug injection time. The smaller the number, the
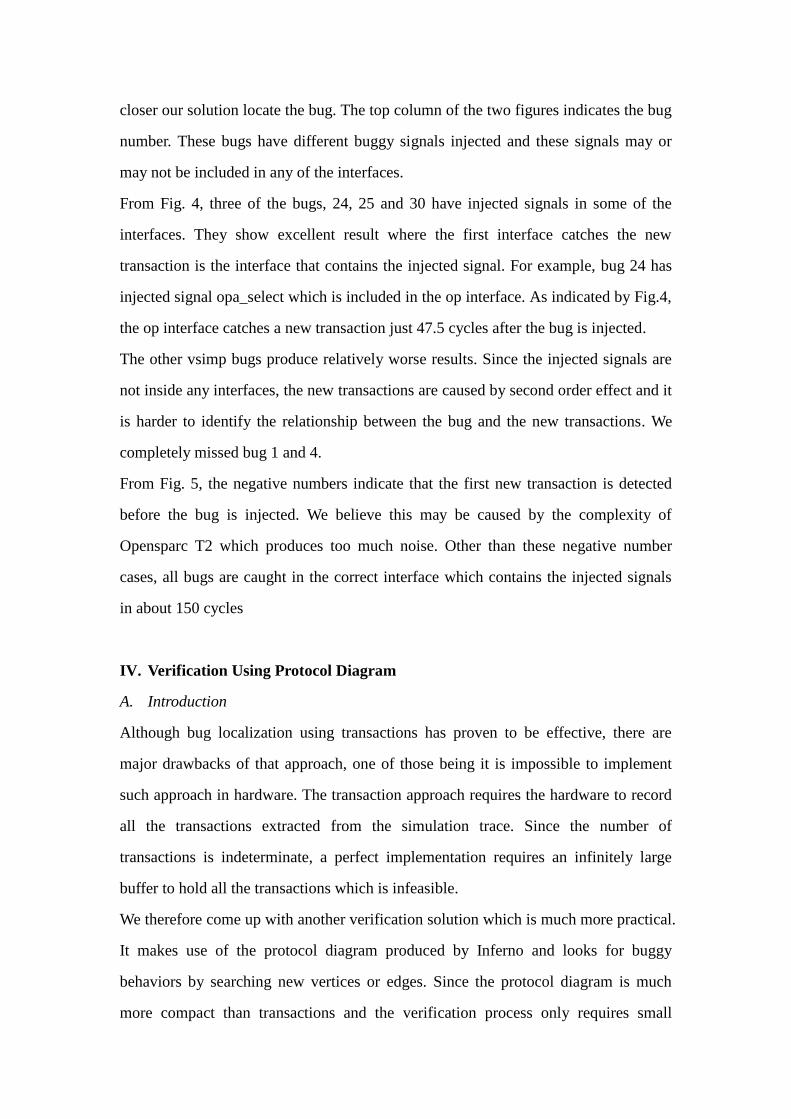
closer our solution locate the bug. The top column of the two figures indicates the bug
number. These bugs have different buggy signals injected and these signals may or
may not be included in any of the interfaces.
From Fig. 4, three of the bugs, 24, 25 and 30 have injected signals in some of the
interfaces. They show excellent result where the first interface catches the new
transaction is the interface that contains the injected signal. For example, bug 24 has
injected signal opa_select which is included in the op interface. As indicated by Fig.4,
the op interface catches a new transaction just 47.5 cycles after the bug is injected.
The other vsimp bugs produce relatively worse results. Since the injected signals are
not inside any interfaces, the new transactions are caused by second order effect and it
is harder to identify the relationship between the bug and the new transactions. We
completely missed bug 1 and 4.
From Fig. 5, the negative numbers indicate that the first new transaction is detected
before the bug is injected. We believe this may be caused by the complexity of
Opensparc T2 which produces too much noise. Other than these negative number
cases, all bugs are caught in the correct interface which contains the injected signals
in about 150 cycles
IV. Verification Using Protocol Diagram
A. Introduction
Although bug localization using transactions has proven to be effective, there are
major drawbacks of that approach, one of those being it is impossible to implement
such approach in hardware. The transaction approach requires the hardware to record
all the transactions extracted from the simulation trace. Since the number of
transactions is indeterminate, a perfect implementation requires an infinitely large
buffer to hold all the transactions which is infeasible.
We therefore come up with another verification solution which is much more practical.
It makes use of the protocol diagram produced by Inferno and looks for buggy
behaviors by searching new vertices or edges. Since the protocol diagram is much
more compact than transactions and the verification process only requires small
amount of logging, this new approach is feasible to be implemented in hardware.
B. Protocol Diagram
The protocol approach uses the same set of interfaces and test cases as the transaction
approach, except that I changed some interfaces for Opensparc T2 to provide better
coverage. The new interfaces for Opensparc T2 are: ccx_l2_cpx, ccx_sparc_pcx,
exu_dec_ccr, l2t_ccx, l2t_mcu, lsu_exu, lsu_fgu, lsu_ifu, lsu_pmu, lsu_tlu and
tlu_dtlb.
Similar to the approved transactions database, we extract a master protocol diagram
for each interface which describes all the approved behaviors of that interface. To
obtain this master protocol diagram, we first run Inferno on each test case and get one
protocol diagram for each. We then merge the ten protocol diagrams to acquire the
master diagram.
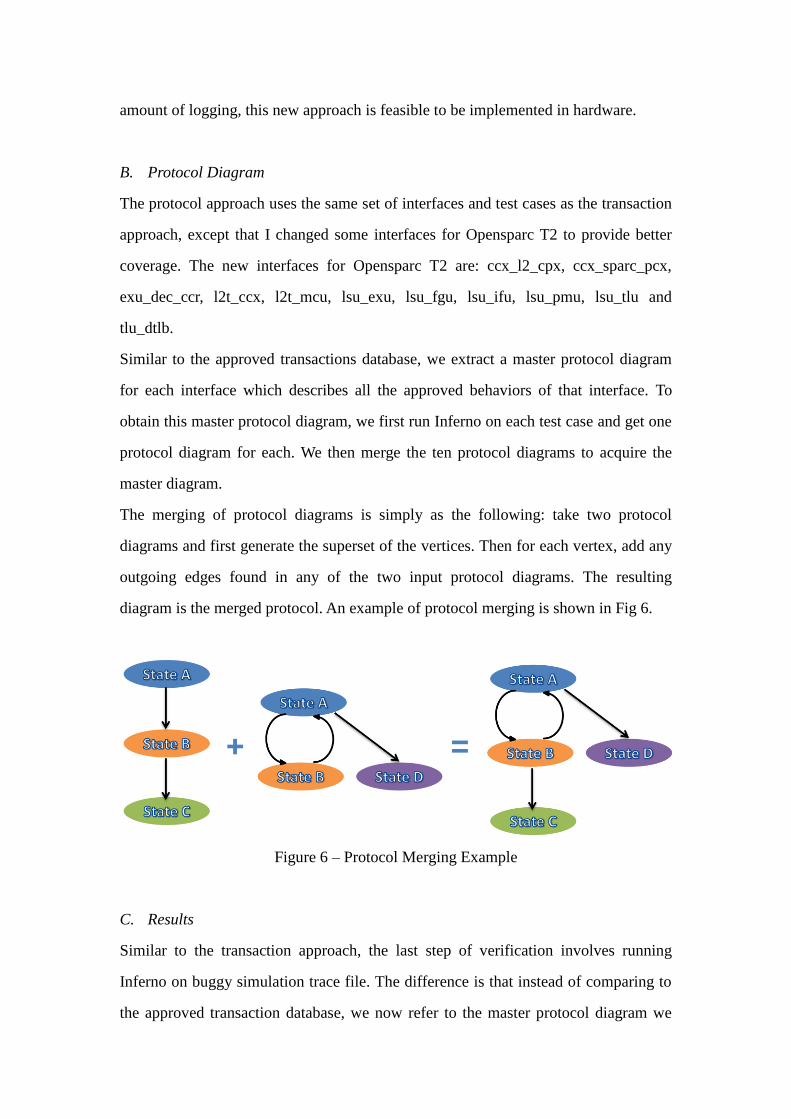
The merging of protocol diagrams is simply as the following: take two protocol
diagrams and first generate the superset of the vertices. Then for each vertex, add any
outgoing edges found in any of the two input protocol diagrams. The resulting
diagram is the merged protocol. An example of protocol merging is shown in Fig 6.
Figure 6 – Protocol Merging Example
C. Results
Similar to the transaction approach, the last step of verification involves running
Inferno on buggy simulation trace file. The difference is that instead of comparing to
the approved transaction database, we now refer to the master protocol diagram we
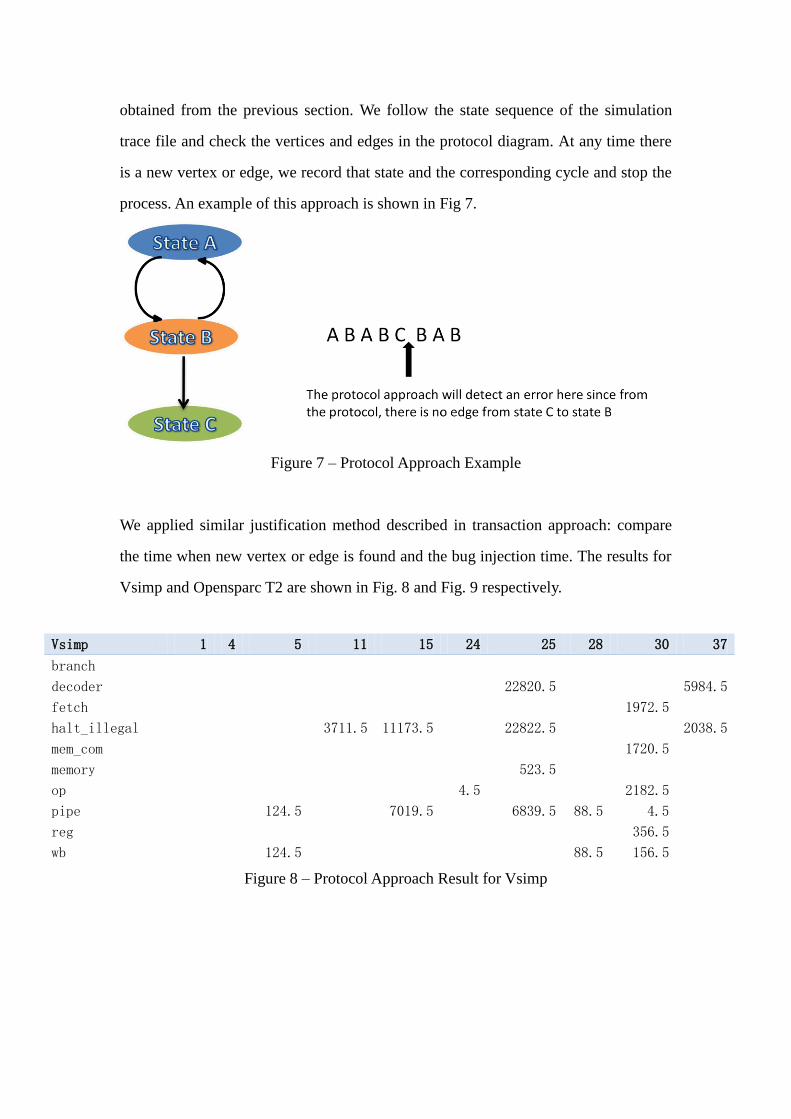
obtained from the previous section. We follow the state sequence of the simulation
trace file and check the vertices and edges in the protocol diagram. At any time there
is a new vertex or edge, we record that state and the corresponding cycle and stop the
process. An example of this approach is shown in Fig 7.
Figure 7 – Protocol Approach Example
We applied similar justification method described in transaction approach: compare
the time when new vertex or edge is found and the bug injection time. The results for
Vsimp and Opensparc T2 are shown in Fig. 8 and Fig. 9 respectively.
Vsimp 1 4 5 11 15 24 25 28 30 37
branch
decoder
22820.5
5984.5
fetch
1972.5
halt_illegal
3711.5 11173.5
22822.5
2038.5
mem_com
1720.5
memory
523.5
op
4.5
2182.5
pipe
124.5
7019.5
6839.5 88.5 4.5
reg
356.5
wb
124.5
88.5 156.5
Figure 8 – Protocol Approach Result for Vsimp
Opensparc T2 1 3 8 9 31 40 41 42 43 45
ccx_l2_cpx 54400
538 1603 1691 537
54401 -14900
ccx_sparc_pcx 129 -3684 604 617 16 259 -3684 -8684 45 -45512
exu_dec_ccr
242 1611
241
l2t_ccx 3834 -436 7237 1593
7236 -436 -5436
-65436
l2t_mcu
1652
lsu_exu
1609
16
lsu_fgu 22236
1613
-38426
lsu_ifu 4314 207 466 1607
465 207 -4793
-64793
lsu_pmu
1609
lsu_tlu 6168
4646 1611
4645
-3132 121128 -63132
tlu_dtlb 4134 -166 3131 102
3130 -166 -5166 102 -65166
Figure 9 – Protocol Approach for Opensparc T2
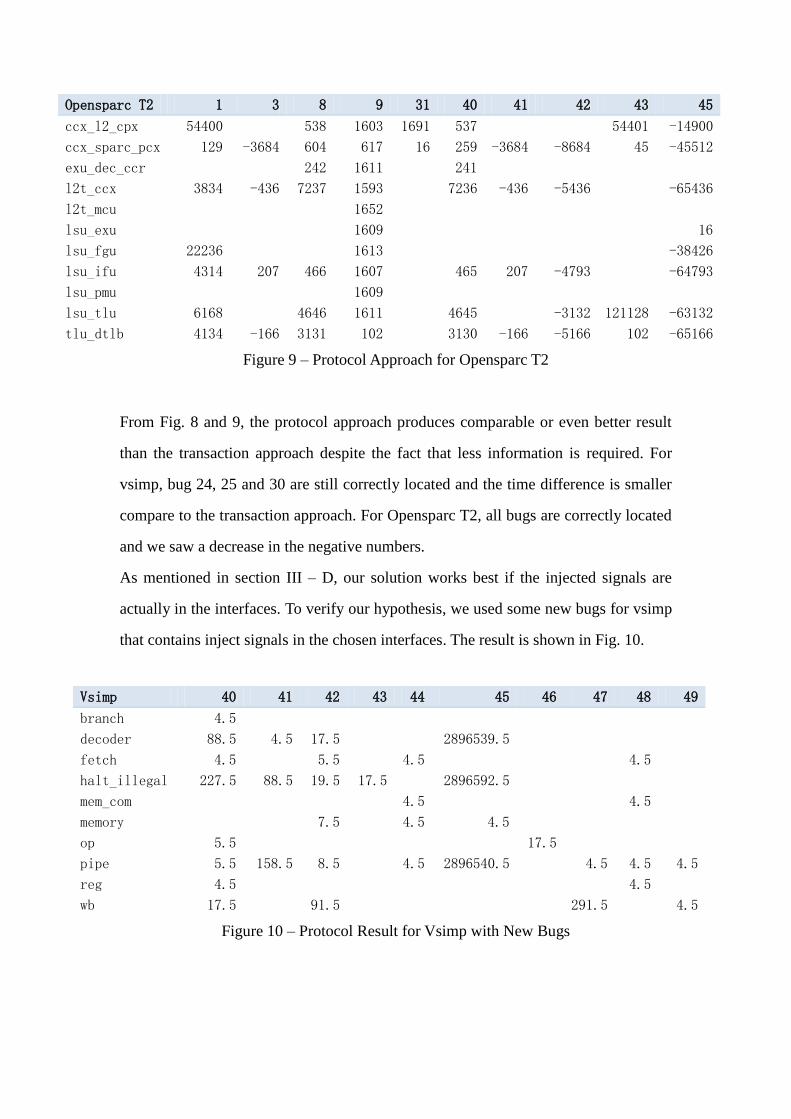
From Fig. 8 and 9, the protocol approach produces comparable or even better result
than the transaction approach despite the fact that less information is required. For
vsimp, bug 24, 25 and 30 are still correctly located and the time difference is smaller
compare to the transaction approach. For Opensparc T2, all bugs are correctly located
and we saw a decrease in the negative numbers.
As mentioned in section III – D, our solution works best if the injected signals are
actually in the interfaces. To verify our hypothesis, we used some new bugs for vsimp
that contains inject signals in the chosen interfaces. The result is shown in Fig. 10.
Vsimp 40 41 42 43 44 45 46 47 48 49
branch 4.5
decoder 88.5 4.5 17.5
2896539.5
fetch 4.5
5.5
4.5
4.5
halt_illegal 227.5 88.5 19.5 17.5
2896592.5
mem_com
4.5
4.5
memory
7.5
4.5 4.5
op 5.5
17.5
pipe 5.5 158.5 8.5
4.5 2896540.5
4.5 4.5 4.5
reg 4.5
4.5
wb 17.5
91.5
291.5
4.5
Figure 10 – Protocol Result for Vsimp with New Bugs
From Fig. 10, all new bugs are correctly located and the time difference is very small.
There are several cases that more than one interface catch the bug at the same time.
The reasons are: 1, more than one interface contain the injected signal; 2, some
signals are close to the injected signal and it causes second order effects.
V. Conclusion
Both our transaction and protocol verification solutions are highly automated and
therefore superior to previous methods. From the results we obtained, we are
confident that our solution can accurately locate the bug in the hardware design, both
in terms of time and space. In addition, our solution is easy to use. Once the master
protocol diagram is obtained, the verification engineers can simply let Inferno find the
bug for them.
However, there are still weaknesses in our solution. Firstly, our solution works the
best when the bug injected signals are in any of the interfaces. If none of the interface
contains the injected signal, the result may not be very accurate. Secondly, the quality
of result largely depends on the choice of interfaces. With badly chosen interfaces, our
solution may yield fuzzy results. However, for complex hardware designs, good
interfaces are hard to generate and without experiment, there is no clear way to judge
the quality of an interface.
VI. Reference
[1] A. DeOrio, A. Bauserman, V. Bertacco and B. Isaksen. Inferno: Streamlining
verification with inferred semantics. IEEE Transactions on Computer-Aided
Design
[2] Sun Microsystems Opensparc T2 Core Microarchitecture Specification
http://www.opensparc.net/cgi-bin/goto.php?w=/pubs/t2/docs//OpenSPARCT2_Co
re_Micro_Arch.pdf