Xiao-Hai Yan 1, Young-Heon Jo 1, Feili Li 1 and Tim Liu 2 June 9, 2010 1 Center for Remote Sensing,...
23
Xiao-Hai Yan 1 , Young-Heon Jo 1 , Feili Li 1 and Tim Liu 2 June 9, 2010 1 Center for Remote Sensing, University of Delaware 2 M/S 300-323, 4800 Oak Grove Dr. Jet Propulsion Laboratory, Pasadena, CA 91109 Characteristic Features of DOC in the Labrador Sea based on Multi-Sensor Measurements AMOC
-
Upload
elinor-dickerson -
Category
Documents
-
view
215 -
download
0
Transcript of Xiao-Hai Yan 1, Young-Heon Jo 1, Feili Li 1 and Tim Liu 2 June 9, 2010 1 Center for Remote Sensing,...

Xiao-Hai Yan1, Young-Heon Jo1, Feili Li1
and Tim Liu2
June 9, 20101 Center for Remote Sensing, University of Delaware2 M/S 300-323, 4800 Oak Grove Dr. Jet Propulsion Laboratory, Pasadena, CA 91109
Characteristic Features of DOC in the Labrador Sea based on Multi-Sensor
Measurements
AMOC

DOC Studies in LSLabrador Sea Group (1998)- Labrador Sea Deep Convection
ExperimentMarshal and Shott (1998)- Open ocean deep convection:
Observations, theory and modelsYashayaev and Loder (2009)-Enhanced production of Labrador
Sea Water in 2008Vage et al.(2009)- Return of DOC to subpolar NAO in winter 2007-
2008Lozier (2009)-Overturning assumptions based on NAORemote Sensing?Fischer et al. (1999)-DOC using SAR (?)Hermann et al. (2009)-Monitoring DOC from space
(Mediterranean Sea)How Good is RS for DOC observations?

DOC and Subsurface Phenomena
Detecting Mediterranean Outflow and Meddies (Yan et al.,JPO, 2006)

4
(Yan et al.,JPO, 2006)
MethodologyMethodology• Integrated Multi-Sensor Data AnalysisIntegrated Multi-Sensor Data Analysis
• WhereWhere
1( , , , , ) [ ( , , , , ) ( , , , , )]
1[ ( , , , ) ( , , , )]
K
Total Total
K
UL UL Total UL
T S W X t T S W X t T S W X tK
T W X t T W X tK
]),,(1
),,([
]),,(1
),,([
K
WW
K
TTUL
tXWK
tXW
tXTK
tXT
)(,,0
0
400
0
400
curlgf
gSdzTdz WST

04/18/235
NAUCW: North Atlantic Upper Cold Water 2.5 - 5 °C
NABCW: North Atlantic Bottom Cold Water 0 - 2.5 °C

Where is DOC in LS?When does it occur?Can we observe/monitor it?
How much does water sink?How much contribution to the AMOC……
Chanut et al., 2008

Relation between DOC and NAO
Strong DOCWeak DOC
Vertical structures of DOC from floats measurements
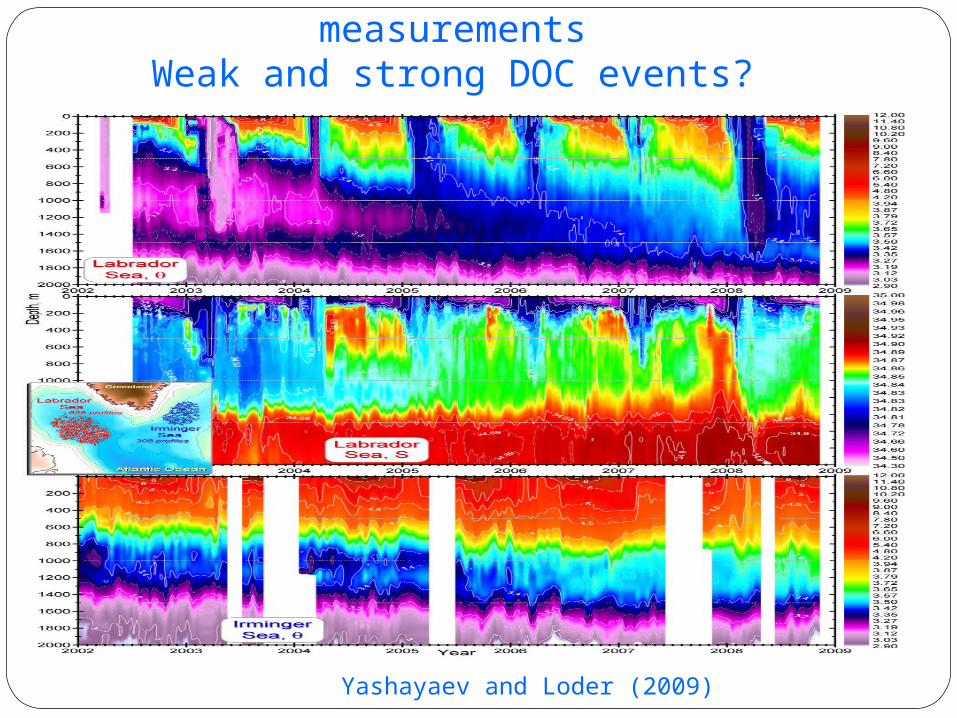
Weak and strong DOC events?
Yashayaev and Loder (2009)

Strategy to detect DOC events using RS
Two proxies for detecting DOCLST and SST differences and winds’ directionSteric heights and steric ratios
Fisher et al., 1999

Brunt-Vaisala (Buoyancy) frequency from a Float
How long it takes to reach 1800m depth?
Can SSHA contain DOC signals?

Land and Sea Surface Temperature with Winds

Satellite observations for weak and strong DOC events
Weak DOC events Strong DOC events
SSHA
LST and SST
Winds

B
C
A
D
Proxy I for DOC events based on temperature differences

Temperature comparisons over land and sea
Monthly temperature for Jan and FebWeekly temperature for Jan and FebWeekly temperature from 2006 to 2008

Steric height and its ratio (Sr)for Proxy II
0
0
dz
dz
Z
S
Z
T
T
Sr
S
T
S
Where, α and β are the thermal and the salt expansion coefficients, respectively.

Proxy II for DOC events based on steric height ratio 4900500
4900537
4900683

STD SSHA
Mean SSHA
2/15~4/15
2/15~4/15
2/15~4/15
200820072006

Direct evidence for DOC by estimating subsurface temperature
(Kang, Jo and Yan,2010)

Simulation for STA

Comparisons between estimated and GODAS measurements

Spatial Empirical Mode Decomposition for SSHA
(Jo, Yan, Li and Lee 2010)

Spatial Empirical Mode Decomposition for SST
(Jo, Yan, Li and Lee 2010)

Preliminary Conclusion•Difficult to detect precondition of DOC, but possible to monitoring DOC after convection.
• Two proxies are useful to monitor changes in water column of DOC and non-DOC sites.
•Temperature proxy for DOC shows that low SST requires LST threshold at -3C between Green Land and West of Baffin Sea . Steric height ratio proxy shows ~ 8 times larger for strong DOC than weak DOC.
• Subsurface temperature can be estimated from SSHA and provide information for AMOC & DOC analyses.
•Caution is required in analyzing with satellite data since there are still other similar signatures.
•EEMD can be used to decompose different spatial scales.