xcel energy 10Q_utility2q04
58
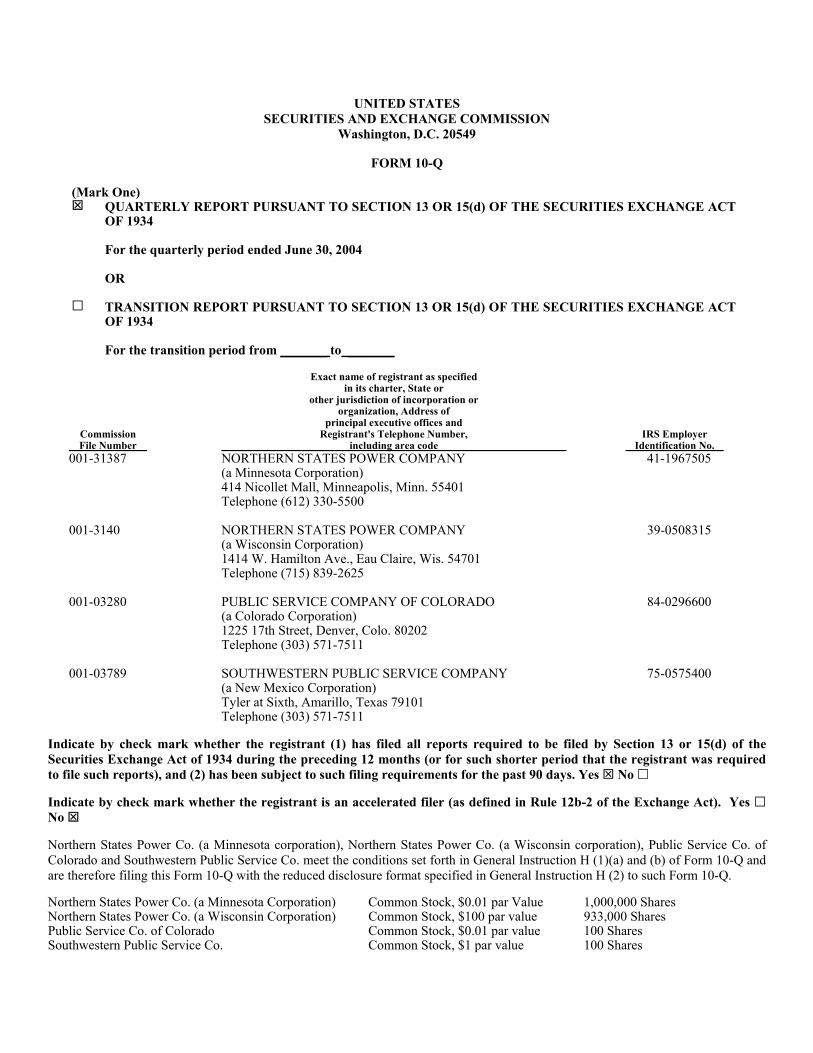
UNITED STATES SECURITIES AND EXCHANGE COMMISSION Washington, D.C. 20549 FORM 10-Q (Mark One) QUARTERLY REPORT PURSUANT TO SECTION 13 OR 15(d) OF THE SECURITIES EXCHANGE ACT OF 1934 For the quarterly period ended June 30, 2004 OR TRANSITION REPORT PURSUANT TO SECTION 13 OR 15(d) OF THE SECURITIES EXCHANGE ACT OF 1934 For the transition period from _______ to _______ Commission File Number Exact name of registrant as specified in its charter, State or other jurisdiction of incorporation or organization, Address of principal executive offices and Registrant's Telephone Number, including area code IRS Employer Identification No. 001-31387 NORTHERN STATES POWER COMPANY 41-1967505 (a Minnesota Corporation) 414 Nicollet Mall, Minneapolis, Minn. 55401 Telephone (612) 330-5500 001-3140 NORTHERN STATES POWER COMPANY 39-0508315 (a Wisconsin Corporation) 1414 W. Hamilton Ave., Eau Claire, Wis. 54701 Telephone (715) 839-2625 001-03280 PUBLIC SERVICE COMPANY OF COLORADO 84-0296600 (a Colorado Corporation) 1225 17th Street, Denver, Colo. 80202 Telephone (303) 571-7511 001-03789 SOUTHWESTERN PUBLIC SERVICE COMPANY 75-0575400 (a New Mexico Corporation) Tyler at Sixth, Amarillo, Texas 79101 Telephone (303) 571-7511 Indicate by check mark whether the registrant (1) has filed all reports required to be filed by Section 13 or 15(d) of the Securities Exchange Act of 1934 during the preceding 12 months (or for such shorter period that the registrant was required to file such reports), and (2) has been subject to such filing requirements for the past 90 days. Yes No Indicate by check mark whether the registrant is an accelerated filer (as defined in Rule 12b-2 of the Exchange Act). Yes No Northern States Power Co. (a Minnesota corporation), Northern States Power Co. (a Wisconsin corporation), Public Service Co. of Colorado and Southwestern Public Service Co. meet the conditions set forth in General Instruction H (1)(a) and (b) of Form 10-Q and are therefore filing this Form 10-Q with the reduced disclosure format specified in General Instruction H (2) to such Form 10-Q. Northern States Power Co. (a Minnesota Corporation) Common Stock, $0.01 par Value 1,000,000 Shares Northern States Power Co. (a Wisconsin Corporation) Common Stock, $100 par value 933,000 Shares Public Service Co. of Colorado Common Stock, $0.01 par value 100 Shares Southwestern Public Service Co. Common Stock, $1 par value 100 Shares
-
Upload
finance26 -
Category
Economy & Finance
-
view
117 -
download
0
Transcript of xcel energy 10Q_utility2q04
UNITED STATES SECURITIES AND EXCHANGE COMMISSION
Washington, D.C. 20549
FORM 10-Q
(Mark One) QUARTERLY REPORT PURSUANT TO SECTION 13 OR 15(d) OF THE SECURITIES EXCHANGE ACT
OF 1934 For the quarterly period ended June 30, 2004 OR
TRANSITION REPORT PURSUANT TO SECTION 13 OR 15(d) OF THE SECURITIES EXCHANGE ACT OF 1934
For the transition period from _______ to _______
Commission File Number
Exact name of registrant as specified in its charter, State or other jurisdiction of incorporation or organization, Address of principal executive offices and Registrant's Telephone Number, including area code
IRS Employer Identification No.
001-31387 NORTHERN STATES POWER COMPANY 41-1967505 (a Minnesota Corporation) 414 Nicollet Mall, Minneapolis, Minn. 55401 Telephone (612) 330-5500 001-3140 NORTHERN STATES POWER COMPANY 39-0508315 (a Wisconsin Corporation) 1414 W. Hamilton Ave., Eau Claire, Wis. 54701 Telephone (715) 839-2625 001-03280 PUBLIC SERVICE COMPANY OF COLORADO 84-0296600 (a Colorado Corporation) 1225 17th Street, Denver, Colo. 80202 Telephone (303) 571-7511 001-03789 SOUTHWESTERN PUBLIC SERVICE COMPANY 75-0575400 (a New Mexico Corporation) Tyler at Sixth, Amarillo, Texas 79101 Telephone (303) 571-7511
Indicate by check mark whether the registrant (1) has filed all reports required to be filed by Section 13 or 15(d) of the Securities Exchange Act of 1934 during the preceding 12 months (or for such shorter period that the registrant was required to file such reports), and (2) has been subject to such filing requirements for the past 90 days. Yes No Indicate by check mark whether the registrant is an accelerated filer (as defined in Rule 12b-2 of the Exchange Act). Yes No Northern States Power Co. (a Minnesota corporation), Northern States Power Co. (a Wisconsin corporation), Public Service Co. of Colorado and Southwestern Public Service Co. meet the conditions set forth in General Instruction H (1)(a) and (b) of Form 10-Q and are therefore filing this Form 10-Q with the reduced disclosure format specified in General Instruction H (2) to such Form 10-Q. Northern States Power Co. (a Minnesota Corporation) Common Stock, $0.01 par Value 1,000,000 Shares Northern States Power Co. (a Wisconsin Corporation) Common Stock, $100 par value 933,000 Shares Public Service Co. of Colorado Common Stock, $0.01 par value 100 Shares Southwestern Public Service Co. Common Stock, $1 par value 100 Shares

Table of Contents
PART I - FINANCIAL INFORMATION Item l. Financial Statements Item 2. Management's Discussion and Analysis of Financial Condition and Results of Operations
PART II - OTHER INFORMATION Item 1. Legal Proceedings Item 6. Exhibits and Reports on Form 8-K This combined Form 10-Q is separately filed by Northern States Power Co., a Minnesota corporation (NSP-Minnesota), Northern States Power Co., a Wisconsin corporation (NSP-Wisconsin), Public Service Co. of Colorado (PSCo) and Southwestern Public Service Co. (SPS). NSP-Minnesota, NSP-Wisconsin, PSCo and SPS are all wholly owned subsidiaries of Xcel Energy Inc. (Xcel Energy). Xcel Energy is a registered holding company under the Public Utility Holding Company Act of 1935 (PUHCA). Additional information on Xcel Energy is available on various filings with the Securities and Exchange Commission (SEC). Information contained in this report relating to any individual company is filed by such company on its own behalf. Each registrant makes representations only as to itself and makes no other representations whatsoever as to information relating to the other registrants. This report should be read in its entirety. No one section of the report deals with all aspects of the subject matter.
2

PART 1. FINANCIAL INFORMATION
Item 1. Consolidated Financial Statements
NSP-MINNESOTA CONSOLIDATED STATEMENTS OF INCOME (UNAUDITED)
(Thousands of Dollars) Three Months Ended June 30, Six Months Ended June 30,
2004 2003 2004 2003 Operating revenues: Electric utility ........................................................................................... $ 596,383 $ 571,638 $ 1,204,699 $ 1,158,549 Electric trading margin ............................................................................. (465) 2,001 886 3,401 Natural gas utility...................................................................................... 94,154 88,878 406,286 422,128 Other ......................................................................................................... 6,869 4,744 14,732 10,938
Total operating revenues ..................................................................... 696,941 667,261 1,626,603 1,595,016 Operating expenses: Electric fuel and purchased power ............................................................ 212,476 204,744 428,756 413,734 Cost of natural gas sold and transported ................................................... 70,309 62,770 317,154 331,462 Other operating and maintenance expenses .............................................. 209,314 211,979 416,809 423,589 Depreciation and amortization .................................................................. 82,333 99,469 164,499 190,671 Taxes (other than income taxes) .............................................................. 44,806 42,830 89,049 87,176
Total operating expenses..................................................................... 619,238 621,792 1,416,267 1,446,632 Operating income...................................................................................... 77,703 45,469 210,336 148,384 Other income (expense): Interest income.......................................................................................... 1,609 1,493 3,239 3,393 Other nonoperating income....................................................................... 4,891 5,554 8,178 8,154 Nonoperating expense............................................................................... (1,564) (1,689) (2,899) (3,169)
Total other income ................................................................................. 4,936 5,358 8,518 8,378 Interest charges and financing costs: Interest charges — net of amounts capitalized, includes other financing
costs of $2,192, $2,246, $4,497 and $3,980, respectively....................... 32,481 29,921 65,343 61,895 Distributions on redeemable preferred securities of subsidiary trust ........ — 3,937 — 7,875
Total interest charges and financing costs........................................... 32,481 33,858 65,343 69,770 Income before income taxes ....................................................................... 50,158 16,969 153,511 86,992 Income taxes (benefit) ................................................................................ 15,895 (2,672) 50,891 22,900 Net income.................................................................................................. $ 34,263 $ 19,641 $ 102,620 $ 64,092
See disclosures regarding NSP-Minnesota in the Notes to Consolidated Financial Statements
3
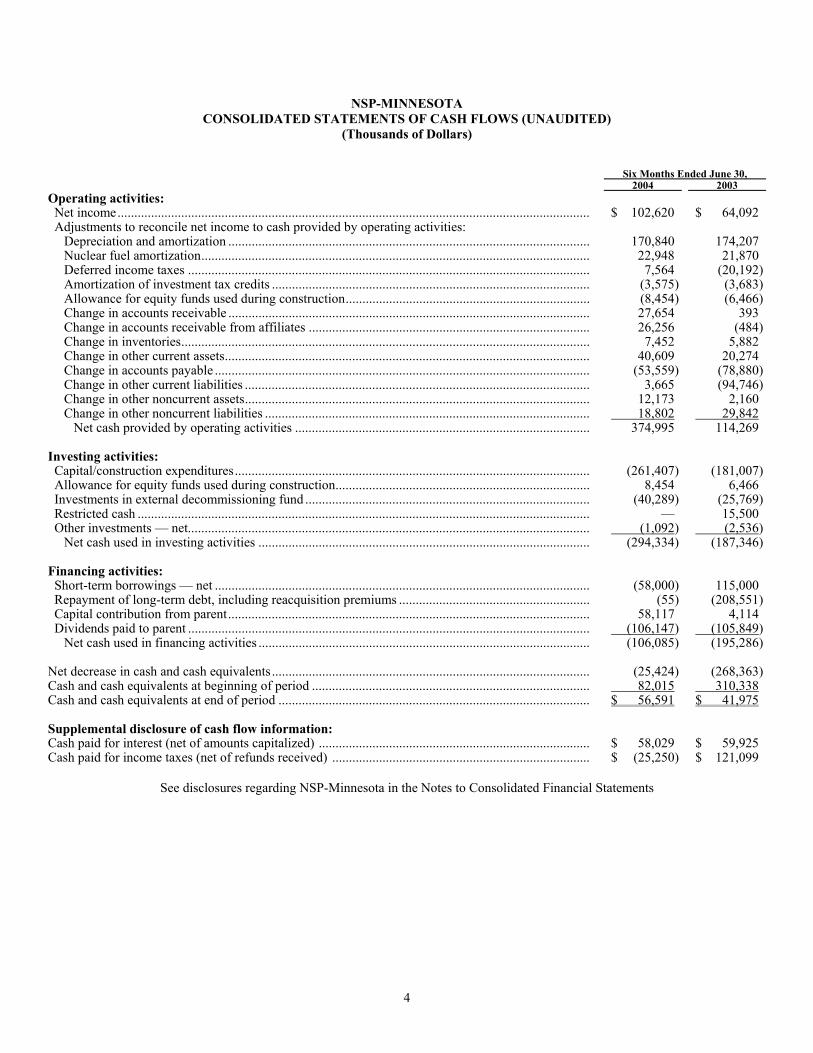
NSP-MINNESOTA CONSOLIDATED STATEMENTS OF CASH FLOWS (UNAUDITED)
(Thousands of Dollars)
Six Months Ended June 30,
2004 2003 Operating activities: Net income............................................................................................................................................. $ 102,620 $ 64,092 Adjustments to reconcile net income to cash provided by operating activities:
Depreciation and amortization ............................................................................................................ 170,840 174,207 Nuclear fuel amortization.................................................................................................................... 22,948 21,870 Deferred income taxes ........................................................................................................................ 7,564 (20,192)Amortization of investment tax credits ............................................................................................... (3,575) (3,683)Allowance for equity funds used during construction......................................................................... (8,454) (6,466)Change in accounts receivable ............................................................................................................ 27,654 393 Change in accounts receivable from affiliates .................................................................................... 26,256 (484)Change in inventories.......................................................................................................................... 7,452 5,882 Change in other current assets............................................................................................................. 40,609 20,274 Change in accounts payable ................................................................................................................ (53,559) (78,880)Change in other current liabilities ....................................................................................................... 3,665 (94,746)Change in other noncurrent assets....................................................................................................... 12,173 2,160 Change in other noncurrent liabilities ................................................................................................. 18,802 29,842
Net cash provided by operating activities ........................................................................................ 374,995 114,269 Investing activities: Capital/construction expenditures.......................................................................................................... (261,407) (181,007)Allowance for equity funds used during construction............................................................................ 8,454 6,466 Investments in external decommissioning fund ..................................................................................... (40,289) (25,769)Restricted cash ....................................................................................................................................... — 15,500 Other investments — net........................................................................................................................ (1,092) (2,536)
Net cash used in investing activities ................................................................................................... (294,334) (187,346) Financing activities: Short-term borrowings — net ................................................................................................................ (58,000) 115,000 Repayment of long-term debt, including reacquisition premiums ......................................................... (55) (208,551)Capital contribution from parent............................................................................................................ 58,117 4,114 Dividends paid to parent ........................................................................................................................ (106,147) (105,849)
Net cash used in financing activities ................................................................................................... (106,085) (195,286) Net decrease in cash and cash equivalents............................................................................................... (25,424) (268,363)Cash and cash equivalents at beginning of period ................................................................................... 82,015 310,338 Cash and cash equivalents at end of period ............................................................................................. $ 56,591 $ 41,975 Supplemental disclosure of cash flow information: Cash paid for interest (net of amounts capitalized) ................................................................................. $ 58,029 $ 59,925 Cash paid for income taxes (net of refunds received) ............................................................................. $ (25,250) $ 121,099
See disclosures regarding NSP-Minnesota in the Notes to Consolidated Financial Statements
4
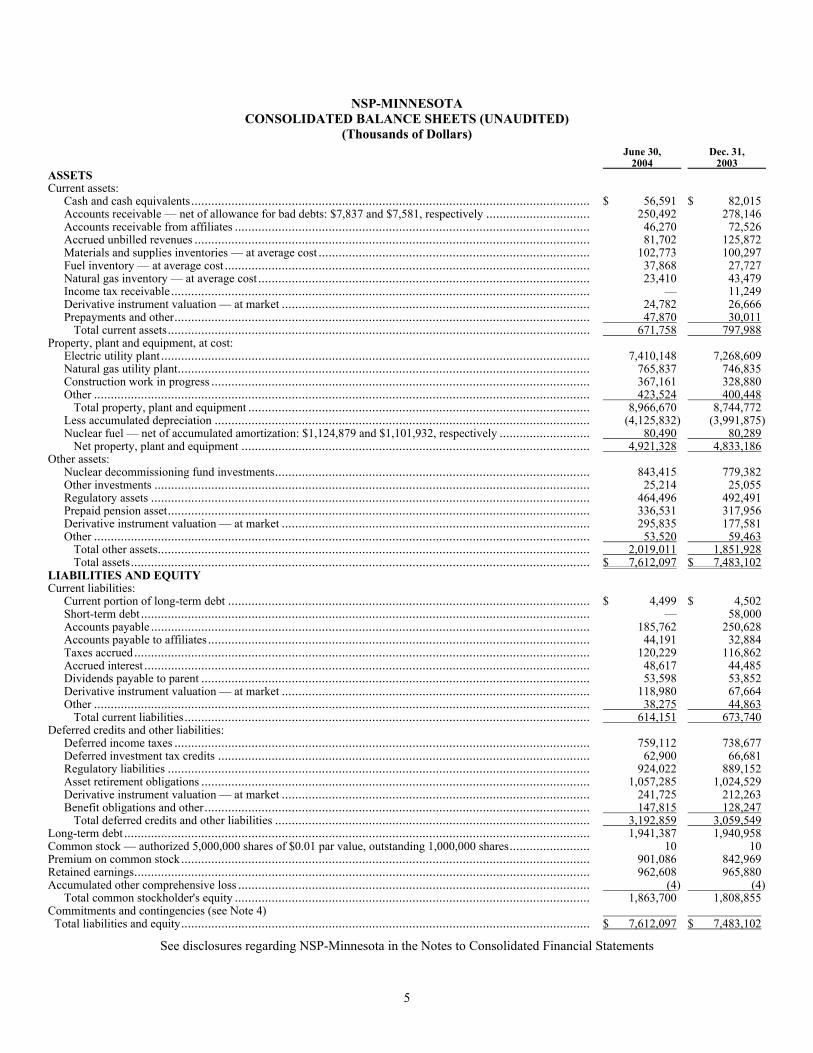
NSP-MINNESOTA CONSOLIDATED BALANCE SHEETS (UNAUDITED)
(Thousands of Dollars)
June 30, 2004
Dec. 31, 2003
ASSETS Current assets:
Cash and cash equivalents....................................................................................................................... $ 56,591 $ 82,015 Accounts receivable — net of allowance for bad debts: $7,837 and $7,581, respectively ............................... 250,492 278,146 Accounts receivable from affiliates .......................................................................................................... 46,270 72,526 Accrued unbilled revenues ...................................................................................................................... 81,702 125,872 Materials and supplies inventories — at average cost ................................................................................. 102,773 100,297 Fuel inventory — at average cost ............................................................................................................. 37,868 27,727 Natural gas inventory — at average cost ................................................................................................... 23,410 43,479 Income tax receivable............................................................................................................................. — 11,249 Derivative instrument valuation — at market ............................................................................................ 24,782 26,666 Prepayments and other............................................................................................................................ 47,870 30,011
Total current assets.............................................................................................................................. 671,758 797,988 Property, plant and equipment, at cost:
Electric utility plant................................................................................................................................ 7,410,148 7,268,609 Natural gas utility plant........................................................................................................................... 765,837 746,835 Construction work in progress ................................................................................................................. 367,161 328,880 Other .................................................................................................................................................... 423,524 400,448
Total property, plant and equipment ...................................................................................................... 8,966,670 8,744,772 Less accumulated depreciation ................................................................................................................ (4,125,832) (3,991,875)Nuclear fuel — net of accumulated amortization: $1,124,879 and $1,101,932, respectively ........................... 80,490 80,289
Net property, plant and equipment ........................................................................................................ 4,921,328 4,833,186 Other assets:
Nuclear decommissioning fund investments.............................................................................................. 843,415 779,382 Other investments .................................................................................................................................. 25,214 25,055 Regulatory assets ................................................................................................................................... 464,496 492,491 Prepaid pension asset.............................................................................................................................. 336,531 317,956 Derivative instrument valuation — at market ............................................................................................ 295,835 177,581 Other .................................................................................................................................................... 53,520 59,463
Total other assets................................................................................................................................. 2,019,011 1,851,928 Total assets......................................................................................................................................... $ 7,612,097 $ 7,483,102
LIABILITIES AND EQUITY Current liabilities:
Current portion of long-term debt ............................................................................................................ $ 4,499 $ 4,502 Short-term debt ...................................................................................................................................... — 58,000 Accounts payable ................................................................................................................................... 185,762 250,628 Accounts payable to affiliates.................................................................................................................. 44,191 32,884 Taxes accrued........................................................................................................................................ 120,229 116,862 Accrued interest ..................................................................................................................................... 48,617 44,485 Dividends payable to parent .................................................................................................................... 53,598 53,852 Derivative instrument valuation — at market ............................................................................................ 118,980 67,664 Other .................................................................................................................................................... 38,275 44,863
Total current liabilities......................................................................................................................... 614,151 673,740 Deferred credits and other liabilities:
Deferred income taxes ............................................................................................................................ 759,112 738,677 Deferred investment tax credits ............................................................................................................... 62,900 66,681 Regulatory liabilities .............................................................................................................................. 924,022 889,152 Asset retirement obligations .................................................................................................................... 1,057,285 1,024,529 Derivative instrument valuation — at market ............................................................................................ 241,725 212,263 Benefit obligations and other................................................................................................................... 147,815 128,247
Total deferred credits and other liabilities .............................................................................................. 3,192,859 3,059,549 Long-term debt ........................................................................................................................................... 1,941,387 1,940,958 Common stock — authorized 5,000,000 shares of $0.01 par value, outstanding 1,000,000 shares........................ 10 10 Premium on common stock.......................................................................................................................... 901,086 842,969 Retained earnings........................................................................................................................................ 962,608 965,880 Accumulated other comprehensive loss ......................................................................................................... (4) (4)
Total common stockholder's equity .......................................................................................................... 1,863,700 1,808,855 Commitments and contingencies (see Note 4)
Total liabilities and equity.......................................................................................................................... $ 7,612,097 $ 7,483,102
See disclosures regarding NSP-Minnesota in the Notes to Consolidated Financial Statements
5
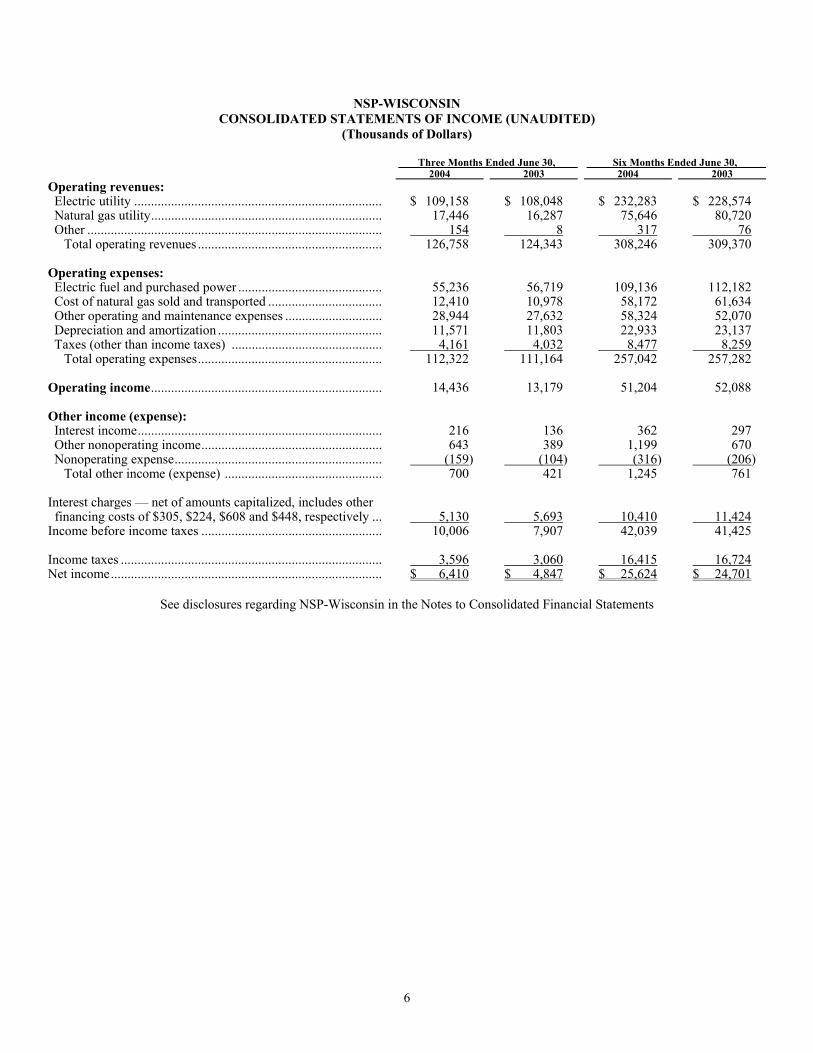
NSP-WISCONSIN CONSOLIDATED STATEMENTS OF INCOME (UNAUDITED)
(Thousands of Dollars) Three Months Ended June 30, Six Months Ended June 30,
2004 2003 2004 2003 Operating revenues: Electric utility .......................................................................... $ 109,158 $ 108,048 $ 232,283 $ 228,574 Natural gas utility..................................................................... 17,446 16,287 75,646 80,720 Other ........................................................................................ 154 8 317 76
Total operating revenues ....................................................... 126,758 124,343 308,246 309,370 Operating expenses: Electric fuel and purchased power ........................................... 55,236 56,719 109,136 112,182 Cost of natural gas sold and transported .................................. 12,410 10,978 58,172 61,634 Other operating and maintenance expenses ............................. 28,944 27,632 58,324 52,070 Depreciation and amortization ................................................. 11,571 11,803 22,933 23,137 Taxes (other than income taxes) ............................................. 4,161 4,032 8,477 8,259
Total operating expenses....................................................... 112,322 111,164 257,042 257,282 Operating income..................................................................... 14,436 13,179 51,204 52,088 Other income (expense): Interest income......................................................................... 216 136 362 297 Other nonoperating income...................................................... 643 389 1,199 670 Nonoperating expense.............................................................. (159) (104) (316) (206)
Total other income (expense) ............................................... 700 421 1,245 761 Interest charges — net of amounts capitalized, includes other
financing costs of $305, $224, $608 and $448, respectively ... 5,130 5,693 10,410 11,424 Income before income taxes ...................................................... 10,006 7,907 42,039 41,425 Income taxes .............................................................................. 3,596 3,060 16,415 16,724 Net income................................................................................. $ 6,410 $ 4,847 $ 25,624 $ 24,701
See disclosures regarding NSP-Wisconsin in the Notes to Consolidated Financial Statements
6

NSP-WISCONSIN CONSOLIDATED STATEMENTS OF CASH FLOWS (UNAUDITED)
(Thousands of Dollars) Six Months Ended June 30,
2004 2003 Operating activities: Net income............................................................................................................................................. $ 25,624 $ 24,701 Adjustments to reconcile net income to net cash provided by operating activities:
Depreciation and amortization ............................................................................................................ 23,845 23,650 Deferred income taxes ........................................................................................................................ 3,827 3,313 Amortization of investment tax credits ............................................................................................... (466) (396) Allowance for equity funds used during construction......................................................................... (1,100) (548) Undistributed equity in earnings of unconsolidated affiliates ............................................................. 5 (43) Change in accounts receivable ............................................................................................................ 4,894 9,894 Change in inventories.......................................................................................................................... 2,215 1,413 Change in other current assets............................................................................................................. 12,977 11,817 Change in accounts payable ................................................................................................................ (7,950) (5,433) Change in other current liabilities ....................................................................................................... 3,229 1,064 Change in other assets......................................................................................................................... (3,209) (3,100) Change in other liabilities ................................................................................................................... 87 (127)
Net cash provided by operating activities ........................................................................................ 63,978 66,205
Investing activities: Capital/construction expenditures.......................................................................................................... (22,018) (22,139) Allowance for equity funds used during construction............................................................................ 1,100 548 Other investments — net........................................................................................................................ (551) 13
Net cash used in investing activities................................................................................................. (21,469) (21,578) Financing activities: Short-term borrowings from affiliate — net .......................................................................................... (18,380) (6,880) Capital contributions from parent .......................................................................................................... 687 692 Dividends paid to parent ........................................................................................................................ (24,855) (24,714)
Net cash used in financing activities ................................................................................................ (42,548) (30,902) Net (decrease) increase in cash and cash equivalents .............................................................................. (39) 13,725 Net increase in cash and cash equivalents — adoption of FIN No. 46 .................................................... 192 — Cash and cash equivalents at beginning of period ................................................................................... 137 98 Cash and cash equivalents at end of period ............................................................................................. $ 290 $ 13,823 Supplemental disclosure of cash flow information: Cash paid for interest (net of amounts capitalized) ............................................................................... $ 9,770 $ 10,956 Cash paid for income taxes (net of refunds received) ........................................................................... $ 2,865 $ 10,787
See disclosures regarding NSP-Wisconsin in the Notes to Consolidated Financial Statements
7
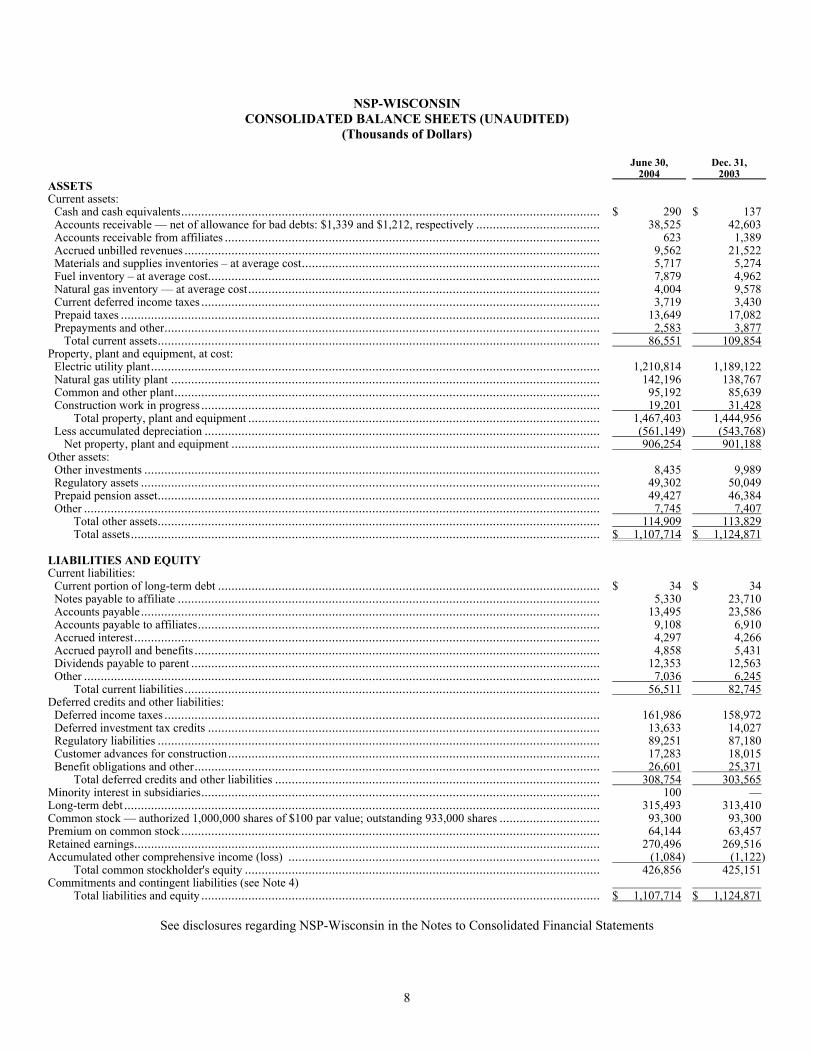
NSP-WISCONSIN CONSOLIDATED BALANCE SHEETS (UNAUDITED)
(Thousands of Dollars)
June 30, 2004
Dec. 31, 2003
ASSETS Current assets:
Cash and cash equivalents............................................................................................................................. $ 290 $ 137 Accounts receivable — net of allowance for bad debts: $1,339 and $1,212, respectively ..................................... 38,525 42,603 Accounts receivable from affiliates ................................................................................................................ 623 1,389 Accrued unbilled revenues ............................................................................................................................ 9,562 21,522 Materials and supplies inventories – at average cost......................................................................................... 5,717 5,274 Fuel inventory – at average cost..................................................................................................................... 7,879 4,962 Natural gas inventory — at average cost......................................................................................................... 4,004 9,578 Current deferred income taxes ....................................................................................................................... 3,719 3,430 Prepaid taxes ............................................................................................................................................... 13,649 17,082 Prepayments and other.................................................................................................................................. 2,583 3,877
Total current assets.................................................................................................................................... 86,551 109,854 Property, plant and equipment, at cost:
Electric utility plant...................................................................................................................................... 1,210,814 1,189,122 Natural gas utility plant ................................................................................................................................ 142,196 138,767 Common and other plant............................................................................................................................... 95,192 85,639 Construction work in progress ....................................................................................................................... 19,201 31,428
Total property, plant and equipment ......................................................................................................... 1,467,403 1,444,956 Less accumulated depreciation ...................................................................................................................... (561,149) (543,768)
Net property, plant and equipment .............................................................................................................. 906,254 901,188 Other assets:
Other investments ........................................................................................................................................ 8,435 9,989 Regulatory assets ......................................................................................................................................... 49,302 50,049 Prepaid pension asset.................................................................................................................................... 49,427 46,384 Other .......................................................................................................................................................... 7,745 7,407
Total other assets.................................................................................................................................... 114,909 113,829 Total assets............................................................................................................................................ $ 1,107,714 $ 1,124,871
LIABILITIES AND EQUITY Current liabilities:
Current portion of long-term debt .................................................................................................................. $ 34 $ 34 Notes payable to affiliate .............................................................................................................................. 5,330 23,710 Accounts payable......................................................................................................................................... 13,495 23,586 Accounts payable to affiliates........................................................................................................................ 9,108 6,910 Accrued interest........................................................................................................................................... 4,297 4,266 Accrued payroll and benefits ......................................................................................................................... 4,858 5,431 Dividends payable to parent .......................................................................................................................... 12,353 12,563 Other .......................................................................................................................................................... 7,036 6,245
Total current liabilities............................................................................................................................ 56,511 82,745 Deferred credits and other liabilities:
Deferred income taxes .................................................................................................................................. 161,986 158,972 Deferred investment tax credits ..................................................................................................................... 13,633 14,027 Regulatory liabilities .................................................................................................................................... 89,251 87,180 Customer advances for construction............................................................................................................... 17,283 18,015 Benefit obligations and other......................................................................................................................... 26,601 25,371
Total deferred credits and other liabilities ................................................................................................. 308,754 303,565 Minority interest in subsidiaries....................................................................................................................... 100 — Long-term debt .............................................................................................................................................. 315,493 313,410 Common stock — authorized 1,000,000 shares of $100 par value; outstanding 933,000 shares .............................. 93,300 93,300 Premium on common stock............................................................................................................................. 64,144 63,457 Retained earnings........................................................................................................................................... 270,496 269,516 Accumulated other comprehensive income (loss) ............................................................................................. (1,084) (1,122)
Total common stockholder's equity .......................................................................................................... 426,856 425,151 Commitments and contingent liabilities (see Note 4)
Total liabilities and equity ....................................................................................................................... $ 1,107,714 $ 1,124,871
See disclosures regarding NSP-Wisconsin in the Notes to Consolidated Financial Statements
8

PUBLIC SERVICE CO. OF COLORADO
CONSOLIDATED STATEMENTS OF INCOME (UNAUDITED) (Thousands of Dollars)
Three Months Ended June 30, Six Months Ended June 30, 2004 2003 2004 2003 Operating revenues:
Electric utility........................................................................ $ 505,398 $ 492,734 $ 1,017,160 $ 987,223 Electric trading margin.......................................................... (326) 2,062 (779) 11 Natural gas utility.................................................................. 161,782 161,661 554,312 418,338 Steam and other..................................................................... 6,378 4,722 14,459 11,370
Total operating revenues .................................................. 673,232 661,179 1,585,152 1,416,942 Operating expenses:
Electric fuel and purchased power ........................................ 294,453 274,922 577,065 530,717 Cost of natural gas sold and transported ............................... 103,621 97,283 405,266 252,190 Cost of sales – steam and other ............................................. 3,391 2,729 8,519 6,427 Other operating and maintenance expenses .......................... 129,563 115,972 258,522 230,740 Depreciation and amortization .............................................. 54,718 62,004 107,139 120,647 Taxes (other than income taxes) ........................................... 21,521 22,855 43,672 43,036
Total operating expenses .................................................. 607,267 575,765 1,400,183 1,183,757 Operating income..................................................................... 65,965 85,414 184,969 233,185 Other income (expense): Interest income......................................................................... 264 1,570 784 2,011 Other nonoperating income...................................................... 4,295 4,321 8,308 5,883 Nonoperating expenses ............................................................ (4,972) (4,213) (8,841) (7,417)
Total other income (expense) ............................................ (413) 1,678 251 477 Interest charges and financing costs:
Interest charges – net of amounts capitalized, includes other financing costs of $1,932, $2,199, $4,013 and $3,915, respectively ............................................................ 36,136 40,679 72,851 76,596
Distributions on redeemable preferred securities of subsidiary trust .................................................................... — 3,686 — 7,372
Total interest charges and financing costs........................ 36,136 44,365 72,851 83,968 Income before income taxes ...................................................... 29,416 42,727 112,369 149,694 Income taxes .............................................................................. 1,484 9,073 29,271 45,953 Net income................................................................................. $ 27,932 $ 33,654 $ 83,098 $ 103,741
See disclosures regarding PSCo in the Notes to Consolidated Financial Statements
9
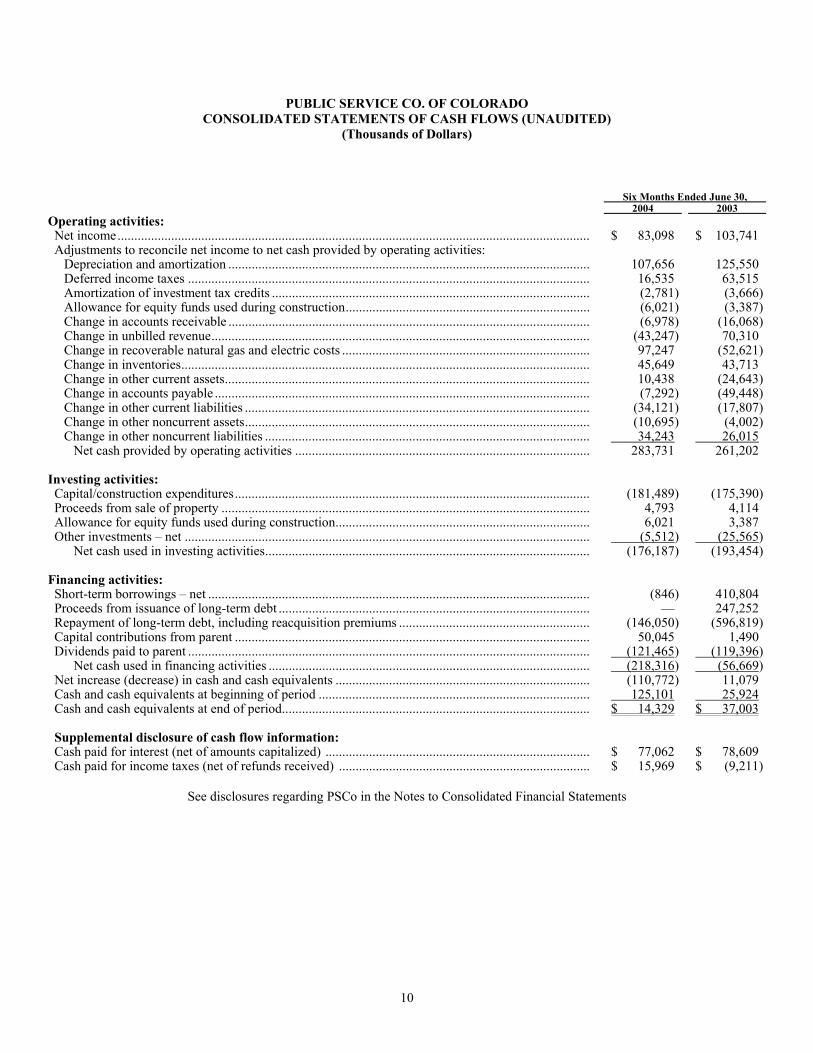
PUBLIC SERVICE CO. OF COLORADO CONSOLIDATED STATEMENTS OF CASH FLOWS (UNAUDITED)
(Thousands of Dollars)
Six Months Ended June 30,
2004 2003 Operating activities: Net income............................................................................................................................................. $ 83,098 $ 103,741 Adjustments to reconcile net income to net cash provided by operating activities:
Depreciation and amortization ............................................................................................................ 107,656 125,550 Deferred income taxes ........................................................................................................................ 16,535 63,515 Amortization of investment tax credits ............................................................................................... (2,781) (3,666)Allowance for equity funds used during construction......................................................................... (6,021) (3,387)Change in accounts receivable ............................................................................................................ (6,978) (16,068)Change in unbilled revenue................................................................................................................. (43,247) 70,310 Change in recoverable natural gas and electric costs .......................................................................... 97,247 (52,621)Change in inventories.......................................................................................................................... 45,649 43,713 Change in other current assets............................................................................................................. 10,438 (24,643)Change in accounts payable ................................................................................................................ (7,292) (49,448)Change in other current liabilities ....................................................................................................... (34,121) (17,807)Change in other noncurrent assets....................................................................................................... (10,695) (4,002)Change in other noncurrent liabilities ................................................................................................. 34,243 26,015
Net cash provided by operating activities ........................................................................................ 283,731 261,202 Investing activities: Capital/construction expenditures.......................................................................................................... (181,489) (175,390)Proceeds from sale of property .............................................................................................................. 4,793 4,114 Allowance for equity funds used during construction............................................................................ 6,021 3,387 Other investments – net ......................................................................................................................... (5,512) (25,565)
Net cash used in investing activities................................................................................................. (176,187) (193,454) Financing activities: Short-term borrowings – net .................................................................................................................. (846) 410,804 Proceeds from issuance of long-term debt ............................................................................................. — 247,252 Repayment of long-term debt, including reacquisition premiums ......................................................... (146,050) (596,819)Capital contributions from parent .......................................................................................................... 50,045 1,490 Dividends paid to parent ........................................................................................................................ (121,465) (119,396)
Net cash used in financing activities ................................................................................................ (218,316) (56,669)Net increase (decrease) in cash and cash equivalents ............................................................................ (110,772) 11,079 Cash and cash equivalents at beginning of period ................................................................................. 125,101 25,924 Cash and cash equivalents at end of period............................................................................................ $ 14,329 $ 37,003 Supplemental disclosure of cash flow information: Cash paid for interest (net of amounts capitalized) ............................................................................... $ 77,062 $ 78,609 Cash paid for income taxes (net of refunds received) ........................................................................... $ 15,969 $ (9,211)
See disclosures regarding PSCo in the Notes to Consolidated Financial Statements
10
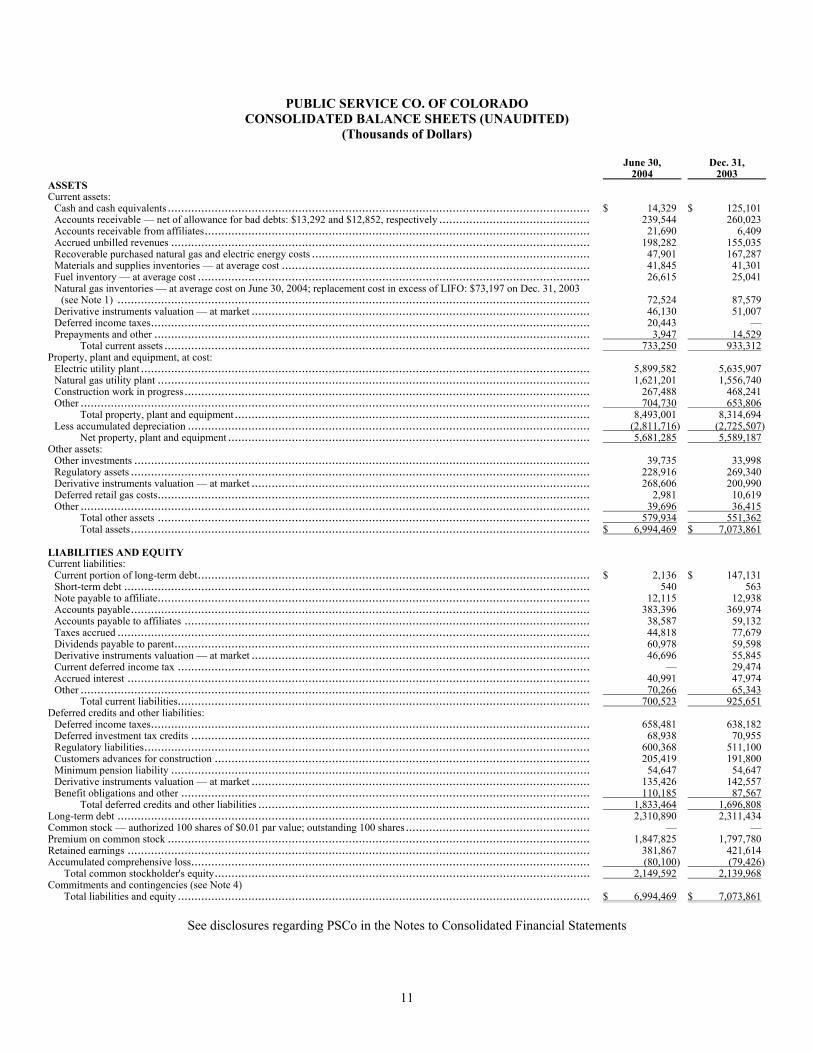
PUBLIC SERVICE CO. OF COLORADO CONSOLIDATED BALANCE SHEETS (UNAUDITED)
(Thousands of Dollars)
June 30, 2004
Dec. 31, 2003
ASSETS Current assets:
Cash and cash equivalents .............................................................................................................................. $ 14,329 $ 125,101 Accounts receivable — net of allowance for bad debts: $13,292 and $12,852, respectively ............................................. 239,544 260,023 Accounts receivable from affiliates................................................................................................................... 21,690 6,409 Accrued unbilled revenues ............................................................................................................................. 198,282 155,035 Recoverable purchased natural gas and electric energy costs ................................................................................... 47,901 167,287 Materials and supplies inventories — at average cost ............................................................................................ 41,845 41,301 Fuel inventory — at average cost ..................................................................................................................... 26,615 25,041 Natural gas inventories — at average cost on June 30, 2004; replacement cost in excess of LIFO: $73,197 on Dec. 31, 2003
(see Note 1) ............................................................................................................................................. 72,524 87,579 Derivative instruments valuation — at market ..................................................................................................... 46,130 51,007 Deferred income taxes................................................................................................................................... 20,443 — Prepayments and other .................................................................................................................................. 3,947 14,529
Total current assets ............................................................................................................................... 733,250 933,312 Property, plant and equipment, at cost:
Electric utility plant ...................................................................................................................................... 5,899,582 5,635,907 Natural gas utility plant ................................................................................................................................. 1,621,201 1,556,740 Construction work in progress......................................................................................................................... 267,488 468,241 Other ........................................................................................................................................................ 704,730 653,806
Total property, plant and equipment .......................................................................................................... 8,493,001 8,314,694 Less accumulated depreciation ........................................................................................................................ (2,811,716) (2,725,507)
Net property, plant and equipment ............................................................................................................ 5,681,285 5,589,187 Other assets:
Other investments ........................................................................................................................................ 39,735 33,998 Regulatory assets ......................................................................................................................................... 228,916 269,340 Derivative instruments valuation — at market ..................................................................................................... 268,606 200,990 Deferred retail gas costs................................................................................................................................. 2,981 10,619 Other ........................................................................................................................................................ 39,696 36,415
Total other assets ................................................................................................................................. 579,934 551,362 Total assets......................................................................................................................................... $ 6,994,469 $ 7,073,861
LIABILITIES AND EQUITY Current liabilities:
Current portion of long-term debt..................................................................................................................... $ 2,136 $ 147,131 Short-term debt ........................................................................................................................................... 540 563 Note payable to affiliate................................................................................................................................. 12,115 12,938 Accounts payable......................................................................................................................................... 383,396 369,974 Accounts payable to affiliates ......................................................................................................................... 38,587 59,132 Taxes accrued ............................................................................................................................................. 44,818 77,679 Dividends payable to parent............................................................................................................................ 60,978 59,598 Derivative instruments valuation — at market ..................................................................................................... 46,696 55,845 Current deferred income tax ........................................................................................................................... — 29,474 Accrued interest .......................................................................................................................................... 40,991 47,974 Other ........................................................................................................................................................ 70,266 65,343
Total current liabilities........................................................................................................................... 700,523 925,651 Deferred credits and other liabilities:
Deferred income taxes................................................................................................................................... 658,481 638,182 Deferred investment tax credits ....................................................................................................................... 68,938 70,955 Regulatory liabilities..................................................................................................................................... 600,368 511,100 Customers advances for construction ................................................................................................................ 205,419 191,800 Minimum pension liability ............................................................................................................................. 54,647 54,647 Derivative instruments valuation — at market ..................................................................................................... 135,426 142,557 Benefit obligations and other .......................................................................................................................... 110,185 87,567
Total deferred credits and other liabilities ................................................................................................... 1,833,464 1,696,808 Long-term debt ............................................................................................................................................. 2,310,890 2,311,434 Common stock — authorized 100 shares of $0.01 par value; outstanding 100 shares....................................................... — — Premium on common stock .............................................................................................................................. 1,847,825 1,797,780 Retained earnings .......................................................................................................................................... 381,867 421,614 Accumulated comprehensive loss....................................................................................................................... (80,100) (79,426)
Total common stockholder's equity................................................................................................................ 2,149,592 2,139,968 Commitments and contingencies (see Note 4)
Total liabilities and equity ........................................................................................................................... $ 6,994,469 $ 7,073,861
See disclosures regarding PSCo in the Notes to Consolidated Financial Statements
11
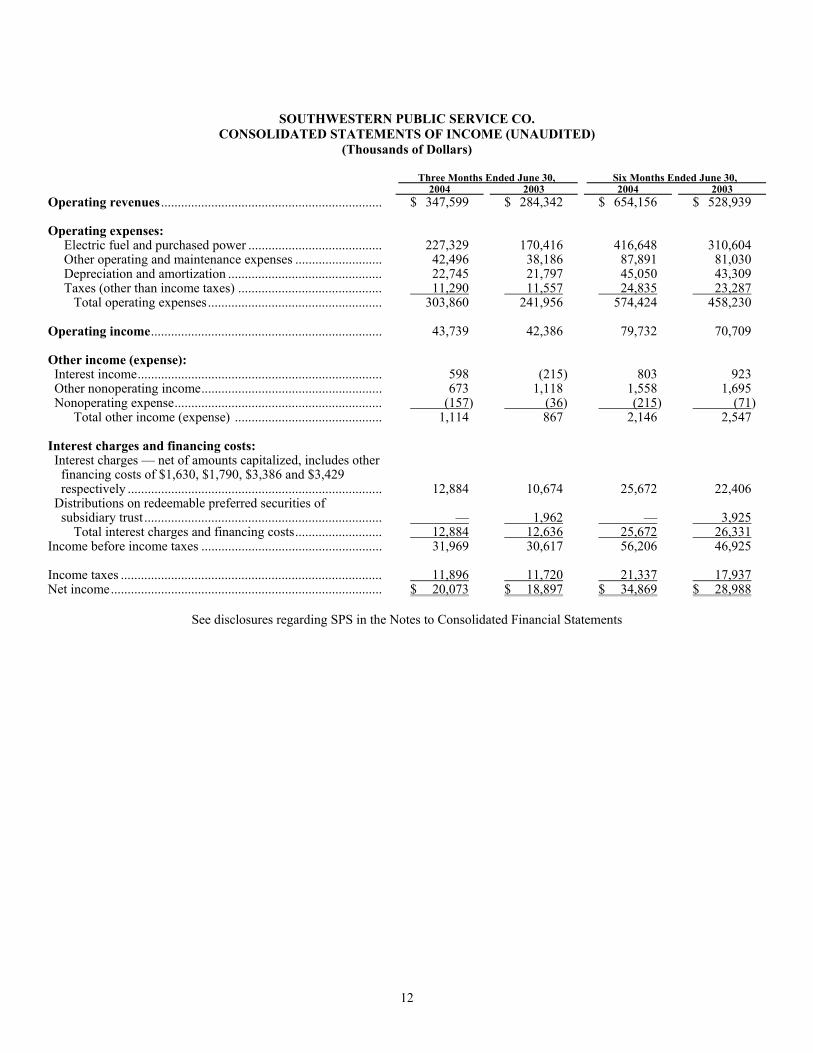
SOUTHWESTERN PUBLIC SERVICE CO.
CONSOLIDATED STATEMENTS OF INCOME (UNAUDITED) (Thousands of Dollars)
Three Months Ended June 30, Six Months Ended June 30,
2004 2003 2004 2003 Operating revenues .................................................................. $ 347,599 $ 284,342 $ 654,156 $ 528,939 Operating expenses:
Electric fuel and purchased power ........................................ 227,329 170,416 416,648 310,604 Other operating and maintenance expenses .......................... 42,496 38,186 87,891 81,030 Depreciation and amortization .............................................. 22,745 21,797 45,050 43,309 Taxes (other than income taxes) ........................................... 11,290 11,557 24,835 23,287
Total operating expenses.................................................... 303,860 241,956 574,424 458,230 Operating income..................................................................... 43,739 42,386 79,732 70,709 Other income (expense): Interest income......................................................................... 598 (215) 803 923 Other nonoperating income...................................................... 673 1,118 1,558 1,695 Nonoperating expense.............................................................. (157) (36) (215) (71)
Total other income (expense) ............................................ 1,114 867 2,146 2,547 Interest charges and financing costs: Interest charges — net of amounts capitalized, includes other
financing costs of $1,630, $1,790, $3,386 and $3,429 respectively ............................................................................ 12,884 10,674 25,672 22,406
Distributions on redeemable preferred securities of subsidiary trust ....................................................................... — 1,962 — 3,925
Total interest charges and financing costs.......................... 12,884 12,636 25,672 26,331 Income before income taxes ...................................................... 31,969 30,617 56,206 46,925 Income taxes .............................................................................. 11,896 11,720 21,337 17,937 Net income................................................................................. $ 20,073 $ 18,897 $ 34,869 $ 28,988
See disclosures regarding SPS in the Notes to Consolidated Financial Statements
12
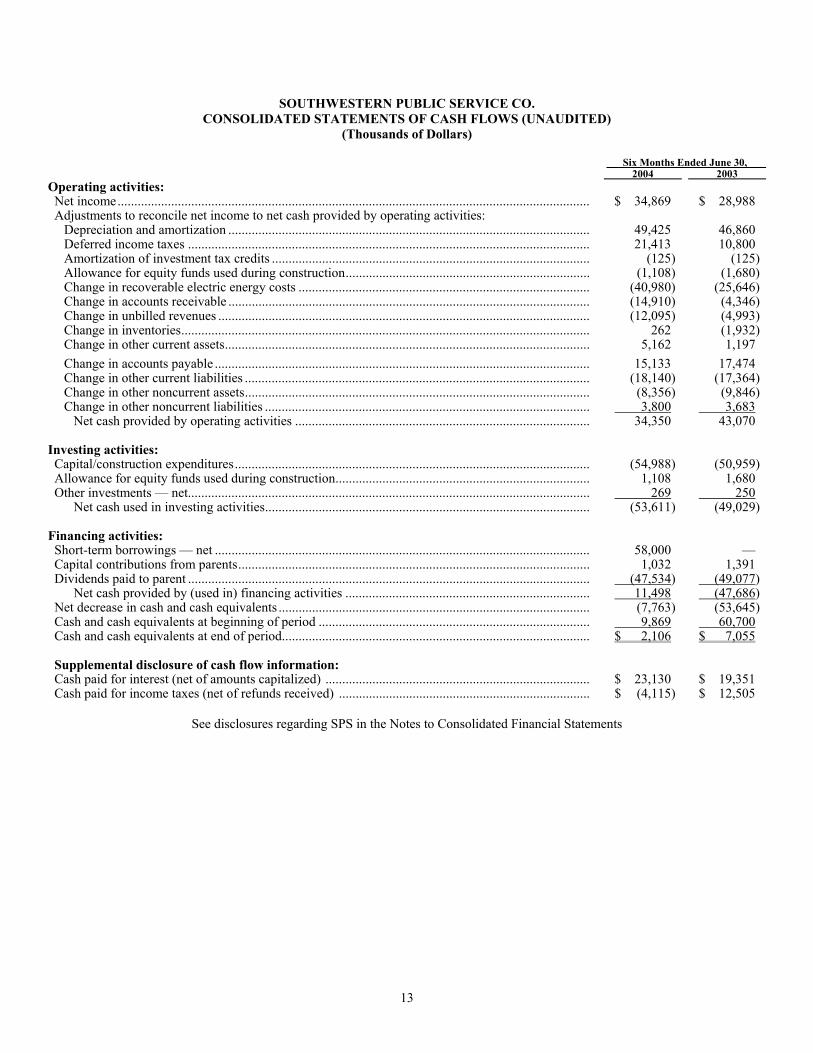
SOUTHWESTERN PUBLIC SERVICE CO. CONSOLIDATED STATEMENTS OF CASH FLOWS (UNAUDITED)
(Thousands of Dollars) Six Months Ended June 30,
2003 2004
Operating activities: Net income............................................................................................................................................. $ 34,869 $ 28,988 Adjustments to reconcile net income to net cash provided by operating activities:
Depreciation and amortization ............................................................................................................ 49,425 46,860 Deferred income taxes ........................................................................................................................ 21,413 10,800 Amortization of investment tax credits ............................................................................................... (125) (125) Allowance for equity funds used during construction......................................................................... (1,108) (1,680) Change in recoverable electric energy costs ....................................................................................... (40,980) (25,646) Change in accounts receivable ............................................................................................................ (14,910) (4,346) Change in unbilled revenues ............................................................................................................... (12,095) (4,993) Change in inventories.......................................................................................................................... 262 (1,932) Change in other current assets............................................................................................................. 5,162 1,197 Change in accounts payable ................................................................................................................ 15,133 17,474 Change in other current liabilities ....................................................................................................... (18,140) (17,364) Change in other noncurrent assets....................................................................................................... (8,356) (9,846) Change in other noncurrent liabilities ................................................................................................. 3,800 3,683
Net cash provided by operating activities ........................................................................................ 34,350 43,070 Investing activities: Capital/construction expenditures.......................................................................................................... (54,988) (50,959) Allowance for equity funds used during construction............................................................................ 1,108 1,680 Other investments — net........................................................................................................................ 269 250
Net cash used in investing activities................................................................................................. (53,611) (49,029) Financing activities: Short-term borrowings — net ................................................................................................................ 58,000 — Capital contributions from parents......................................................................................................... 1,032 1,391 Dividends paid to parent ........................................................................................................................ (47,534) (49,077)
Net cash provided by (used in) financing activities ......................................................................... 11,498 (47,686) Net decrease in cash and cash equivalents ............................................................................................. (7,763) (53,645) Cash and cash equivalents at beginning of period ................................................................................. 9,869 60,700 Cash and cash equivalents at end of period............................................................................................ $ 2,106 $ 7,055 Supplemental disclosure of cash flow information: Cash paid for interest (net of amounts capitalized) ............................................................................... $ 23,130 $ 19,351 Cash paid for income taxes (net of refunds received) ........................................................................... $ (4,115) $ 12,505
See disclosures regarding SPS in the Notes to Consolidated Financial Statements
13
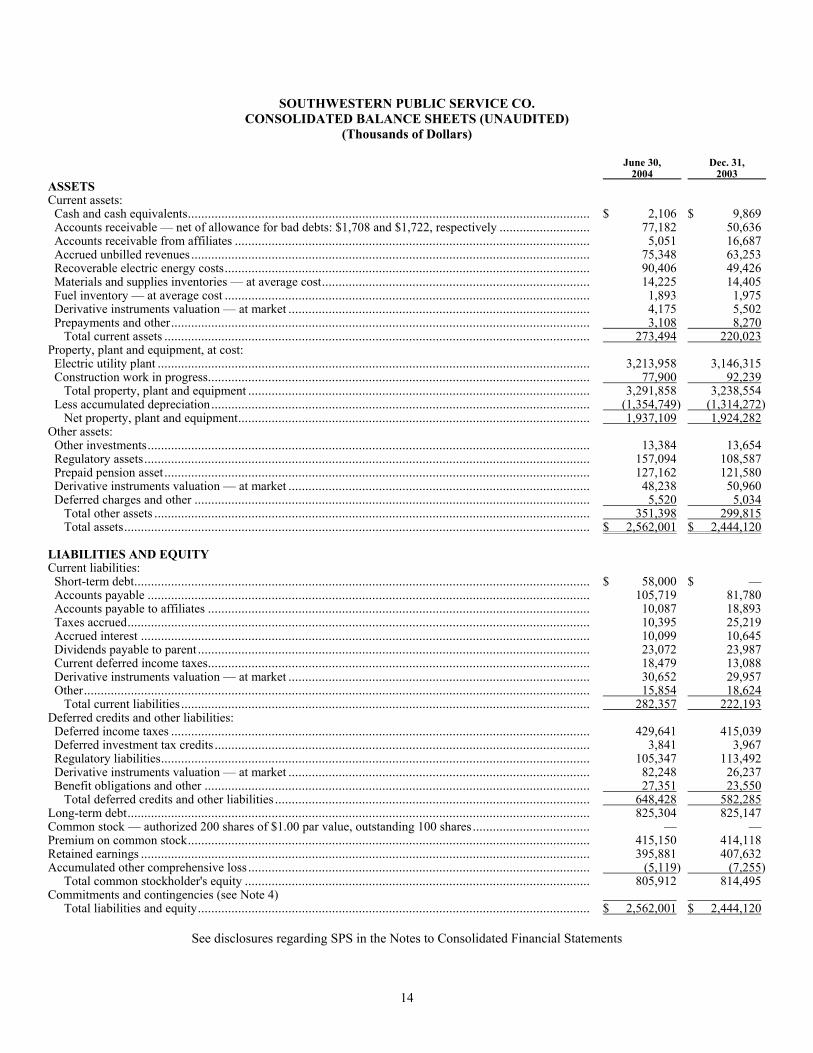
SOUTHWESTERN PUBLIC SERVICE CO. CONSOLIDATED BALANCE SHEETS (UNAUDITED)
(Thousands of Dollars)
June 30, 2004
Dec. 31, 2003
ASSETS Current assets:
Cash and cash equivalents........................................................................................................................ $ 2,106 $ 9,869 Accounts receivable — net of allowance for bad debts: $1,708 and $1,722, respectively ........................... 77,182 50,636 Accounts receivable from affiliates .......................................................................................................... 5,051 16,687 Accrued unbilled revenues....................................................................................................................... 75,348 63,253 Recoverable electric energy costs............................................................................................................. 90,406 49,426 Materials and supplies inventories — at average cost................................................................................ 14,225 14,405 Fuel inventory — at average cost ............................................................................................................. 1,893 1,975 Derivative instruments valuation — at market .......................................................................................... 4,175 5,502 Prepayments and other............................................................................................................................. 3,108 8,270
Total current assets ............................................................................................................................... 273,494 220,023 Property, plant and equipment, at cost:
Electric utility plant ................................................................................................................................. 3,213,958 3,146,315 Construction work in progress.................................................................................................................. 77,900 92,239
Total property, plant and equipment ...................................................................................................... 3,291,858 3,238,554 Less accumulated depreciation................................................................................................................. (1,354,749) (1,314,272)
Net property, plant and equipment......................................................................................................... 1,937,109 1,924,282 Other assets:
Other investments.................................................................................................................................... 13,384 13,654 Regulatory assets..................................................................................................................................... 157,094 108,587 Prepaid pension asset ............................................................................................................................... 127,162 121,580 Derivative instruments valuation — at market .......................................................................................... 48,238 50,960 Deferred charges and other ...................................................................................................................... 5,520 5,034
Total other assets .................................................................................................................................. 351,398 299,815 Total assets........................................................................................................................................... $ 2,562,001 $ 2,444,120
LIABILITIES AND EQUITY Current liabilities:
Short-term debt........................................................................................................................................ $ 58,000 $ — Accounts payable .................................................................................................................................... 105,719 81,780 Accounts payable to affiliates .................................................................................................................. 10,087 18,893 Taxes accrued.......................................................................................................................................... 10,395 25,219 Accrued interest ...................................................................................................................................... 10,099 10,645 Dividends payable to parent ..................................................................................................................... 23,072 23,987 Current deferred income taxes.................................................................................................................. 18,479 13,088 Derivative instruments valuation — at market .......................................................................................... 30,652 29,957 Other....................................................................................................................................................... 15,854 18,624
Total current liabilities.......................................................................................................................... 282,357 222,193 Deferred credits and other liabilities:
Deferred income taxes ............................................................................................................................. 429,641 415,039 Deferred investment tax credits ................................................................................................................ 3,841 3,967 Regulatory liabilities................................................................................................................................ 105,347 113,492 Derivative instruments valuation — at market .......................................................................................... 82,248 26,237 Benefit obligations and other ................................................................................................................... 27,351 23,550
Total deferred credits and other liabilities .............................................................................................. 648,428 582,285 Long-term debt.......................................................................................................................................... 825,304 825,147 Common stock — authorized 200 shares of $1.00 par value, outstanding 100 shares................................... — — Premium on common stock........................................................................................................................ 415,150 414,118 Retained earnings ...................................................................................................................................... 395,881 407,632 Accumulated other comprehensive loss...................................................................................................... (5,119) (7,255)
Total common stockholder's equity ....................................................................................................... 805,912 814,495 Commitments and contingencies (see Note 4)
Total liabilities and equity..................................................................................................................... $ 2,562,001 $ 2,444,120
See disclosures regarding SPS in the Notes to Consolidated Financial Statements
14
NOTES TO CONSOLIDATED FINANCIAL STATEMENTS
In the opinion of management, the accompanying unaudited consolidated and stand-alone financial statements contain all adjustments necessary to present fairly the financial position of Northern States Power Company, a Minnesota corporation (NSP-Minnesota), Northern States Power Company, a Wisconsin corporation (NSP-Wisconsin), Public Service Company of Colorado (PSCo) and Southwestern Public Service Company (SPS) and their respective subsidiaries (collectively, Utility Subsidiaries) as of June 30, 2004, and Dec. 31, 2003; the results of their operations for the three and six months ended June 30, 2004 and 2003; and their cash flows for the six months ended June 30, 2004 and 2003. Due to the seasonality of electric and natural gas sales of the Utility Subsidiaries, such interim results are not necessarily an appropriate base from which to project annual results. The accounting policies of NSP-Minnesota, NSP-Wisconsin, PSCo and SPS are set forth in Note 1 to their financial statements in their respective Annual Reports on Form 10-K for the year ended Dec. 31, 2003. The following notes should be read in conjunction with such policies and other disclosures in the Form 10-K's. 1. Accounting Policies (NSP-Minnesota, NSP-Wisconsin, PSCo and SPS) FASB Interpretation No. 46 (FIN No. 46) — On Jan. 1, 2004, the Utility Subsidiaries adopted FIN No. 46 as revised, which requires an enterprise's consolidated financial statements to include variable interest entities for which the enterprise is determined to be the primary beneficiary. Historically, consolidation has been required only for entities in which an enterprise has a majority voting or controlling interest. As a result, NSP-Wisconsin consolidated a portion of its affordable housing investments, which were previously accounted for under the equity method. The assets and liabilities consolidated were immaterial to NSP-Wisconsin. The Utility Subsidiaries evaluated various arrangements based on criteria in FIN No. 46. No other arrangements were determined to be material variable interests requiring disclosure or consolidation under FIN No. 46. Change in Accounting Principle — Inventory — Effective Jan. 1, 2004, PSCo changed its method of accounting for the cost of stored natural gas for its local distribution operations from the last-in-first-out (LIFO) pricing method to the average cost pricing method. This change in accounting was approved by the Colorado Public Utilities Commission (CPUC) and was accounted for as a cumulative effect in accordance with the CPUC authorization. The average cost method has historically been used for pricing stored natural gas by both NSP-Minnesota and NSP-Wisconsin, as well as by PSCo for natural gas stored for use in its electric utility operations. The cumulative effect of this change in accounting principle resulted in an increase to gas storage inventory and a corresponding decrease to the deferred gas cost accounts of approximately $36 million as of Jan. 1, 2004. Of this amount, $33 million related to current gas storage inventory and $3 million related to long-term gas storage inventory. As gas costs are 100 percent recoverable for PSCo's local gas distribution operations under PSCo's gas cost adjustment mechanism, the cumulative effect of this change had no impact on net income. Prior period financial statements were not restated since the CPUC authorized this change effective Jan. 1, 2004. Under the gas cost adjustment mechanism, the decrease in the cost of gas will reduce rates to retail gas customers in Colorado during 2004. 2. Regulation (NSP-Minnesota, NSP-Wisconsin, PSCo and SPS) Market Based Rate Authority Rule Proposal - On April 14, 2004, the Federal Energy Regulatory Commission (FERC) initiated a new proceeding on future market-based rates authorizations and issued interim requirements for FERC jurisdictional electric utilities that have been granted authority to make wholesale sales at market-based rates. NSP-Minnesota, NSP-Wisconsin, PSCo and SPS currently have wholesale market-based rate authorization from the FERC. The FERC adopted a new interim method to assess generation market power and modified measures to mitigate market power where it is found. The FERC recently upheld and clarified the interim requirements on rehearing in an order issued July 8, 2004. The assessments will be made of all initial market-based rate applications and triennial reviews on an interim basis. An assessment will be made of whether the utility is a pivotal supplier based on a control area's annual peak demand and whether it complies with market share requirements on a seasonal basis. If an applicant is determined to have generation market power, the applicant has the opportunity to propose its own mitigation plan or may implement default mitigation established by the FERC. The default mitigation limits prices for sales of power to cost-based rates within the areas where an applicant is found to have market power. Xcel Energy is reviewing the new interim requirements to determine what, if any, impact the new requirements will have on the wholesale market-based rate authority of the Utility Subsidiaries. Xcel Energy is required to file an updated market power analysis using the new interim market power screens on or before Feb. 7, 2005. As a related matter, in addition to the triennial update filing, PSCo and SPS were required by the FERC, in its orders addressing the merger to form
15
New Century Energies, Inc. in 1997, to file a supplemental market power analysis six months prior to the completion of the intertie transmission line between their systems to address the competitive impacts of that project. PSCo and SPS filed the required supplemental analysis on July 20, 2004. Department of Energy Blackout Report - On April 6, 2004, the U.S. Department of Energy issued its final report regarding the Aug. 14, 2003 electric blackout in the eastern United States, which did not affect the electric systems of the Utility Subsidiaries. The report recommends 46 specific changes to current statutes, rules or practices in order to improve the reliability of the infrastructure used to transmit electric power. The recommendations include the establishment of mandatory reliability standards and financial penalties for noncompliance. On April 14, 2004, FERC issued a policy statement requiring electric utilities, including the Utility Subsidiaries, to submit a report on vegetation management practices and indicating the FERC's intent to make North American Electric Reliability Council (NERC) reliability standards mandatory. The Utility Subsidiaries submitted the required report on their vegetation management practices to the FERC in June 2004. Implementation of the blackout report recommendations and the FERC policy statement could increase future transmission costs, but the extent of this effect cannot be determined at this time. Generation Interconnection Rules - On June 25, 2004, the FERC issued an order rejecting in part the April 2004 Utility Subsidiaries' compliance filing to FERC Order No. 2003-A, a FERC rule requiring all jurisdictional electric utilities to adopt uniform interconnection procedures and a standard form interconnection agreement for new generators of 20 megawatts or more. The Utility Subsidiaries had proposed very limited modifications to the pro forma procedure mandated by the FERC to facilitate compliance by PSCo with Colorado state least cost planning (LCP) rules, which require PSCo to analyze its loads and resource needs and select the least cost resource portfolio taking into account both generation and transmission costs. Xcel Energy argued the limited variations were necessary for PSCo to comply with both Order No. 2003-A and the Colorado LCP rules. The FERC accepted the portions of the compliance filing adopting the pro forma process and agreement, but rejected the variations as contrary to Order No. 2003-A. On July 26, 2004, the Utility Subsidiaries requested rehearing of the FERC order. The 2003 PSCo LCP proposal is pending before the CPUC and is expected to be supplemented to address the bid evaluation process. Midwest ISO Transmission and Energy Markets Tariff - On March 31, 2004, the Midwest Independent Transmission System Operator, Inc. (Midwest ISO) regional transmission organization filed its proposed transmission and energy markets tariff (TEMT), which would establish regional wholesale energy markets using locational marginal cost pricing and financial transmission rights. NSP-Minnesota and NSP-Wisconsin are Midwest ISO members, and their generation plants and transmission systems would operate subject to the tariff if it is approved by the FERC. The Midwest ISO originally proposed a Dec. 1, 2004 effective date. On May 26, 2004, the FERC issued an initial procedural order regarding the TEMT. The FERC found that certain pre-Order 888 "grandfathered" agreements (GFAs) for transmission service could negatively affect implementation of the TEMT, so FERC delayed the effective date of the energy market to March 1, 2005. FERC also set the issue of the GFAs for an expedited hearing process. NSP-Minnesota and NSP-Wisconsin submitted compliance filings regarding their approximately 50 GFAs on June 25, 2004. Approximately 10 GFAs were disputed, and hearings were held June 30, 2004 and July 1, 2004. The other GFAs are not disputed. The primary disputed issues related to responsibility for Midwest ISO TEMT charges that might be billed for loads served under the GFAs. Proposed findings of fact and legal memoranda were filed regarding the disputed GFAs on July 5, 2004. The Administrative Law Judges (ALJ) submitted their recommendations to the FERC on July 28, 2004, recommending that NSP-Minnesota and NSP-Wisconsin generally be found to be the entity financially responsible for TEMT costs for loads served under their GFAs. The ALJ order is subject to further FERC consideration, and Xcel Energy plans to contest the ALJ recommendation. FERC is expected to issue a final decision later in 2004. NSP-Minnesota and NSP-Wisconsin also submitted a request for rehearing of the May 26, 2004 order, alleging the expedited hearing process violates both the U.S. Constitution and the federal Administrative Procedure Act. Implementation of a wholesale regional market using the locational marginal cost pricing and financial transmission rights is expected to provide a benefit to NSP-Minnesota and NSP-Wisconsin through a reduction in overall power costs. However, NSP-Minnesota and NSP-Wisconsin oppose certain aspects of the TEMT as proposed, and believe the Midwest ISO should implement the new market mechanisms only after it demonstrates that it will protect reliability. NSP-Minnesota and NSP-Wisconsin cannot at this time estimate the total financial impact of the new market structure. Private Fuel Storage - NSP-Minnesota is part of a consortium of private parties working to establish a private facility for interim storage of spent nuclear fuel. In 1997, Private Fuel Storage, LLC filed a license application with the Nuclear Regulatory Commission (NRC) for a temporary storage site for spent nuclear fuel on the Skull Valley Indian Reservation in Utah. Most issues raised by opponents were favorably resolved or dismissed, however, the likelihood of certain aircraft crashes into the proposed facility was deemed sufficiently credible to be addressed. On May 11, 2004, the NRC issued a safety evaluation report documenting its evaluation of aircraft crash consequences on casks at the proposed private storage facility. The report concluded that an accidental aircraft or
16
ordnance impact at the proposed facility does not pose a credible hazard to public health and safety. The next step is the Atomic Safety and Licensing Board (ASLB) hearings scheduled to begin on August 9, 2004. If successful during these hearings, the ASLB could forward their recommendation in late 2004, and a license could be issued in early 2005. Minnesota Service Quality Investigation - On Nov. 14, 2003, NSP-Minnesota submitted a proposed service quality plan and an update regarding certain service quality settlement agreement provisions already implemented by NSP-Minnesota. Among other provisions, the proposed service quality plan contains underperformance payments for the failure to meet certain reliability and customer service metrics. On March 10, 2004, the Minnesota Public Utilities Commission (MPUC) issued an order approving the settlement, but modifying it to include an annual independent audit of NSP-Minnesota's service outage records and requiring additional under-performance payments for any future finding of inaccurate data by an independent auditor. Both state agencies and NSP-Minnesota have the option under the settlement to void the agreement in the event of a significant modification by the MPUC. On May 13, 2004, the MPUC declined to act on both NSP-Minnesota's Petition for Clarification of the MPUC's March 10th order and that of another party's Petition for Reconsideration. On June 2, 2004, NSP-Minnesota submitted a compliance tariff implementing the terms of the MPUC order, including modifications to the settlement. NSP-Minnesota indicated that, if approved by the MPUC, it would accept the terms of the order; if rejected or modified by the MPUC, it would reject the terms of the order. The MPUC is expected to consider this compliance filing later in 2004. NSP-Minnesota Combustion Turbine Proposal - In November 2003, NSP-Minnesota proposed investing approximately $164 million in generating capacity in Minnesota and South Dakota to ensure adequate electric capacity for its Upper Midwest customers. NSP-Minnesota has received all regulatory approvals for a $100-million project to add two combustion turbines at its Blue Lake peaking plant in Shakopee, Minn., and for a $64-million project to add one turbine at its Angus Anson peaking plant in Sioux Falls, S.D. Each of the three new turbines would be fired by natural gas and would have a summer capacity of approximately 160 megawatts. Currently, the Blue Lake plant has four units fired by oil and a net dependable capacity of 174 megawatts; the Angus Anson plant has two units that can be fired by either natural gas or oil and a net dependable capacity of 226 megawatts. As of June 30, 2004, all required state regulatory approvals for these projects have been received, including a certificate of need for the Blue Lake project from the MPUC, a site permit from the Minnesota Environmental Quality Board, air quality permits from the Minnesota Pollution Control Agency, the amended facility permit for the Anson project from the South Dakota Public Utilities Commission and air quality permits from the South Dakota Department of Environment and Natural Resources. Construction on the projects has begun. The projects also require approval by Midwest ISO with regard to interconnection and transmission service requests, which is pending. NRG Tax Complaint (NSP-Minnesota) - In November 2003, an NSP-Minnesota customer filed a complaint with the MPUC alleging that ratepayers are entitled to a share of the tax benefits attributable to NRG. The customer subsequently supplemented this complaint with sufficient signatures from customers to warrant a formal complaint process by the MPUC. NSP-Minnesota has responded to the complaint, arguing that the requested treatment is not allowed by law and is inconsistent with the MPUC's directives to ensure full separation of NSP-Minnesota and NRG. The Minnesota Department of Commerce has filed comments recommending denial of the complaint. The Office of the Attorney General indicated the MPUC should credit Minnesota ratepayers with that portion of the NSP-Minnesota rate that was allocated for tax payments, but never paid as such, applying the credit in a future rate proceeding. NSP-Minnesota is preparing a response against this recommendation. The MPUC is expected to consider this matter later this year. NSP-Wisconsin Fuel Cost Recovery Filing - On Aug. 2, 2004 NSP-Wisconsin filed an application with the Public Service Commission of Wisconsin (PSCW) to reopen its 2004 rate case for the limited purpose of resetting 2005 electric fuel monitoring costs, and to authorize an increase in Wisconsin retail electric rates to recover forecast increases in fuel and wholesale market purchased energy costs. In its application NSP-Wisconsin indicated an increase of $17.3 million is necessary to avoid under- recovering its 2005 fuel costs based on the most recent forecast. NSP-Wisconsin is requesting the PSCW approve new electric base rates effective Jan. 1, 2005. 2004 Fuel Cost Recovery- Potential Rate Reduction Proceeding - On Aug. 2, 2004 the PSCW issued an order to reopen NSP-Wisconsin's 2004 rate case. In its decision the PSCW ordered NSP-Wisconsin's current rates be made subject to refund pending a full review and final determination of the reasonableness of electric fuel costs. NSP-Wisconsin's actual 2004 fuel costs through June are 9 percent lower than the fuel costs that were authorized in NSP-Wisconsin's 2004 rate order and are being recovered in base rates. This is primarily due to lower customer load caused by abnormal weather and higher sale to other utilities. However, despite the year-to-date over-recovery, NSP-Wisconsin forecasts higher costs for the second half of the year, and expects to end the year within the 2 percent annual bandwidth allowed. Based on this data, NSP-Wisconsin expects to argue in the proceeding that a rate decrease is not
17
warranted. Should the PSCW find that a rate decrease is warranted, the refund would be limited to the net difference between current rates and final rates set by the PSCW, plus carrying costs, between now and the date final rates are set. PSCo Least-Cost Resource Plan - On April 30, 2004, PSCo filed its 2003 least-cost resource plan (LCP) with the CPUC. PSCo has identified that it needs to provide for 3,600 megawatts of capacity through 2013 to meet load growth and replace expiring contracts. The LCP identifies the resources necessary to meet PSCo's estimated load requirements. Of the amount needed, PSCo believes 2,000 megawatts will come from new resources, and 1,600 megawatts will come from entering new contracts with existing suppliers whose contracts expire during the resource acquisition period. As part of its resource plan, PSCo is seeking the waiver of certain CPUC rules, which would allow it to build a new 750 megawatt coal-fired unit at its existing Comanche power plant site located in Pueblo, Colorado. PSCo plans to own 500 megawatts of this new facility. Two of PSCo's wholesale customers have options to participate in the ownership of the remaining 250 megawatts, and PSCo is in discussions with them regarding the plant's development. On April 30, 2004, PSCo also filed an application requesting a certificate of public convenience and necessity for the new coal unit. PSCo also filed a separate application for a specific regulatory plan to address the impacts of purchased capacity contracts on its capital structure and to accelerate the recovery of the costs of financing the new power plant and related transmission prior to commercial operations. The CPUC has consolidated these three applications and has scheduled hearings in November 2004. A decision is expected in late 2004 or early 2005. The procedural schedule is as follows:
• PSCo Supplemental Direct Testimony................................ August 13 • Intervenor Answer Testimony............................................. September 13 • PSCo Rebuttal and Intervenor Answer Testimony ............. October 18 • Hearings .............................................................................. November 1 – 19 • Statements of Position......................................................... December 3 • Commission Decision ......................................................... December 15 – January 15
The CPUC is expected to decide in a separate docket PSCo's request for approval of a 500 megawatt renewable energy solicitation with a hearing scheduled for August 2004. PSCo Capacity Cost Adjustment - In October 2003, PSCo filed an application to recover incremental capacity costs through a purchased capacity cost adjustment (PCCA) rider. The PCCA will recover purchased capacity payments to power suppliers that are not included in the determination of PSCo's base electric rates determined in its 2002 general rate case or other recovery mechanisms. In May 2004, the CPUC granted the PSCo PCCA application, in part with new rates effective June 1, 2004. Primary provisions of the CPUC ruling include a capped PCCA recovery for the period June 1, 2004 through Dec. 31, 2006 at PSCo's current predicted capacity payments for a group of specific contracts, which will provide recovery of $20.4 million in 2004, $33.5 million in 2005 and $19.8 million in 2006. In addition, the CPUC excluded seven of the existing contracts from incremental recovery under the PCCA calculation. However, PSCo expects that the capacity costs from these contracts will be eligible for recovery through base rates when PSCo files its next general rate case. The energy costs from these contracts are eligible for recovery through the PSCo electric commodity adjustment clause. On July 16, 2004, PSCo filed an Application for Rehearing, Reargument and Reconsideration (ARRR) asking the CPUC to grant rehearing on its decision specifying that the PCCA recovery be limited to budget estimates of purchased capacity costs, instead asking for full recovery of actual purchased capacity payments. Second, the ARRR requests that the CPUC modify its decision to allow PSCo to reflect the relationship of the Air Quality Improvement Rider (AQIR) to the 2004 PCCA rider eliminating the actual amount of double recovery of purchased capacity expense that results from the interaction of PSCo's AQIR and the PCCA. The existing CPUC decision assumes a double recovery, which is $750,000 greater than the actual amount. PSCo Electric Department Earning Test Proceedings - As a part of PSCo's annual electric earnings test, the CPUC has opened a docket to consider whether PSCo's cost of debt has been adversely affected by the financial difficulties at NRG and, if so, whether any adjustments to PSCo's cost of capital are appropriate. In its earnings test for 2002, PSCo did not earn above its allowed authorized return on equity and, accordingly, has not recorded any refund obligations. There was no earnings test for 2003. On May 28, 2004, the CPUC staff and the Office of Consumer Counsel (OCC) filed testimony recommending the CPUC order the use of a pro forma regulatory adjustment to the cost of debt, on $600 million of debt issued by PSCo in September 2002, reducing the cost of debt in this and future proceedings. The CPUC staff recommendation would result in an exclusion of interest costs of $12 million
18
and the OCC recommendation would result in an exclusion of $17 million. PSCo does not anticipate its 2002 earnings will be above its allowed authorized return on equity with these recommended changes in the cost of debt. Hearings are scheduled in October 2004. PSCo Quality of Service Plan- The PSCo quality of service plan (QSP) provides for bill credits to Colorado retail customers, if PSCo does not achieve certain operational performance targets. During the second quarter of 2004, PSCo filed its calendar year 2003 operating performance results for electric service unavailability, phone response time, customer complaints, accurate meter reading and gas leak repair time measures. PSCo did not achieve the 2003 performance targets for the electric service unavailability measure or the customer complaint measure. Additionally, PSCo filed revisions to its previously filed 2002 electric QSP results for the service unavailability measure. Based on the revised results, PSCo did not achieve the 2002 performance targets for the electric service unavailability measure, creating a bill credit obligation for 2002 and increasing the maximum bill credit obligation for subsequent years' performance. As of Dec. 31, 2003, PSCo had accrued an aggregate estimated bill credit obligation of $6.4 million for the 2002 and 2003 calendar years. Based on the updated information and filings discussed above, during the second quarter of 2004, PSCo increased its estimated bill credit liability for these years to $13.4 million. The CPUC's final approval of the achieved performance measures for 2002 and 2003 is pending. For calendar year 2004, PSCo has evaluated its year to date performance under the QSP and has recorded an additional liability of $5.4 million for the six months ended June 30, 2004. Under the electric QSP, the estimated maximum potential bill credit obligation for calendar 2004 performance is approximately $15.2 million, assuming none of the performance targets are met. CPUC Reliability Inquiry (PSCo) - The CPUC staff and the Colorado OCC each submitted final reports to the CPUC based on the results of an informal investigation of the reliability of PSCo's electric distribution system. The staff report recommends that the CPUC review the existing QSP to ensure that the plan provides adequate incentives for PSCo to provide reliable electric service throughout its Colorado service territory. In addition, the staff recommends that the CPUC review the results of PSCo's 2004 action plan to address certain localized reliability problems that occurred in 2003. The OCC's consultant recommended that the CPUC initiate an independent performance assessment of PSCo's electric distribution system and related business practices. PSCo is preparing a response to the final reports of the staff and the OCC. The CPUC is expected to issue a final order regarding the reliability investigation within the next few months. PSCo Electric Trading Docket - As part of the settlement of the 2002 PSCo Colorado general rate case, the parties agreed that PSCo would initiate a docket regarding the status of electric trading after 2004. The proceeding was initiated on Jan. 30, 2004. PSCo's testimony proposed certain revisions to the business rules governing trading transactions; to continue electric trading on both a generation book and commodity book basis; to establish a defined trading benefit for electric retail customers and to begin trading natural gas as a risk mitigation measure in support of its electric trading. On July 8, 2004 the staff of the CPUC filed testimony regarding electric trading. The staff has raised issues related to the computer model used to allocate costs to trading transactions, PSCo's ability to track transactions individually, instead of in aggregate for each hour and the allocation of system costs. The staff requested additional reporting through 2006. The proceeding is scheduled to be completed by the end of 2004. SPS Texas Fuel Cost Recovery — Fuel and purchased energy costs are recovered in Texas through a fixed fuel and purchased energy recovery factor. In May 2004, SPS filed its periodic request for fuel and purchased power cost recovery for electric generation and fuel management activities for the period from January 2002 through December 2003. SPS requested to recover approximately $580 million of Texas-jurisdictional fuel and purchased power costs for the two-year period. The proceeding has been set for hearing in December 2004, and a decision regarding SPS fuel and purchased power costs incurred through December 2003 is expected in the second quarter of 2005. In November 2003, SPS submitted a fuel cost surcharge factor application in Texas to recover an additional $25 million of fuel cost under-recoveries accrued during June through September 2003. In February 2004, the parties in the proceeding submitted a unanimous settlement allowing SPS to collect net under-recoveries experienced through December 2003 of $22 million. The surcharge, which was approved by the Public Utility Commission of Texas (PUCT) in March 2004, went into effect May 2004 and will continue for 12 months. In May 2004, SPS filed another fuel cost surcharge factor application in Texas to recover an additional $32 million of fuel cost recoveries accrued during January through March 2004. In June 2004, the parties in the proceeding submitted a unanimous settlement allowing SPS to collect the $32 million fuel cost under-recoveries surcharge factors for a 12-month period beginning November 2004. The unanimous settlement is pending review and approval by the PUCT.
19
3. Tax Matters — Corporate-Owned Life Insurance (PSCo) PSCo's wholly owned subsidiary, PSR Investments, Inc. (PSRI), owns and manages permanent life insurance policies on some of PSCo's employees, known as corporate-owned life insurance (COLI). At various times, borrowings have been made against the cash values of these COLI policies and deductions taken on the interest expense on these borrowings. The IRS has challenged the deductibility of such interest expense deductions and has disallowed the deductions taken in tax years 1993 through 1999. After consultation with tax counsel, Xcel Energy contends that the IRS determination is not supported by relevant tax law. Based upon this assessment, management continues to believe that the tax deduction of interest expense on the COLI policy loans is in full compliance with the law. Accordingly, PSRI has not recorded any provision for income tax or related interest or penalties that may be imposed by the IRS and has continued to take deductions for interest expense related to policy loans on its income tax returns for subsequent years. In April 2004, Xcel Energy filed a lawsuit in U.S. District Court for the District of Minnesota against the IRS to establish its entitlement to deduct policy loan interest. The litigation could require several years to reach final resolution. Although the ultimate resolution of this matter is uncertain, it could have a material adverse effect on PSCo's financial position and results of operations. Defense of Xcel Energy's position may require significant cash outlays, which may or may not be recoverable in a court proceeding. The total disallowance of interest expense deductions for the period of 1993 through 1999, as proposed by the IRS, is approximately $279 million. Additional interest expense deductions for the period 2000 through 2003 are estimated to total approximately $300 million. Should the IRS ultimately prevail on this issue, tax and interest payable through Dec. 31, 2003, would reduce earnings by an estimated $254 million after tax. At June 30, 2004, PSCo estimates its annual earnings for 2004 would be reduced by an estimated $35 million, after tax, if COLI interest expense deductions were no longer available. 4. Commitments and Contingent Liabilities (NSP-Minnesota, NSP-Wisconsin, PSCo and SPS) Environmental Contingencies The Utility Subsidiaries have been or are currently involved with the cleanup of contamination from certain hazardous substances at several sites. In many situations, the Utility Subsidiaries are pursuing, or intend to pursue, insurance claims and believe they will recover some portion of these costs through such claims. Additionally, where applicable, the Utility Subsidiaries are pursuing, or intend to pursue, recovery from other potentially responsible parties and through the rate regulatory process. To the extent any costs are not recovered through the options listed above, the Utility Subsidiaries would be required to recognize an expense for such unrecoverable amounts in their financial statements. Carbon Dioxide Emissions Lawsuit - On July 21, 2004, the attorneys general of eight states and New York City, as well as several environmental groups, filed lawsuits in federal district court in New York against five utilities, including Xcel Energy, to force reductions in carbon dioxide (CO2) emissions. The other utilities include American Electric Power Co., Southern Co., Cinergy Corp. and Tennessee Valley Authority. CO2 is emitted whenever fossil fuel is combusted, such as in automobiles, industrial operations and coal- or gas-fired power plants. The lawsuits allege that CO2 emitted by each company is a public nuisance as defined under state and federal common law because it has contributed to global warming. The lawsuits do not demand monetary damages. Instead, the lawsuits ask the court to order each utility to cap and reduce its CO2 emissions. Xcel Energy is prepared to defend itself against the claims contained in the lawsuits. The ultimate financial impact of these lawsuits, if any, is not determinable at this time. Ashland Manufactured Gas Plant Site (NSP-Wisconsin) - On July 2, 2004, the Wisconsin Department of Natural Resources (WDNR) sent NSP-Wisconsin an invoice for recovery of expenses incurred at the Ashland site between 1994 and March 2003 in the amount of $1.4 million. Failure to pay the invoice may result in referral to the Wisconsin Department of Justice for suit. NSP-Wisconsin is reviewing the invoice to determine whether all costs charged are appropriate. All appropriate insurance carriers have been notified of the WDNR's invoice and will be invited to participate in any future efforts to address the WDNR's actions. All costs paid are expected to be recoverable in rates. Fort Collins Manufactured Gas Plant Site (PSCo) - Prior to 1926, Poudre Valley Gas Co., a predecessor of PSCo, operated a manufactured gas plant (MGP) in Fort Collins, Colo. not far from the Cache la Poudre River. In 1926, after acquiring the Poudre Valley Gas Co., PSCo shut down the gas site and, years later, sold most of the property. In the mid-1990s, contamination associated with MGP operations was discovered on the gas plant site, and PSCo paid for a portion of a partial cleanup. Recently, an oily substance similar to MGP by-products has been discovered in the Cache la Poudre River. PSCo is working with the Environmental
20
Protection Agency (EPA), the Colorado Department of Public Health and Environment, the current site owner and the City of Fort Collins (owner of a former landfill property between the river and the plant site) to address the substance found in the river as well as other environmental issues found on the property. In early 2004, PSCo completed implementation of a work plan to further investigate the sources of contamination of the river at a cost of approximately $1.4 million. The work resulted in removal of contaminated sediments and delineation of the extent of contamination. PSCo is currently in discussions with the EPA, the city of Fort Collins and other stakeholders regarding possible next steps. The EPA has agreed to allow PSCo to take the lead in development and evaluation of alternatives and ultimately the design of the selected alternative to address the remaining contamination in the river. This process is expected to proceed in consultation with the EPA and other stakeholders and to follow the EPA's national contingency plan. PSCo will likely perform future remediation work for which current cost estimates for the range of alternatives is approximately $7.5 million to $9 million. To date, PSCo has spent approximately $1.8 million on the project, including settlement costs negotiated with Fort Collins in 1998. The EPA has also conducted work over the past two years, incurring estimated costs of approximately $1 million to date, for which they will likely seek recovery from PSCo at a future date. While PSCo has recorded a liability of $7.6 million at June 30, 2004, it lacks sufficient information at this time to determine its ultimate liability for clean up, if different, for this site. PSCo has deferred the costs recorded to date and believes that they will be recovered through future rates. Any costs that are not recoverable from customers will be expensed. Federal Clean Water Act (NSP-Minnesota, NSP-Wisconsin, PSCo) - The Federal Clean Water Act addresses the environmental impacts of cooling water intakes. In July 2004, the EPA published phase II of the rule that applies to existing cooling water intakes at steam-electric power plants. The rule will require NSP-Minnesota, NSP-Wisconsin and PSCo to perform additional environmental studies at 12 power plants in Minnesota, Wisconsin and Colorado to determine the impact the facilities may be having on aquatic organisms vulnerable to impingement or entrainment. If the studies determine the plants are not meeting the new performance standards established by the phase II rule, physical and/or operational changes may be required at these facilities. It is not possible to provide an accurate estimate of the overall cost of this rulemaking at this time due to the many uncertainties involved. Preliminary cost estimates range from less than $1 million at some facilities to more than $10 million at others depending on site-specific circumstances. Based on the limited information available, total cost to NSP-Minnesota, NSP-Wisconsin and PSCo are estimated to be approximately $44 million, $15 million and $5 million, respectively. Actual costs may be significantly higher or lower depending on issues such as the resolution of outstanding third-party legal challenges to the rule. French Island (NSP-Wisconsin) - The French Island plant is required to conduct annual emissions performance tests to meet federal requirements for large municipal waste combustors. In April 2004, the annual test on one boiler was completed. In June 2004, NSP-Wisconsin received the test results, which indicated that all parameters tested, with the exception of hydrochloric acid (HCl), were below allowable levels. NSP-Wisconsin retested the unit later in June 2004 and found results that suggested that chemical interference of ammonium chloride may have caused an inaccurate result during the April test. Based on the results of the retesting, NSP-Wisconsin believes there is strong evidence to indicate the plant never exceeded the HCl limit. Under the terms of a consent decree between NSP-Wisconsin and the EPA, a failure to meet specified emission limits, including HCl, allows the EPA to pursue penalties. NSP-Wisconsin is unsure of future EPA action or penalty assessment, but pursuant to the consent order, any penalty is unlikely to exceed $300,000. Legal Contingencies Lawsuits and claims arise in the normal course of business. Management, after consultation with legal counsel, has recorded an estimate of the probable cost of settlement or other disposition of them. The ultimate outcome of these matters cannot presently be determined. Accordingly, the ultimate resolution of these matters could have a material adverse effect on Xcel Energy's financial position and results of operations. Nuclear Waste Disposal Litigation (NSP-Minnesota) - The federal government has the responsibility to dispose of, or permanently store, domestic spent nuclear fuel and other high-level radioactive substances. The Nuclear Waste Policy Act requires the Department of Energy (DOE) to implement a program for nuclear substance management. This includes the siting, licensing, construction and operation of a repository for domestically produced spent nuclear fuel from civilian nuclear power reactors and other high-level radioactive substances at a permanent storage or disposal facility. The federal government has designated the site as Yucca Mountain in Nevada. This designation has resulted in extensive litigation. On July 9, 2004, the federal Court of Appeals for the District of Columbia issued its decision in consolidated cases challenging regulations and decisions on the federal nuclear waste program. The Court of Appeals rejected challenges by the state of Nevada and other intervenors with respect to the majority of the licensing regulations of the NRC, the congressional resolution selecting Yucca
21

Mountain as the site of the permanent repository, and the DOE and presidential actions leading to the selection of Yucca Mountain. The Court of Appeals vacated the 10,000 year compliance period adopted by EPA regulations governing spent nuclear fuel disposal and incorporated in the NRC regulations governing Yucca Mountain licensing. NSP-Minnesota has not ascertained the impact of the decision on its nuclear operations and storage of spent nuclear fuel; however, the decision may result in additional delay and uncertainty around disposal of spent nuclear fuel. Colorado Wildfires (PSCo) - In late October 2003, there were two wildfires in Colorado, one in Boulder County and the other in Douglas County. There was no loss of life, but there was property damage associated with these fires. Parties have asserted that trees falling into PSCo distribution lines may have caused one or both fires. Litigation was filed on Jan. 14, 2004 relating to the fire in Bolder County, in Boulder County District Court. There are now 46 plaintiffs, including individuals and insurance companies, and three co-defendants, including PSCo. The plaintiffs assert that they are seeking in excess of $35 million in damages. PSCo believes it has insurance coverage to mitigate the liability in this matter. The ultimate financial impact to PSCo is not determinable at this time. Other Contingencies NSP-Minnesota Natural Gas Customer Billing Errors - In July 2004, NSP-Minnesota made a filing with the MPUC that identified a number of natural gas customers in Minnesota and North Dakota that were over billed because of an incorrect setting on a wireless meter reading device installed on customer meters beginning in late 1998. The incorrect setting occurred when the wireless devices were attached to older meters, allowing them to be read remotely. Based on analyses of past meter purchases and associated serial numbers, NSP-Minnesota believes the error may have affected approximately 3,200 older residential natural gas meters, but is still determining the number of potential additional residential and commercial natural gas customers that may also be affected. Of the field verifications completed to date, NSP-Minnesota has determined that approximately 12 percent of the devices were incorrectly set. While the problem resulted in some customers being charged for half of their natural gas usage, the verifications made to date indicate that the majority of those who received incorrect bills were charged for twice their actual natural gas usage. NSP-Minnesota is continuing to test meters and will make refunds, if overcharging is found. The number of customers affected and the total amount of refunds will not be known until NSP-Minnesota completes such testing, which is expected to be completed in August 2004. As of June 30, 2004, NSP-Minnesota had accrued $2.4 million based on information currently available. At this time, NSP-Minnesota is not aware of what action its state regulators may take relating to this matter. NMPRC Billing Practices Investigation (SPS) - Beginning in April 2003, SPS estimated electricity usage for approximately 9,500 customers in two New Mexico cities. Estimated bills were sent to these customers for between two and five months. On Sept. 25, 2003, the New Mexico Public Regulation Commission (NMPRC) entered an order opening an investigation into SPS' practices regarding estimated billing. The commission ordered SPS to show cause why it is not in violation of the commission rule that limits the use of estimated meter readings. SPS agreed the estimated bills were in violation of the NMPRC's regulations. On July 20, 2004, a hearing on the investigation was held and the hearing examiner announced the adoption of the recommendation that SPS report its compliance on meter reading performance and estimated billing practices for a period of three years. The hearing examiner found that SPS is currently in compliance with the NMPRC's order to show cause and the NMPRC's meter reading and billing regulations. The hearing examiner also recommended that the staff's proposed $50,000 penalty be suspended for the three-year period and waived after three years based on SPS compliance during this period. The hearing examiner's findings and recommendations are pending the NMPRC's review and adoption, which is expected in September 2004. Other Contingencies - The circumstances set forth in Notes 13 and 14 to the financial statements in NSP-Minnesota's, NSP-Wisconsin's, PSCo's and SPS' Annual Reports on Form 10-K for the year ended Dec. 31, 2003 and Note 3 to this Quarterly Report on Form 10-Q, appropriately represent, in all material respects, the current status of their respective commitments and contingent liabilities, including those regarding public liability for claims resulting from any nuclear incident and are incorporated herein by reference.
22
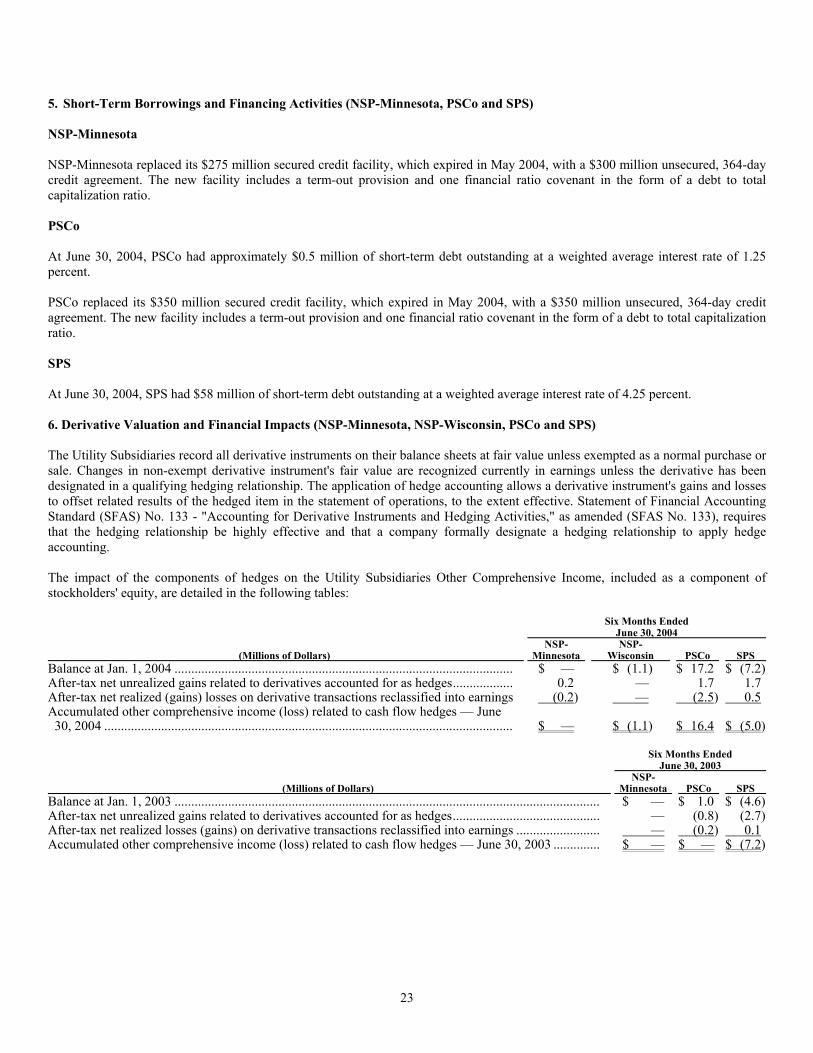
5. Short-Term Borrowings and Financing Activities (NSP-Minnesota, PSCo and SPS) NSP-Minnesota NSP-Minnesota replaced its $275 million secured credit facility, which expired in May 2004, with a $300 million unsecured, 364-day credit agreement. The new facility includes a term-out provision and one financial ratio covenant in the form of a debt to total capitalization ratio. PSCo At June 30, 2004, PSCo had approximately $0.5 million of short-term debt outstanding at a weighted average interest rate of 1.25 percent. PSCo replaced its $350 million secured credit facility, which expired in May 2004, with a $350 million unsecured, 364-day credit agreement. The new facility includes a term-out provision and one financial ratio covenant in the form of a debt to total capitalization ratio. SPS At June 30, 2004, SPS had $58 million of short-term debt outstanding at a weighted average interest rate of 4.25 percent. 6. Derivative Valuation and Financial Impacts (NSP-Minnesota, NSP-Wisconsin, PSCo and SPS) The Utility Subsidiaries record all derivative instruments on their balance sheets at fair value unless exempted as a normal purchase or sale. Changes in non-exempt derivative instrument's fair value are recognized currently in earnings unless the derivative has been designated in a qualifying hedging relationship. The application of hedge accounting allows a derivative instrument's gains and losses to offset related results of the hedged item in the statement of operations, to the extent effective. Statement of Financial Accounting Standard (SFAS) No. 133 - "Accounting for Derivative Instruments and Hedging Activities," as amended (SFAS No. 133), requires that the hedging relationship be highly effective and that a company formally designate a hedging relationship to apply hedge accounting. The impact of the components of hedges on the Utility Subsidiaries Other Comprehensive Income, included as a component of stockholders' equity, are detailed in the following tables: Six Months Ended
June 30, 2004 (Millions of Dollars)
NSP- Minnesota
NSP- Wisconsin
PSCo
SPS
Balance at Jan. 1, 2004 ..................................................................................................... $ — $ (1.1) $ 17.2 $ (7.2)After-tax net unrealized gains related to derivatives accounted for as hedges.................. 0.2 — 1.7 1.7 After-tax net realized (gains) losses on derivative transactions reclassified into earnings (0.2) — (2.5) 0.5 Accumulated other comprehensive income (loss) related to cash flow hedges — June
30, 2004 .......................................................................................................................... $ — $ (1.1) $ 16.4 $ (5.0) Six Months Ended
June 30, 2003 (Millions of Dollars)
NSP- Minnesota
PSCo
SPS
Balance at Jan. 1, 2003 ............................................................................................................................... $ — $ 1.0 $ (4.6)After-tax net unrealized gains related to derivatives accounted for as hedges............................................ — (0.8) (2.7)After-tax net realized losses (gains) on derivative transactions reclassified into earnings ......................... — (0.2) 0.1 Accumulated other comprehensive income (loss) related to cash flow hedges — June 30, 2003 .............. $ — $ — $ (7.2)
23
Cash Flow Hedges NSP-Minnesota and PSCo enter into derivative instruments to manage variability of future cash flows from changes in commodity prices and interest rates. These derivative instruments are designated as cash flow hedges for accounting purposes, and the changes in the fair value of these instruments are recorded as a component of Other Comprehensive Income. At June 30, 2004, NSP-Minnesota and PSCo had various commodity-related contracts designated as cash flow hedges extending through 2009. The fair value of these cash flow hedges is recorded in either Other Comprehensive Income or deferred as a regulatory asset or liability. This classification is based on the regulatory recovery mechanisms in place. Amounts deferred in these accounts are recorded in earnings as the hedged purchase or sales transaction is settled. This could include the physical purchase or sale of electric energy, the use of natural gas to generate electric energy or gas purchased for resale. As of June 30, 2004, NSP-Minnesota and PSCo had no amounts accumulated in Other Comprehensive Income related to commodity cash flow hedge contracts that are expected to be recognized during the next 12 months as the hedged transactions settle. However, due to the volatility of commodities markets, the value in Other Comprehensive Income will likely change prior to its recognition in earnings. NSP-Wisconsin, PSCo and SPS enter into various instruments that effectively fix the interest payments on certain floating rate debt obligations or effectively fix the yield or price on a specified benchmark interest rate for a specific period. These derivative instruments are designated as cash flow hedges for accounting purposes, and the change in the fair value of these instruments is recorded as a component of Other Comprehensive Income. As of June 30, 2004, NSP-Wisconsin had net losses of $0.1 million, PSCo had net gains of $1.5 million and SPS had net losses of $0.8 million, respectively, accumulated in Other Comprehensive Income related to interest rate cash flow hedge contracts that are expected to be recognized in earnings during the next 12 months. Gains or losses on hedging transactions for the sales of electric energy are recorded as a component of revenue, hedging transactions for fuel used in energy generation are recorded as a component of fuel costs, hedging transactions for gas purchased for resale are recorded as a component of gas costs and interest rate hedging transactions are recorded as a component of interest expense. Certain Xcel Energy Utility Subsidiaries are allowed to recover in electric or gas rates the costs of certain financial instruments purchased to reduce commodity cost volatility, as discussed in Note 12 to the consolidated financial statements reported in the Utility Subsidiaries' Annual Reports on Form 10-K for the year ended Dec. 31, 2003. There was no hedge ineffectiveness in the second quarter of 2004. Derivatives Not Qualifying for Hedge Accounting NSP-Minnesota and PSCo have trading operations that enter into derivative instruments. These derivative instruments are accounted for on a mark-to-market basis in their respective Consolidated Statements of Income. The results of these transactions are recorded as a component of Operating Revenues on the Consolidated Statements of Income. PSCo also enters into certain commodity-based transactions, not included in trading operations, which do not qualify for hedge accounting treatment. These derivative instruments are accounted for on a mark-to-market basis in the Consolidated Statement of Income. The results of these transactions are recorded within Operating Expenses on the Consolidated Statement of Income. Normal Purchases or Normal Sales Contracts The Utility Subsidiaries enter into contracts for the purchase and sale of various commodities for use in their business operations. SFAS No. 133 requires a company to evaluate these contracts to determine whether the contracts are derivatives. Certain contracts that literally meet the definition of a derivative may be exempted from SFAS No. 133 as normal purchases or normal sales. Normal purchases and normal sales are contracts that provide for the purchase or sale of something other than a financial instrument that will be delivered in quantities expected to be used or sold over a reasonable period in the normal course of business. Contracts that meet the requirements of normal are documented as normal and exempted from the accounting and reporting requirements of SFAS No. 133. The Utility Subsidiaries evaluate all of their contracts when such contracts are entered to determine if they are derivatives and, if so, if they qualify and meet the normal designation requirements under SFAS No. 133. None of the contracts entered into within the trading operations qualify for a normal designation. Normal purchases and normal sales contracts are accounted for as executory contracts as required under other generally accepted accounting principles.
24
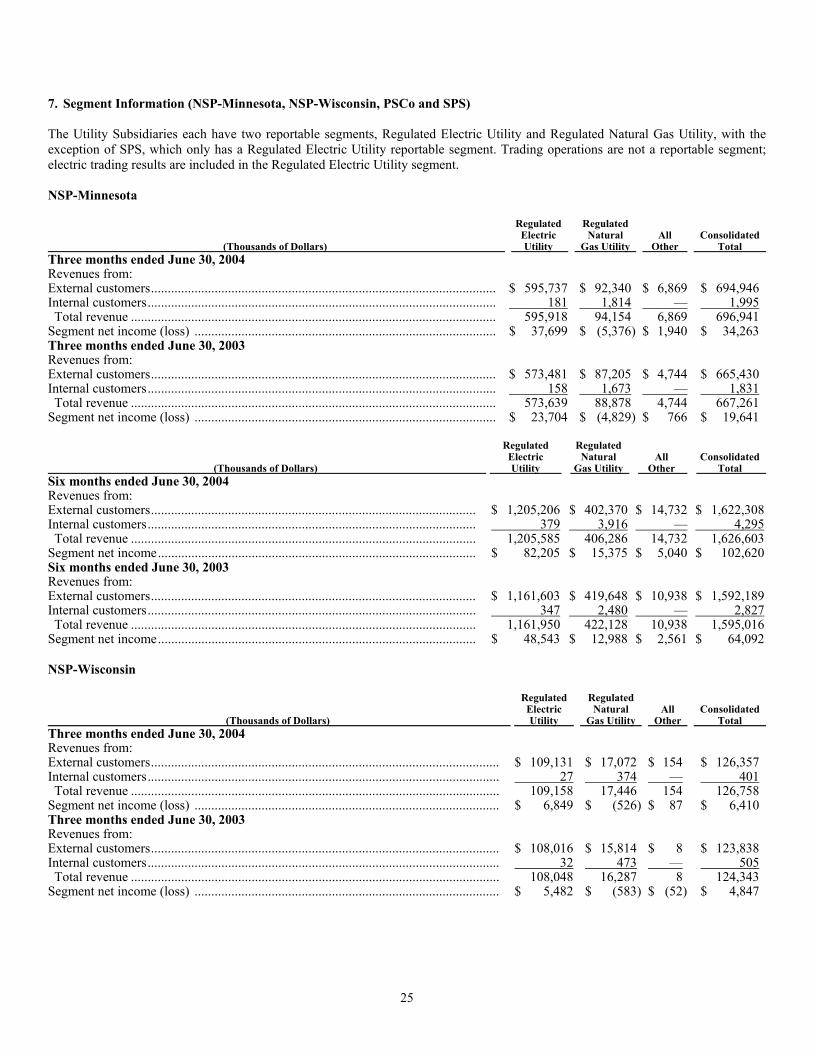
7. Segment Information (NSP-Minnesota, NSP-Wisconsin, PSCo and SPS) The Utility Subsidiaries each have two reportable segments, Regulated Electric Utility and Regulated Natural Gas Utility, with the exception of SPS, which only has a Regulated Electric Utility reportable segment. Trading operations are not a reportable segment; electric trading results are included in the Regulated Electric Utility segment. NSP-Minnesota (Thousands of Dollars)
Regulated Electric Utility
Regulated Natural Gas Utility
All Other
Consolidated Total
Three months ended June 30, 2004 Revenues from: External customers....................................................................................................... $ 595,737 $ 92,340 $ 6,869 $ 694,946 Internal customers........................................................................................................ 181 1,814 — 1,995 Total revenue ............................................................................................................. 595,918 94,154 6,869 696,941
Segment net income (loss) .......................................................................................... $ 37,699 $ (5,376) $ 1,940 $ 34,263 Three months ended June 30, 2003 Revenues from: External customers....................................................................................................... $ 573,481 $ 87,205 $ 4,744 $ 665,430 Internal customers........................................................................................................ 158 1,673 — 1,831 Total revenue ............................................................................................................. 573,639 88,878 4,744 667,261
Segment net income (loss) .......................................................................................... $ 23,704 $ (4,829) $ 766 $ 19,641 (Thousands of Dollars)
Regulated Electric Utility
Regulated Natural Gas Utility
All Other
Consolidated Total
Six months ended June 30, 2004 Revenues from: External customers................................................................................................. $ 1,205,206 $ 402,370 $ 14,732 $ 1,622,308Internal customers.................................................................................................. 379 3,916 — 4,295Total revenue ....................................................................................................... 1,205,585 406,286 14,732 1,626,603
Segment net income............................................................................................... $ 82,205 $ 15,375 $ 5,040 $ 102,620Six months ended June 30, 2003 Revenues from: External customers................................................................................................. $ 1,161,603 $ 419,648 $ 10,938 $ 1,592,189Internal customers.................................................................................................. 347 2,480 — 2,827Total revenue ....................................................................................................... 1,161,950 422,128 10,938 1,595,016
Segment net income............................................................................................... $ 48,543 $ 12,988 $ 2,561 $ 64,092 NSP-Wisconsin (Thousands of Dollars)
Regulated Electric Utility
Regulated Natural Gas Utility
All Other
Consolidated Total
Three months ended June 30, 2004 Revenues from: External customers........................................................................................................ $ 109,131 $ 17,072 $ 154 $ 126,357 Internal customers......................................................................................................... 27 374 — 401 Total revenue .............................................................................................................. 109,158 17,446 154 126,758
Segment net income (loss) ........................................................................................... $ 6,849 $ (526) $ 87 $ 6,410 Three months ended June 30, 2003 Revenues from: External customers........................................................................................................ $ 108,016 $ 15,814 $ 8 $ 123,838 Internal customers......................................................................................................... 32 473 — 505 Total revenue .............................................................................................................. 108,048 16,287 8 124,343
Segment net income (loss) ........................................................................................... $ 5,482 $ (583) $ (52) $ 4,847
25
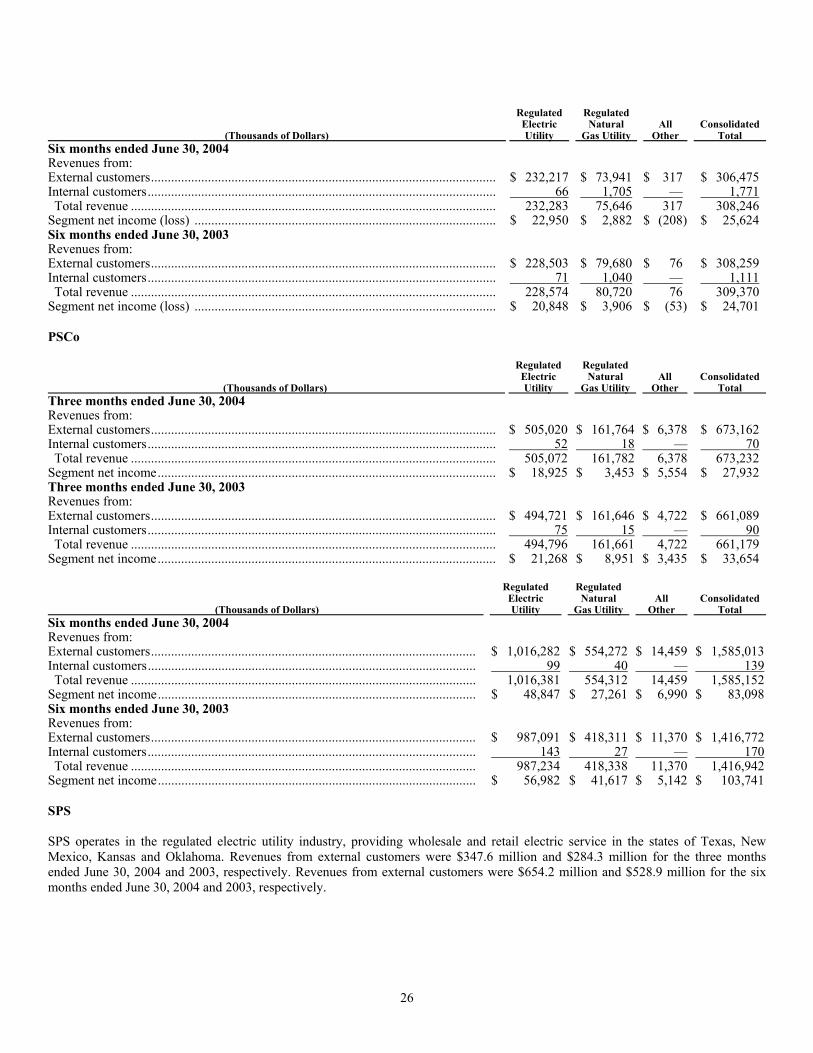
(Thousands of Dollars)
Regulated Electric Utility
Regulated Natural Gas Utility
All Other
Consolidated Total
Six months ended June 30, 2004 Revenues from: External customers....................................................................................................... $ 232,217 $ 73,941 $ 317 $ 306,475 Internal customers........................................................................................................ 66 1,705 — 1,771 Total revenue ............................................................................................................. 232,283 75,646 317 308,246
Segment net income (loss) .......................................................................................... $ 22,950 $ 2,882 $ (208) $ 25,624 Six months ended June 30, 2003 Revenues from: External customers....................................................................................................... $ 228,503 $ 79,680 $ 76 $ 308,259 Internal customers........................................................................................................ 71 1,040 — 1,111 Total revenue ............................................................................................................. 228,574 80,720 76 309,370
Segment net income (loss) .......................................................................................... $ 20,848 $ 3,906 $ (53) $ 24,701 PSCo (Thousands of Dollars)
Regulated Electric Utility
Regulated Natural Gas Utility
All Other
Consolidated Total
Three months ended June 30, 2004 Revenues from: External customers....................................................................................................... $ 505,020 $ 161,764 $ 6,378 $ 673,162 Internal customers........................................................................................................ 52 18 — 70 Total revenue ............................................................................................................. 505,072 161,782 6,378 673,232
Segment net income..................................................................................................... $ 18,925 $ 3,453 $ 5,554 $ 27,932 Three months ended June 30, 2003 Revenues from: External customers....................................................................................................... $ 494,721 $ 161,646 $ 4,722 $ 661,089 Internal customers........................................................................................................ 75 15 — 90 Total revenue ............................................................................................................. 494,796 161,661 4,722 661,179
Segment net income..................................................................................................... $ 21,268 $ 8,951 $ 3,435 $ 33,654 (Thousands of Dollars)
Regulated Electric Utility
Regulated Natural Gas Utility
All Other
Consolidated Total
Six months ended June 30, 2004 Revenues from: External customers................................................................................................. $ 1,016,282 $ 554,272 $ 14,459 $ 1,585,013Internal customers.................................................................................................. 99 40 — 139Total revenue ....................................................................................................... 1,016,381 554,312 14,459 1,585,152
Segment net income............................................................................................... $ 48,847 $ 27,261 $ 6,990 $ 83,098Six months ended June 30, 2003 Revenues from: External customers................................................................................................. $ 987,091 $ 418,311 $ 11,370 $ 1,416,772Internal customers.................................................................................................. 143 27 — 170Total revenue ....................................................................................................... 987,234 418,338 11,370 1,416,942
Segment net income............................................................................................... $ 56,982 $ 41,617 $ 5,142 $ 103,741 SPS SPS operates in the regulated electric utility industry, providing wholesale and retail electric service in the states of Texas, New Mexico, Kansas and Oklahoma. Revenues from external customers were $347.6 million and $284.3 million for the three months ended June 30, 2004 and 2003, respectively. Revenues from external customers were $654.2 million and $528.9 million for the six months ended June 30, 2004 and 2003, respectively.
26
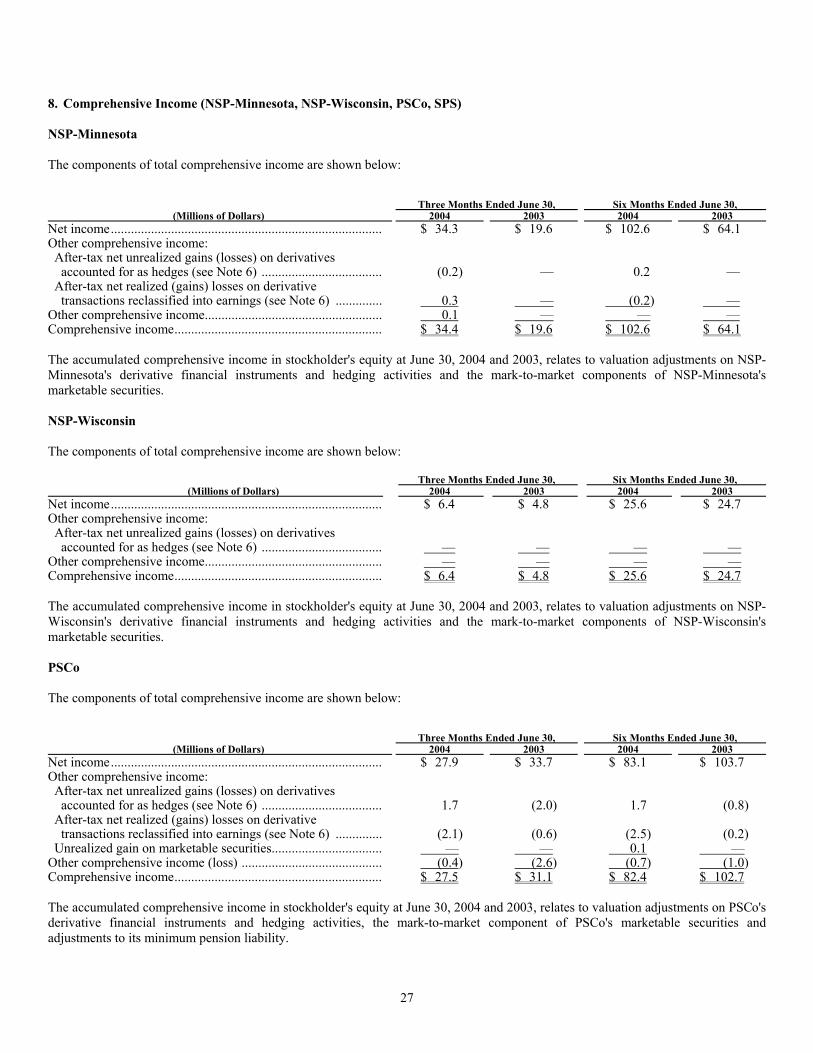
8. Comprehensive Income (NSP-Minnesota, NSP-Wisconsin, PSCo, SPS) NSP-Minnesota The components of total comprehensive income are shown below:
Three Months Ended June 30,
Six Months Ended June 30,
(Millions of Dollars) 2004 2003 2004 2003 Net income................................................................................. $ 34.3 $ 19.6 $ 102.6 $ 64.1 Other comprehensive income: After-tax net unrealized gains (losses) on derivatives
accounted for as hedges (see Note 6) .................................... (0.2) — 0.2 — After-tax net realized (gains) losses on derivative
transactions reclassified into earnings (see Note 6) .............. 0.3 — (0.2) — Other comprehensive income..................................................... 0.1 — — — Comprehensive income.............................................................. $ 34.4 $ 19.6 $ 102.6 $ 64.1 The accumulated comprehensive income in stockholder's equity at June 30, 2004 and 2003, relates to valuation adjustments on NSP-Minnesota's derivative financial instruments and hedging activities and the mark-to-market components of NSP-Minnesota's marketable securities. NSP-Wisconsin The components of total comprehensive income are shown below: Three Months Ended June 30, Six Months Ended June 30,
(Millions of Dollars) 2004 2003 2004 2003 Net income................................................................................. $ 6.4 $ 4.8 $ 25.6 $ 24.7 Other comprehensive income: After-tax net unrealized gains (losses) on derivatives
accounted for as hedges (see Note 6) .................................... — — — — Other comprehensive income..................................................... — — — — Comprehensive income.............................................................. $ 6.4 $ 4.8 $ 25.6 $ 24.7 The accumulated comprehensive income in stockholder's equity at June 30, 2004 and 2003, relates to valuation adjustments on NSP-Wisconsin's derivative financial instruments and hedging activities and the mark-to-market components of NSP-Wisconsin's marketable securities. PSCo The components of total comprehensive income are shown below:
Three Months Ended June 30,
Six Months Ended June 30,
(Millions of Dollars) 2004 2003 2004 2003 Net income................................................................................. $ 27.9 $ 33.7 $ 83.1 $ 103.7 Other comprehensive income: After-tax net unrealized gains (losses) on derivatives
accounted for as hedges (see Note 6) .................................... 1.7 (2.0) 1.7 (0.8) After-tax net realized (gains) losses on derivative
transactions reclassified into earnings (see Note 6) .............. (2.1) (0.6) (2.5) (0.2) Unrealized gain on marketable securities................................. — — 0.1 —
Other comprehensive income (loss) .......................................... (0.4) (2.6) (0.7) (1.0) Comprehensive income.............................................................. $ 27.5 $ 31.1 $ 82.4 $ 102.7 The accumulated comprehensive income in stockholder's equity at June 30, 2004 and 2003, relates to valuation adjustments on PSCo's derivative financial instruments and hedging activities, the mark-to-market component of PSCo's marketable securities and adjustments to its minimum pension liability.
27
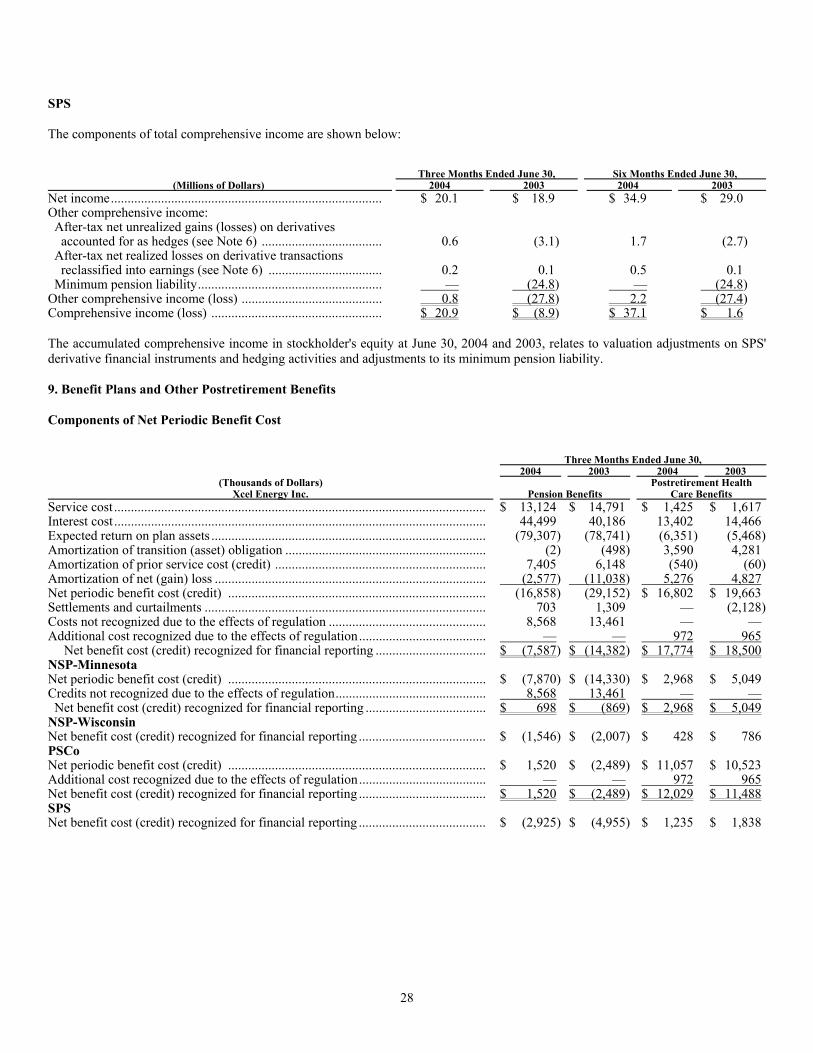
SPS The components of total comprehensive income are shown below:
Three Months Ended June 30,
Six Months Ended June 30,
(Millions of Dollars) 2004 2003 2004 2003 Net income................................................................................. $ 20.1 $ 18.9 $ 34.9 $ 29.0 Other comprehensive income: After-tax net unrealized gains (losses) on derivatives
accounted for as hedges (see Note 6) .................................... 0.6 (3.1) 1.7 (2.7) After-tax net realized losses on derivative transactions
reclassified into earnings (see Note 6) .................................. 0.2 0.1 0.5 0.1 Minimum pension liability....................................................... — (24.8) — (24.8)
Other comprehensive income (loss) .......................................... 0.8 (27.8) 2.2 (27.4) Comprehensive income (loss) ................................................... $ 20.9 $ (8.9) $ 37.1 $ 1.6 The accumulated comprehensive income in stockholder's equity at June 30, 2004 and 2003, relates to valuation adjustments on SPS' derivative financial instruments and hedging activities and adjustments to its minimum pension liability. 9. Benefit Plans and Other Postretirement Benefits Components of Net Periodic Benefit Cost
Three Months Ended June 30,
2004 2003 2004 2003 (Thousands of Dollars)
Xcel Energy Inc. Pension Benefits
Postretirement Health Care Benefits
Service cost ............................................................................................................... $ 13,124 $ 14,791 $ 1,425 $ 1,617 Interest cost ............................................................................................................... 44,499 40,186 13,402 14,466 Expected return on plan assets .................................................................................. (79,307) (78,741) (6,351) (5,468)Amortization of transition (asset) obligation ............................................................ (2) (498) 3,590 4,281 Amortization of prior service cost (credit) ............................................................... 7,405 6,148 (540) (60)Amortization of net (gain) loss ................................................................................. (2,577) (11,038) 5,276 4,827 Net periodic benefit cost (credit) ............................................................................. (16,858) (29,152) $ 16,802 $ 19,663 Settlements and curtailments .................................................................................... 703 1,309 — (2,128)Costs not recognized due to the effects of regulation ............................................... 8,568 13,461 — — Additional cost recognized due to the effects of regulation...................................... — — 972 965
Net benefit cost (credit) recognized for financial reporting ................................. $ (7,587) $ (14,382) $ 17,774 $ 18,500 NSP-Minnesota Net periodic benefit cost (credit) ............................................................................. $ (7,870) $ (14,330) $ 2,968 $ 5,049 Credits not recognized due to the effects of regulation............................................. 8,568 13,461 — — Net benefit cost (credit) recognized for financial reporting .................................... $ 698 $ (869) $ 2,968 $ 5,049
NSP-Wisconsin Net benefit cost (credit) recognized for financial reporting ...................................... $ (1,546) $ (2,007) $ 428 $ 786 PSCo Net periodic benefit cost (credit) ............................................................................. $ 1,520 $ (2,489) $ 11,057 $ 10,523 Additional cost recognized due to the effects of regulation...................................... — — 972 965 Net benefit cost (credit) recognized for financial reporting ...................................... $ 1,520 $ (2,489) $ 12,029 $ 11,488 SPS Net benefit cost (credit) recognized for financial reporting ...................................... $ (2,925) $ (4,955) $ 1,235 $ 1,838
28
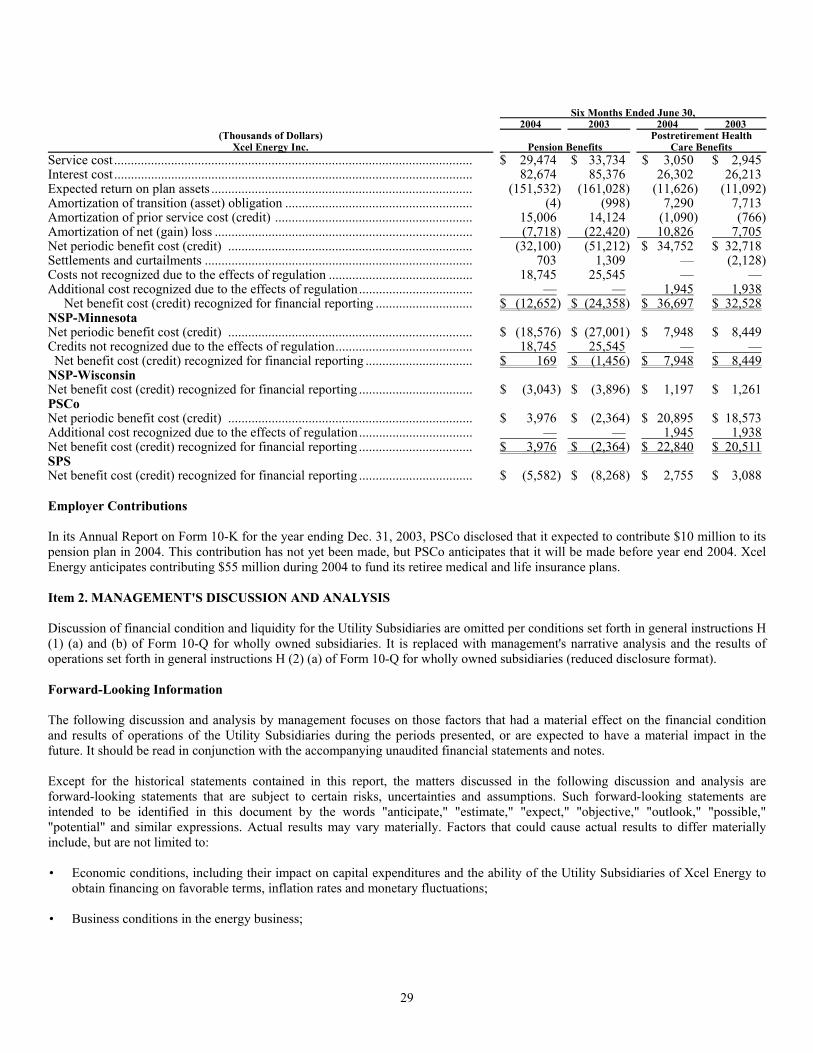
Six Months Ended June 30,
2004 2003 2004 2003 (Thousands of Dollars)
Xcel Energy Inc. Pension Benefits
Postretirement Health Care Benefits
Service cost ........................................................................................................... $ 29,474 $ 33,734 $ 3,050 $ 2,945 Interest cost ........................................................................................................... 82,674 85,376 26,302 26,213 Expected return on plan assets .............................................................................. (151,532) (161,028) (11,626) (11,092)Amortization of transition (asset) obligation ........................................................ (4) (998) 7,290 7,713 Amortization of prior service cost (credit) ........................................................... 15,006 14,124 (1,090) (766)Amortization of net (gain) loss ............................................................................. (7,718) (22,420) 10,826 7,705 Net periodic benefit cost (credit) ......................................................................... (32,100) (51,212) $ 34,752 $ 32,718 Settlements and curtailments ................................................................................ 703 1,309 — (2,128)Costs not recognized due to the effects of regulation ........................................... 18,745 25,545 — — Additional cost recognized due to the effects of regulation.................................. — — 1,945 1,938
Net benefit cost (credit) recognized for financial reporting ............................. $ (12,652) $ (24,358) $ 36,697 $ 32,528 NSP-Minnesota Net periodic benefit cost (credit) ......................................................................... $ (18,576) $ (27,001) $ 7,948 $ 8,449 Credits not recognized due to the effects of regulation......................................... 18,745 25,545 — — Net benefit cost (credit) recognized for financial reporting ................................ $ 169 $ (1,456) $ 7,948 $ 8,449
NSP-Wisconsin Net benefit cost (credit) recognized for financial reporting .................................. $ (3,043) $ (3,896) $ 1,197 $ 1,261 PSCo Net periodic benefit cost (credit) ......................................................................... $ 3,976 $ (2,364) $ 20,895 $ 18,573 Additional cost recognized due to the effects of regulation.................................. — — 1,945 1,938 Net benefit cost (credit) recognized for financial reporting .................................. $ 3,976 $ (2,364) $ 22,840 $ 20,511 SPS Net benefit cost (credit) recognized for financial reporting .................................. $ (5,582) $ (8,268) $ 2,755 $ 3,088 Employer Contributions In its Annual Report on Form 10-K for the year ending Dec. 31, 2003, PSCo disclosed that it expected to contribute $10 million to its pension plan in 2004. This contribution has not yet been made, but PSCo anticipates that it will be made before year end 2004. Xcel Energy anticipates contributing $55 million during 2004 to fund its retiree medical and life insurance plans. Item 2. MANAGEMENT'S DISCUSSION AND ANALYSIS Discussion of financial condition and liquidity for the Utility Subsidiaries are omitted per conditions set forth in general instructions H (1) (a) and (b) of Form 10-Q for wholly owned subsidiaries. It is replaced with management's narrative analysis and the results of operations set forth in general instructions H (2) (a) of Form 10-Q for wholly owned subsidiaries (reduced disclosure format). Forward-Looking Information The following discussion and analysis by management focuses on those factors that had a material effect on the financial condition and results of operations of the Utility Subsidiaries during the periods presented, or are expected to have a material impact in the future. It should be read in conjunction with the accompanying unaudited financial statements and notes. Except for the historical statements contained in this report, the matters discussed in the following discussion and analysis are forward-looking statements that are subject to certain risks, uncertainties and assumptions. Such forward-looking statements are intended to be identified in this document by the words "anticipate," "estimate," "expect," "objective," "outlook," "possible," "potential" and similar expressions. Actual results may vary materially. Factors that could cause actual results to differ materially include, but are not limited to: • Economic conditions, including their impact on capital expenditures and the ability of the Utility Subsidiaries of Xcel Energy to
obtain financing on favorable terms, inflation rates and monetary fluctuations; • Business conditions in the energy business;
29
• Trade, monetary, fiscal, taxation and environmental policies of governments, agencies and similar organizations in geographic areas where the Utility Subsidiaries of Xcel Energy have a financial interest;
• Customer business conditions, including demand for their products or services and supply of labor and materials used in creating
their products and services; • Financial or regulatory accounting principles or policies imposed by the Financial Accounting Standards Board, the SEC, the
Federal Energy Regulatory Commission and similar entities with regulatory oversight; • Availability or cost of capital such as changes in: interest rates; market perceptions of the utility industry, Xcel Energy or any of
its subsidiaries; or security ratings; • Factors affecting utility and nonutility operations such as unusual weather conditions; catastrophic weather-related damage;
unscheduled generation outages, maintenance or repairs; unanticipated changes to fossil fuel, nuclear fuel or gas supply costs or availability due to higher demand, shortages, transportation problems or other developments; nuclear or environmental incidents; or electric transmission or gas pipeline constraints;
• Employee workforce factors, including loss or retirement of key executives, collective bargaining agreements with union
employees, or work stoppages; • Increased competition in the utility industry or additional competition in the markets served by the Utility Subsidiaries; • State, federal and foreign legislative and regulatory initiatives that affect cost and investment recovery, have an impact on rates
structures and affect the speed and degree to which competition enters the electric and gas markets; industry restructuring initiatives; transmission system operation and/or administration initiatives; recovery of investments made under traditional regulation; nature of competitors entering the industry; retail wheeling; a new pricing structure; and former customers entering the generation market;
• Rate-setting policies or procedures of regulatory entities, including environmental externalities, which are values established by
regulators assigning environmental costs to each method of electricity generation when evaluating generation resource options; • Nuclear regulatory policies and procedures, including operating regulations and spent nuclear fuel storage; • Social attitudes regarding the utility and power industries; • Risks associated with the California power market; • Cost and other effects of legal and administrative proceedings, settlements, investigations and claims; • Technological developments that result in competitive disadvantages and create the potential for impairment of existing assets; • Significant slowdown in growth or decline in the U.S. economy, delay in growth or recovery of the U.S. economy or increased
cost for insurance premiums, security and other items as a consequence of the Sept. 11, 2001 terrorist attacks; • Risks associated with implementations of new technologies; and • Other business or investment considerations that may be disclosed from time to time in the Utility Subsidiaries of Xcel Energy's
SEC filings or in other publicly disseminated written documents. Market Risks The Utility Subsidiaries are exposed to market risks, including changes in commodity prices and interest rates, as disclosed in Management's Discussion and Analysis in their annual reports on Form 10-K for the year ended Dec. 31, 2003. Commodity price and interest rate risks for the Utility Subsidiaries are mitigated in most jurisdictions due to cost-based rate regulation. At June 30, 2004, there were no material changes to the financial market risks that affect the quantitative and qualitative disclosures presented as of Dec. 31, 2003.
30
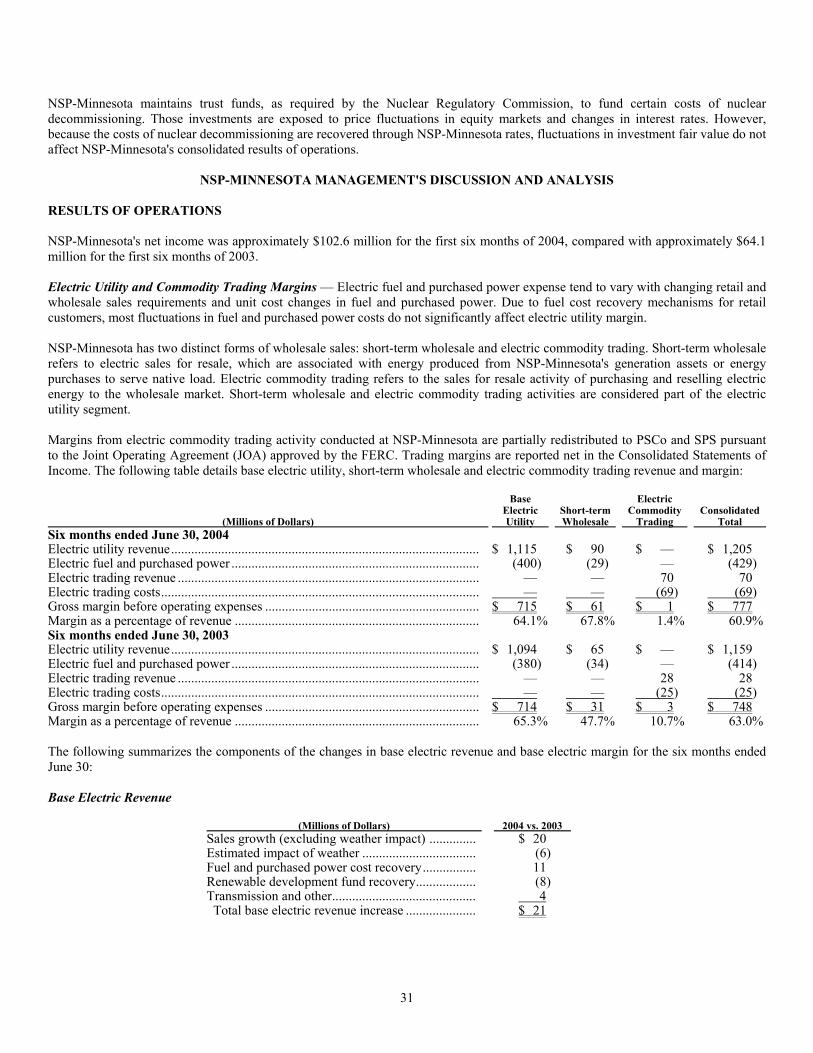
NSP-Minnesota maintains trust funds, as required by the Nuclear Regulatory Commission, to fund certain costs of nuclear decommissioning. Those investments are exposed to price fluctuations in equity markets and changes in interest rates. However, because the costs of nuclear decommissioning are recovered through NSP-Minnesota rates, fluctuations in investment fair value do not affect NSP-Minnesota's consolidated results of operations.
NSP-MINNESOTA MANAGEMENT'S DISCUSSION AND ANALYSIS RESULTS OF OPERATIONS NSP-Minnesota's net income was approximately $102.6 million for the first six months of 2004, compared with approximately $64.1 million for the first six months of 2003. Electric Utility and Commodity Trading Margins — Electric fuel and purchased power expense tend to vary with changing retail and wholesale sales requirements and unit cost changes in fuel and purchased power. Due to fuel cost recovery mechanisms for retail customers, most fluctuations in fuel and purchased power costs do not significantly affect electric utility margin. NSP-Minnesota has two distinct forms of wholesale sales: short-term wholesale and electric commodity trading. Short-term wholesale refers to electric sales for resale, which are associated with energy produced from NSP-Minnesota's generation assets or energy purchases to serve native load. Electric commodity trading refers to the sales for resale activity of purchasing and reselling electric energy to the wholesale market. Short-term wholesale and electric commodity trading activities are considered part of the electric utility segment. Margins from electric commodity trading activity conducted at NSP-Minnesota are partially redistributed to PSCo and SPS pursuant to the Joint Operating Agreement (JOA) approved by the FERC. Trading margins are reported net in the Consolidated Statements of Income. The following table details base electric utility, short-term wholesale and electric commodity trading revenue and margin: (Millions of Dollars)
Base Electric Utility
Short-term Wholesale
Electric Commodity Trading
Consolidated Total
Six months ended June 30, 2004 Electric utility revenue............................................................................................ $ 1,115 $ 90 $ — $ 1,205 Electric fuel and purchased power .......................................................................... (400) (29) — (429) Electric trading revenue .......................................................................................... — — 70 70 Electric trading costs............................................................................................... — — (69) (69) Gross margin before operating expenses ................................................................ $ 715 $ 61 $ 1 $ 777 Margin as a percentage of revenue ......................................................................... 64.1% 67.8% 1.4% 60.9%Six months ended June 30, 2003 Electric utility revenue............................................................................................ $ 1,094 $ 65 $ — $ 1,159 Electric fuel and purchased power .......................................................................... (380) (34) — (414) Electric trading revenue .......................................................................................... — — 28 28 Electric trading costs............................................................................................... — — (25) (25) Gross margin before operating expenses ................................................................ $ 714 $ 31 $ 3 $ 748 Margin as a percentage of revenue ......................................................................... 65.3% 47.7% 10.7% 63.0% The following summarizes the components of the changes in base electric revenue and base electric margin for the six months ended June 30: Base Electric Revenue
(Millions of Dollars) 2004 vs. 2003 Sales growth (excluding weather impact) .............. $ 20 Estimated impact of weather .................................. (6) Fuel and purchased power cost recovery................ 11 Renewable development fund recovery.................. (8) Transmission and other........................................... 4 Total base electric revenue increase ..................... $ 21
31
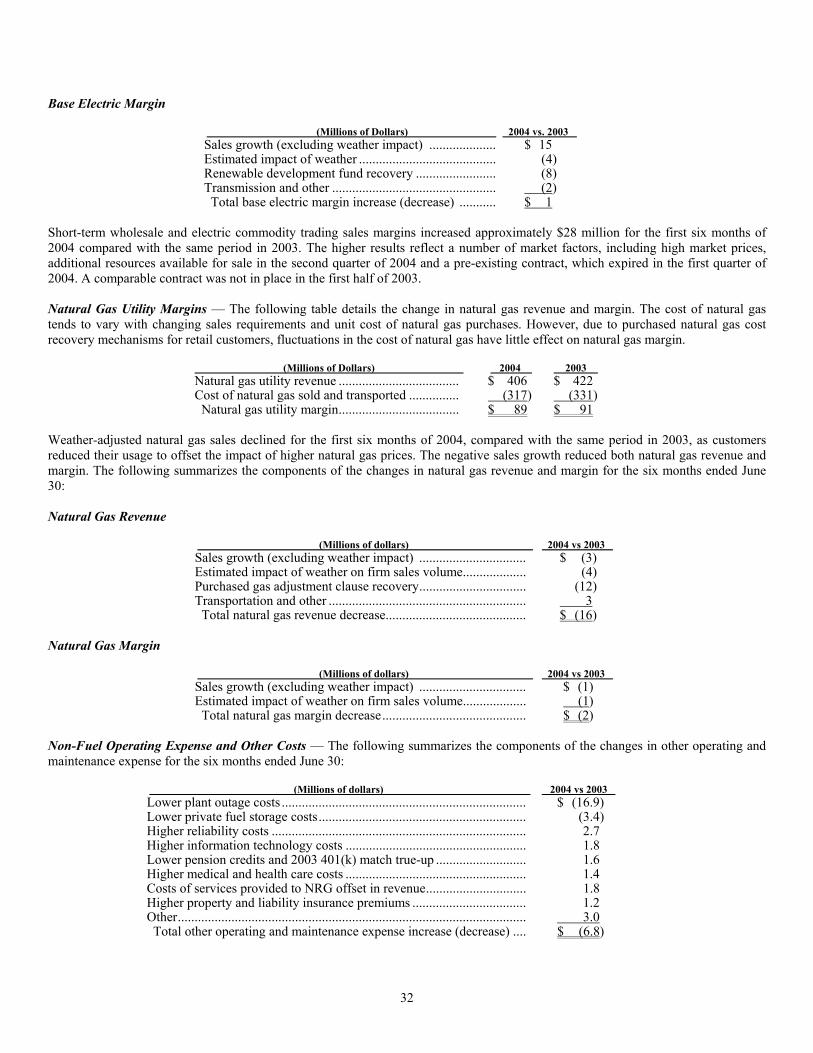
Base Electric Margin
(Millions of Dollars) 2004 vs. 2003 Sales growth (excluding weather impact) .................... $ 15 Estimated impact of weather ......................................... (4) Renewable development fund recovery ........................ (8) Transmission and other ................................................. (2) Total base electric margin increase (decrease) ........... $ 1
Short-term wholesale and electric commodity trading sales margins increased approximately $28 million for the first six months of 2004 compared with the same period in 2003. The higher results reflect a number of market factors, including high market prices, additional resources available for sale in the second quarter of 2004 and a pre-existing contract, which expired in the first quarter of 2004. A comparable contract was not in place in the first half of 2003. Natural Gas Utility Margins — The following table details the change in natural gas revenue and margin. The cost of natural gas tends to vary with changing sales requirements and unit cost of natural gas purchases. However, due to purchased natural gas cost recovery mechanisms for retail customers, fluctuations in the cost of natural gas have little effect on natural gas margin.
(Millions of Dollars) 2004 2003 Natural gas utility revenue .................................... $ 406 $ 422 Cost of natural gas sold and transported ............... (317) (331) Natural gas utility margin.................................... $ 89 $ 91
Weather-adjusted natural gas sales declined for the first six months of 2004, compared with the same period in 2003, as customers reduced their usage to offset the impact of higher natural gas prices. The negative sales growth reduced both natural gas revenue and margin. The following summarizes the components of the changes in natural gas revenue and margin for the six months ended June 30: Natural Gas Revenue
(Millions of dollars) 2004 vs 2003 Sales growth (excluding weather impact) ................................ $ (3) Estimated impact of weather on firm sales volume................... (4) Purchased gas adjustment clause recovery................................ (12) Transportation and other ........................................................... 3 Total natural gas revenue decrease.......................................... $ (16)
Natural Gas Margin
(Millions of dollars) 2004 vs 2003 Sales growth (excluding weather impact) ................................ $ (1) Estimated impact of weather on firm sales volume................... (1) Total natural gas margin decrease........................................... $ (2)
Non-Fuel Operating Expense and Other Costs — The following summarizes the components of the changes in other operating and maintenance expense for the six months ended June 30:
(Millions of dollars) 2004 vs 2003 Lower plant outage costs ......................................................................... $ (16.9) Lower private fuel storage costs.............................................................. (3.4) Higher reliability costs ............................................................................ 2.7 Higher information technology costs ...................................................... 1.8 Lower pension credits and 2003 401(k) match true-up ........................... 1.6 Higher medical and health care costs ...................................................... 1.4 Costs of services provided to NRG offset in revenue.............................. 1.8 Higher property and liability insurance premiums .................................. 1.2 Other........................................................................................................ 3.0 Total other operating and maintenance expense increase (decrease) .... $ (6.8)
32

Depreciation and amortization expense decreased by approximately $26.2 million, or 13.7 percent, for the first six months of 2004, compared with the first six months of 2003. During 2003, the Minnesota legislature authorized additional spent nuclear fuel storage at the Prairie Island nuclear plant. In December 2003, the MPUC extended the authorized useful lives of the two generating units at the Prairie Island nuclear plant until 2013 and 2014, respectively, retroactive to Jan. 1, 2003. Annual depreciation expense for 2004 is expected to be approximately $18 million lower than 2003, due to a change in the decommissioning accruals resulting from a related order. The year-to-date reduction in depreciation and amortization reflects the impact on 2004 of the Prairie Island life extension. In addition, renewable development fund amortization decreased $10 million, primarily due to a June 2003 payment. These costs are largely recovered through the NSP-Minnesota's state fuel clause recovery mechanism. Interest charges and financing costs decreased by approximately $4.4 million, or 6.3 percent, for the first six months of 2004, compared with the first six months of 2003. The decrease is due to the issuance of debt during 2003 to refinance higher coupon debt, including the redemption of the preferred securities of NSP-Minnesota's subsidiary trust. Income tax expense increased by approximately $28.0 million for the first six months of 2004, compared with the first six months of 2003. The increase is primarily due to higher pretax income in 2004. The effective tax rate for NSP-Minnesota was 33.2 percent in the first six months of 2004 and 26.3 percent in 2003. The year to date June 30, 2004 effective rate is higher than in 2003 due to adjustments recorded in 2003 relating to state tax accruals and favorable income tax audit settlements.
NSP-WISCONSIN MANAGEMENT'S DISCUSSION AND ANALYSIS RESULTS OF OPERATIONS NSP-Wisconsin's net income was $25.6 million for the first six months of 2004, compared with $24.7 million for the first six months of 2003. Electric Utility Margins The following table details the change in electric revenue and margin. Electric production expenses tend to vary with the quantity of electricity sold and changes in the unit costs of fuel and purchased power. The fuel and purchased power cost recovery mechanism of the Wisconsin jurisdiction may not allow for complete recovery of all expenses and, therefore, dramatic changes in costs or periods of extreme temperatures can impact earnings.
Six Months Ended June 30, (Millions of Dollars) 2004 2003 Electric utility revenue.............................................. $ 232 $ 229 Electric fuel and purchased power............................ (109) (112) Gross margin before operating expenses ................ $ 123 $ 117 Margin as a percentage of revenue ........................... 53.0% 51.1%
The following summarizes the components of the changes in base electric revenue and base electric margin for the six months ended June 30: Base Electric Revenue
(Millions of Dollars) 2004 vs. 2003 Sales growth (excluding weather impact) ................................... $ 5 Estimated impact of weather........................................................ (2) Interchange Agreement billing with NSP-Minnesota .................. 2 Other ............................................................................................ (2) Total base electric revenue increase........................................... $ 3
33
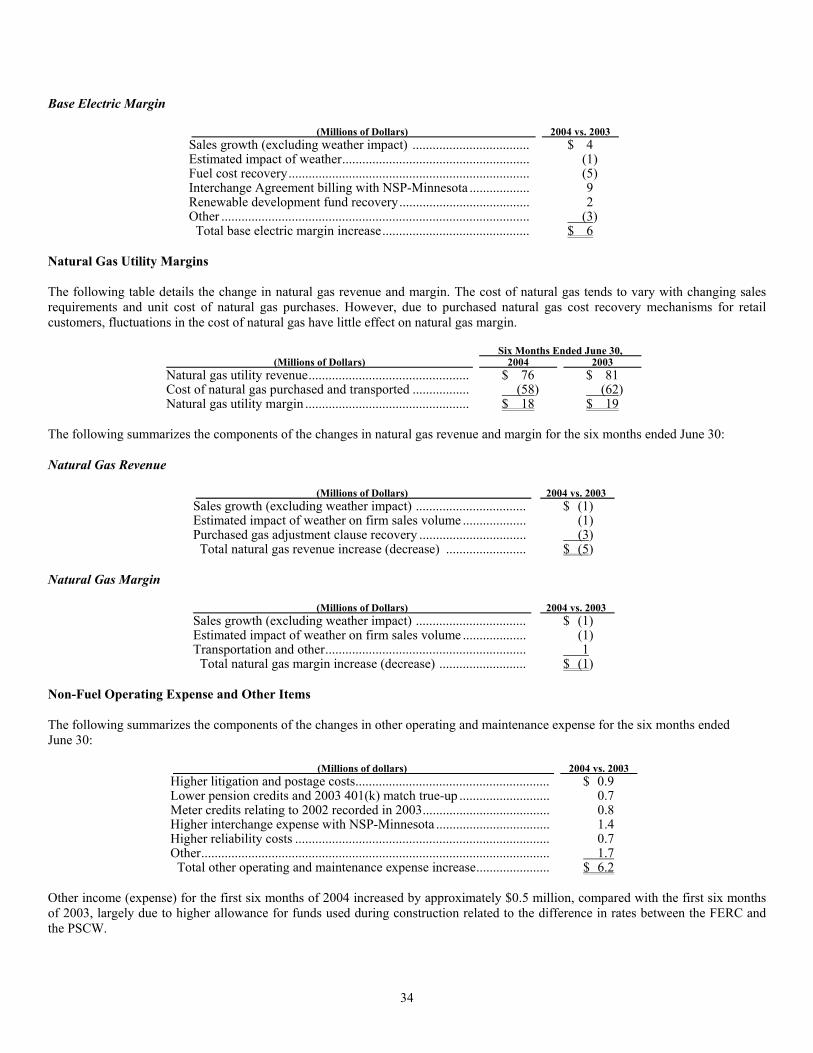
Base Electric Margin
(Millions of Dollars) 2004 vs. 2003 Sales growth (excluding weather impact) ................................... $ 4 Estimated impact of weather........................................................ (1) Fuel cost recovery........................................................................ (5) Interchange Agreement billing with NSP-Minnesota .................. 9 Renewable development fund recovery....................................... 2 Other ............................................................................................ (3) Total base electric margin increase............................................ $ 6
Natural Gas Utility Margins The following table details the change in natural gas revenue and margin. The cost of natural gas tends to vary with changing sales requirements and unit cost of natural gas purchases. However, due to purchased natural gas cost recovery mechanisms for retail customers, fluctuations in the cost of natural gas have little effect on natural gas margin.
Six Months Ended June 30, (Millions of Dollars) 2004 2003 Natural gas utility revenue................................................ $ 76 $ 81 Cost of natural gas purchased and transported ................. (58) (62) Natural gas utility margin ................................................. $ 18 $ 19
The following summarizes the components of the changes in natural gas revenue and margin for the six months ended June 30: Natural Gas Revenue
(Millions of Dollars) 2004 vs. 2003 Sales growth (excluding weather impact) ................................. $ (1) Estimated impact of weather on firm sales volume ................... (1) Purchased gas adjustment clause recovery ................................ (3) Total natural gas revenue increase (decrease) ........................ $ (5)
Natural Gas Margin
(Millions of Dollars) 2004 vs. 2003 Sales growth (excluding weather impact) ................................. $ (1) Estimated impact of weather on firm sales volume ................... (1) Transportation and other............................................................ 1 Total natural gas margin increase (decrease) .......................... $ (1)
Non-Fuel Operating Expense and Other Items The following summarizes the components of the changes in other operating and maintenance expense for the six months ended June 30:
(Millions of dollars) 2004 vs. 2003 Higher litigation and postage costs.......................................................... $ 0.9 Lower pension credits and 2003 401(k) match true-up ........................... 0.7 Meter credits relating to 2002 recorded in 2003...................................... 0.8 Higher interchange expense with NSP-Minnesota .................................. 1.4 Higher reliability costs ............................................................................ 0.7 Other........................................................................................................ 1.7 Total other operating and maintenance expense increase...................... $ 6.2
Other income (expense) for the first six months of 2004 increased by approximately $0.5 million, compared with the first six months of 2003, largely due to higher allowance for funds used during construction related to the difference in rates between the FERC and the PSCW.
34
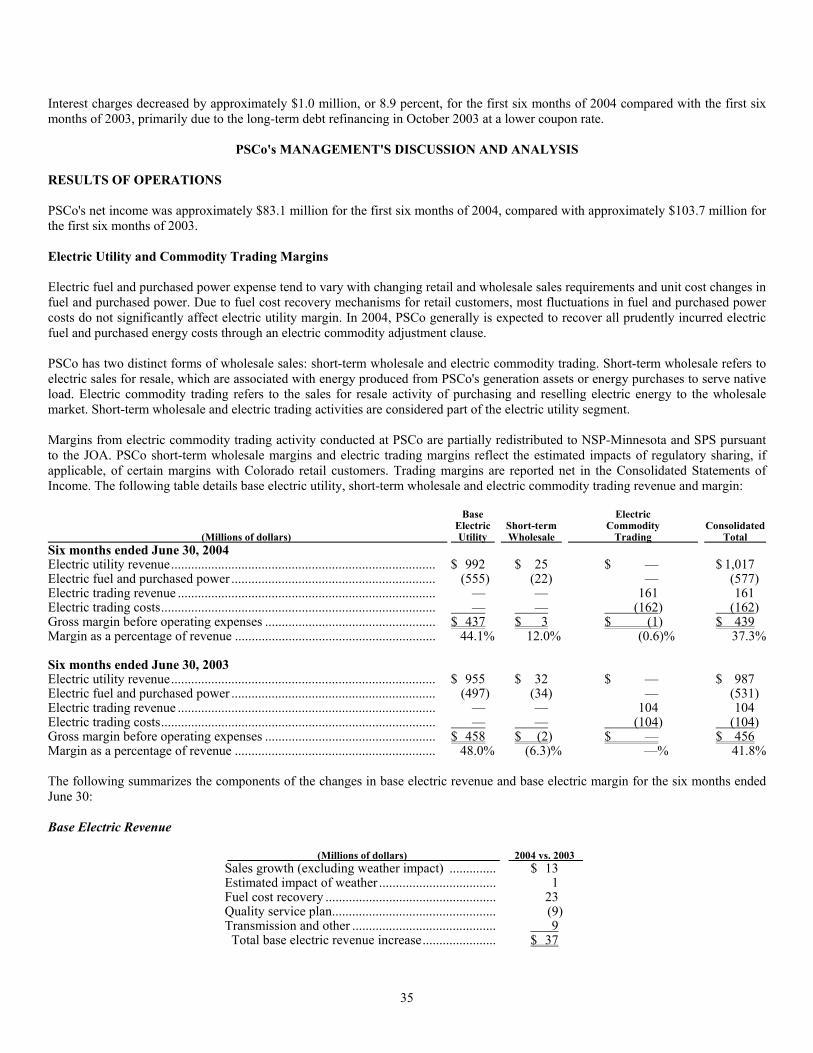
Interest charges decreased by approximately $1.0 million, or 8.9 percent, for the first six months of 2004 compared with the first six months of 2003, primarily due to the long-term debt refinancing in October 2003 at a lower coupon rate.
PSCo's MANAGEMENT'S DISCUSSION AND ANALYSIS RESULTS OF OPERATIONS PSCo's net income was approximately $83.1 million for the first six months of 2004, compared with approximately $103.7 million for the first six months of 2003. Electric Utility and Commodity Trading Margins Electric fuel and purchased power expense tend to vary with changing retail and wholesale sales requirements and unit cost changes in fuel and purchased power. Due to fuel cost recovery mechanisms for retail customers, most fluctuations in fuel and purchased power costs do not significantly affect electric utility margin. In 2004, PSCo generally is expected to recover all prudently incurred electric fuel and purchased energy costs through an electric commodity adjustment clause. PSCo has two distinct forms of wholesale sales: short-term wholesale and electric commodity trading. Short-term wholesale refers to electric sales for resale, which are associated with energy produced from PSCo's generation assets or energy purchases to serve native load. Electric commodity trading refers to the sales for resale activity of purchasing and reselling electric energy to the wholesale market. Short-term wholesale and electric trading activities are considered part of the electric utility segment. Margins from electric commodity trading activity conducted at PSCo are partially redistributed to NSP-Minnesota and SPS pursuant to the JOA. PSCo short-term wholesale margins and electric trading margins reflect the estimated impacts of regulatory sharing, if applicable, of certain margins with Colorado retail customers. Trading margins are reported net in the Consolidated Statements of Income. The following table details base electric utility, short-term wholesale and electric commodity trading revenue and margin: (Millions of dollars)
Base Electric Utility
Short-term Wholesale
Electric Commodity Trading
Consolidated Total
Six months ended June 30, 2004 Electric utility revenue............................................................................... $ 992 $ 25 $ — $ 1,017 Electric fuel and purchased power ............................................................. (555) (22) — (577) Electric trading revenue ............................................................................. — — 161 161 Electric trading costs.................................................................................. — — (162) (162) Gross margin before operating expenses ................................................... $ 437 $ 3 $ (1) $ 439 Margin as a percentage of revenue ............................................................ 44.1% 12.0% (0.6)% 37.3% Six months ended June 30, 2003 Electric utility revenue............................................................................... $ 955 $ 32 $ — $ 987 Electric fuel and purchased power ............................................................. (497) (34) — (531) Electric trading revenue ............................................................................. — — 104 104 Electric trading costs.................................................................................. — — (104) (104) Gross margin before operating expenses ................................................... $ 458 $ (2) $ — $ 456 Margin as a percentage of revenue ............................................................ 48.0% (6.3)% —% 41.8% The following summarizes the components of the changes in base electric revenue and base electric margin for the six months ended June 30: Base Electric Revenue
(Millions of dollars) 2004 vs. 2003 Sales growth (excluding weather impact) .............. $ 13 Estimated impact of weather ................................... 1 Fuel cost recovery ................................................... 23 Quality service plan................................................. (9) Transmission and other ........................................... 9 Total base electric revenue increase...................... $ 37
35
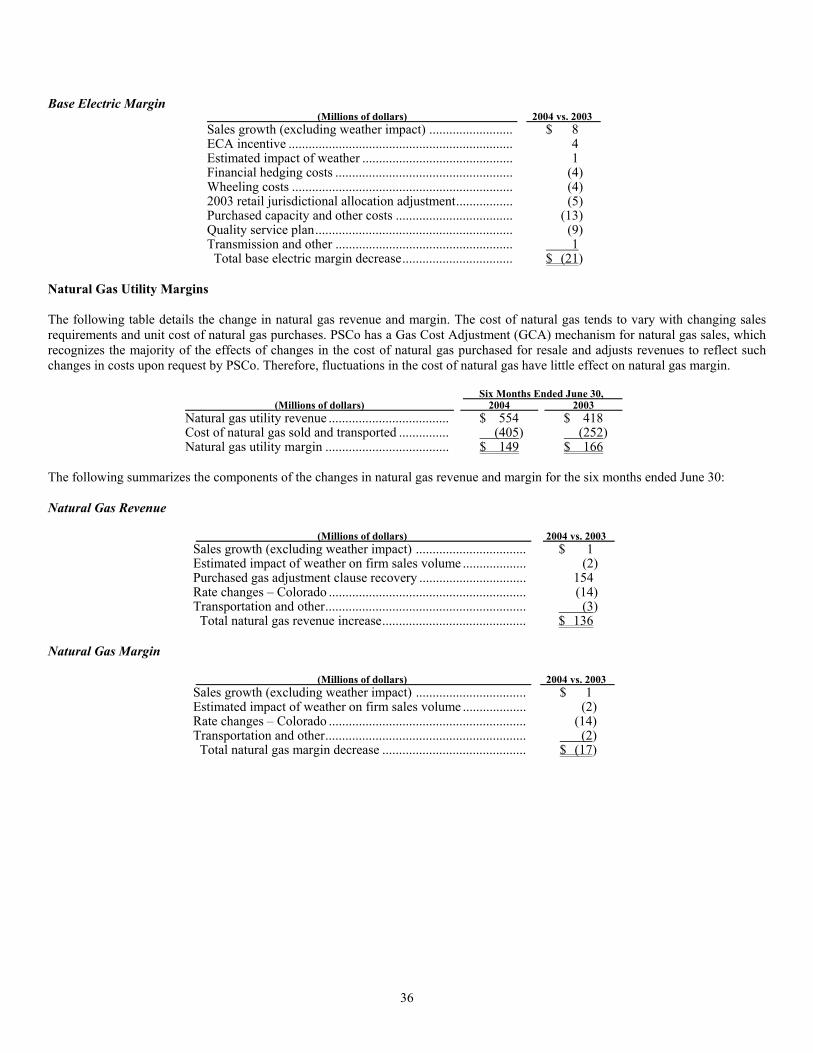
Base Electric Margin (Millions of dollars) 2004 vs. 2003 Sales growth (excluding weather impact) ......................... $ 8 ECA incentive ................................................................... 4 Estimated impact of weather ............................................. 1 Financial hedging costs ..................................................... (4) Wheeling costs .................................................................. (4) 2003 retail jurisdictional allocation adjustment................. (5) Purchased capacity and other costs ................................... (13) Quality service plan........................................................... (9) Transmission and other ..................................................... 1 Total base electric margin decrease................................. $ (21)
Natural Gas Utility Margins The following table details the change in natural gas revenue and margin. The cost of natural gas tends to vary with changing sales requirements and unit cost of natural gas purchases. PSCo has a Gas Cost Adjustment (GCA) mechanism for natural gas sales, which recognizes the majority of the effects of changes in the cost of natural gas purchased for resale and adjusts revenues to reflect such changes in costs upon request by PSCo. Therefore, fluctuations in the cost of natural gas have little effect on natural gas margin.
Six Months Ended June 30, (Millions of dollars) 2004 2003 Natural gas utility revenue .................................... $ 554 $ 418 Cost of natural gas sold and transported ............... (405) (252) Natural gas utility margin ..................................... $ 149 $ 166
The following summarizes the components of the changes in natural gas revenue and margin for the six months ended June 30: Natural Gas Revenue
(Millions of dollars) 2004 vs. 2003 Sales growth (excluding weather impact) ................................. $ 1 Estimated impact of weather on firm sales volume ................... (2) Purchased gas adjustment clause recovery ................................ 154 Rate changes – Colorado ........................................................... (14) Transportation and other............................................................ (3) Total natural gas revenue increase........................................... $ 136
Natural Gas Margin
(Millions of dollars) 2004 vs. 2003 Sales growth (excluding weather impact) ................................. $ 1 Estimated impact of weather on firm sales volume ................... (2) Rate changes – Colorado ........................................................... (14) Transportation and other............................................................ (2) Total natural gas margin decrease ........................................... $ (17)
36
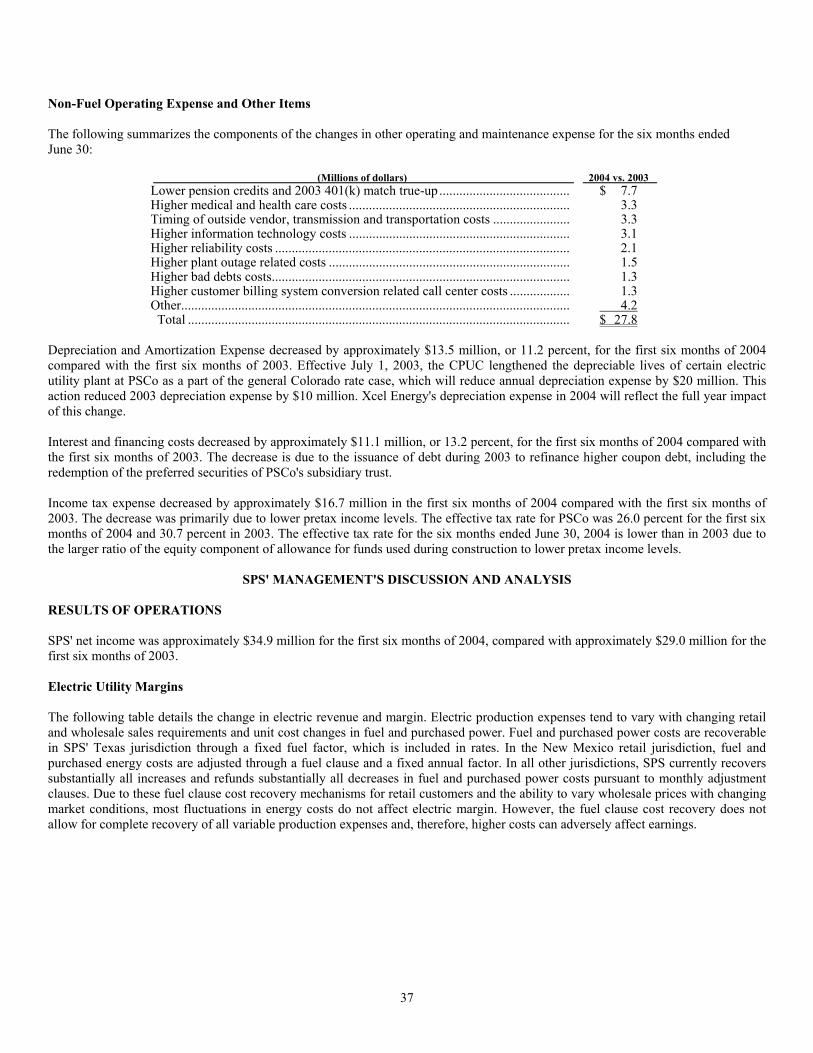
Non-Fuel Operating Expense and Other Items The following summarizes the components of the changes in other operating and maintenance expense for the six months ended June 30:
(Millions of dollars) 2004 vs. 2003 Lower pension credits and 2003 401(k) match true-up ....................................... $ 7.7 Higher medical and health care costs .................................................................. 3.3 Timing of outside vendor, transmission and transportation costs ....................... 3.3 Higher information technology costs .................................................................. 3.1 Higher reliability costs ........................................................................................ 2.1 Higher plant outage related costs ........................................................................ 1.5 Higher bad debts costs......................................................................................... 1.3 Higher customer billing system conversion related call center costs .................. 1.3 Other.................................................................................................................... 4.2 Total .................................................................................................................. $ 27.8
Depreciation and Amortization Expense decreased by approximately $13.5 million, or 11.2 percent, for the first six months of 2004 compared with the first six months of 2003. Effective July 1, 2003, the CPUC lengthened the depreciable lives of certain electric utility plant at PSCo as a part of the general Colorado rate case, which will reduce annual depreciation expense by $20 million. This action reduced 2003 depreciation expense by $10 million. Xcel Energy's depreciation expense in 2004 will reflect the full year impact of this change. Interest and financing costs decreased by approximately $11.1 million, or 13.2 percent, for the first six months of 2004 compared with the first six months of 2003. The decrease is due to the issuance of debt during 2003 to refinance higher coupon debt, including the redemption of the preferred securities of PSCo's subsidiary trust. Income tax expense decreased by approximately $16.7 million in the first six months of 2004 compared with the first six months of 2003. The decrease was primarily due to lower pretax income levels. The effective tax rate for PSCo was 26.0 percent for the first six months of 2004 and 30.7 percent in 2003. The effective tax rate for the six months ended June 30, 2004 is lower than in 2003 due to the larger ratio of the equity component of allowance for funds used during construction to lower pretax income levels.
SPS' MANAGEMENT'S DISCUSSION AND ANALYSIS RESULTS OF OPERATIONS SPS' net income was approximately $34.9 million for the first six months of 2004, compared with approximately $29.0 million for the first six months of 2003. Electric Utility Margins The following table details the change in electric revenue and margin. Electric production expenses tend to vary with changing retail and wholesale sales requirements and unit cost changes in fuel and purchased power. Fuel and purchased power costs are recoverable in SPS' Texas jurisdiction through a fixed fuel factor, which is included in rates. In the New Mexico retail jurisdiction, fuel and purchased energy costs are adjusted through a fuel clause and a fixed annual factor. In all other jurisdictions, SPS currently recovers substantially all increases and refunds substantially all decreases in fuel and purchased power costs pursuant to monthly adjustment clauses. Due to these fuel clause cost recovery mechanisms for retail customers and the ability to vary wholesale prices with changing market conditions, most fluctuations in energy costs do not affect electric margin. However, the fuel clause cost recovery does not allow for complete recovery of all variable production expenses and, therefore, higher costs can adversely affect earnings.
37
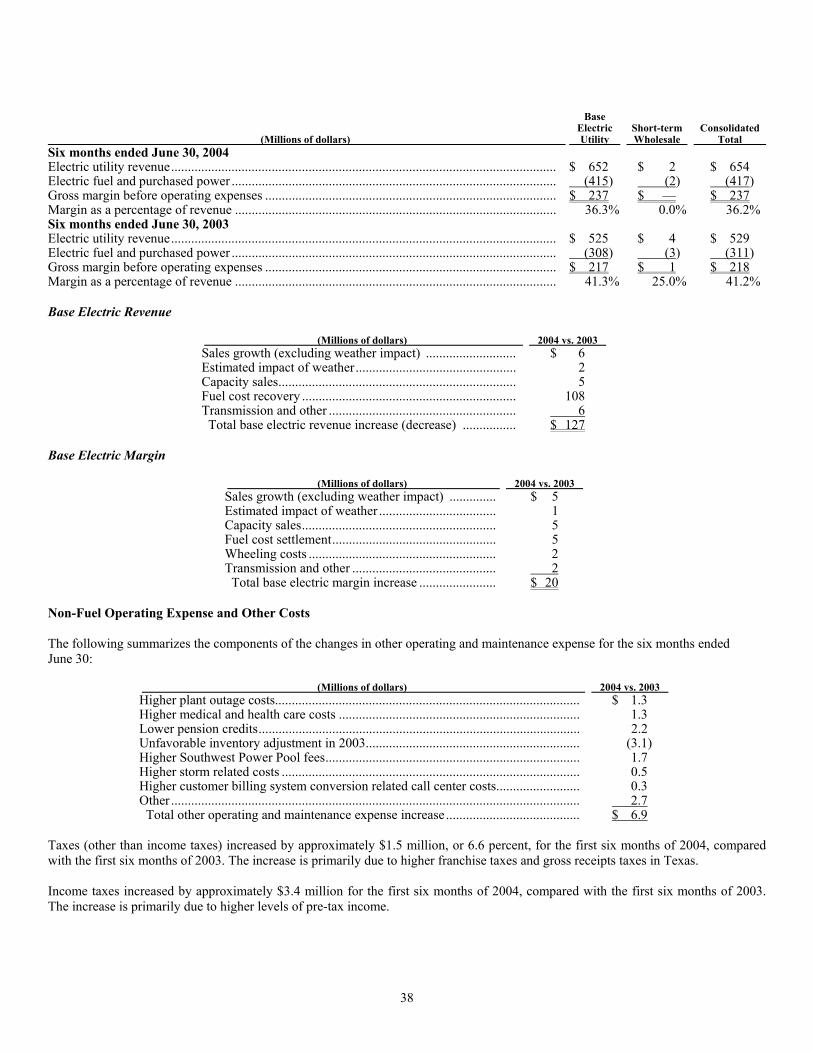
(Millions of dollars)
Base Electric Utility
Short-term Wholesale
Consolidated Total
Six months ended June 30, 2004 Electric utility revenue................................................................................................................... $ 652 $ 2 $ 654 Electric fuel and purchased power ................................................................................................. (415) (2) (417) Gross margin before operating expenses ....................................................................................... $ 237 $ — $ 237 Margin as a percentage of revenue ................................................................................................ 36.3% 0.0% 36.2% Six months ended June 30, 2003 Electric utility revenue................................................................................................................... $ 525 $ 4 $ 529 Electric fuel and purchased power ................................................................................................. (308) (3) (311) Gross margin before operating expenses ....................................................................................... $ 217 $ 1 $ 218 Margin as a percentage of revenue ................................................................................................ 41.3% 25.0% 41.2% Base Electric Revenue
(Millions of dollars) 2004 vs. 2003 Sales growth (excluding weather impact) ........................... $ 6 Estimated impact of weather................................................ 2 Capacity sales....................................................................... 5 Fuel cost recovery ................................................................ 108 Transmission and other ........................................................ 6 Total base electric revenue increase (decrease) ................ $ 127
Base Electric Margin
(Millions of dollars) 2004 vs. 2003 Sales growth (excluding weather impact) .............. $ 5 Estimated impact of weather ................................... 1 Capacity sales.......................................................... 5 Fuel cost settlement................................................. 5 Wheeling costs ........................................................ 2 Transmission and other ........................................... 2 Total base electric margin increase ....................... $ 20
Non-Fuel Operating Expense and Other Costs The following summarizes the components of the changes in other operating and maintenance expense for the six months ended June 30:
(Millions of dollars) 2004 vs. 2003 Higher plant outage costs........................................................................................... $ 1.3 Higher medical and health care costs ........................................................................ 1.3 Lower pension credits................................................................................................ 2.2 Unfavorable inventory adjustment in 2003................................................................ (3.1) Higher Southwest Power Pool fees............................................................................ 1.7 Higher storm related costs ......................................................................................... 0.5 Higher customer billing system conversion related call center costs......................... 0.3 Other .......................................................................................................................... 2.7 Total other operating and maintenance expense increase........................................ $ 6.9
Taxes (other than income taxes) increased by approximately $1.5 million, or 6.6 percent, for the first six months of 2004, compared with the first six months of 2003. The increase is primarily due to higher franchise taxes and gross receipts taxes in Texas. Income taxes increased by approximately $3.4 million for the first six months of 2004, compared with the first six months of 2003. The increase is primarily due to higher levels of pre-tax income.
38
Item 4. CONTROLS AND PROCEDURES Xcel Energy's Utility Subsidiaries maintain a set of disclosure controls and procedures designed to ensure that information required to be disclosed in reports that they file or submit under the Securities Exchange Act of 1934 is recorded, processed, summarized and reported within the time periods specified in Securities and Exchange Commission rules and forms. As of the end of the period covered by this report, based on an evaluation carried out under the supervision and with the participation of the management of each Utility Subsidiary, including their chief executive officers (CEO) and chief financial officers (CFO), of the effectiveness of their disclosure controls and procedures, each CEO and CFO has concluded that the Utility Subsidiary's disclosure controls and procedures are effective. No change in Xcel Energy's Utility Subsidiaries' internal control over financial reporting has occurred during the most recent fiscal quarter that has materially affected, or is reasonably likely to materially affect, their internal control over financial reporting.
Part II. OTHER INFORMATION
Item 1. Legal Proceedings In the normal course of business, various lawsuits and claims have arisen against the Utility Subsidiaries. Management, after consultation with legal counsel, has recorded an estimate of the probable cost of settlement or other disposition for such matters. See Notes 2, 3 and 4 of the Financial Statements in this Form 10-Q for further discussion of legal proceedings, including Regulatory Matters and Commitments and Contingent Liabilities, which are hereby incorporated by reference. Reference also is made to Item 3 of NSP-Minnesota's, NSP-Wisconsin's, PSCo's and SPS' Annual Report on Form 10-K for the year ended Dec. 31, 2003 for a description of certain legal proceedings presently pending. Except as set forth above, there are no new significant cases to report against the Utility Subsidiaries of Xcel Energy and there have been no notable changes in the previously reported proceedings.
Item 6. Exhibits and Reports on Form 8-K (a) Exhibits The following Exhibits are filed with this report: * Incorporated by reference *4.01 Credit Agreement between Public Service Company of Colorado; Bank One, NA; Wells Fargo Bank, National Association
and other financial institutions, dated May 14, 2004. (Exhibit 4.01 to Xcel Energy Form 10-Q (file no. 001-03034) filed Aug. 4, 2004).
*4.02 Credit Agreement between Northern States Power Company (a-Minnesota corporation); Wells Fargo Bank, National
Association; Bank One, NA and other financial institutions, dated May 14, 2004. (Exhibit 4.02 to Xcel Energy Form 10-Q (file no. 001-03034) filed Aug. 4, 2004).
31.01 Principal Executive Officer's and Principal Financial Officer's certifications pursuant to 18 U.S.C. Section 1350, as adopted
pursuant to Section 302 of the Sarbanes-Oxley Act of 2002 – NSP-Minnesota. 31.02 Principal Executive Officer's and Principal Financial Officer's certifications pursuant to 18 U.S.C. Section 1350, as adopted
pursuant to Section 302 of the Sarbanes-Oxley Act of 2002 – NSP-Wisconsin. 31.03 Principal Executive Officer's and Principal Financial Officer's certifications pursuant to 18 U.S.C. Section 1350, as adopted
pursuant to Section 302 of the Sarbanes-Oxley Act of 2002 – PSCo. 31.04 Principal Executive Officer's and Principal Financial Officer's certifications pursuant to 18 U.S.C. Section 1350, as adopted
pursuant to Section 302 of the Sarbanes-Oxley Act of 2002 – SPS. 32.01 Certification pursuant to 18 U.S.C. Section 1350, as adopted pursuant to Section 906 of the Sarbanes-Oxley Act of 2002 –
NSP-Minnesota
39
32.02 Certification pursuant to 18 U.S.C. Section 1350, as adopted pursuant to Section 906 of the Sarbanes-Oxley Act of 2002 –NSP-Wisconsin.
32.03 Certification pursuant to 18 U.S.C. Section 1350, as adopted pursuant to Section 906 of the Sarbanes-Oxley Act of 2002 –
PSCo. 32.04 Certification pursuant to 18 U.S.C. Section 1350, as adopted pursuant to Section 906 of the Sarbanes-Oxley Act of 2002 –
SPS. 99.01 Statement pursuant to Private Securities Litigation Reform Act of 1995.
(b) Reports on Form 8-K The following reports on Form 8-K were filed either during the three months ended June 30, 2004, or between June 30, 2004, and the date of this report: None.
40
NORTHERN STATES POWER CO. (A MINNESOTA CORPORATION) SIGNATURES Pursuant to the requirements of the Securities Exchange Act of 1934, the registrant has duly caused this report to be signed on its behalf by the undersigned thereunto duly authorized on Aug. 5, 2004. Northern States Power Co. (a Minnesota corporation) (Registrant) /s/ TERESA S. MADDEN Teresa S. Madden Vice President and Controller /s/ BENJAMIN G.S. FOWKE III Benjamin G.S. Fowke Vice President and Chief Financial Officer
41

NORTHERN STATES POWER CO. (A WISCONSIN CORPORATION) SIGNATURES Pursuant to the requirements of the Securities Exchange Act of 1934, the registrant has duly caused this report to be signed on its behalf by the undersigned thereunto duly authorized on Aug. 5, 2004. Northern States Power Co. (a Wisconsin corporation) (Registrant) /s/ TERESA S MADDEN Teresa S. Madden Vice President and Controller /s/ BENJAMIN G.S. FOWKE III Benjamin G.S. Fowke III Vice President and Chief Financial Officer
42
PUBLIC SERVICE CO. OF COLORADO SIGNATURES Pursuant to the requirements of the Securities Exchange Act of 1934, the registrant has duly caused this report to be signed on its behalf by the undersigned thereunto duly authorized on Aug. 5, 2004. Public Service Co. of Colorado (Registrant) /s/ TERESA S. MADDEN Teresa S. Madden Vice President and Controller /s/ BENJAMIN G.S. FOWKE III Benjamin G.S. Fowke III Vice President and Chief Financial Officer
43

SOUTHWESTERN PUBLIC SERVICE CO. SIGNATURES Pursuant to the requirements of the Securities Exchange Act of 1934, the registrant has duly caused this report to be signed on its behalf by the undersigned thereunto duly authorized on Aug. 5, 2004. Southwestern Public Service Co. (Registrant) /s/ TERESA S. MADDEN Teresa S. Madden Vice President and Controller /s/ BENJAMIN G.S. FOWKE III Benjamin G.S. Fowke III Vice President and Chief Financial Officer
44
EXHIBIT 31.01 — NSP-Minnesota Certifications NORTHERN STATES POWER CO. (A MINNESOTA CORPORATION) CERTIFICATIONS I, Wayne H. Brunetti, certify that:
1. I have reviewed this quarterly report on Form 10-Q of Northern States Power Co. (A Minnesota Corporation); 2. Based on my knowledge, this quarterly report does not contain any untrue statement of a material fact or omit to state a
material fact necessary to make the statements made, in light of the circumstances under which such statements were made, not misleading with respect to the period covered by this quarterly report;
3. Based on my knowledge, the financial statements, and other financial information included in this quarterly report, fairly
present in all material respects the financial condition, results of operations and cash flows of the registrant as of, and for, the periods presented in this quarterly report;
4. The registrant's other certifying officer and I are responsible for establishing and maintaining disclosure controls and
procedures (as defined in Exchange Act Rules 13a-15(e) and 15d-15(e)) for the registrant and we have:
a) designed such disclosure controls and procedures or caused such disclosure controls and procedures to be designed under our supervision to ensure that material information relating to the registrant, including its consolidated subsidiaries, is made known to us by others within those entities, particularly during the period in which this quarterly report is being prepared;
b) evaluated the effectiveness of the registrant's disclosure controls and procedures and presented in this report our
conclusions about the effectiveness of the disclosure controls and procedures, as of the end of the period covered by this report based on such evaluation; and
c) disclosed in this report any change in the registrant's internal control over financial reporting that occurred during the
registrant's most recent fiscal quarter (the registrant's fourth fiscal quarter in the case of an annual report) that has materially affected or is reasonably likely to materially affect, the registrant's internal control over financial reporting;
5. The registrant's other certifying officer and I have disclosed, based on our most recent evaluation of internal control over
financial reporting, to the registrant's auditors and the audit committee of registrant's board of directors (or persons performing the equivalent function):
a) all significant deficiencies and material weaknesses in the design or operation of internal control over financial reporting
which are reasonably likely to adversely affect the registrant's ability to record, process, summarize and report financial data; and
b) any fraud, whether or not material, that involves management or other employees who have a significant role in the
registrant's internal control over financial reporting. Date: Aug. 5, 2004 /s/ WAYNE H. BRUNETTI Wayne H. Brunetti Chairman and Chief Executive Officer
45
I, Benjamin G.S. Fowke III, certify that:
1. I have reviewed this quarterly report on Form 10-Q of Northern States Power Co. (A Minnesota Corporation); 2. Based on my knowledge, this quarterly report does not contain any untrue statement of a material fact or omit to state a
material fact necessary to make the statements made, in light of the circumstances under which such statements were made, not misleading with respect to the period covered by this quarterly report;
3. Based on my knowledge, the financial statements, and other financial information included in this quarterly report, fairly
present in all material respects the financial condition, results of operations and cash flows of the registrant as of, and for, the periods presented in this quarterly report;
4. The registrant's other certifying officer and I are responsible for establishing and maintaining disclosure controls and
procedures (as defined in Exchange Act Rules 13a-15(e) and 15d-15(e)) for the registrant and we have:
(a) designed such disclosure controls and procedures or caused such disclosure controls and procedures to be designed under our supervision to ensure that material information relating to the registrant, including its consolidated subsidiaries, is made known to us by others within those entities, particularly during the period in which this quarterly report is being prepared;
(b) evaluated the effectiveness of the registrant's disclosure controls and procedures and presented in this report our
conclusions about the effectiveness of the disclosure controls and procedures, as of the end of the period covered by this report based on such evaluation; and
(c) disclosed in this report any change in the registrant's internal control over financial reporting that occurred during the
registrant's most recent fiscal quarter (the registrant's fourth fiscal quarter in the case of an annual report) that has materially affected or is reasonably likely to materially affect, the registrant's internal control over financial reporting;
5. The registrant's other certifying officer and I have disclosed, based on our most recent evaluation of internal control over
financial reporting, to the registrant's auditors and the audit committee of registrant's board of directors (or persons performing the equivalent function):
(a) all significant deficiencies and material weaknesses in the design or operation of internal control over financial reporting
which are reasonably likely to adversely affect the registrant's ability to record, process, summarize and report financial data; and
(b) any fraud, whether or not material, that involves management or other employees who have a significant role in the
registrant's internal control over financial reporting. Date: Aug. 5, 2004 /s/ BENJAMIN G.S. FOWKE III Benjamin G.S. Fowke III Vice President and Chief Financial Officer
46
Exhibit 31.02 – NSP-Wisconsin Certifications NORTHERN STATES POWER CO. (A WISCONSIN CORPORATION) CERTIFICATIONS I, Michael L. Swenson, certify that:
1. I have reviewed this quarterly report on Form 10-Q of Northern States Power Co. (A Wisconsin Corporation); 2. Based on my knowledge, this quarterly report does not contain any untrue statement of a material fact or omit to state a
material fact necessary to make the statements made, in light of the circumstances under which such statements were made, not misleading with respect to the period covered by this quarterly report;
3. Based on my knowledge, the financial statements, and other financial information included in this quarterly report, fairly
present in all material respects the financial condition, results of operations and cash flows of the registrant as of, and for, the periods presented in this quarterly report;
4. The registrant's other certifying officer and I are responsible for establishing and maintaining disclosure controls and
procedures (as defined in Exchange Act Rules 13a-15(e) and 15d-15(e)) for the registrant and we have:
a) designed such disclosure controls and procedures or caused such disclosure controls and procedures to be designed under our supervision to ensure that material information relating to the registrant, including its consolidated subsidiaries, is made known to us by others within those entities, particularly during the period in which this quarterly report is being prepared;
b) evaluated the effectiveness of the registrant's disclosure controls and procedures and presented in this report our
conclusions about the effectiveness of the disclosure controls and procedures, as of the end of the period covered by this report based on such evaluation; and
c) disclosed in this report any change in the registrant's internal control over financial reporting that occurred during the
registrant's most recent fiscal quarter (the registrant's fourth fiscal quarter in the case of an annual report) that has materially affected or is reasonably likely to materially affect, the registrant's internal control over financial reporting;
5. The registrant's other certifying officer and I have disclosed, based on our most recent evaluation of internal control over
financial reporting, to the registrant's auditors and the audit committee of registrant's board of directors (or persons performing the equivalent function):
a) all significant deficiencies and material weaknesses in the design or operation of internal control over financial reporting
which are reasonably likely to adversely affect the registrant's ability to record, process, summarize and report financial data; and
b) any fraud, whether or not material, that involves management or other employees who have a significant role in the
registrant's internal control over financial reporting. Date: Aug. 5, 2004 /s/ MICHAEL L. SWENSON Michael L. Swenson President and Chief Executive Officer
47

I, Benjamin G.S. Fowke III, certify that:
1. I have reviewed this quarterly report on Form 10-Q of Northern States Power Co. (A Wisconsin Corporation); 2. Based on my knowledge, this quarterly report does not contain any untrue statement of a material fact or omit to state a
material fact necessary to make the statements made, in light of the circumstances under which such statements were made, not misleading with respect to the period covered by this quarterly report;
3. Based on my knowledge, the financial statements, and other financial information included in this quarterly report, fairly
present in all material respects the financial condition, results of operations and cash flows of the registrant as of, and for, the periods presented in this quarterly report;
4. The registrant's other certifying officer and I are responsible for establishing and maintaining disclosure controls and
procedures (as defined in Exchange Act Rules 13a-15(e) and 15d-15(e)) for the registrant and we have:
a) designed such disclosure controls and procedures or caused such disclosure controls and procedures to be designed under our supervision to ensure that material information relating to the registrant, including its consolidated subsidiaries, is made known to us by others within those entities, particularly during the period in which this quarterly report is being prepared;
b) evaluated the effectiveness of the registrant's disclosure controls and procedures and presented in this report our
conclusions about the effectiveness of the disclosure controls and procedures, as of the end of the period covered by this report based on such evaluation; and
c) disclosed in this report any change in the registrant's internal control over financial reporting that occurred during the
registrant's most recent fiscal quarter (the registrant's fourth fiscal quarter in the case of an annual report) that has materially affected or is reasonably likely to materially affect, the registrant's internal control over financial reporting;
5. The registrant's other certifying officer and I have disclosed, based on our most recent evaluation of internal control over
financial reporting, to the registrant's auditors and the audit committee of registrant's board of directors (or persons performing the equivalent function):
a) all significant deficiencies and material weaknesses in the design or operation of internal control over financial reporting
which are reasonably likely to adversely affect the registrant's ability to record, process, summarize and report financial data; and
b) any fraud, whether or not material, that involves management or other employees who have a significant role in the
registrant's internal control over financial reporting.
Date: Aug. 5, 2004
/s/ BENJAMIN G.S. FOWKE III Benjamin G.S. Fowke III Vice President and Chief Financial Officer
48

Exhibit 31.03 – PSCo Certifications PUBLIC SERVICE CO. OF COLORADO CERTIFICATIONS I, Wayne H. Brunetti, certify that:
1. I have reviewed this quarterly report on Form 10-Q of Public Service Co. of Colorado; 2. Based on my knowledge, this quarterly report does not contain any untrue statement of a material fact or omit to state a
material fact necessary to make the statements made, in light of the circumstances under which such statements were made, not misleading with respect to the period covered by this quarterly report;
3. Based on my knowledge, the financial statements, and other financial information included in this quarterly report, fairly
present in all material respects the financial condition, results of operations and cash flows of the registrant as of, and for, the periods presented in this quarterly report;
4. The registrant's other certifying officer and I are responsible for establishing and maintaining disclosure controls and
procedures (as defined in Exchange Act Rules 13a-15(e) and 15d-15(e)) for the registrant and we have:
a) designed such disclosure controls and procedures or caused such disclosure controls and procedures to be designed under our supervision to ensure that material information relating to the registrant, including its consolidated subsidiaries, is made known to us by others within those entities, particularly during the period in which this quarterly report is being prepared;
b) evaluated the effectiveness of the registrant's disclosure controls and procedures and presented in this report our conclusions about the effectiveness of the disclosure controls and procedures, as of the end of the period covered by this report based on such evaluation; and
c) disclosed in this report any change in the registrant's internal control over financial reporting that occurred during the
registrant's most recent fiscal quarter (the registrant's fourth fiscal quarter in the case of an annual report) that has materially affected or is reasonably likely to materially affect, the registrant's internal control over financial reporting;
5. The registrant's other certifying officer and I have disclosed, based on our most recent evaluation of internal control over
financial reporting, to the registrant's auditors and the audit committee of registrant's board of directors (or persons performing the equivalent function):
a) all significant deficiencies and material weaknesses in the design or operation of internal control over financial reporting
which are reasonably likely to adversely affect the registrant's ability to record, process, summarize and report financial data; and
b) any fraud, whether or not material, that involves management or other employees who have a significant role in the
registrant's internal control over financial reporting. Date: Aug. 5, 2004
/s/ WAYNE H. BRUNETTI Wayne H. Brunetti Chairman and Chief Executive Officer
49

I, Benjamin G.S. Fowke III, certify that:
1. I have reviewed this quarterly report on Form 10-Q of Public Service Co. of Colorado; 2. Based on my knowledge, this quarterly report does not contain any untrue statement of a material fact or omit to state a
material fact necessary to make the statements made, in light of the circumstances under which such statements were made, not misleading with respect to the period covered by this quarterly report;
3. Based on my knowledge, the financial statements, and other financial information included in this quarterly report, fairly
present in all material respects the financial condition, results of operations and cash flows of the registrant as of, and for, the periods presented in this quarterly report;
4. The registrant's other certifying officer and I are responsible for establishing and maintaining disclosure controls and
procedures (as defined in Exchange Act Rules 13a-15(e) and 15d-15(e)) for the registrant and we have:
a) designed such disclosure controls and procedures or caused such disclosure controls and procedures to be designed under our supervision to ensure that material information relating to the registrant, including its consolidated subsidiaries, is made known to us by others within those entities, particularly during the period in which this quarterly report is being prepared;
b) evaluated the effectiveness of the registrant's disclosure controls and procedures and presented in this report our
conclusions about the effectiveness of the disclosure controls and procedures, as of the end of the period covered by this report based on such evaluation; and
c) disclosed in this report any change in the registrant's internal control over financial reporting that occurred during the
registrant's most recent fiscal quarter (the registrant's fourth fiscal quarter in the case of an annual report) that has materially affected or is reasonably likely to materially affect, the registrant's internal control over financial reporting;
5. The registrant's other certifying officer and I have disclosed, based on our most recent evaluation of internal control over
financial reporting, to the registrant's auditors and the audit committee of registrant's board of directors (or persons performing the equivalent function):
a) all significant deficiencies and material weaknesses in the design or operation of internal control over financial reporting
which are reasonably likely to adversely affect the registrant's ability to record, process, summarize and report financial data; and
b) any fraud, whether or not material, that involves management or other employees who have a significant role in the
registrant's internal control over financial reporting. Date: Aug. 5, 2004 /s/ BENJAMIN G.S. FOWKE III Benjamin G.S. Fowke III Vice President and Chief Financial Officer
50

Exhibit 31.04 – SPS Certifications SOUTHWESTERN PUBLIC SERVICE CO. CERTIFICATIONS I, Gary L. Gibson, certify that:
1. I have reviewed this quarterly report on Form 10-Q of Southwestern Public Service Co; 2. Based on my knowledge, this quarterly report does not contain any untrue statement of a material fact or omit to state a
material fact necessary to make the statements made, in light of the circumstances under which such statements were made, not misleading with respect to the period covered by this quarterly report;
3. Based on my knowledge, the financial statements, and other financial information included in this quarterly report, fairly
present in all material respects the financial condition, results of operations and cash flows of the registrant as of, and for, the periods presented in this quarterly report;
4. The registrant's other certifying officer and I are responsible for establishing and maintaining disclosure controls and
procedures (as defined in Exchange Act Rules 13a-15(e) and 15d-15(e)) for the registrant and we have:
a) designed such disclosure controls and procedures or caused such disclosure controls and procedures to be designed under our supervision to ensure that material information relating to the registrant, including its consolidated subsidiaries, is made known to us by others within those entities, particularly during the period in which this quarterly report is being prepared;
b) evaluated the effectiveness of the registrant's disclosure controls and procedures and presented in this report our
conclusions about the effectiveness of the disclosure controls and procedures, as of the end of the period covered by this report based on such evaluation; and
c) disclosed in this report any change in the registrant's internal control over financial reporting that occurred during the
registrant's most recent fiscal quarter (the registrant's fourth fiscal quarter in the case of an annual report) that has materially affected or is reasonably likely to materially affect, the registrant's internal control over financial reporting;
5. The registrant's other certifying officer and I have disclosed, based on our most recent evaluation of internal control over
financial reporting, to the registrant's auditors and the audit committee of registrant's board of directors (or persons performing the equivalent function):
a) all significant deficiencies and material weaknesses in the design or operation of internal control over financial reporting
which are reasonably likely to adversely affect the registrant's ability to record, process, summarize and report financial data; and
b) any fraud, whether or not material, that involves management or other employees who have a significant role in the
registrant's internal control over financial reporting. Date: Aug. 5, 2004 /s/ GARY L. GIBSON Gary L. Gibson President and Chief Executive Officer
51
I, Benjamin G.S. Fowke III, certify that:
1. I have reviewed this quarterly report on Form 10-Q of Southwestern Public Service Co; 2. Based on my knowledge, this quarterly report does not contain any untrue statement of a material fact or omit to state a
material fact necessary to make the statements made, in light of the circumstances under which such statements were made, not misleading with respect to the period covered by this quarterly report;
3. Based on my knowledge, the financial statements, and other financial information included in this quarterly report, fairly
present in all material respects the financial condition, results of operations and cash flows of the registrant as of, and for, the periods presented in this quarterly report;
4. The registrant's other certifying officer and I are responsible for establishing and maintaining disclosure controls and
procedures (as defined in Exchange Act Rules 13a-15(e) and 15d-15(e)) for the registrant and we have:
a) designed such disclosure controls and procedures or caused such disclosure controls and procedures to be designed under our supervision to ensure that material information relating to the registrant, including its consolidated subsidiaries, is made known to us by others within those entities, particularly during the period in which this quarterly report is being prepared;
b) evaluated the effectiveness of the registrant's disclosure controls and procedures and presented in this report our
conclusions about the effectiveness of the disclosure controls and procedures, as of the end of the period covered by this report based on such evaluation; and
c) disclosed in this report any change in the registrant's internal control over financial reporting that occurred during the
registrant's most recent fiscal quarter (the registrant's fourth fiscal quarter in the case of an annual report) that has materially affected or is reasonably likely to materially affect, the registrant's internal control over financial reporting;
5. The registrant's other certifying officer and I have disclosed, based on our most recent evaluation of internal control over
financial reporting, to the registrant's auditors and the audit committee of registrant's board of directors (or persons performing the equivalent function):
a) all significant deficiencies and material weaknesses in the design or operation of internal control over financial reporting
which are reasonably likely to adversely affect the registrant's ability to record, process, summarize and report financial data; and
b) any fraud, whether or not material, that involves management or other employees who have a significant role in the
registrant's internal control over financial reporting. Date: Aug. 5, 2004
/s/ BENJAMIN G.S. FOWKE III Benjamin G.S. Fowke III Vice President and Chief Financial Officer
52

Exhibit 32.01 — Officer Certification
CERTIFICATION PURSUANT TO 18 U.S.C. SECTION 1350,
AS ADOPTED PURSUANT TO SECTION 906 OF THE SARBANES-OXLEY ACT OF 2002
(2) The information contained in the Form 10-Q fairly presents, in all material respects, the financial condition and results of operations of NSP-Minnesota as of the dates and for the periods expressed in the Form 10-Q.
In connection with the Quarterly Report of NSP-Minnesota on Form 10-Q for the quarter ended June 30, 2004, as filed with the Securities and Exchange Commission on the date hereof (Form 10-Q), each of the undersigned officers of the NSP-Minnesota certifies, pursuant to 18 U.S.C. Section 1350, as adopted pursuant to Section 906 of the Sarbanes-Oxley Act of 2002, that, to such officer's knowledge:
(1) The Form 10-Q fully complies with the requirements of Section 13(a) or 15(d) of the Securities Exchange Act of 1934; and
Date: Aug. 5, 2004
/s/ WAYNE H. BRUNETTI Wayne H. Brunetti Chairman and Chief Executive Officer /s/ BENJAMIN G.S. FOWKE III Benjamin G.S. Fowke III Vice President and Chief Financial Officer The foregoing certification is being furnished solely pursuant to 18 U.S.C. Section 1350 and is not being filed as part of the Report or as a separate disclosure document. A signed original of this written statement required by Section 906, or other document authenticating, acknowledging or otherwise adopting the signature that appears in typed form within the electronic version of this statement required by Section 906, has been provided to NSP-Minnesota and will be retained by NSP-Minnesota and furnished to the Securities and Exchange Commission or its staff upon request.
53
Exhibit 32.02 — Officer Certification
CERTIFICATION PURSUANT TO 18 U.S.C. SECTION 1350,
AS ADOPTED PURSUANT TO SECTION 906 OF THE SARBANES-OXLEY ACT OF 2002
In connection with the Quarterly Report of NSP-Wisconsin on Form 10-Q for the quarter ended June 30, 2004, as filed with the Securities and Exchange Commission on the date hereof (Form 10-Q), each of the undersigned officers of the NSP-Wisconsin certifies, pursuant to 18 U.S.C. Section 1350, as adopted pursuant to Section 906 of the Sarbanes-Oxley Act of 2002, that, to such officer's knowledge:
(1) The Form 10-Q fully complies with the requirements of Section 13(a) or 15(d) of the Securities Exchange Act of 1934; and
(2) The information contained in the Form 10-Q fairly presents, in all material respects, the financial condition and results of operations of NSP-Wisconsin as of the dates and for the periods expressed in the Form 10-Q.
Date: Aug. 5, 2004
/s/ MICHAEL L. SWENSON Michael L. Swenson President and Chief Executive Officer /s/ BENJAMIN G.S. FOWKE III Benjamin G.S. Fowke III Vice President and Chief Financial Officer The foregoing certification is being furnished solely pursuant to 18 U.S.C. Section 1350 and is not being filed as part of the Report or as a separate disclosure document. A signed original of this written statement required by Section 906, or other document authenticating, acknowledging or otherwise adopting the signature that appears in typed form within the electronic version of this statement required by Section 906, has been provided to NSP-Wisconsin and will be retained by NSP-Wisconsin and furnished to the Securities and Exchange Commission or its staff upon request.
54
Exhibit 32.03 — Officer Certification
CERTIFICATION PURSUANT TO 18 U.S.C. SECTION 1350,
AS ADOPTED PURSUANT TO SECTION 906 OF THE SARBANES-OXLEY ACT OF 2002
In connection with the Quarterly Report of PSCo on Form 10-Q for the quarter ended June 30, 2004, as filed with the Securities
and Exchange Commission on the date hereof (Form 10-Q), each of the undersigned officers of the PSCo certifies, pursuant to 18 U.S.C. Section 1350, as adopted pursuant to Section 906 of the Sarbanes-Oxley Act of 2002, that, to such officer's knowledge:
(1) The Form 10-Q fully complies with the requirements of Section 13(a) or 15(d) of the Securities Exchange Act of 1934; and (2) The information contained in the Form 10-Q fairly presents, in all material respects, the financial condition and results of
operations of PSCo as of the dates and for the periods expressed in the Form 10-Q. Date: Aug. 5, 2004 /s/ WAYNE H. BRUNETTI Wayne H. Brunetti Chairman and Chief Executive Officer /s/ BENJAMIN G.S. FOWKE III Benjamin G.S. Fowke III Vice President and Chief Financial Officer The foregoing certification is being furnished solely pursuant to 18 U.S.C. Section 1350 and is not being filed as part of the Report or as a separate disclosure document. A signed original of this written statement required by Section 906, or other document authenticating, acknowledging or otherwise adopting the signature that appears in typed form within the electronic version of this statement required by Section 906, has been provided to PSCo and will be retained by PSCo and furnished to the Securities and Exchange Commission or its staff upon request.
55
Exhibit 32.04 — Officer Certification
CERTIFICATION PURSUANT TO 18 U.S.C. SECTION 1350,
AS ADOPTED PURSUANT TO SECTION 906 OF THE SARBANES-OXLEY ACT OF 2002
In connection with the Quarterly Report of SPS on Form 10-Q for the quarter ended June 30, 2004, as filed with the Securities and Exchange Commission on the date hereof (Form 10-Q), each of the undersigned officers of the SPS certifies, pursuant to 18 U.S.C. Section 1350, as adopted pursuant to Section 906 of the Sarbanes-Oxley Act of 2002, that, to such officer's knowledge:
(1) The Form 10-Q fully complies with the requirements of Section 13(a) or 15(d) of the Securities Exchange Act of 1934; and (2) The information contained in the Form 10-Q fairly presents, in all material respects, the financial condition and results of
operations of SPS as of the dates and for the periods expressed in the Form 10-Q. Date: Aug. 5, 2004 /s/ GARY L. GIBSON Gary L. Gibson President and Chief Executive Officer /s/ BENJAMIN G.S. FOWKE III Benjamin G.S. Fowke III Vice President and Chief Financial Officer The foregoing certification is being furnished solely pursuant to 18 U.S.C. Section 1350 and is not being filed as part of the Report or as a separate disclosure document. A signed original of this written statement required by Section 906, or other document authenticating, acknowledging or otherwise adopting the signature that appears in typed form within the electronic version of this statement required by Section 906, has been provided to SPS and will be retained by SPS and furnished to the Securities and Exchange Commission or its staff upon request.
56
Exhibit 99.01
Utility Subsidiaries of Xcel Energy Cautionary Factors The Private Securities Litigation Reform Act provides a "safe harbor" for forward-looking statements to encourage such disclosures without the threat of litigation, providing those statements are identified as forward-looking and are accompanied by meaningful, cautionary statements identifying important factors that could cause the actual results to differ materially from those projected in the statement. Forward-looking statements are made in written documents and oral presentations of the Utility Subsidiaries. These statements are based on management's beliefs as well as assumptions and information currently available to management. When used in the Utility Subsidiaries' documents or oral presentations, the words "anticipate," "estimate," "expect," "projected," objective," "outlook," "forecast," "possible," "potential" and similar expressions are intended to identify forward-looking statements. In addition to any assumptions and other factors referred to specifically in connection with such forward-looking statements, factors that could cause the Utility Subsidiaries' actual results to differ materially from those contemplated in any forward-looking statements include, among others, the following:
• Economic conditions, including their impact on capital expenditures and the ability of the Utility Subsidiaries to obtain financing on favorable terms, inflation rates and monetary fluctuations;
• Business conditions in the energy business;
• Risks associated with the California power market;
• Trade, monetary, fiscal, taxation and environmental policies of governments, agencies and similar organizations in geographic
areas where the Utility Subsidiaries of Xcel Energy have a financial interest; • Customer business conditions, including demand for their products or services and supply of labor and materials used in
creating their products and services; • Financial or regulatory accounting principles or policies imposed by the Financial Accounting Standards Board, the SEC, the
Federal Energy Regulatory Commission and similar entities with regulatory oversight; • Availability or cost of capital such as changes in: interest rates; market perceptions of the utility industry, Xcel Energy or any
of its subsidiaries; or security ratings; • Factors affecting utility and nonutility operations such as unusual weather conditions; catastrophic weather-related damage;
unscheduled generation outages, maintenance or repairs; unanticipated changes to fossil fuel, nuclear fuel or gas supply costs or availability due to higher demand, shortages, transportation problems or other developments; nuclear or environmental incidents; or electric transmission or gas pipeline constraints;
• Employee workforce factors, including loss or retirement of key executives, collective bargaining agreements with union
employees, or work stoppages; • Increased competition in the utility industry or additional competition in the markets served by the Utility Subsidiaries; • State, federal and foreign legislative and regulatory initiatives that affect cost and investment recovery, have an impact on rate
structures and affect the speed and degree to which competition enters the electric and gas markets; industry restructuring initiatives; transmission system operation and/or administration initiatives; recovery of investments made under traditional regulation; nature of competitors entering the industry; retail wheeling; a new pricing structure; and former customers entering the generation market;
• Rate-setting policies or procedures of regulatory entities, including environmental externalities, which are values established by
regulators assigning environmental costs to each method of electricity generation when evaluating generation resource options; • Nuclear regulatory policies and procedures, including operating regulations and spent nuclear fuel storage; • Social attitudes regarding the utility and power industries;
57
• Cost and other effects of legal and administrative proceedings, settlements, investigations and claims; • Technological developments that result in competitive disadvantages and create the potential for impairment of existing assets; • Significant slowdown in growth or decline in the U.S. economy, delay in growth or recovery of the U.S. economy or increased
cost for insurance premiums, security and other items as a consequence of the Sept. 11, 2001 terrorist attacks; • Risks associated with implementation of new technologies; and • Other business or investment considerations that may be disclosed from time to time in the Utility Subsidiaries' SEC filings or
in other publicly disseminated written documents. The Utility Subsidiaries of Xcel Energy undertakes no obligation to publicly update or revise any forward-looking statements, whether as a result of new information, future events or otherwise. The foregoing review of factors should not be construed as exhaustive.
58