Xavier Sala-i-Martin Columbia University December 2009.
50
Xavier Sala-i-Martin Columbia University December 2009
-
Upload
christina-garrett -
Category
Documents
-
view
213 -
download
0
Transcript of Xavier Sala-i-Martin Columbia University December 2009.

Xavier Sala-i-MartinColumbia University
December 2009

$1,500
$1,550
$1,600
$1,650
$1,700
$1,750
$1,800
$1,850
$1,900
$1,950
$2,00019
7019
7119
7219
7319
7419
7519
7619
7719
7819
7919
8019
8119
8219
8319
8419
8519
8619
8719
8819
8919
9019
9119
9219
9319
9419
9519
9619
9719
9819
9920
0020
0120
0220
0320
0420
0520
06
GDP Per Capita (SSA)
GDP Per Capita (SSA)

-5%
-4%
-3%
-2%
-1%
0%
1%
2%
3%
4%
5%
6%19
7019
7119
7219
7319
7419
7519
7619
7719
7819
7919
8019
8119
8219
8319
8419
8519
8619
8719
8819
8919
9019
9119
9219
9319
9419
9519
9619
9719
9819
9920
0020
0120
0220
0320
0420
0520
06
Growth of GDP Per Capita (SSA)
Growth of GDP Per Capita (SSA) Poly. (Growth of GDP Per Capita (SSA))

05
00
00
10
00
00
Po
pu
latio
n
0 5 10 15Log Income
Africa Nigeria Ethiopia
Congo-Zaire South Africa
African Income Distribution in Year 1970

01
00
00
02
00
00
03
00
00
0P
op
ula
tion
0 5 10 15Log Income
Africa Nigeria Ethiopia
Congo-Zaire South Africa
African Income Distribution in Year 2006

05
00
00
10
00
00
15
00
00
Po
pu
latio
n
0 5 10 15Log Income
1970 1980 1990 2000 2006
African Income Distribution: 1970-2006

0
.1
.2
.3
.4
.5
.6
.7
.8
.9C
um
ula
tive
Pro
ba
bili
ty
4 4.5 5 5.5 6 6.5 7 7.5 8Log Income
1990 2000 2006
Africa CDFs: 1990-2006
.3
.35
.4
.45
Po
vert
y R
ate
1970 1980 1990 2000 2010Year
$1/day Poverty, hybrid $1/day Poverty, linear $1/day Poverty, horizontal
$1/day Poverty, gamma $1/day Poverty, weibull $1/day Poverty, optimal
$1/day Poverty, WB $1/day Poverty, Maddison $1/day Poverty, Baseline
Falling Poverty in Africa

All Africa Poverty Rates without Congoyear Poverty Rates Poverty w/o Congo
1970 0.398974 0.4059931971 0.389155 0.3970591972 0.379901 0.3863221973 0.379838 0.387931974 0.373766 0.3802691975 0.381659 0.3866471976 0.37875 0.3796541977 0.378954 0.3787671978 0.381122 0.3801691979 0.393236 0.3938411980 0.399195 0.3999851981 0.399244 0.3981731982 0.407547 0.4018521983 0.414475 0.411181984 0.431801 0.4288641985 0.431257 0.4281581986 0.426115 0.4235821987 0.440711 0.4384181988 0.424046 0.4195271989 0.427253 0.4211071990 0.420722 Goal 0.210361 0.417146 Goal1991 0.423665 0.4174751992 0.420007 0.4061841993 0.42182 0.4009621994 0.420542 0.3987161995 0.428211 0.4034811996 0.415379 0.3890921997 0.401421 0.3736951998 0.40407 0.3755891999 0.39585 0.363092000 0.382546 0.3452742001 0.378351 0.3396382002 0.373565 0.3334552003 0.354786 0.319512004 0.344707 0.3072182005 0.330953 0.2929272006 0.318103 0.279191 -0.0112990452007 0.308093 0.2678922008 0.298083 0.2565932009 0.288073 0.2452942010 0.278064 0.2339952011 0.268054 0.2226962012 0.258044 0.2113972013 0.248034 0.200098 <<--- Achieve MDG2014 0.238024 0.1887992015 0.228014 0.17752016 0.218005 <--Achieve MDGs 0.1662012017 0.207995 0.1549022018 0.197985 0.1436032019 0.187975 0.132304

.62
.64
.66
.68G
ini C
oe
ffic
ien
t
1970 1980 1990 2000 2010Year
Gini Coefficient, hybrid Gini Coefficient, linear Gini Coefficient, horizontal
Gini Coefficient, gamma Gini Coefficient, weibull Gini Coefficient, optimal
Gini Coefficient, WB Gini Coefficient, WB PPP Revision Gini Coefficient, Baseline
Inequality in Africa

1600
1700
1800
1900
2000
GD
P p
er
Ca
pita
.3
.35
.4
.45
1970 1980 1990 2000 2010Year
Poverty Rate, $1/Day GDP per capita
Po
vert
y R
ate
$1/Day Poverty and Growth in Sub-Saharan Africa, 1970-2006

550
600
650
700
750
Se
n W
elfa
re
1970 1980 1990 2000 2010Year
Sen Welfare, hybrid Sen Welfare, linear Sen Welfare, horizontal
Sen Welfare, gamma Sen Welfare, weibull Sen Welfare, optimal
Sen Welfare, WB Sen Welfare, Maddison Sen Welfare, Baseline
Rising Welfare in Africa

There has been some success since mid 1990s (even though the MDG people want us to believe that Africa is a disaster because it is far away from MDGs).

Of course:◦ Part of it is commodity boom◦ But
non-oil exporters have not had an improvements in TOT (they import oil!): growth does not come from exports of commodities but domestic demand
Of course:◦ “Africa” does not mean anything as a unit: lots of
heterogeneity: landlocked vs non-landlocked oil vs non-oil democracies vs non-democracies war vs non-war).
I think there are five factors that should be cause for optimism

400
500
600
700
800
900
GD
P p
er
Ca
pita
.3
.4
.5
.6
.7
.8
1970 1980 1990 2000 2010Year
Poverty Rate, $1/Day GDP per capita
Po
vert
y R
ate
$1/Day Poverty and Growth in Ethiopia, 1970-2006

6000
7000
8000
9000
10000
GD
P p
er
Ca
pita
.02
.03
.04
.05
.06
.07
1970 1980 1990 2000 2010Year
Poverty Rate, $1/Day GDP per capita
Po
vert
y R
ate
$1/Day Poverty and Growth in South Africa, 1970-2006

900
1000
1100
1200
1300
GD
P p
er
Ca
pita
.25
.3
.35
.4
.45
.5
1970 1980 1990 2000 2010Year
Poverty Rate, $1/Day GDP per capita
Po
vert
y R
ate
$1/Day Poverty and Growth in Nigeria, 1970-2006

.3.4
.5.6
$1
/da
y P
ove
rty
Ra
te
1970 1980 1990 2000 2010Year
Landlocked Countries Coastal Countries
Landlocked vs. Coastal Countries: Poverty

.3.3
5.4
.45
.5$
1/d
ay
Po
vert
y R
ate
1970 1980 1990 2000 2010Year
Mineral-Rich Countries Mineral-Poor Countries
Mineral-Rich vs. Mineral-Poor Countries: Poverty

.3.3
5.4
.45
.5
1970 1980 1990 2000 2010Year
Favorable Agriculture Countries Unfavorable Agriculture Countries
$1/d
ay P
over
ty R
ate
Favorable vs. Unfavorable Agriculture Countries: Poverty

.25
.3.3
5.4
.45
$1
/da
y P
ove
rty
Ra
te
1970 1980 1990 2000 2010Year
Democratic Countries Nondemocratic Countries
Democratic vs. Nondemocratic Countries: Poverty

.2.4
.6.8
$1
/da
y P
ove
rty
Ra
te
1970 1980 1990 2000 2010Year
British French Portuguese Belgian
Colonial Origins: Poverty

1989 – 3 democracies 2006 – 23 democracies Reasons:
◦ End of cold war◦ End of SA apartheid◦ Both of them brought more freedom.
Some are fragile (Kenya), but still a change.

0
5
10
15
20
25
No. o
f D
em
ocra
cie
s
1960 1965 1970 1975 1980 1985 1990 1995 2000 2005
Note: To qualify as a democracy, a country must score 4 or less on the combined Freedom House score AND 2 or more on the polity score from Polity IV.

Democracies Year of Democratization Non-democracies Oil-exportersBenin 1991 Burkina Faso AngolaBotswana 1966 Central African Republic CameroonCape Verde 1991 Congo, Dem. Rep. ChadComoros 2004 Djibouti Congo, Rep.Ghana 1996 Eritrea Equatorial GuineaKenya 2002 Ethiopia GabonLesotho 1993 Gabon MauritaniaLiberia 2006 Gambia, The SudanMadagascar 1992 Guinea-Bissau Nigeria*Malawi 1994 GuineaMali 1992 Ivory CoastMauritius 1968 RwandaMozambique 1994 SomaliaNamibia 1990 SwazilandNiger 2000 TogoNigeria* 1999 UgandaSao Tome & Principe 1991 ZimbabweSenegal 2000Seychelles 1993Sierra Leonne 2002South Africa 1994Tanzania 2000Zambia 2002* Both a democracy and oil-exporting

Year Democracy Non-Democracy Democracy Non-Democracy1996 -0.49 -0.78 -0.49 -0.782006 -0.37 -1.08 -0.43 -1.04
Democracy Non-Democracy Democracy Non-Democracy1996 -0.46 -0.84 0.38 -0.912006 -0.39 -1.13 0.06 -1.01
Democracy Non-Democracy Democracy Non-Democracy1996 -0.49 -0.77 -0.12 -1.052006 -0.36 -0.92 0.06 -1.19
Rule of Law
Control of Corruption
Regulatory Quality
Government Effectiveness Political Stability
Voice & Accountability


0
5
10
15
20
25
30
Infla
tion
, C
onsu
mer
Price
(%
)
1960 1970 1980 1990 2000 2005Average for all SSA excluding country-year inflation rates>150%

HIPC initiative, etc: DEBT is no longer an issue

25
50
75
100
125
150
Tota
l L
on
g T
erm
Deb
t / G
DP
(%
)
1970 1975 1980 1985 1990 1995 2000 2005

Decision Point Completion Point
Completion Point HIPCsBenin July-00 March-03Burkina Faso July-00 April-02Cameroon October-00 April-06Ethiopia November-01 April-04Ghana February-02 July-04Madagascar December-00 October-04Malawi December-00 August-06Mali September-00 March-03Mauritania February-00 June-02Mozambique April-00 September-01Niger December-00 April-04Rwanda December-00 April-05Sao Tome & Pr December-00 March-07Senegal June-00 April-04Sierra Leone March-02 December-06Tanzania April-00 November-01Uganda February-00 May-00Zambia December-00 April-05
Interim HIPCsBurundi August-05 FloatingCentral African Rep. September-07 FloatingChad May-01 FloatingDem. Rep. of Congo July-03 FloatingRep. of Congo March-06 FloatingThe Gambia December-00 FloatingGuinea December-00 FloatingGuinea-Bissau December-00 Floating
Interim HIPC under the original HIPC InitiativeCote d'Ivoire March-98 --
Non-HIPC debt reliefNigeria 2005 2006

Debt relief frees up resources Debt relief changes the relation with
the donor community: African countries no longer need the IMF and the WB◦ Note: Opens up the role for China
Countries take up their own responsibilities and may make their own policies and reforms with fewer constraints

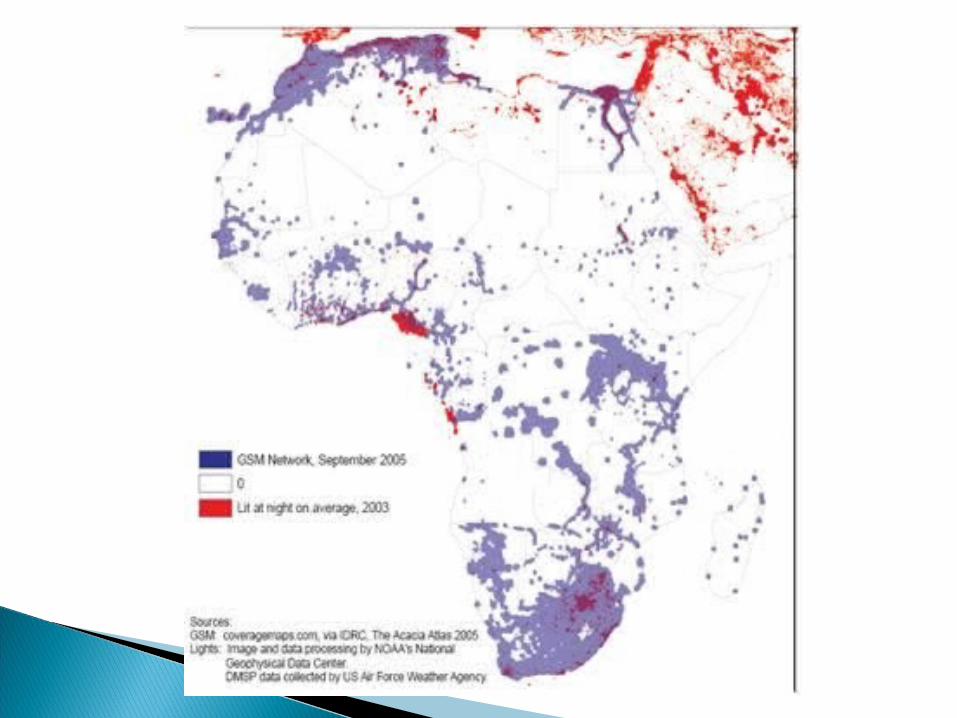
Example: Cell Phone penetration New businesses associated with these
technologies (creativity, innovation, entrepreneurship)
Potential “skipping” of stage of development (no fixed telephony)
New Means of payments (sms-transfers with potential implications for international capital flows: sms-remittances)

In General (for the whole world), China is:◦ A customer◦ A competitor:
Increasingly in “sophisticated manufacturing” (electronics, telecoms, transportation,…): maybe not direct competition to Africa (African manufactures are below in the sophistication ladder)
◦ A Lender (in exchange for future supplies of primary commodities) A future debt crisis?
◦ A Partner (Investment)◦ A Financial Investor (Massive Sovereign funds, and it is not
clear what they will do with them)◦ A Contributor to increase (or decrease) price of
commodities◦ A Contributor to decrease price of manufacturing (so lower
inflation)◦ A “Global Hunter for Energy”◦ A Substitute for IFIs when it comes to aid
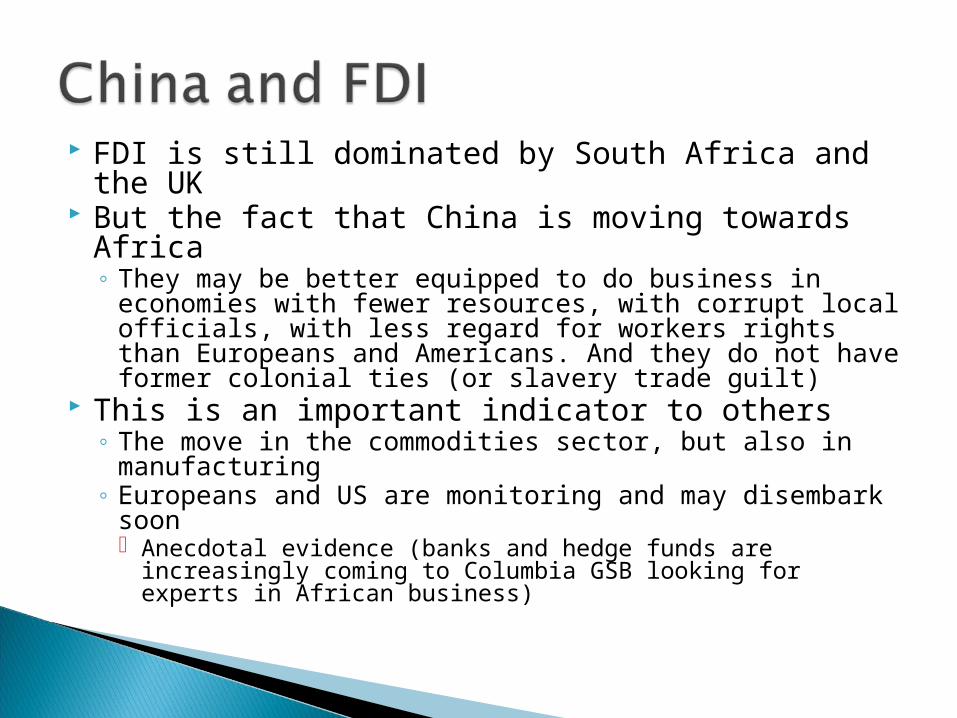
FDI is still dominated by South Africa and the UK
But the fact that China is moving towards Africa◦ They may be better equipped to do business in
economies with fewer resources, with corrupt local officials, with less regard for workers rights than Europeans and Americans. And they do not have former colonial ties (or slavery trade guilt)
This is an important indicator to others◦ The move in the commodities sector, but also in
manufacturing◦ Europeans and US are monitoring and may disembark
soon Anecdotal evidence (banks and hedge funds are
increasingly coming to Columbia GSB looking for experts in African business)

A Model of development (a mirror)◦It Can Be Done!!!◦How it can be done:
Commitment to education (good) Embrace globalization (good) Maintain role of state in planning/directing/Clusters
(because of China, most countries are setting up “competitiveness councils” where PPP are discussed) Not clear this is a good idea since governments, still,
are not equipped to “pick winners” Entrepreneurial spirit / business as opposed to aid as a
way to develop

Is this time the real turning point for Africa?


$0
$1,000
$2,000
$3,000
$4,000
$5,000
$6,000
$7,000
1970
1971
1972
1973
1974
1975
1976
1977
1978
1979
1980
1981
1982
1983
1984
1985
1986
1987
1988
1989
1990
1991
1992
1993
1994
1995
1996
1997
1998
1999
2000
2001
2002
2003
2004
2005
2006
GDP Per Capita
GDP Per Capita (SSA) GDP Per Capita (China)

0%
10%
20%
30%
40%
50%
60%
70%
1970
1971
1972
1973
1974
1975
1976
1977
1978
1979
1980
1981
1982
1983
1984
1985
1986
1987
1988
1989
1990
1991
1992
1993
1994
1995
1996
1997
1998
1999
2000
2001
2002
2003
2004
2005
2006
Poverty Rates
SSA China

0
100,000
200,000
300,000
400,000
500,000
600,000
700,000
1970
1971
1972
1973
1974
1975
1976
1977
1978
1979
1980
1981
1982
1983
1984
1985
1986
1987
1988
1989
1990
1991
1992
1993
1994
1995
1996
1997
1998
1999
2000
2001
2002
2003
2004
2005
2006
Poverty Counts
SSA China

Country 2000 2006 Difference Account for
World $648,529,494 $1,609,917,764 $961,388,270 100.00%
USA $139,621,555 $345,058,815 $205,437,260 21.37%Japan $77,425,354 $161,691,373 $84,266,019 8.77%China $20,636,867 $89,000,588 $68,363,721 7.11%Germany $43,239,109 $111,330,061 $68,090,952 7.08%South Korea $38,076,555 $86,706,747 $48,630,192 5.06%
Oil and other fuel Imports

Country 2000 2006 Difference Account for
World $239,312,970 $454,494,686 $215,181,716 100.00%
China $37,914,180 $102,211,411 $64,297,231 29.88%Japan $25,895,877 $41,913,099 $16,017,222 7.44%Germany $16,551,225 $32,468,504 $15,917,279 7.40%South Korea $9,912,163 $19,664,453 $9,752,290 4.53%India $2,913,814 $12,396,296 $9,482,482 4.41%USA $24,104,822 $32,970,721 $8,865,899 4.12%
Imports of Minerals and Other Crude Materials (except Fuels)

Crude Oil and Related Imports: China and Major Importers, 2000-2006
Quantity of Kilograms___________________________________________________________Country 2000 2006__________________________________________________________China 70,265,318
145,174,839USA 464,801,236
861,259,894Japan 211,981,499
208,694,845Germany 105,292,884
109,503,671South Korea 120,651,685
120,152,663_________________________________________________________Source: COMTRADE, 2008.

Nov. 2007→