
*X069/13/01* - sqa.org.uk · One exoplanet is Gliese 785C. Data relating to the circular orbit of...
24
X069/13/01 NATIONAL QUALIFICATIONS 2015 TUESDAY, 5 MAY 1.00 PM – 3.30 PM PHYSICS ADVANCED HIGHER Reference may be made to the Physics Data Booklet. Answer all questions. Any necessary data may be found in the Data Sheet on Page two. Care should be taken to give an appropriate number of significant figures in the final answers to calculations. Square-ruled paper (if used) should be placed inside the front cover of the answer book for return to the Scottish Qualifications Authority. PB *X069/13/01* ©
-
Upload
nguyenkhanh -
Category
Documents
-
view
234 -
download
0
Transcript of *X069/13/01* - sqa.org.uk · One exoplanet is Gliese 785C. Data relating to the circular orbit of...

X069/13/01
N A T I O N A LQ U A L I F I C A T I O N S2 0 1 5
T U E S D A Y , 5 M A Y1 . 0 0 P M – 3 . 3 0 P M PHYSICS
ADVANCED HIGHER
Reference may be made to the Physics Data Booklet.
Answer all questions.
Any necessary data may be found in the Data Sheet on Page two.
Care should be taken to give an appropriate number of significant figures in the final answers to calculations.
Square-ruled paper (if used) should be placed inside the front cover of the answer book for return to the Scottish Qualifications Authority.
PB *X069/13/01* ©
[X069/13/01] Page two
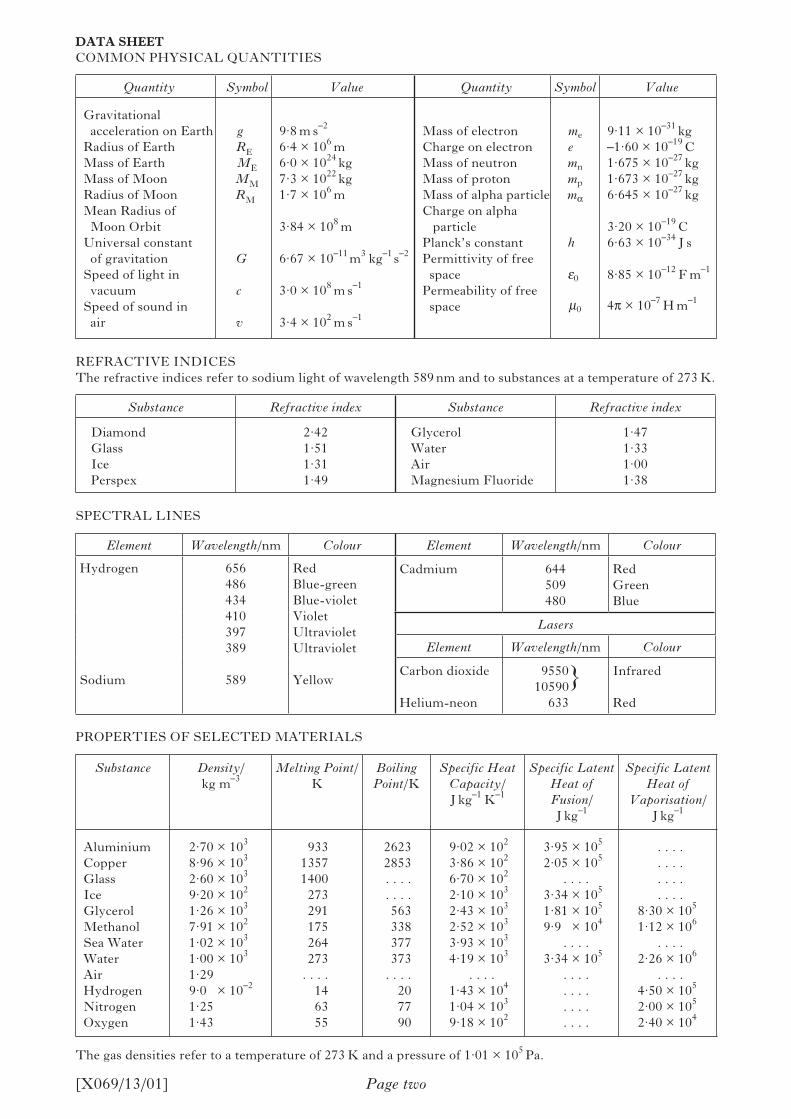
DATA SHEETCOMMON PHYSICAL QUANTITIES
Quantity Symbol Value Quantity Symbol Value
Gravitational acceleration on EarthRadius of EarthMass of EarthMass of MoonRadius of MoonMean Radius of Moon OrbitUniversal constant of gravitationSpeed of light in vacuumSpeed of sound in air
gREMEMMRM
G
c
v
9·8 m s–2
6·4 × 106 m6·0 × 1024 kg7·3 × 1022 kg1·7 × 106 m
3·84 × 108 m
6·67 × 10–11 m3 kg–1 s–2
3·0 × 108 m s–1
3·4 × 102 m s–1
Mass of electronCharge on electronMass of neutronMass of protonMass of alpha particleCharge on alpha particlePlanck’s constantPermittivity of free spacePermeability of free space
me
emn
mp
ma
h
e0
m0
9·11 × 10–31 kg–1·60 × 10–19 C1·675 × 10–27 kg1·673 × 10–27 kg6·645 × 10–27 kg
3·20 × 10–19 C6·63 × 10–34 J s
8·85 × 10–12 F m–1
4p × 10–7 H m–1
REFRACTIVE INDICESThe refractive indices refer to sodium light of wavelength 589 nm and to substances at a temperature of 273 K.
Substance Refractive index Substance Refractive index
DiamondGlassIcePerspex
2·421·51 1·311·49
GlycerolWaterAirMagnesium Fluoride
1·47 1·331·001·38
SPECTRAL LINES
Element Wavelength/nm Colour Element Wavelength/nm Colour
Hydrogen
Sodium
656486434410397389
589
RedBlue-greenBlue-violetVioletUltravioletUltraviolet
Yellow
Cadmium 644509480
RedGreenBlue
Lasers
Element Wavelength/nm Colour
Carbon dioxide Helium-neon
955010590}
633
Infrared Red
PROPERTIES OF SELECTED MATERIALS
Substance Density/kg m–3
Melting Point/K
Boiling Point/K
Specific HeatCapacity/J kg–1 K–1
Specific LatentHeat ofFusion/J kg–1
Specific LatentHeat of
Vaporisation/J kg–1
AluminiumCopperGlassIceGlycerolMethanolSea WaterWaterAirHydrogenNitrogenOxygen
2·70 × 103
8·96 × 103
2·60 × 103
9·20 × 102
1·26 × 103
7·91 × 102
1·02 × 103
1·00 × 103
1·299·0 × 10–2
1·251·43
93313571400273291175264273
. . . .146355
26232853. . . .. . . .563338377373
. . . .207790
9·02 × 102
3·86 × 102
6·70 × 102
2·10 × 103
2·43 × 103
2·52 × 103
3·93 × 103
4·19 × 103
. . . .1·43 × 104
1·04 × 103
9·18 × 102
3·95 × 105
2·05 × 105
. . . .3·34 × 105
1·81 × 105
9·9 × 104
. . . .3·34 × 105
. . . .
. . . .
. . . .
. . . .
. . . .
. . . .
. . . .
. . . .8·30 × 105
1·12 × 106
. . . .2·26 × 106
. . . .4·50 × 105
2·00 × 105
2·40 × 104
The gas densities refer to a temperature of 273 K and a pressure of 1·01 × 105 Pa.

1. The Large Hadron Collider (LHC) at CERN is a ring around which charged particles are accelerated in order to conduct experiments into the nature of matter. The ring, as shown in Figure 1, has a circumference of 27 km.
When the LHC is operating at full capacity, protons travel around the ring at 2·99 × 108 m s–1.
(a) Calculate the relativistic mass of a proton when the LHC is operating at full capacity.
(b) Calculate the relativistic energy of this proton.
[X069/13/01]
Marks
2
2
(4)
Page three
[Turn over
Figure 1

[X069/13/01]
Marks
2
3
2
2
2. A flywheel consisting of a solid, uniform disc is free to rotate about a fixed axis as shown in Figure 2A. The disc has a mass of 16 kg and a radius of 0·30 m.
(a) Calculate the moment of inertia of the flywheel.
(b) A mass is attached to the flywheel by a light string as shown in Figure 2B.
The mass is allowed to fall and is found to be travelling at 3·0 m s–1 when the string leaves the flywheel. The flywheel makes 5 further revolutions before it comes to rest.
(i) Calculate the angular acceleration of the flywheel after the string leaves the flywheel.
(ii) Calculate the frictional torque acting on the flywheel.
(c) The experiment is repeated with a flywheel made from a more dense material with the same physical dimensions. The string, falling mass and all frictional forces are the same as in part (b).
As the string detaches from the flywheel, is the speed of the falling mass greater than, the same as or less than 3·0 m s–1?
You must justify your answer.
Page four
Figure 2A
Figure 2B
0·30 m
fixed axis
0·30 m
fixed axis
mass

Marks
1
3
(13)
2. (continued)
(d) A Kinetic Energy Recovery System (KERS) is used in racing cars to store energy that is usually lost when braking.
One of these systems uses a flywheel, as shown in Figure 2C, to store the energy.
Data for this KERS flywheel is given below.
Internal radius ri = 0·15 m
External radius re = 0·20 m
Mass of flywheel M = 6·0 kg
Maximum rate of revolution = 6·0 × 104 revolutions per minute
(i) Using the expression
I = ½ M(ri2 + re
2)
determine the moment of inertia of the flywheel.
(ii) Calculate the maximum rotational kinetic energy that can be stored in the flywheel.
Page five[X069/13/01]
[Turn over
Figure 2C
reri

[X069/13/01] Page six
3. (a) Many planets outside the Solar System have been discovered in recent years. These planets are known as exoplanets.
One exoplanet is Gliese 785C. Data relating to the circular orbit of Gliese 785C around its parent star is shown in Figure 3A.
(i) Show that the mass M of the parent star can be written as
M rGT
= 4 2 3
2π
where the other symbols have their usual meanings.
(ii) Determine the mass of the parent star.
Marks
2
2
Figure 3A
parent star
Gliese 785C
orbital period 525·8 Earth days
3·54 × 1011 m Not to scale
Marks
3
2
2
(11)
3. (continued)
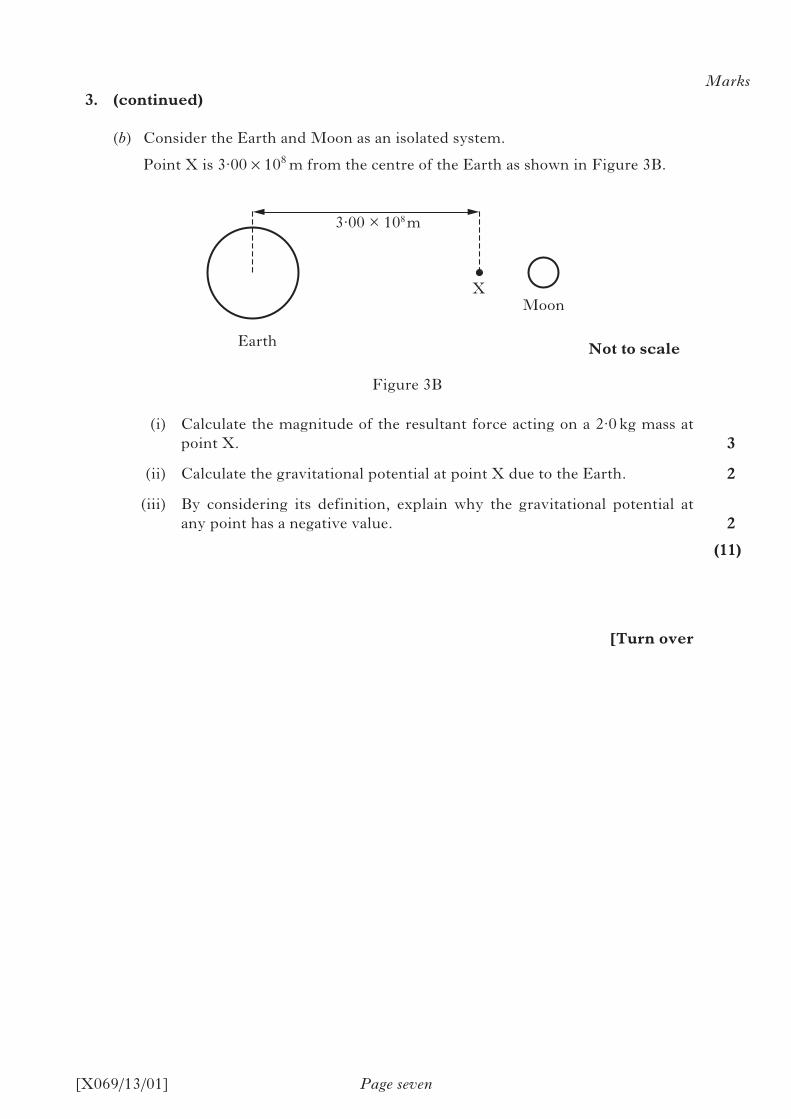
(b) Consider the Earth and Moon as an isolated system.
Point X is 3·00 × 108 m from the centre of the Earth as shown in Figure 3B.
(i) Calculate the magnitude of the resultant force acting on a 2·0 kg mass at point X.
(ii) Calculate the gravitational potential at point X due to the Earth.
(iii) By considering its definition, explain why the gravitational potential at any point has a negative value.
Page seven[X069/13/01]
[Turn over
Figure 3B
3·00 × 108 m
Not to scaleEarth
MoonX

[X069/13/01]
Marks1
2
1
4. (a) (i) State what is meant by simple harmonic motion.
(ii) The displacement of an oscillating mass can be described by the expression
y = Asinωt
where the symbols have their usual meanings.
Show that this mass exhibits simple harmonic motion (SHM).
(iii) The displacement of an object exhibiting SHM can also be written as
y = Acosωt
Identify the initial condition for which this equation would be used.
(b) A mass attached to a spring is displaced from its equilibrium position and allowed to oscillate vertically. A motion sensor, connected to a computer, is placed below the mass as shown in Figure 4A.
Figure 4B shows the graph of the displacement from equilibrium position against time for the mass.
Page eight
Figure 4A
Figure 4B
motion sensor
0·100
0·050
0
–0·050
–0·100
0·50 1·00
displacement/m
time/s
[X069/13/01] Page nine
Marks
3
2
1
(10)
4. (b) (continued)
(i) Using data from the graph, determine the velocity of the mass at 0·50 s.
(ii) Calculate the maximum acceleration of the mass.
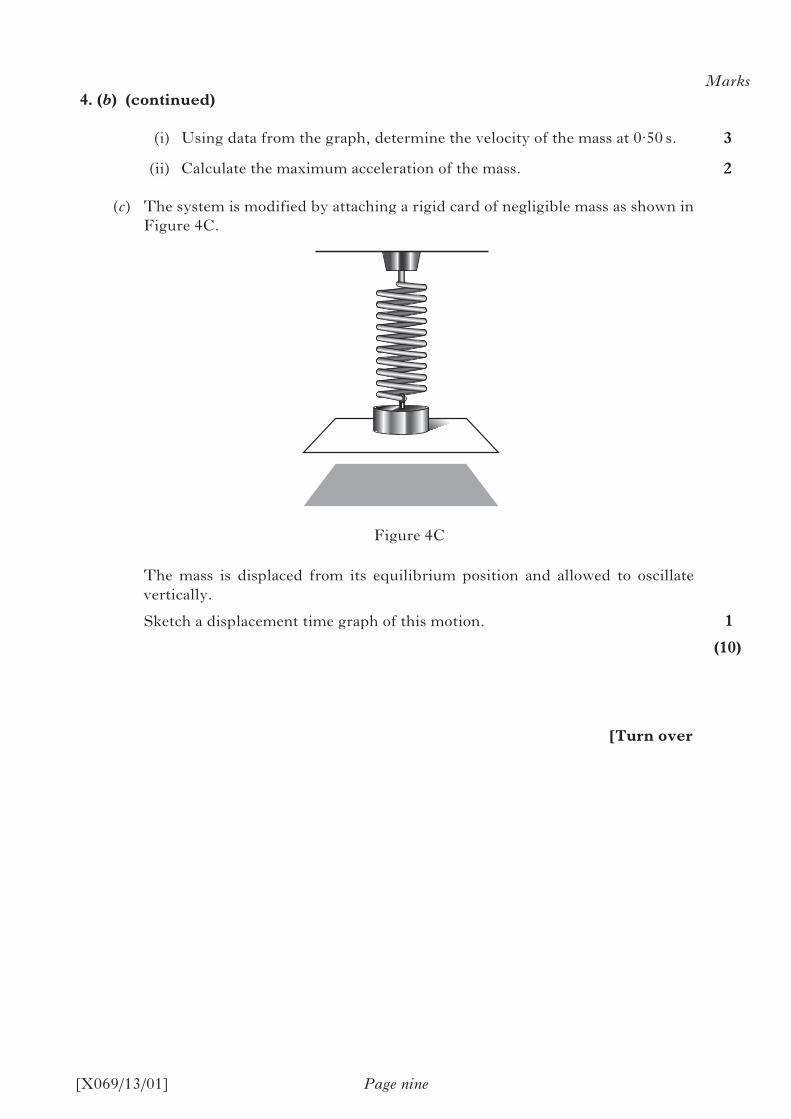
(c) The system is modified by attaching a rigid card of negligible mass as shown in Figure 4C.
The mass is displaced from its equilibrium position and allowed to oscillate vertically.
Sketch a displacement time graph of this motion.
[Turn over
Figure 4C
[X069/13/01]
Marks
2
2
2
(6)
Page ten
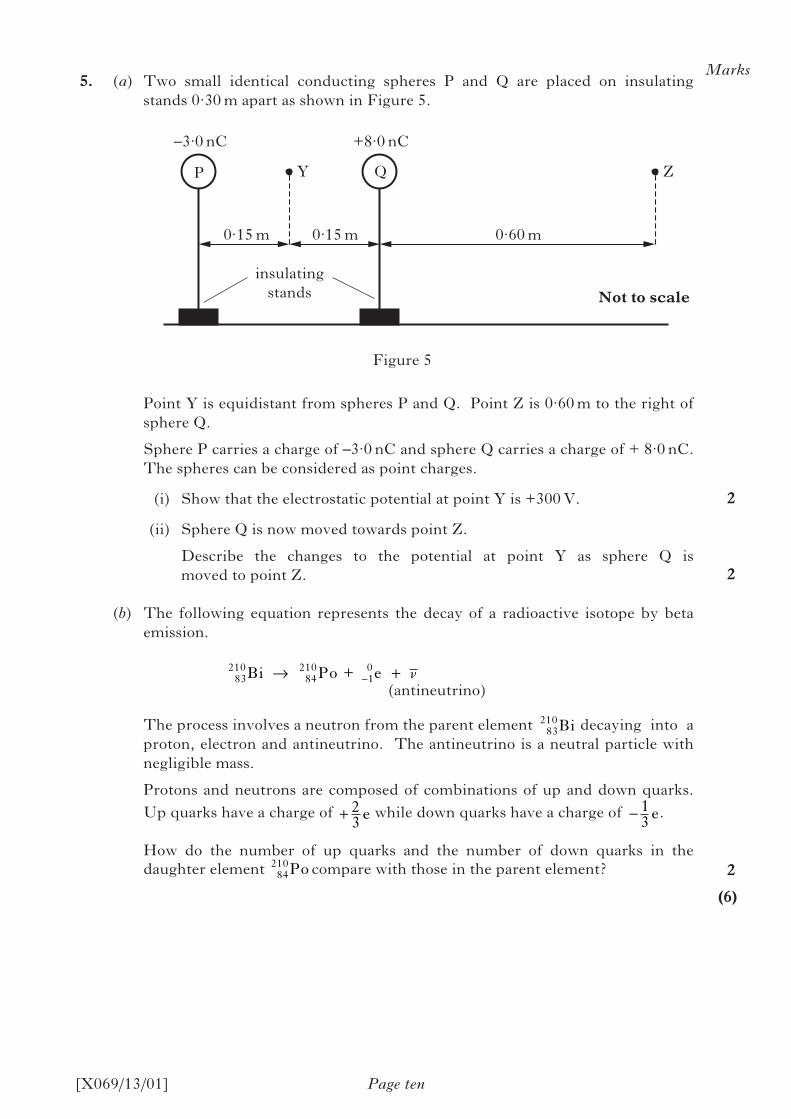
5. (a) Two small identical conducting spheres P and Q are placed on insulating stands 0·30 m apart as shown in Figure 5.
Point Y is equidistant from spheres P and Q. Point Z is 0·60 m to the right of sphere Q.
Sphere P carries a charge of –3·0 nC and sphere Q carries a charge of + 8·0 nC. The spheres can be considered as point charges.
(i) Show that the electrostatic potential at point Y is +300 V.
(ii) Sphere Q is now moved towards point Z.
Describe the changes to the potential at point Y as sphere Q is moved to point Z.
(b) The following equation represents the decay of a radioactive isotope by beta emission.
83210
84210
10Bi Po e + → +− ν
(antineutrino)
The process involves a neutron from the parent element decaying into a proton, electron and antineutrino. The antineutrino is a neutral particle with negligible mass.
Protons and neutrons are composed of combinations of up and down quarks.
Up quarks have a charge of while down quarks have a charge of .
How do the number of up quarks and the number of down quarks in the daughter element 84
210Po compare with those in the parent element?
Figure 5
83210Bi
–3·0 nC +8·0 nC
0·15 m 0·15 m 0·60 m
insulatingstands
Y ZP Q
Not to scale
+ 23 e − 1
3 e

[Turn over for Question 6 on Page twelve
DO NOT WRITE ON THIS PAGE
[X069/13/01] Page eleven

[X069/13/01] Page twelve
6. (a) A teacher investigates the electric field between two parallel metal plates X and Y using the apparatus shown in Figure 6A.
The plates are connected to a 5·0 kV supply and are separated by a distance d.
A calibrated flame probe and voltmeter measure the potential relative to plate X. The probe is placed at different points between the plates. The distance from plate X and the potential at each point are measured.
The results are used to plot the graph shown in Figure 6B.
Figure 6A
+5·0 kV
5·0 kV
metre stick
power supply
V
+ –
dplate Y
flame probe
gas supply
0 V
plate X

[X069/13/01]
Marks
1
2
2
1
Page thirteen
6. (a) (continued)
(i) The electric field strength in the region between the plates is considered to be uniform. Explain the meaning of the term uniform electric field.
(ii) Using information from the graph, determine the electric field strength between the plates.
(iii) Calculate the separation d of the plates.
(iv) In theory the best fit line for this graph should pass through the origin. Suggest why the line on the graph in Figure 6B does not pass through the origin.
[Turn over
Figure 6B
4·0
3·5
3·0
2·5
2·0
1·5
1·0
0·5
00 20 40 60 80 100 120 140 160
distance from plate X/mm
pote
ntia
l rel
ativ
e to
pla
te X
/kV

[X069/13/01]
Marks
4
2
(12)
6. (continued)
(b) In an experiment to investigate the deflection of alpha particles in an electric field a potential difference of 2·0 kV is applied across two parallel metal plates.
An alpha particle moving horizontally at 1·6 × 107 m s–1 enters the region between the plates. The alpha particle is deflected vertically by a distance sv as shown in Figure 6C.
An extract from the notes on the experiment is shown in Figure 6D.
(i) Calculate the vertical deflection sv of the alpha particle.
(ii) The separation of the parallel plates is now increased. An alpha particle enters the electric field at the same point and with the same velocity as before. How does the magnitude of the vertical deflection sv compare with the value calculated in part (b)(i)?
You must justify your answer.
Figure 6C
Figure 6D
Page fourteen
alphaparticle
0 V
150 mm
8·0 mm
+2·0 kV
sv
Not to scale
sh = vht
0·15 = 1·6 × 107 × t t = 9·4 × 10–9 s
sh = 150 mm = 0·15 m vh = 1·6 × 107 m s–1
V = 2 kV = 2 × 10³ V d = 8 mm = 8 × 10⁻³ m
Ed
V V m= =×
= ⋅ ×−−2000
8 102 5 10
35 1

[Turn over for Question 7 on Page sixteen
DO NOT WRITE ON THIS PAGE
[X069/13/01] Page fifteen

[X069/13/01]
Marks
1
2
2
Page sixteen
Figure 7A
Figure 7B
7. (a) A proton moving at constant speed v enters a uniform magnetic field of induction B as shown in Figure 7A.
Within the field the proton follows a circular path of radius r.
(i) Explain why the proton follows a circular path.
(ii) Show that the radius of the path r is given by
r vB
= ⋅ × −1 05 10 8.
(b) Another proton moving at the same speed v enters the magnetic field at an angle θ to the magnetic field lines as shown in Figure 7B.
Explain the shape of the path followed by this proton in the magnetic field.
B
v
proton
B
v
θ
proton

Marks
3
1
2
(11)
7. (continued)
(c) The solar wind is a stream of charged particles, mainly protons and electrons, released from the atmosphere of the Sun. Many of these particles become trapped by the magnetic field of the Earth.
Some of the trapped particles move back and forth in helical paths between two magnetic mirror points. The path followed by one particular proton is shown in Figure 7C.
The speed of the proton remains constant at 1·2 × 107 m s–1 as it travels along its helical path from one magnetic mirror point to the other.
(i) The proton oscillates between the two mirror points with a frequency of 4·0 Hz. Calculate the distance that the proton travels in moving from one mirror point to the other.
(ii) Explain why the radius of the helical path followed by the proton increases as it moves from point X to point Y as shown in Figure 7C.
(iii) At point X the radius of curvature of the helix for this proton is 1·0 × 104 m. Calculate the strength of the Earth’s magnetic field at this point.
Page seventeen
Figure 7C
[X069/13/01]
[Turn over
helical path of proton
mirror points
magnetic field line
Earth
X
Y

[X069/13/01]
Marks
2
2
8. (a) A student investigates how the current in an inductor varies with the frequency of a voltage supply.
(i) Draw a suitable labelled circuit diagram of the apparatus required to carry out the investigation.
(ii) The student collects the following data.
Frequency/Hz 40 60 80 100 120
Current/mA 148 101 76·0 58·2 50·0
Determine the relationship between the supply frequency and current for this inductor.
(b) An inductor of inductance 3·0 H and negligible resistance is connected in a circuit with a 12 Ω resistor and supply voltage Vs as shown in Figure 8A.
The datalogger is set to calculate the back emf across the inductor.
Switch S is initially open.
Switch S is now closed. Figure 8B shows how the back emf across the inductor varies from the instant the switch is closed.
Page eighteen
Figure 8A
3·0 H12 Ω
to datalogger
SVs

[X069/13/01]
8. (b) (continued)
(i) Determine the voltage across the resistor at t = 0·20 s.
(ii) Calculate the rate of change of current in the circuit at t = 0·40 s.
(iii) State why the magnitude of the back emf is greatest at t = 0.
(c) The switch is opened and the 3·0 H inductor is replaced by an inductor of greater inductance.
The sketch in Figure 8C represents the graph shown in Figure 8B.
Copy this sketch and add a line to show how the back emf across the new inductor varies with time from the instant the switch is closed.
Page nineteen
Marks
2
2
1
2
(11)
[Turn over
Figure 8B
Figure 8C
1·4 time/s
back emf/V–20
0
back emf/V
–5·0
–10·0
–15·0
–20·0
0·20 0·40 0·60 0·80 1·00 1·20 1·400·00
time/s
0·0

[X069/13/01] Page twenty
9. (a) A long straight conductor AB carries a current of 0·60 A from B to A as shown in Figure 9A.
Calculate the magnitude of the magnetic induction at point P, a distance of 0·30 m from the conductor.
(b) A second conductor CD, carrying a current of 1·80 A, is placed parallel to AB as shown in Figure 9B.
At this separation the magnetic induction at point P is zero.
(i) Explain why the magnetic induction at point P is zero.
(ii) Calculate the distance of conductor CD from conductor AB.
Figure 9A
Marks
2
1
2
(5)
Figure 9B
0·30 m
0·60 A
A
B
P
0·30 m
0·60 A 1·80 A
A C
B D
P
Not to scale

[X069/13/01] Page twenty-one
Marks
1
2
1
1
1
2(8)
10. A police officer is conducting vehicle speed checks using a radar based monitoring device as shown in Figure 10. A car emitting sound of frequency 500 Hz drives past the officer at constant velocity.
(a) (i) Describe how the frequency of the sound heard changes as the car passes the officer.
(ii) At one instant the frequency heard by the officer is 480 Hz.
Calculate the speed of the car at this instant.
(iii) Describe the difference in the frequency heard by the officer if the car had been:
(A) decelerating on its approach to the officer;
(B) accelerating away from the officer.
(b) The radar based speed monitoring equipment uses microwaves to determine the speed v of a vehicle. The microwaves are transmitted towards the vehicle, and the reflected waves are detected by the equipment.
The expression for the frequency change ∆f between the transmitted and received frequencies is given as
∆fvf
c vT = −
2( )
.
The transmitted frequency, fT, of the microwaves is 10·5 GHz.
(i) Explain why this expression can be approximated by
∆fvfc
T = 2.
(ii) The frequency change is 880 Hz for an approaching vehicle.
Calculate the speed of the vehicle.
Figure 10
[Turn over

[X069/13/01] Page twenty-two
Marks
1
3
3
2(9)
11. A student carries out a Young’s double slit experiment in order to determine the wavelength of monochromatic red light.
The student uses the apparatus shown in Figure 11 to produce an interference pattern on the screen.
Figure 11
double slit
screen
red light
D
L
The double slit separation d is measured using a travelling microscope. The distance D between the double slit and the screen is measured using a steel measuring tape. The length L of the interference pattern is measured using a plastic ruler.
The student records the following data.
D = (4·250 ± 0·005) m L = (67 ± 2) mm d = (0·25 ± 0·01) mm
(a) (i) State why it is possible to produce an interference pattern using only a single light source.
(ii) Calculate the wavelength of the light from the source.
(iii) Calculate the absolute uncertainty in the wavelength.
(b) The student repeats the experiment with the same apparatus but uses a monochromatic blue light source. D remains fixed.
State the effect this will have on the percentage uncertainty in the calculated value for the wavelength of the blue light.
You must justify your answer.
[END OF QUESTION PAPER]

[BLANK PAGE]
DO NOT WRITE ON THIS PAGE

ACKNOWLEDGEMENTS
Question 1 – Image of Aerial view of CERN showing circumference on the Large Hadron Collider.
SQA has made every effort to trace the owners of copyright materials reproduced in this question paper, and seek permissions. We will be happy to incorporate any missing acknowledgements. Please contact [email protected].
Question 4(b) Fig 4A – cobalt88/shutterstock.com
Question 10 – Photograph by Andrew Parsons is taken from “Target: Traffic officer using a laser speed gun,” from The Mirror, 17th April 2012. Reproduced by permission of PA Images.


![X069/101 Total Marks · 5/1/2007 · would expect to see if the curved reflector was removed. [X069/101] Page eleven Marks 1 2 2 DO NOT WRITE IN THIS MARGIN [Turn over mobile phone](https://static.fdocuments.net/doc/165x107/600eddb880a8a27cb94ebe56/x069101-total-marks-512007-would-expect-to-see-if-the-curved-reflector-was.jpg)

![*X069/301* - fizzicsmrmackenzie.co.uk/wp-content/uploads/pastpapers/H...[X069/301] Page four SECTION A Answer questions 1–20 on the answer sheet. 4. The total mass of a motorcycle](https://static.fdocuments.net/doc/165x107/5e93f9aedbfcd56e9a46e2f1/x069301-x069301-page-four-section-a-answer-questions-1a20-on-the-answer.jpg)


![SERV1857 785C (1HW), 785D (MSY), 789C 2BS)_TXT[1].pdf](https://static.fdocuments.net/doc/165x107/5695d0e01a28ab9b029439a1/serv1857-785c-1hw-785d-msy-789c-2bstxt1pdf.jpg)


![제18회... · 2020. 1. 28. · [2] Gliese 581g는 (Gliese 581 별 주위를 도는) 행성계의 일원으로, 태양계](https://static.fdocuments.net/doc/165x107/6005927d7d68d63ad006234b/oe18oe-2020-1-28-2-gliese-581ge-gliese-581-e-oee-ee.jpg)
