X Sina Mexico Nov 2010 Alberto Nunes Final
42
X Simposio Internacional de Nutrición Acuícola Monterrey, Nuevo Leon, Mexico November 9, 2010 – Session 3 Meeting the Challenge of no Fishmeal in Practical Diets for Litopenaeus vannamei : Case Studies from LABOMAR, Brazil Alberto J.P. Nunes Associate Professor
-
Upload
alberto-nunes -
Category
Business
-
view
1.056 -
download
1
Transcript of X Sina Mexico Nov 2010 Alberto Nunes Final
X Simposio Internacional de Nutrición AcuícolaMonterrey, Nuevo Leon, MexicoNovember 9, 2010 – Session 3
Meeting the Challenge of no Fishmeal in Practical Diets for Litopenaeus vannamei: Case Studies from LABOMAR, Brazil
Alberto J.P. NunesAssociate Professor

Aquaculture: largest consumer of fishmeal In 2006, aquafeeds used 3.7 million MT of fishmeal, 68.2% of the
estimated global production
23,851
60,014
15,072
45,557
2006 2020E
Production of finfish and crustaceans*Total fed production
*MT x 1,000. Excludes filter-feeding fish
¶ Source: Tacon and Metian, 2008
In 10 years, fed-raised finfish and crustaceans will account for ¾ of world production
(63%)
(76%)
MT x 1,000
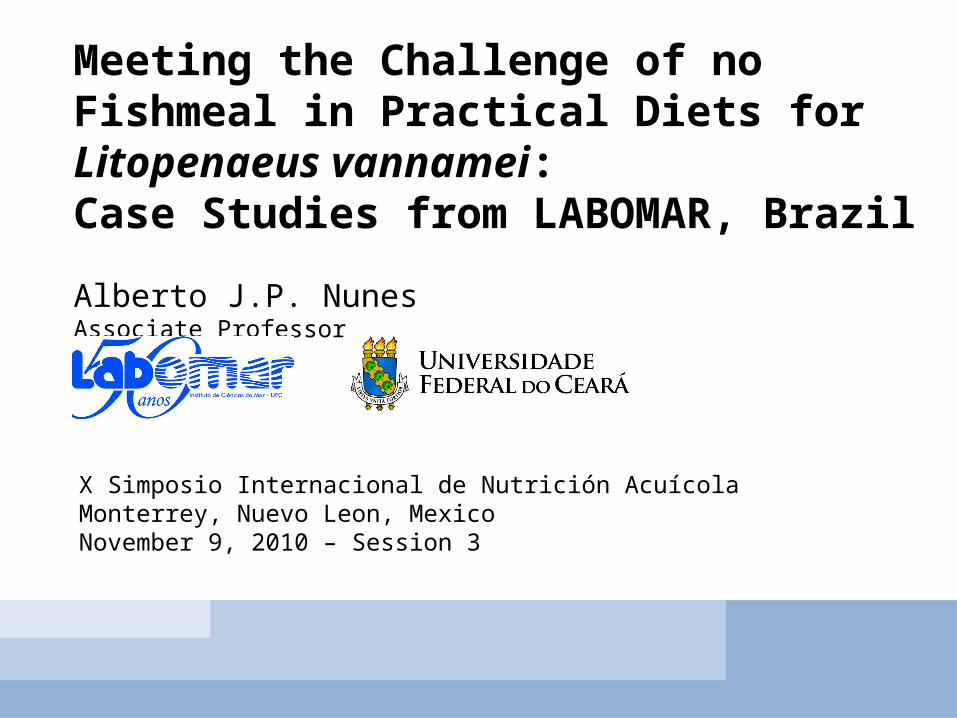
Fishmeal use is reducing in shrimp feeds Shrimp are the largest consumer of fishmeal within the
aquaculture industry, ahead of marine fish and salmon
0.0
0.5
1.0
1.5
2.0
2.5
0
1,000
2,000
3,000
4,000
5,000
6,000
7,000
8,000
9,000
10,000
1995 1996 1997 1998 1999 2000 2001 2002 2003 2004 2005 2006 2007 2010 2015 2020
Fish IN : Fish OUT Ratio
Farm-raised marine shrimp production
Pelagic forage fish equivalent
Projections
FIFOMT x 1,000
Over the past 15 years, fishmeal inclusion in shrimp feeds reduced from 28% (1995) to 12% (2010). FIFO more efficient than salmon, trout, eel and marine fish¶ .
1.9
0.3
¶ So
urce
: Tac
on a
nd M
etian
, 200
8

Drivers for fishmeal reduction
0
200
400
600
800
1,000
1,200
1,400
1,600
1,800
2,000
Jan-2005 Jan-2006 Jan-2007 Jan-2008 Jan-2009 Jan-2010
Year
Soybean meal
Fishmeal
CIF
Pric
e (U
SD/M
T)
Five-year market price (2005-2010) for fishmeal and soybean meal. Source: Oil World.
Fishmeal (64/65% CP, CIF Hamburg). Soybean meal (pellets 44/45% CP Argentina, CIF Rotterdam).
(1) PRODUCTIONcapture fisheries production remains stagnant compared to an 8.8% annual growth rate in aquaculture output(2) PRICESfishmeal prices have risen significantly compared to other agricultural commodity protein ingredients(3) SUSTAINABILITYas shrimp farming moves into more intensive systems and production rises, there is a growing demand for formulated diets dependent on static supplies of fish meal

Farmers are raising a less nutrient-dependent shrimp species
Production of L. vannamei increased 16x in 8 years (2000 vs. 2008) compared to 14% for the tiger shrimp
0
500
1,000
1,500
2,000
2,500
3,000
3,500
80 81 82 83 84 85 86 87 88 89 90 91 92 93 94 95 96 97 98 99 00 01 02 03 04 05 06 07 08
Harvest (MT x 1,000)Grand Total
Litopenaeus vannamei
Penaeus monodon
Other species
Source: FAO (2010)
2,259 MT66%
722 MT21%
145 MT13%
631 MT56%
1,135 MT
3,399 MT

About aquaculture at LABOMAR, Brazil 50-year old marine
sciences institution located in NE Brazil
Part of the Federal University of the State of Ceará
Owns 5-ha facility where applied research on reproduction, nutrition, disease and genetics of marine fish and crustaceans is carried out
Lane snapper, Lutjanus synagris
Mutton snapper, Lutjanus analis
Cobia, Rachycentron canadumFat and common snook, Centropomus parallelus and C. undecimalis
OUTDOOR SYSTEM (Marine Finfish)

Rearing system: shrimp
Clear waterRound tanks of 500-L volume 0.57 m2 bottom area12-h sand filtering
Green water Round tanks of 1.000-L volume1.02 m2 bottom area25% weekly water exchange
CLEAR WATER
GREEN WATER
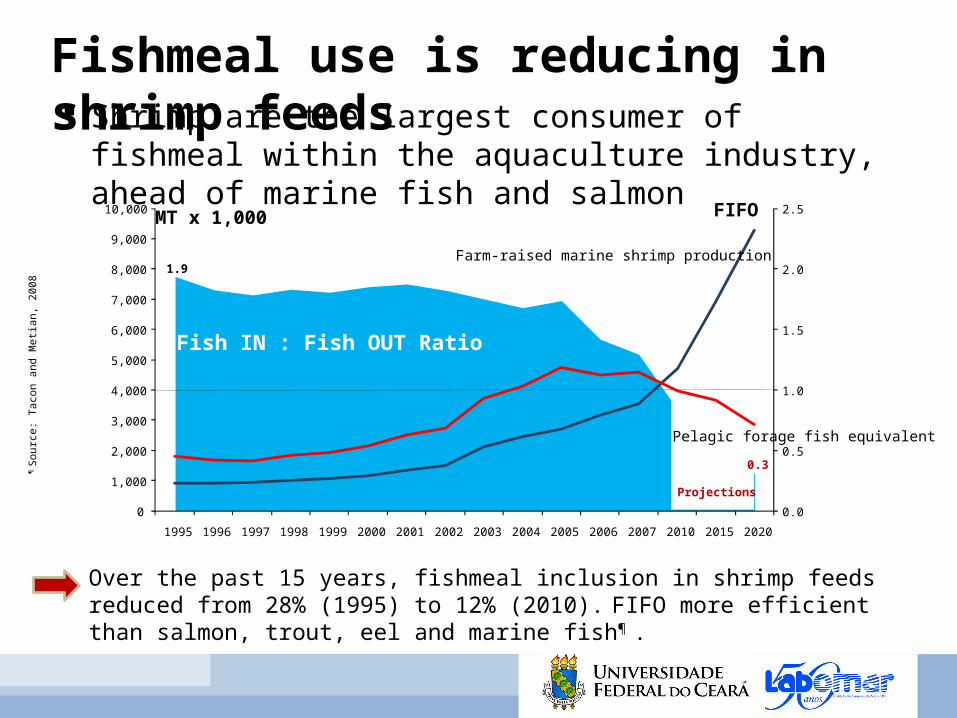
Shrimp rearing: standard protocol
1 2 3
4 5 6
1. PL10 rearing: 2 PLs/L – 30 -40 days2. Juvenile stocking (2-4 g shrimp)
Green water: 40 – 70 shrimp/m2
Clear water: 70 - 100 shrimp/m2
4. Fed twice a day on a consumption basis5. Meals calculated individually6. Shrimp samples every 3.5 weeks7. Harvest after 10 weeks (10 – 20 g shrimp)

Sources of Rendered Animal Protein Have Low Stimulatory Power for L. vannamei
Attractant*CONMBMSMFMPOFMBOBMFOFSChi-square P
+choices (%)*
2.9g
54.5af
59.1ad
75.6a
65.9ac
45.7abcd
25.7b
58.5ae
<0.001
% rejection100.08.30.00.00.025.044.48.3---
*Values in the column which do not share a same superscript are statistically different between them by the z-test (P<0.05);
*control (CON) without SEM; meat and bone meal (MBM); squid meal (SM); fishmeal–Peruvian origin (FMPO); fishmeal–Brazilian origin (FMBO); blood meal (BM); fish oil (FO); fish solubles (FS)
Source: Nunes et al 2006. Aquaculture, 260: 244-254.
Y-maze system to evaluate feeding effectors in shrimp

Replacing Fishmeal by Ingredients with Low Feeding Stimulation
Natural and synthetic feeding effectors
Meat mealSoybean mealFish meal
~ +
+

Feeding Effectors not a Feed Perfume
Photo credit: Alberto Nunes
(1) 80%-crude protein (CP) vegetable dried biomass (VDB80); (2) 68%-CP vegetable dried biomass + glutamate + betaine (VDB68); (3) complex of amino acids (alanine, valine, glycine, proline, serine, histidine, glutamic acid, tyrosine and betaine) with enzymatically digested bivalve mollusk (CAA); (4) condensed fish soluble protein (CFSP); (5) squid liver meal (SLM); (6) betaine (Bet); (7) dried fish solubles - low biogenic amines (DFSLB); (8) dried fish solubles - high biogenic amines (DFSHB); (9) whole squid protein hydrolysate (WSPH); **Soybean meal = experimental control
Evidence that AA pools are better attractants than isolated ones
0,0
10,0
20,0
30,0
40,0
50,0
60,0
70,0
80,0
CON VDB80 VDB68 CAA CFSP SLM Bet DFSLH DFSHH WSPH
High content of water-soluble AA. Rich in water soluble substances with boosted feeding stimuli
Whole squid is an effective attractant. Protein hydrolysis process can promote even better responses
Supplementation of vegetable sources with certain amino acids (glutamate and betaine) may prove useless to stimulate feeding responses
% rejection % +choices
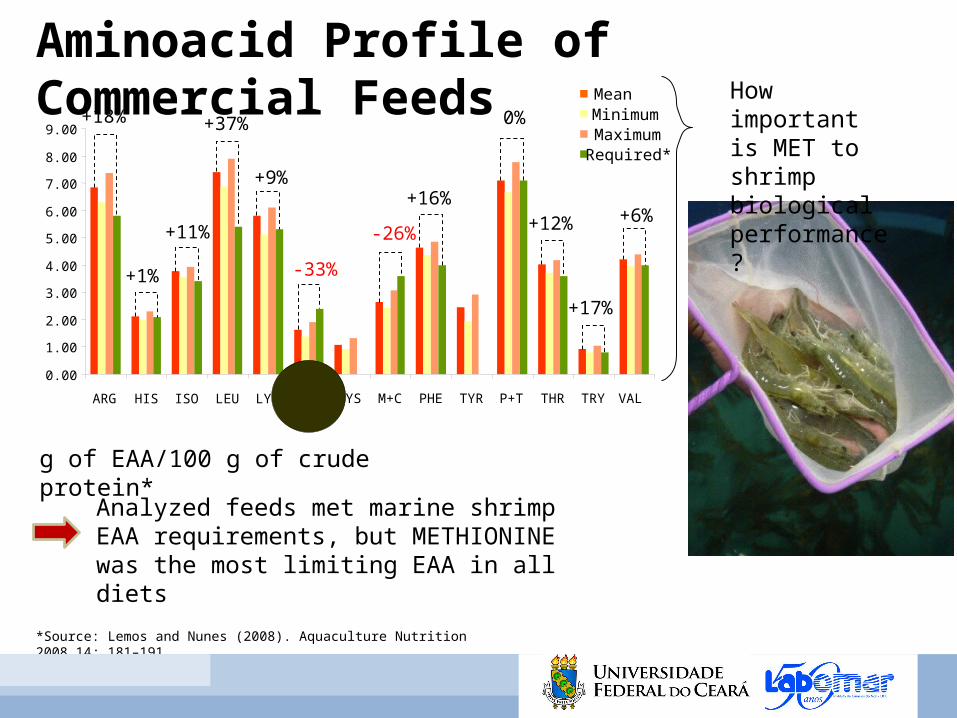
Aminoacid Profile of Commercial Feeds
0.00
1.00
2.00
3.00
4.00
5.00
6.00
7.00
8.00
9.00
MeanMinimumMaximumRequired*
ARG HIS ISO LEU LYS MET CYS M+C PHE TYR P+T THR TRY VAL
+18%
+1%
+11%
+37%
+9%
-33%
-26%
+16%
0%
+12%
+17%
+6%
Analyzed feeds met marine shrimp EAA requirements, but METHIONINE was the most limiting EAA in all diets
How important is MET to shrimp biological performance?
g of EAA/100 g of crude protein*
*Source: Lemos and Nunes (2008). Aquaculture Nutrition 2008 14; 181–191

Methionine Crucial to Growth Performance
2.75 (0.49)2.56 (0.37)2.80 (0.41)2.75 (0.63)FCR
342.9ab (71.5)252.2a (50.0)286.2a (68.0)Biomass gain (g)
915.4c (32.7)879.7c (62.0)691.9b (55.9)755.9a (23.6)Feed cons. (g)
0.73a (0.14)0.56a (0.10)0.63a (0.13)Growth (g/week)
0.60ab (0.13)0.61ab (0.10)0.44a (0.09)0.50a (0.12)Yield (Kg/m2)
93.8a (2.18)81.9b (9.26)91.5a (5.10)92.7a (1.94)Survival (%)
T6T4T3
Performance of L. vannamei in clear water after 56 days of rearing fed commercial diets. Temp. 29.5 C; sal. 33.4 ‰; stocking density. 114 ind./m2; initial weight 3.28 (± 0.31). Source: Lemos and Nunes (2008). Aquaculture Nutrition 2008 14; 181–191.
T5
0.91b (0.04)
349.1ab (58.7)
2.26 (0.44)
444.1b (81.3)
977.9d (31.6)
0.98b (0.14)
0.78b (0.14)
90.8a (3.32)
T8
2.05 (0.27)
439.2b (64.8)
887.9c (23.7)
0.97b (0.13)
0.77b (0.11)
91.2a (2.31)
T7Parameters
371 (1.2)1.38
0.51%
Crude ProteinMet. (g/100 CP)Met (%, dw)
• High correlation between shrimp growth rate and methionine levels (R2 = 0.73)• Higher growth achieved when feed showed:
1. Lower number of EAA below recommended levels2. Methionine: 1.70 -1.75 g/100 g of crude protein3. Lysine: > 6.0 g/100 g of crude protein4. Methionine+cystine: > 2.68 g/100 g of crude protein
348 (0.9)1.47
0.51%
361 (0.4)1.91
0.69%
350 (1.2)1.46
0.51%
356 (0.1)1.75
0.62%
359 (1.3)1.73
062%

Intact methionine affects performance
Ingredient (%) 80 A 70 A 60 ASoybean meal, 46% 32.0 33.3 30.3Wheat flour 25.0 25.0 25.0Fishmeal, Anchovy 13.0 7.3 0.0Fishmeal, by-catch 10.0 10.0 5.1Corn gluten meal 5.0 5.0 10.4Rice, Broken 3.7 1.8 1.8Dicalcium Phosphate 3.6 3.2 2.3Fish oil 2.8 2.3 0.4Lecithin, Fluid 1.7 1.9 2.2Salt 1.0 1.0 1.0Vitamin-Mineral Pmx 1.0 1.0 1.0Pegabind (Pellet Binder) 0.5 0.5 0.5Magnesium Sulfate 0.16 0.00 0.00Potassium Chloride 0.14 0.00 0.00Cholesterol 0.12 0.11 0.11Stay C 0.03 0.03 0.03Commercial attractant 0.2 0.3 0.4Meat and bone meal 0.0 7.2 19.6
Formula cost (US$/MT) 658 593 505
Lower aminoacid levels
Ingredient (%) 80 A 70 A 60 ACrude Protein 35.50 35.50 35.50Crude Fat 8.00 8.50 8.50Crude Fiber 1.86 1.96 1.84Ash 11.94 12.57 13.27
Lysine 1.85 1.72 1.41Met+Cys 1.09 1.01 0.93Methionine 0.67 0.59 0.50
-11.0% -33.3%Cost savings in formulation

AA Profile Significantly ImpactsGrowth and FCR
72-day rearing trial with L. vannamei in indoor tanks (clear water) at LABOMAR, Brazil.
Survival %91.2 ± 4.8
93.0 ± 3.8
91.6 ± 1.5
NS
Yield (g/m2)884 ± 74.9
1,094 ± 192.0
1,085 ± 78.0
NS
Growth (g/wk)0.98 ± 0.06 a1.17 ± 0.13 a1.19 ± 0.10 b
< 0.05
Weight In. (g)4.14 ± 0.31
3.93 ± 0.16
4.09 ± 0.46
NS
Feeds60A70A80AANOVA P
Weight Fn. (g)14.3 ± 0.64 a
16.0 ± 1.39 ab16.3 ± 1.12 b
< 0.05
FCR2.75 ± 0.17 b2.30 ± 0.24 a2.47 ± 0.07 a
< 0.05
Initial Stocking Density:57 shrimp/tank or
100 shrimp/m2
Feeds60A70A80AANOVA P

Fifty 500 L clear water tanks: 10 replicate tanks per diet
40 shrimp/tank: 70 animals/m2
Started with juveniles of 2.22 ± 0.19 g (n = 50) in wet body weight
Two harvests: 72 days and 96 days (stress event)
Five diets prepared with laboratory equipment
Experimental Design
*84% 2-hydroxy-4-(methylthio)butanoic acid (HMTBa)
NV_B
NV50_C+
NV50_C-NV100_C+
NV100_C-
MERA™ Met Ca*
NV_B: basal diet with 150 g/kg of Anchovy fishmeal (FML)NV50_C+: positive control diet with 50 g/kg of FML + 1g/kg MERA™ Met CaNV50_C-: negative control diet with 50 g/kg of FML and no MERA™ Met CaNV100_C+: positive control diet without FML + 2 g/kg MERA™ Met CaNV100_C-: negative control diet without FML and no MERA™ Met Ca

Ingredient (g/kg, as is) NV_B NV50_C+ NV50_C- NV100_C+ NV100_C-Soybean meal 350.0 457.6 450.0 487.0 485.2Wheat flour 235.6 217.0 221.7 210.0 210.0Fish meal, Anchovy 150.0 75.0 75.0 0.0 0.0Poultry by-product meal 60.0 60.0 65.7 60.0 60.0Rice, broken 50.0 21.9 21.8 0.0 0.0Soy protein concentrate 43.1 30.0 30.0 93.3 96.4Squid meal, whole 0.0 20.0 20.0 20.0 20.0Fish oil 15.0 30.0 30.0 44.0 44.0Soybean oil 19.4 8.5 7.9 0.0 0.0MERA™ Met Ca1 0.0 1.0 0.0 2.0 0.0L-lysine 0.0 0.0 0.0 0.4 0.3Other micro ingredients 76.8 79.8 77.8 83.3 84.2Proximate Composition (g/kg, dry matter basis)Moisture 92.6 95.7 91.0 88.1 92.9Crude protein 392.2 383.5 391.8 393.2 406.6Lipids 70.5 75.9 70.7 78.0 60.7Total fiber 22.7 26.6 28.3 27.1 31.7Ash 98.7 97.6 97.9 95.5 88.4Amino Acids (g/kg, dry matter basis)HMTBa 0.0 0.65 0.0 1.14 0.0Methionine 6.0 5.4 5.2 4.5 4.8Cystine 5.4 5.3 5.4 5.6 5.7Methionine + cystine 11.4 10.7 10.6 10.1 10.5Lysine 19.7 20.4 18.8 19.4 22.4Formulation Cost2 -- 11.7% 12.5% 22.2% 23.2%
1 84% 2-hydroxy-4-(m
ethylthio)butanoic acid (HM
TB
a); 2%
reduction in formula cost in com
parison to the control diet NV
_B

No statistical differences in shrimp final survival, yield and FCR among harvested shrimp fed the different experimental diets
Overall Performance% Survival93.8 ± 6.791.5 ± 5.392.3 ± 4.991.5 ± 3.692.5 ± 5.392.3 ± 5.1
DietNV_BNV50_C+NV50_C-NV100_C+NV100_C-Mean
Yield (g/m2)849 ± 72
841 ± 119768 ± 81776 ± 65806 ± 64808 ± 86
FCR2.13 ± 0.142.27 ± 0.232.13 ± 0.202.21 ± 0.172.11 ± 0.172.17 ± 0.19
78.3 ± 12.182.5 ± 7.182.0 ± 9.682.3 ± 5.382.0 ± 4.081.4 ± 8.0
526 ± 72563 ± 88519 ± 61534 ± 31552 ± 51539 ± 70
3.26 ± 0.523.23 ± 0.333.11 ± 0.453.09 ± 0.222.94 ± 0.203.12 ± 0.37
NV_BNV50_C+NV50_C-NV100_C+NV100_C-Mean
72 d
ays
96 d
ays
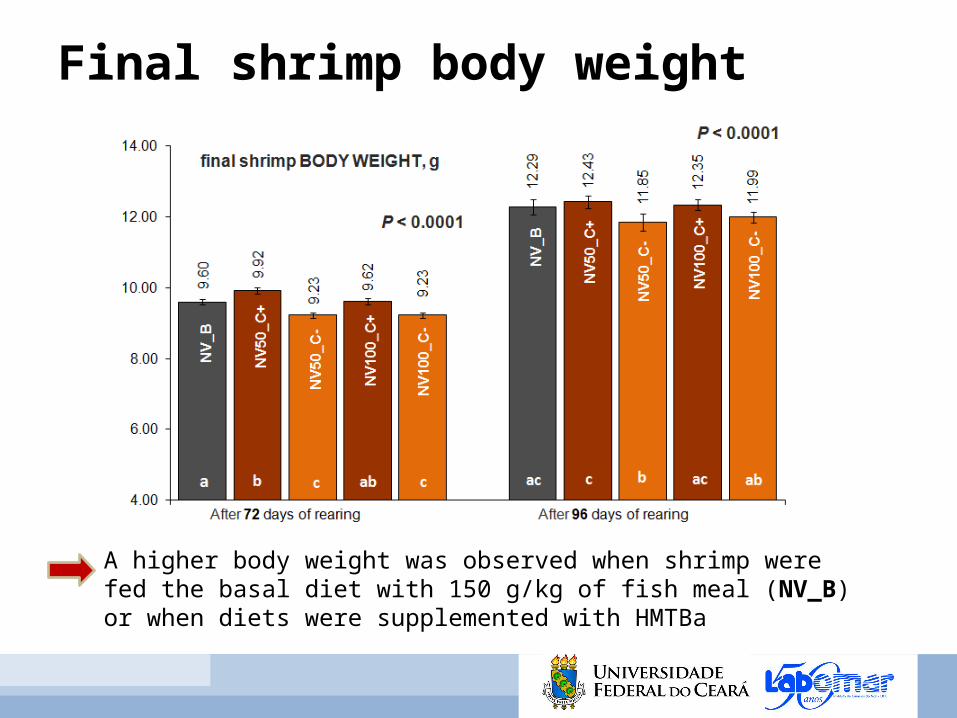
A higher body weight was observed when shrimp were fed the basal diet with 150 g/kg of fish meal (NV_B) or when diets were supplemented with HMTBa
Final shrimp body weight

On day 72, a higher weekly growth rate was found for shrimp fed either the basal diet, NV_B or diets NV50_C+ and NOV100_C+.
Weekly shrimp growth

The reduction of fishmeal in experimental diets had no detrimental effect over shrimp feed intake. Indication of a higher feed intake in diets with MERA™ MetCa as seen for NV50_C+.
Feed intake

The addition of poultry by-product meal, squid meal and HMTBa may have helped prevent reductions in palatability typically associated with reductions in fish meal content.
Feed attractability

Fifty 500 L clear water tanks: 6-7 replicate tanks per diet
40 shrimp/tank: 70 animals/m2
Started with juveniles of 2.02 ± 0.51 g (n = 500) in wet body weight
Shrimp reared for 72 days
Eight diets prepared with laboratory equipment
Fishmeal forecast study
Anchovy fishmealSoy protein concentrate
Two sets of diets: (1) 2% fish oil (2) 1% FO Each set varied Anchovy fishmeal, SPC and
SBO inclusionYear 2010: 12% fishmeal (0% replacement)Year 2015: 8.5% fishmeal (30% replacement)Year 2020: 5.0% fishmeal (60% replacement)Year 2025: NO fishmeal (100% replacement)
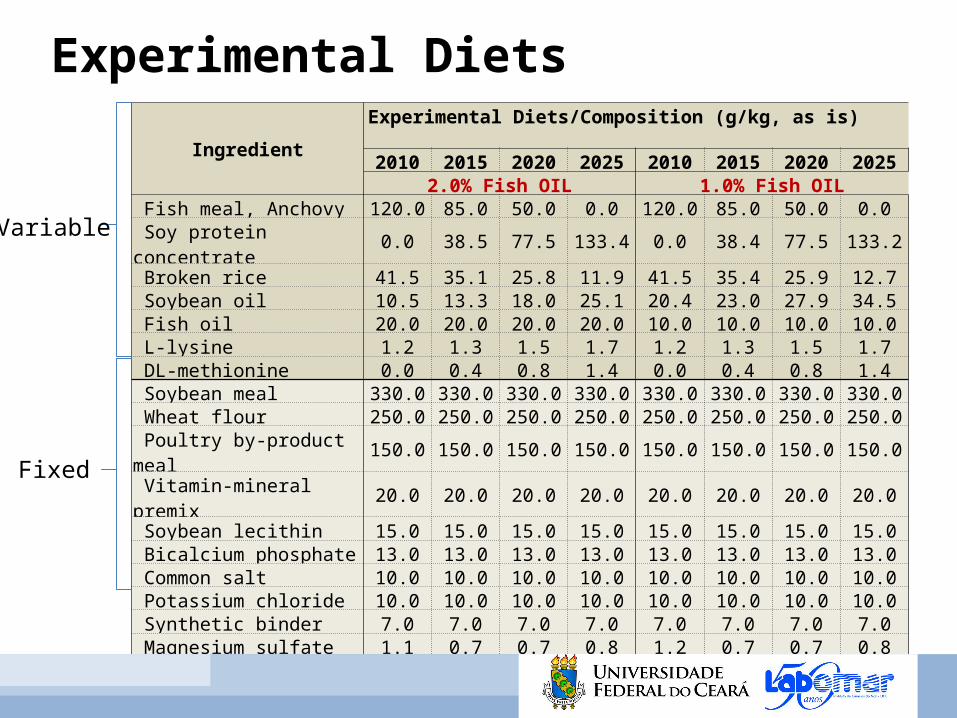
Experimental DietsIngredient
Experimental Diets/Composition (g/kg, as is) 2010 2015 2020 2025 2010 2015 2020 2025
2.0% Fish OIL 1.0% Fish OIL Fish meal, Anchovy 120.0 85.0 50.0 0.0 120.0 85.0 50.0 0.0 Soy protein concentrate 0.0 38.5 77.5 133.4 0.0 38.4 77.5 133.2 Broken rice 41.5 35.1 25.8 11.9 41.5 35.4 25.9 12.7 Soybean oil 10.5 13.3 18.0 25.1 20.4 23.0 27.9 34.5 Fish oil 20.0 20.0 20.0 20.0 10.0 10.0 10.0 10.0 L-lysine 1.2 1.3 1.5 1.7 1.2 1.3 1.5 1.7 DL-methionine 0.0 0.4 0.8 1.4 0.0 0.4 0.8 1.4 Soybean meal 330.0 330.0 330.0 330.0 330.0 330.0 330.0 330.0 Wheat flour 250.0 250.0 250.0 250.0 250.0 250.0 250.0 250.0 Poultry by-product meal 150.0 150.0 150.0 150.0 150.0 150.0 150.0 150.0 Vitamin-mineral premix 20.0 20.0 20.0 20.0 20.0 20.0 20.0 20.0 Soybean lecithin 15.0 15.0 15.0 15.0 15.0 15.0 15.0 15.0 Bicalcium phosphate 13.0 13.0 13.0 13.0 13.0 13.0 13.0 13.0 Common salt 10.0 10.0 10.0 10.0 10.0 10.0 10.0 10.0 Potassium chloride 10.0 10.0 10.0 10.0 10.0 10.0 10.0 10.0 Synthetic binder 7.0 7.0 7.0 7.0 7.0 7.0 7.0 7.0 Magnesium sulfate 1.1 0.7 0.7 0.8 1.2 0.7 0.7 0.8 Vitamin C 0.7 0.7 0.7 0.7 0.7 0.7 0.7 0.7
Fixed
Variable

Nutritional Composition 2010 2015 2020 2025 2010 2015 2020 20252.0% Fish OIL 1.0% Fish OIL
Proximate Compostion (g/kg, dry matter basis) Crude protein 388.1 384.1 393.9 390.8 393.5 384.9 385.9 388.4 Crude fat 99.8 89.5 94.8 97.0 93.0 89.3 93.7 97.8 Crude fiber 14.7 17.3 17.0 19.2 17.9 15.5 13.4 17.4 Ash 104.7 97.6 96.1 88.9 105.6 97.1 94.6 91.3 Calcium 15.9 15.1 14.2 13.0 15.9 15.1 14.2 13.0 Gross energy (MJ/kg) 19.7 19.6 19.9 20.1 19.6 19.8 19.9 20.1 Essential amino acids (g/kg, dry matter basis) Lysine 23.6 24.3 24.3 25.0 23.6 24.1 24.9 25.2 Methionine 7.6 7.5 7.7 7.7 7.2 7.4 7.8 7.9 Cystine 4.1 4.9 4.3 5.1 5.0 5.2 4.3 4.3 Methionine + cystine 11.7 12.0 12.0 12.8 12.2 12.6 101.5 105.7 Essential Fatty Acid (g/kg, dried matter basis) Linoleic (18:2 n-6) 31.9 30.0 33.1 36.7 36.1 35.3 38.2 42.4 Arachidonic (20:4 n-6) 0.5 0.4 0.3 0.3 0.1 0.1 0.2 0.1 Total n-6 PUFA 32.4 30.4 33.4 37.0 36.2 35.4 38.4 42.5 Linolenic (18:3 n-3) 5.2 4.4 4.9 5.2 5.1 4.9 4.7 5.0 Eicosatrienoic (20:3 n-3) 0.5 0.3 0.3 0.3 0.1 0.2 0.2 0.2 Eicosapentaenoic (20:5 n-3) 7.7 5.3 4.2 3.1 1.9 1.8 2.6 1.6 Docosahexaenoic (22:6 n-3) 5.8 4.3 3.5 2.9 1.7 1.6 2.2 2.1 Total n-3 PUFA 19.2 14.3 12.9 11.5 8.8 8.5 9.7 8.9 Total PUFA2 51.6 44.7 46.3 48.5 45.0 43.9 48.1 51.4 n-3/n-6 0.59 0.47 0.39 0.31 0.24 0.24 0.25 0.21
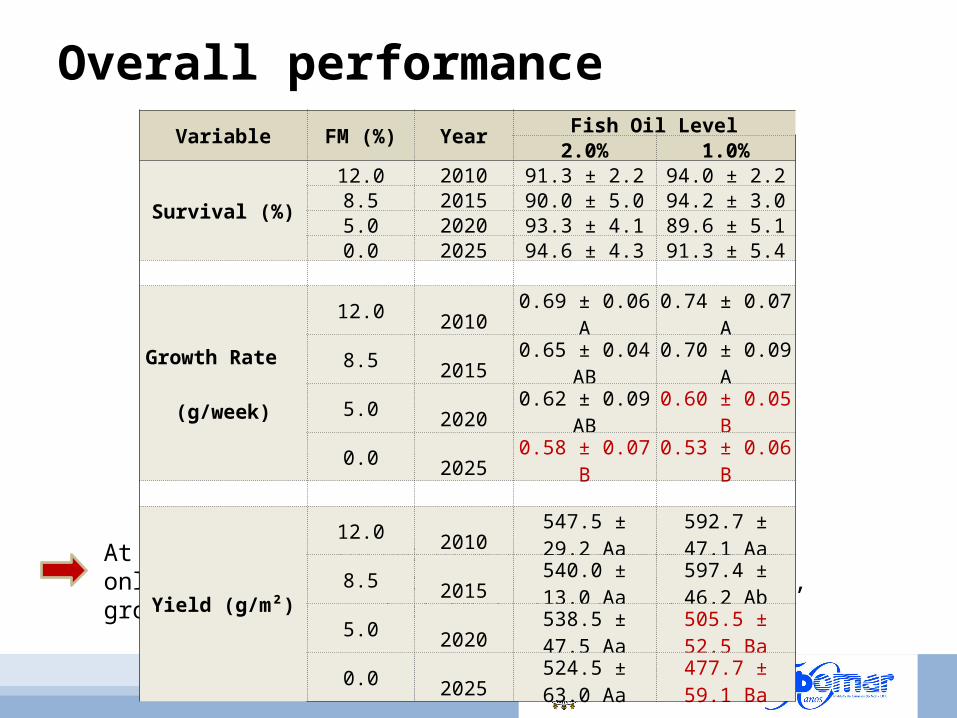
Overall performance
At 2% fish oil, shrimp growth rates were reduced only when diets had not fishmeal. At 1% fish oil, growth rates dropped at 5% fishmeal inclusion.
Variable FM (%) YearFish Oil Level
2.0% 1.0%
Survival (%)
12.0 2010 91.3 ± 2.2 94.0 ± 2.28.5 2015 90.0 ± 5.0 94.2 ± 3.05.0 2020 93.3 ± 4.1 89.6 ± 5.10.0 2025 94.6 ± 4.3 91.3 ± 5.4
Growth Rate (g/week)
12.0 2010 0.69 ± 0.06 A 0.74 ± 0.07 A8.5 2015 0.65 ± 0.04 AB 0.70 ± 0.09 A5.0 2020 0.62 ± 0.09 AB 0.60 ± 0.05 B0.0 2025 0.58 ± 0.07 B 0.53 ± 0.06 B
Yield (g/m²)
12.0 2010 547.5 ± 29.2 Aa 592.7 ± 47.1 Aa8.5 2015 540.0 ± 13.0 Aa 597.4 ± 46.2 Ab5.0 2020 538.5 ± 47.5 Aa 505.5 ± 52.5 Ba0.0 2025 524.5 ± 63.0 Aa 477.7 ± 59.1 Ba

Final shrimp body weight
The lowest possible combinations of dietary inclusion levels of fish meal (FM) and fish oil (FO) level were 5%FM-2%FO (diet 2020) and 8.5%FM-1% FO (diet 2015).

Feed intake
Feed intake was consistent among experimental diets, except when fishmeal was removed in the 1% fish oil diet

FCR
At 1% fish oil, FCR significantly increased, starting at 5% fishmeal and below

Fishmeal, Anchovy
67.65%Protein7.61%
Lipid
24.74%Other
Krill meal
60.10%Protein25.00%
Lipid
14.90%Other
4.07% 1.57%3.04%5.07%5.01%1.92%2.76%2.55%3.51%
EAA (as is)ARGHISISOLEULYSMETPHETHRVAL 6.11%
2.61%3.85%6.61%7.22%2.66%3.81%3.19%3.99%
EAA (as is)ARGHISISOLEULYSMETPHETHRVAL
4.32% TL1.80% TL
EFA (% of total lipid)ƩHUFA n-3ƩHUFA n-6
22.11% TL4.99% TL
EFA (% of total lipid)ƩHUFA n-3ƩHUFA n-6
versus
> 40% phospholipid

Objectives
1. To evaluate the growth performance of juveniles of L. vannamei when fed diets containing Krill meal and Krill oil under partial or full replacement of fishmeal, fish oil, soy lecithin and cholesterol
2. To determine optimum inclusion levels of Krill meal in diets for the white shrimp in regards its growth and economical performance
Major protein and lipid ingredients used in experimental diets for growth trials with L. vannamei

IngredientsDiet composition (g/kg as is)
CLT KM10 KM50 KM110Fish meal, Anchovy 150.0 100.0 50.0 0.0Fish meal, by-catch 37.5 25.0 12.5 0.0Broken rice 130.4 115.6 108.0 113.5Soybean meal 300.0 340.2 338.6 349.4Meat and bone meal 23.1 55.0 100.0 99.5Wheat flour 250.0 250.0 250.0 250.0Fish oil 20.0 15.2 17.7 0.1Soybean lecithin 15.0 15.0 0.0 0.0Krill meal 0.0 10.0 50.0 115.0Cholesterol 1.5 1.5 0.8 0.0Others* 322.5 322.5 322.5 322.5USD/MT** / % Savings 662.8 8.0% 12.8% 8.7%Proximate composition (g/kg dried matter basis)Crude protein 325.5 336.0 327.3 338.6Total lipids 103.8 103.5 107.5 107.5Ash 99.5 98.3 99.5 96.7Crude fiber 1.65 1.49 1.64 2.22Gross energy (kJ/g) 17.5 17.5 16.9 16.8Moisture (% as fed) 11.1 10.7 10.2 8.8
*Others included: 1.5 g/kg magnesium sulfate, 4.0 g/kg potassium chloride, 5.0 g/kg synthetic binder, 10.0 g/kg common salt, 10.0 g/kg vitamin-mineral premix, 12.0 g/kg bicalcium phosphate, 30.0 g/kg of corn gluten meal and 250.0 g/kg wheat flour.**FOB prices (Fortaleza, Brazil, Dec. 2007). Formula savings (USD/MT) compared to the CLT (basal) diet.

Parameter WaterExperimental Diets
CLT KM10 KM50 KM110 Mean ± SD
Initial Weight (g)
Clear 2.8 ± 0.7 2.9 ± 0.7 2.8 ± 0.6 3.0 ± 0.8 2.9 ± 0.7Green 3.5 ± 0.8 3.5 ± 0.7 3.5 ± 0.7 3.4 ± 0.8 3.5 ± 0.8
Final Weight (g)
Clear 13.1 ± 2.2 13.3 ± 1.9 12.9 ± 1.8 13.3 ± 2.1 13.2 ± 2.0Green 14.7 ± 2.1 13.9 ± 2.1 14.0 ± 2.5 14.2 ± 2.4 14.2 ± 2.3
Growth (g/week)
Clear 0.98 ± 0.02 1.01 ± 0.07 0.98 ± 0.07 1.01 ± 0.08 1.0 ± 0.05Green 1.06 ± 0.08 1.01 ± 0.08 1.02 ± 0.14 1.05 ± 0.07 1.04 ± 0.09
Survival (%) Clear 83.9 ± 10.1 80.0 ± 6.2 81.4 ± 6.9 80.7 ± 6.0 81.4 ± 7.1Green 91.8 ± 4.6 94.4 ± 1.9 91.5 ± 3.6 85.9 ± 8.7 91.3 ± 5.7
Yield (kg/m2)
Clear 0.80 ± 0.13 0.77 ± 0.14 0.77 ± 0.13 0.78 ± 0.04 0.78 ± 0.12Green 0.58 ± 0.05 0.58 ± 0.04 0.56 ± 0.09 0.53 ± 0.09 0.57 ± 0.07
AFI* (kg/m2) Clear 1.58 ± 0.18 1.65 ± 0.21 1.66 ± 0.22 1.76 ± 0.14 0.95 ± 0.10Green 1.28 ± 0.23 1.12 ± 0.24 1.17 ± 0.12 1.25 ± 0.14 1.23 ± 0.15
FCR* Clear 1.99 ± 0.25 2.18 ± 0.37 2.18 ± 0.33 2.27 ± 0.18 2.16 ± 0.28Green 2.47 ± 0.26 1.96 ± 0.10 2.13 ± 0.18 2.44 ± 0.54 2.15 ± 0.34
*AFI, apparent feed intake per area of culture (kg/m2); FCR, food conversion ratio.
Growth response (mean ± standard deviation) of L. vannamei juveniles fed diets containing Krill meal for 72 days in 500-L indoor (clear water) and 1,000-L outdoor (green water) tanks. Source: Nunes et al. (2010). Aquaculture Nutrition.

BFT creates new perspectives in the way shrimp feeds are formulated
Bioflocs can spare protein and the dependence on fishmeal in shrimp diets
Biofloc system in a commercial shrimp farm in NE Brazil


Going heterotrophic under lab conditions
Dried mollasses
Poultry feed
Application in water
Phytoplankton bloom
Bioflocs formation
Bacterial flocs
C:N ratio of 20:1
Innoculation

INGREDIENTSPoultry feed, 15.7% CPShrimp feed, 35% CPMolasses, driedSynthetic binder
NUTRIENT LEVELSC:N RatioFatFiberProteinMoisture
INCLUSION54.03%40.73%5.00%0.24%
12.304.25%4.38%23.52%7.99%
Experimental diets
Weighing feed and molasses
36.9% CP23.5% CP
Low protein diet

50 – INT 3.99 ± 0.35ac 21.22 ± 1.10a 1.68 ± 0.12a 92.8 ± 7.6 771 ± 116 75 – INT 3.28 ± 0.22bc 18.57 ± 1.26c 1.49 ± 0.11ab 72.7 ± 10.7 751 ± 158
100 – INT 3.58 ± 0.14abc 17.27 ± 1.29c 1.33 ± 0.12b 67.2 ± 21.7 766 ± 308 50 – BFT 3.70 ± 0.36ab 20.22 ± 0.43b 1.61 ± 0.04ac 81.6 ± 15.6 629 ± 167 75 – BFT 3.26 ± 0.75c 17.99 ± 1.67c 1.33 ± 0.05bc 85.1 ± 10.4 883 ± 152
100 – BFT 3.31 ± 0.25bc 16.95 ± 0.35c 1.48 ± 0.16b 80.0 ± 15.7 1,002 ± 225 ANOVA < 0.05 < 0.05 < 0.05 ns ns
In. WGT (g) Fn. WGT (g) Grams/wk Survival (%) Yield (g/m2)Shrimp/m2
Under floc conditions, shrimp can grow well with low protein diets
Growth of P. vannamei under an autotrophic versus heterotrophic system over 72 days of cultureData: Fonseca (unpublished)
Biofloc system allowed reducing feed protein content without any detriment to shrimp growth

0
20
40
60
80
100
120
140
160
180
-2 3 6 9 10 12 16 19 24 27 30 34 38 46 48 52 55 59 62 67 70
Volume (mL/L)
Days of Rearing
100-BFT
75-BFT
50-BFT
75-INT50-INT100-INT
Biofloc production higher at BFT than conventional intensive system, but reduced at low stocking density

Why shrimp feeds still rely on fishmeal?(1) ECONOMICS: use remains economically
competitive at strategic inclusion levels, for specialty diets (starters, anti-stress/transition, premium) and certain markets
(2) CONVENIENCE: few ingredients available capable of replacing the single value of fishmeal. It contains a highly attractive package from the nutrition standpoint
Source of multiple essential nutrients (protein, AA, fatty acids, cholesterol, phospholipids)
Highly digestible, few anti-nutritional factors, feeding effectors, unidentified growth factors
(3) MARKET PERCEPTION: feeds with high levels of fishmeal are still perceived as high performers

CONCLUSIONS1. On methionine supplementation:
Supplementation of crystalline amino acids provides a viable cost effective alternative for innovative nutritional strategies focusing on maintaining ideal protein ratios in the diet while providing increased flexibility in ingredient selection.
2. On fishmeal reduction:Effective fishmeal reduction in shrimp diets is dependent on methionine supplementation and an adequate supply of fish oil or another source of n-3 HUFA. Reduction beyond 5% fishmeal inclusion with 1% fish oil caused detriment to shrimp performance.
Acknowledgements
Financial supportNovus International Inc. (USA)EMBRAPA – Empresa de Pesquisa Agropecuária (Brazil)
Co-workers Dr. Marcelo Sá, Hassan Sabry-Neto, students and staff at LABOMAR


![Platão - A República [trad. Carlos Alberto Nunes - EDUFPA]](https://static.fdocuments.net/doc/165x107/55cf9c1d550346d033a8a72d/platao-a-republica-trad-carlos-alberto-nunes-edufpa.jpg)