X-RAY VARIABILITY IN ACTIVE GALACTIC NUCLEIcpinto/TPP/2008 Talk PhD interview.pdf · X-RAY...
21
University of Naples “Federico II” - Italy Dr. Ciro Pinto Tutors Dr. Maurizio Paolillo Prof. Giuseppe Longo X-RAY VARIABILITY IN ACTIVE GALACTIC NUCLEI
Transcript of X-RAY VARIABILITY IN ACTIVE GALACTIC NUCLEIcpinto/TPP/2008 Talk PhD interview.pdf · X-RAY...
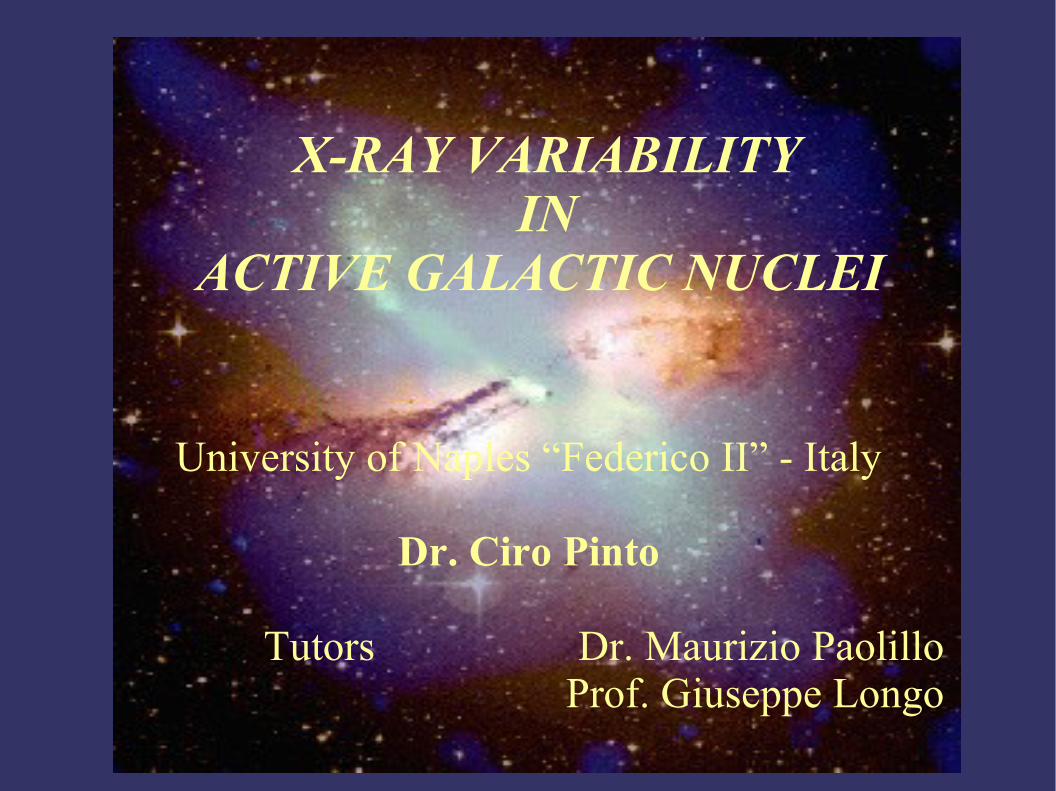
University of Naples “Federico II” - Italy
Dr. Ciro Pinto
Tutors Dr. Maurizio Paolillo Prof. Giuseppe Longo
X-RAY VARIABILITYIN
ACTIVE GALACTIC NUCLEI
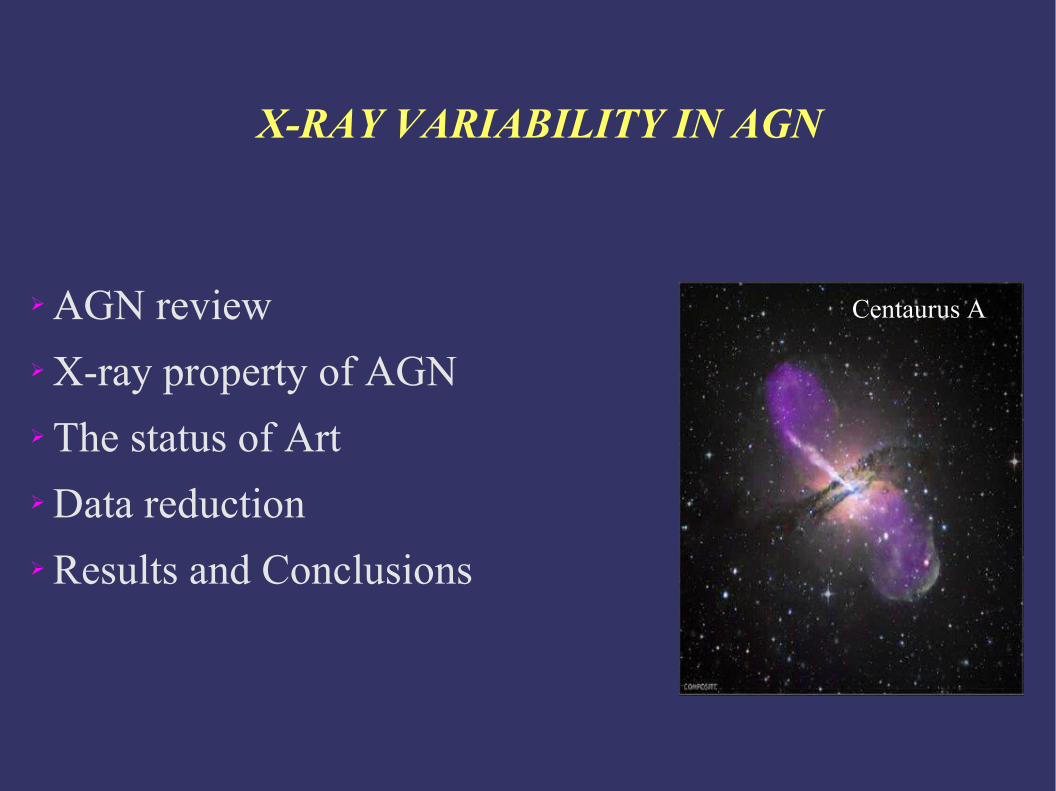
X-RAY VARIABILITY IN AGN
➢ AGN review➢ X-ray property of AGN➢ The status of Art ➢ Data reduction➢ Results and Conclusions
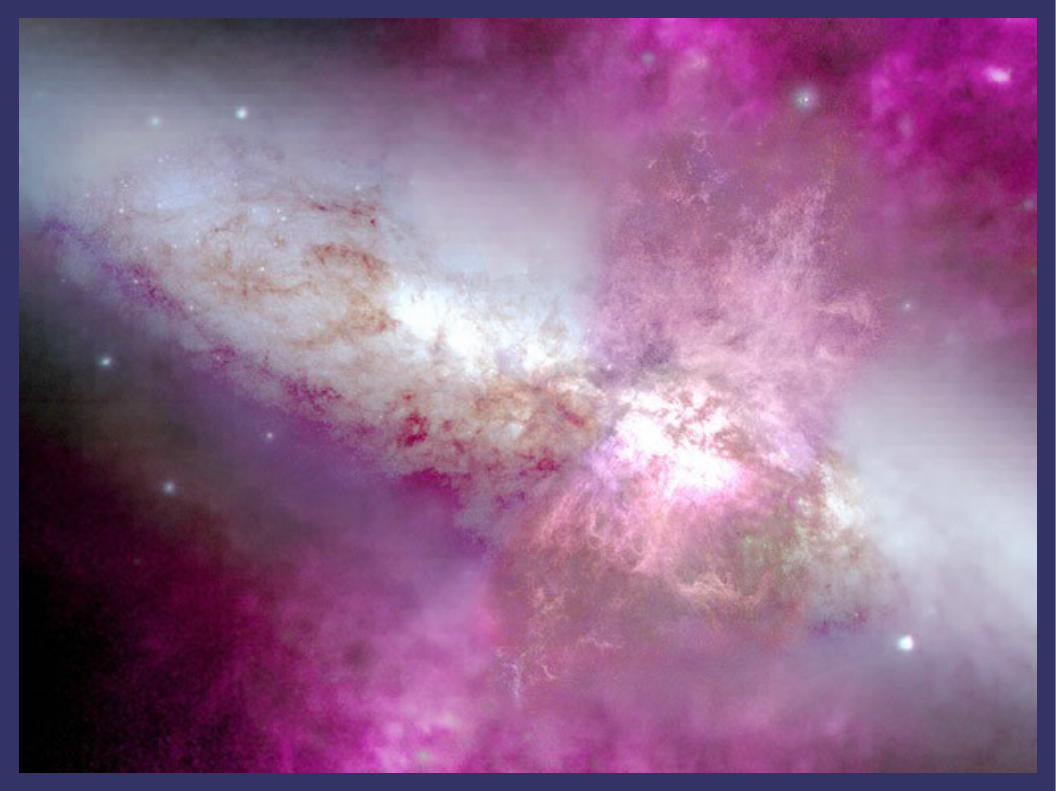
Centaurus A
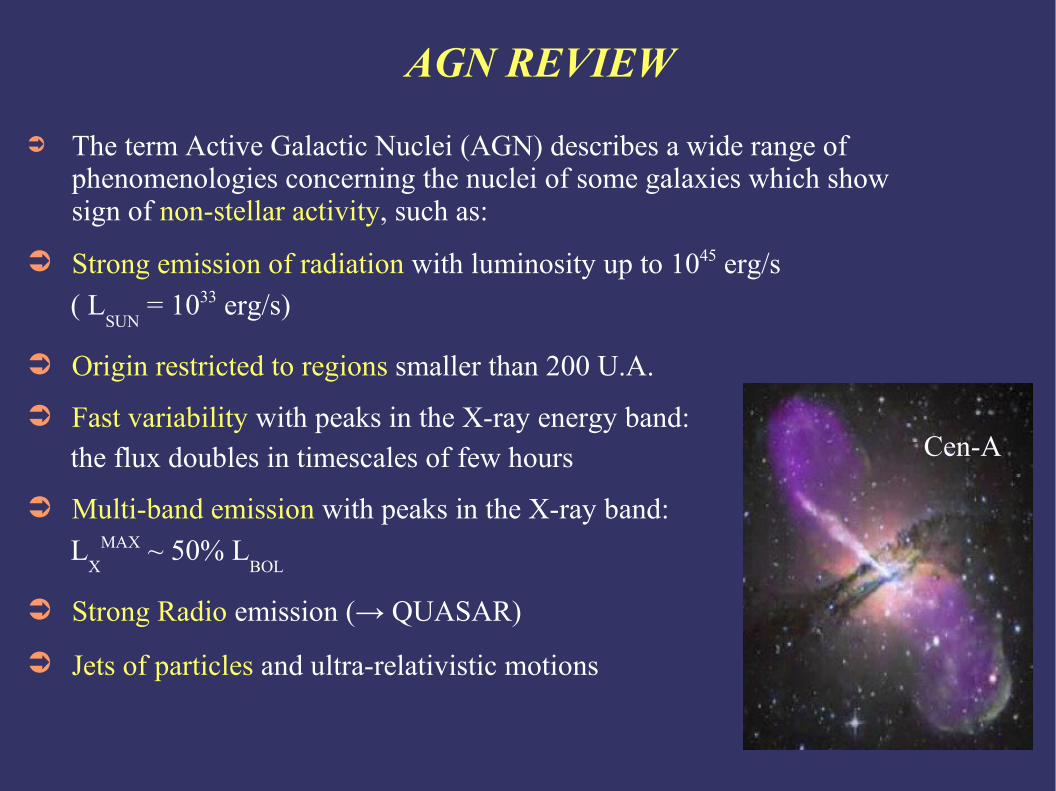
AGN REVIEW
➲ The term Active Galactic Nuclei (AGN) describes a wide range of phenomenologies concerning the nuclei of some galaxies which show sign of non-stellar activity, such as:
➲ Strong emission of radiation with luminosity up to 1045 erg/s ( L
SUN = 1033 erg/s)
➲ Origin restricted to regions smaller than 200 U.A.
➲ Fast variability with peaks in the X-ray energy band: the flux doubles in timescales of few hours
➲ Multi-band emission with peaks in the X-ray band: L
XMAX ~ 50% L
BOL
➲ Strong Radio emission (→ QUASAR)
➲ Jets of particles and ultra-relativistic motions
Cen-A
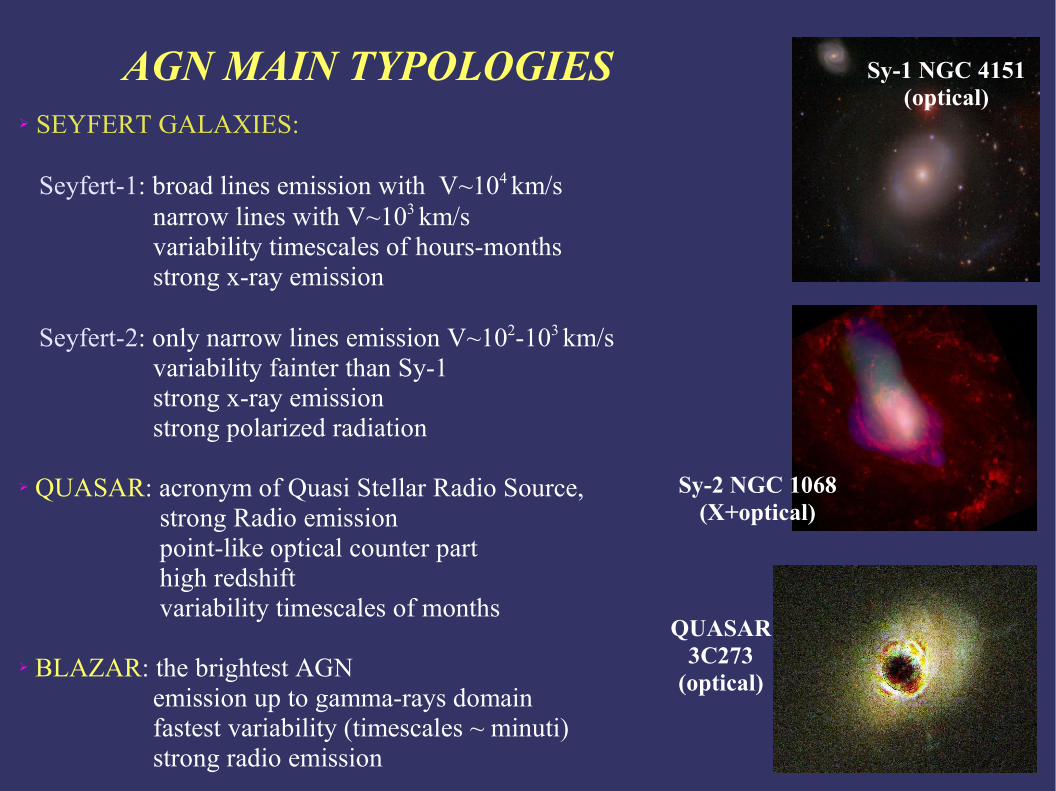
AGN MAIN TYPOLOGIES➢ SEYFERT GALAXIES: Seyfert-1: broad lines emission with V~104 km/s narrow lines with V~103 km/s variability timescales of hours-months strong x-ray emission
Seyfert-2: only narrow lines emission V~102-103 km/s variability fainter than Sy-1 strong x-ray emission strong polarized radiation
➢ QUASAR: acronym of Quasi Stellar Radio Source, strong Radio emission point-like optical counter part high redshift variability timescales of months ➢ BLAZAR: the brightest AGN emission up to gamma-rays domain fastest variability (timescales ~ minuti) strong radio emission
Sy-2 NGC 1068(X+optical)
QUASAR3C273
(optical)
Sy-1 NGC 4151(optical)
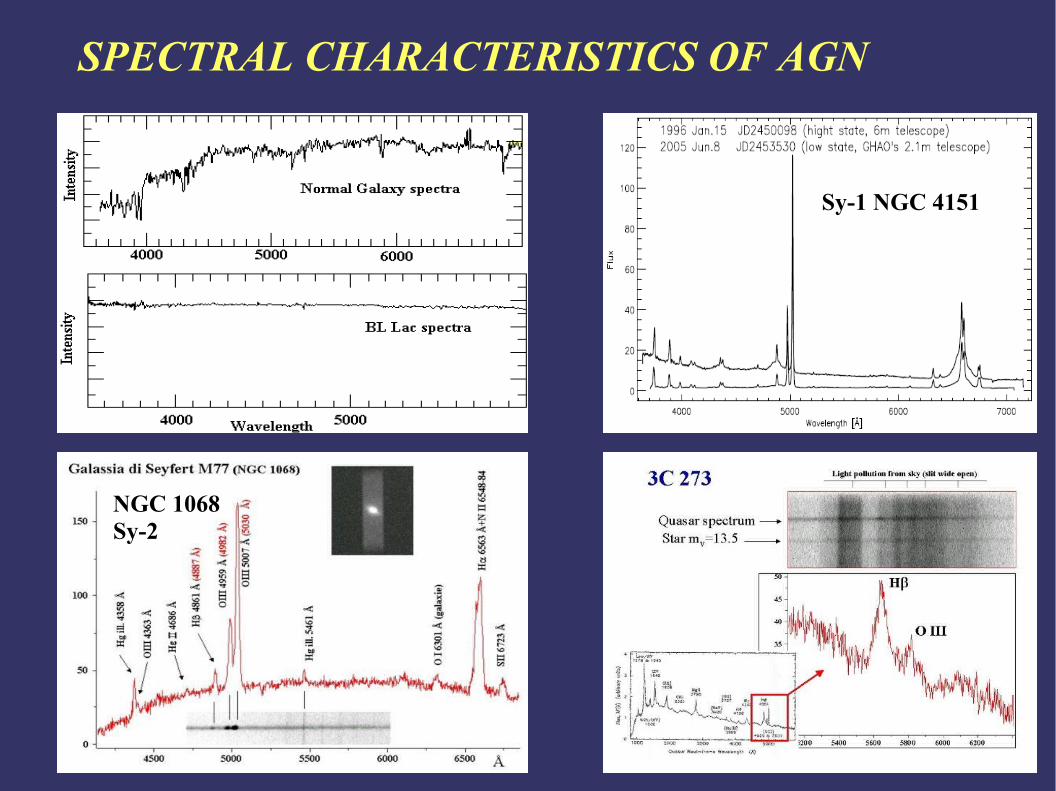
SPECTRAL CHARACTERISTICS OF AGN
NGC 1068Sy-2
Sy-1 NGC 4151

AGN: THE UNIFIED MODEL - A
➲ High variability → small size: the size of the emetting region must be smaller than the region
crossed by a light-ray on the variability timescale: less than 1 pc
➲ High luminosity → strong production of energy:
the unic object enable to solve this question is a super-massive black hole accreting matter
dcT
● An energy close to L = 1047erg/s can be producted by a black hole with a mass M = 108 M
SUN which is
accreting less than 10 solar masses per year
● The central mass MBH
can be obtained from the Eddington Luminosity:
η ~ 6-40 %
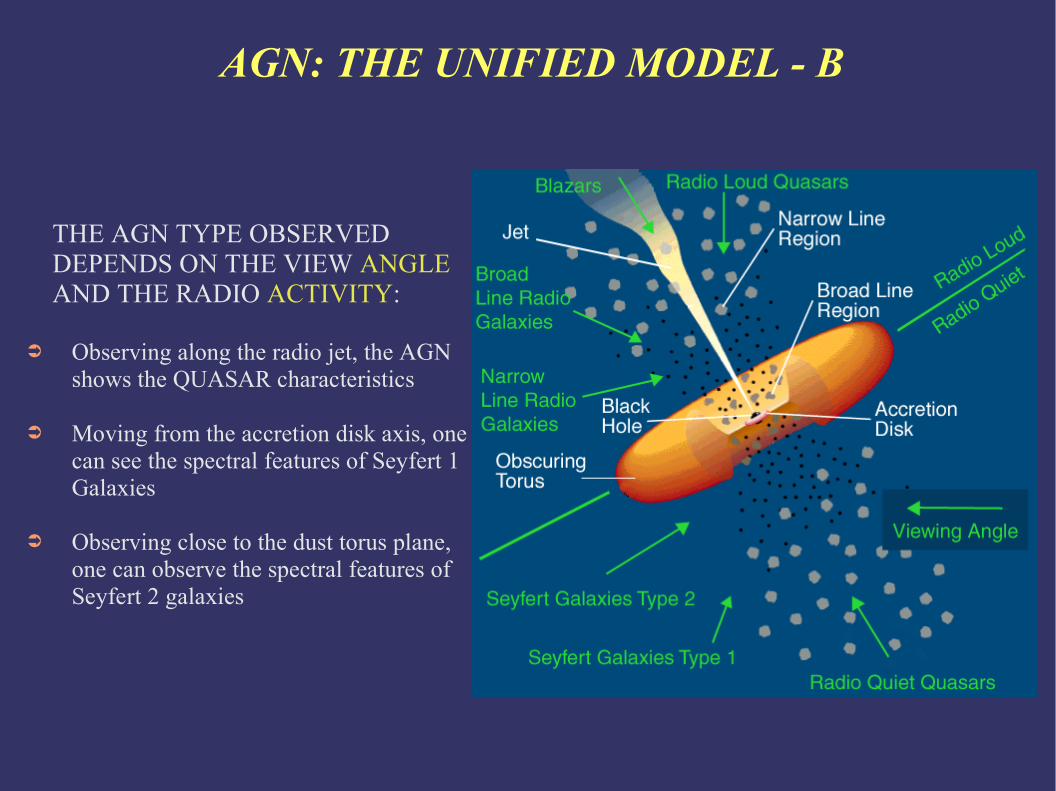
AGN: THE UNIFIED MODEL - B
THE AGN TYPE OBSERVED DEPENDS ON THE VIEW ANGLE AND THE RADIO ACTIVITY:
➲ Observing along the radio jet, the AGN shows the QUASAR characteristics
➲ Moving from the accretion disk axis, one can see the spectral features of Seyfert 1 Galaxies
➲ Observing close to the dust torus plane, one can observe the spectral features of Seyfert 2 galaxies
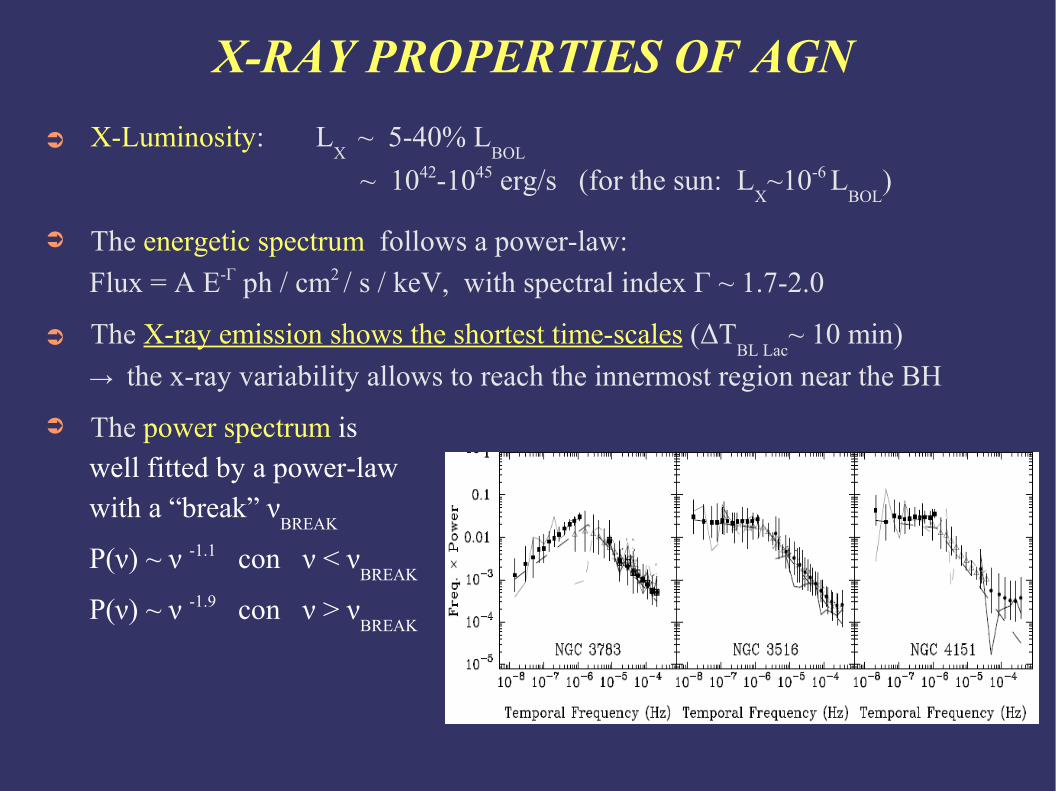
X-RAY PROPERTIES OF AGN➲ X-Luminosity: L
X ~ 5-40% L
BOL
~ 1042-1045 erg/s (for the sun: L
X~10-6 L
BOL)
➲ The energetic spectrum follows a power-law: Flux = A E-Γ ph / cm2 / s / keV, with spectral index Γ ~ 1.7-2.0
➲ The X-ray emission shows the shortest time-scales (ΔTBL Lac
~ 10 min) → the x-ray variability allows to reach the innermost region near the BH
➲ The power spectrum is well fitted by a power-law with a “break” ν
BREAK
P(ν) ~ ν -1.1 con ν < νBREAK
P(ν) ~ ν -1.9 con ν > νBREAK
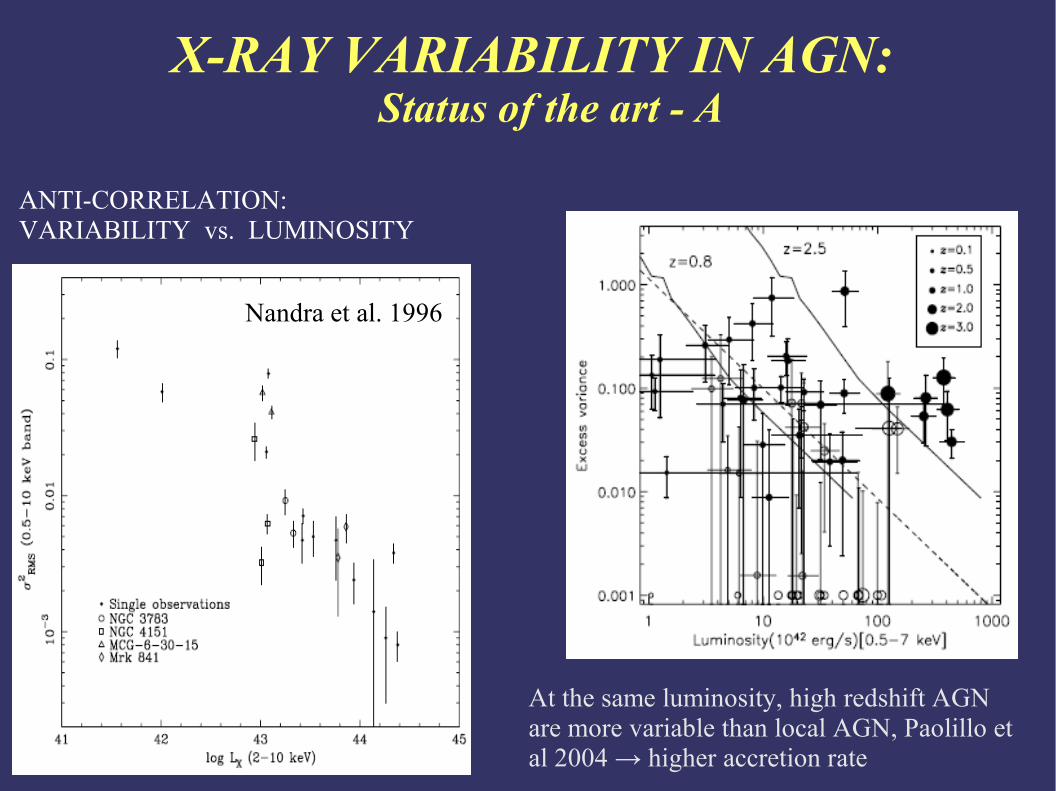
X-RAY VARIABILITY IN AGN:Status of the art - A
At the same luminosity, high redshift AGN are more variable than local AGN, Paolillo et al 2004 → higher accretion rate
ANTI-CORRELATION:VARIABILITY vs. LUMINOSITY
Nandra et al. 1996
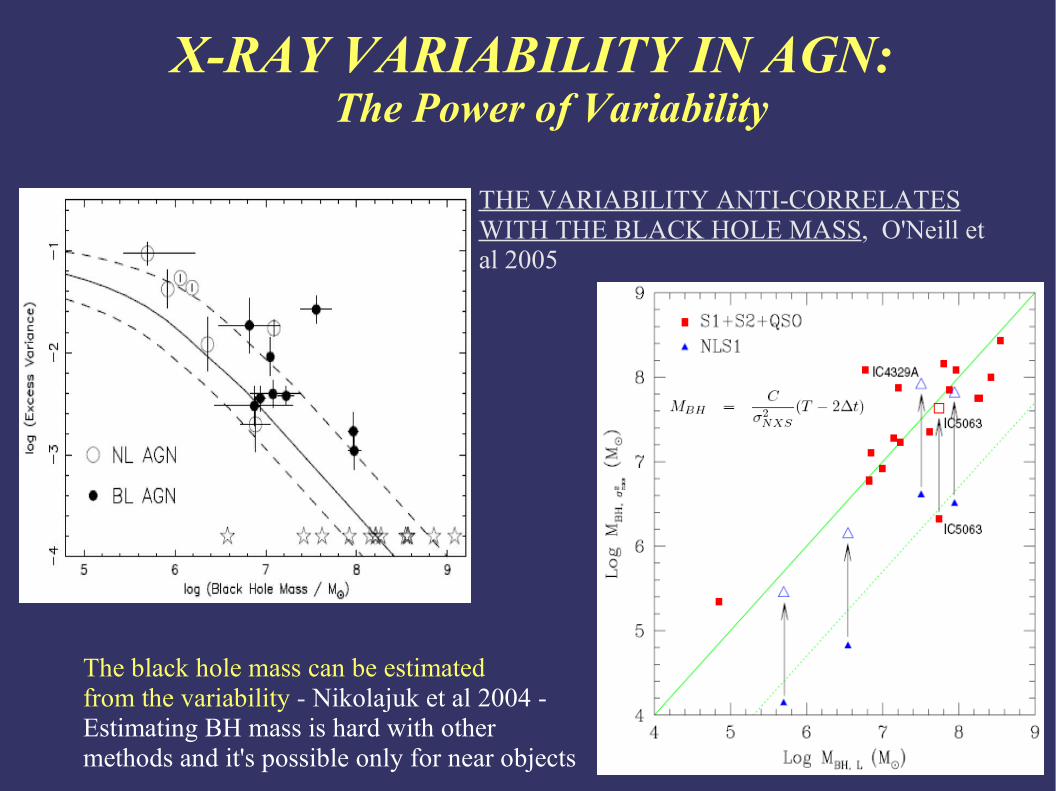
X-RAY VARIABILITY IN AGN:The Power of Variability
THE VARIABILITY ANTI-CORRELATES WITH THE BLACK HOLE MASS, O'Neill et al 2005
The black hole mass can be estimated from the variability - Nikolajuk et al 2004 -Estimating BH mass is hard with other methods and it's possible only for near objects
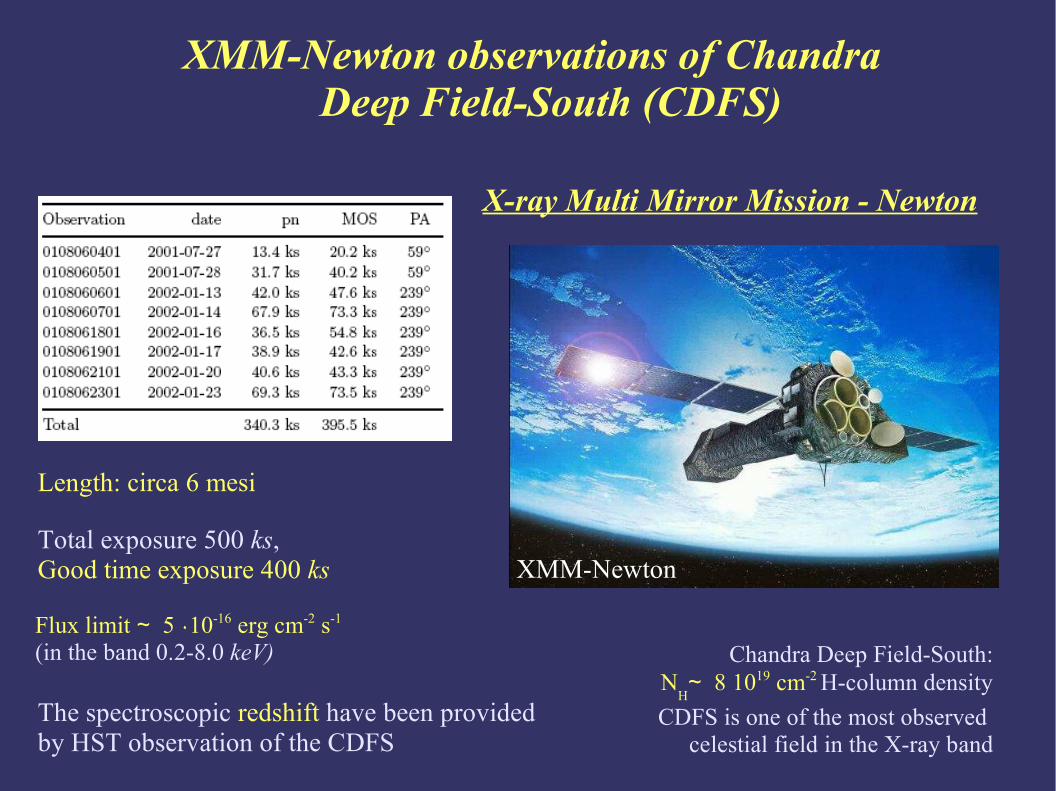
XMM-Newton observations of ChandraDeep Field-South (CDFS)
Length: circa 6 mesi
Total exposure 500 ks, Good time exposure 400 ks
Flux limit ∼ 5 ٠10-16 erg cm-2 s-1 (in the band 0.2-8.0 keV) Chandra Deep Field-South:
NH∼ 8 1019 cm-2 H-column density
CDFS is one of the most observed celestial field in the X-ray band
The spectroscopic redshift have been provided by HST observation of the CDFS
X-ray Multi Mirror Mission - Newton
XMM-Newton

EPIC CAMERAEuropean Photo Imaging Camera
Image of CDFS:PN detector(stacking of 8 esposures)
→ Energy band selected: 0.2 - 8.0 keV
Image of CDFS:MOS1 detector(stacking of 8 esposures)
MOS 1 Q.E.
MOS 1 detector: Exposure Map
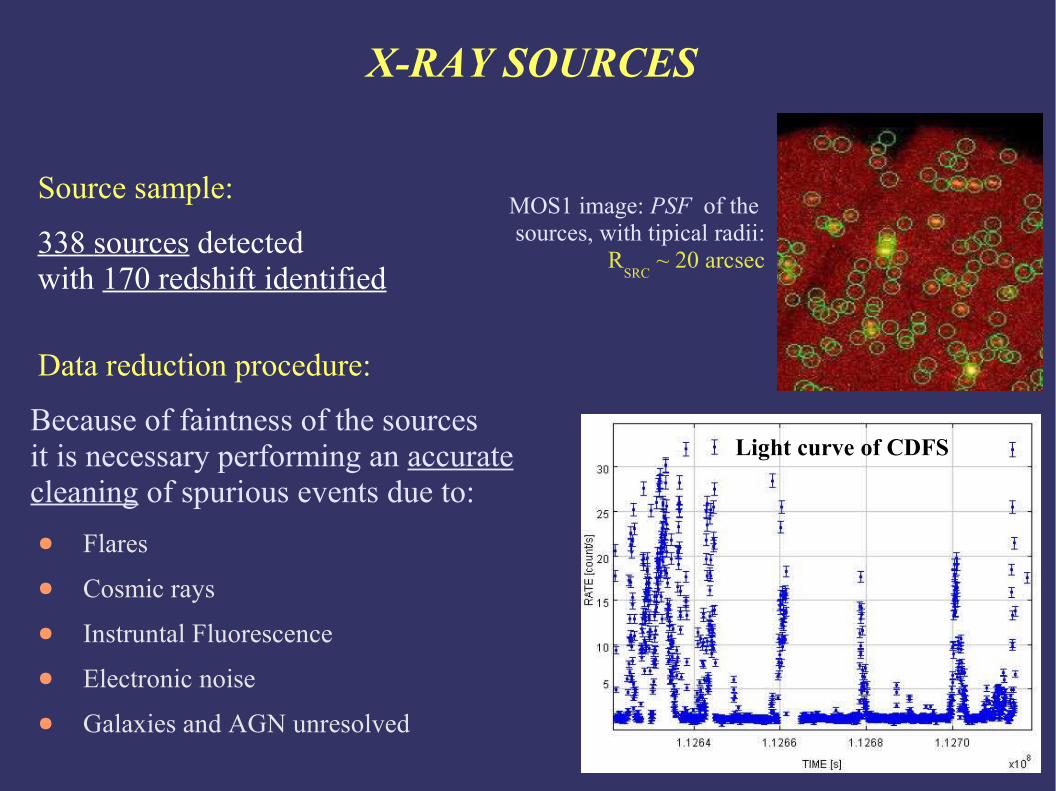
X-RAY SOURCES
MOS1 image: PSF of the sources, with tipical radii:
RSRC
~ 20 arcsec
Source sample:
338 sources detectedwith 170 redshift identified
Data reduction procedure:
Because of faintness of the sources it is necessary performing an accurate cleaning of spurious events due to:● Flares● Cosmic rays● Instruntal Fluorescence● Electronic noise● Galaxies and AGN unresolved
Light curve of CDFS
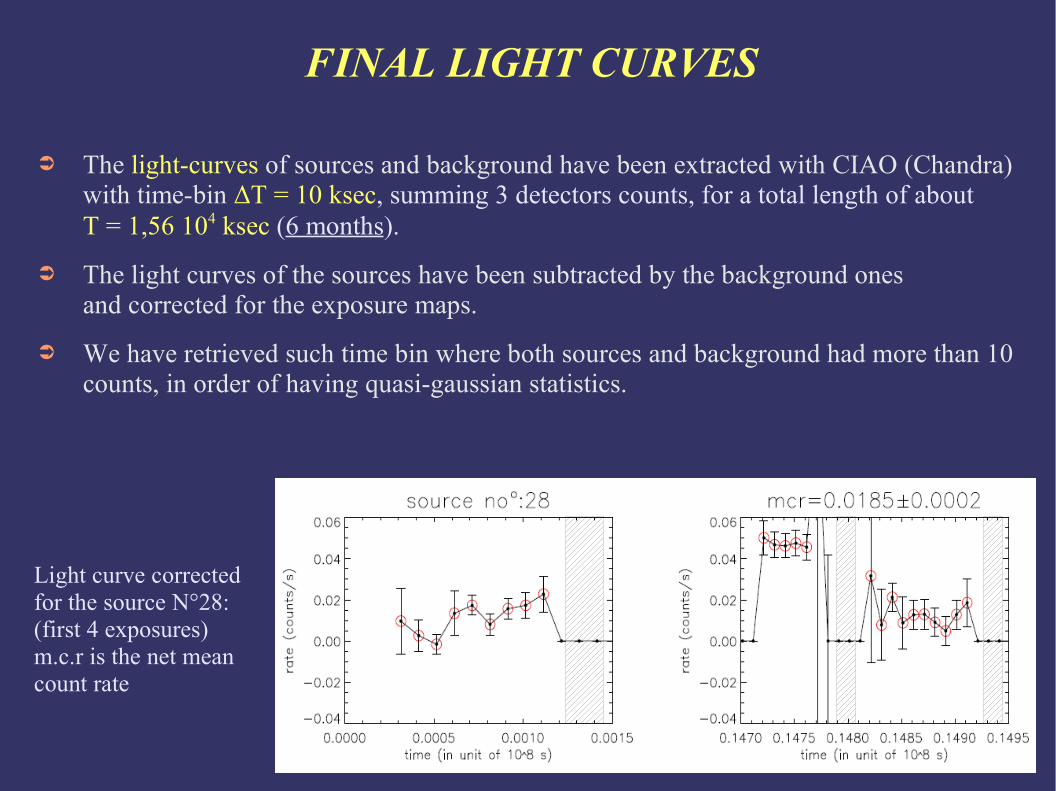
FINAL LIGHT CURVES
➲ The light-curves of sources and background have been extracted with CIAO (Chandra) with time-bin ΔT = 10 ksec, summing 3 detectors counts, for a total length of about T = 1,56 104 ksec (6 months).
➲ The light curves of the sources have been subtracted by the background ones and corrected for the exposure maps.
➲ We have retrieved such time bin where both sources and background had more than 10 counts, in order of having quasi-gaussian statistics.
Light curve corrected for the source N°28: (first 4 exposures) m.c.r is the net mean count rate
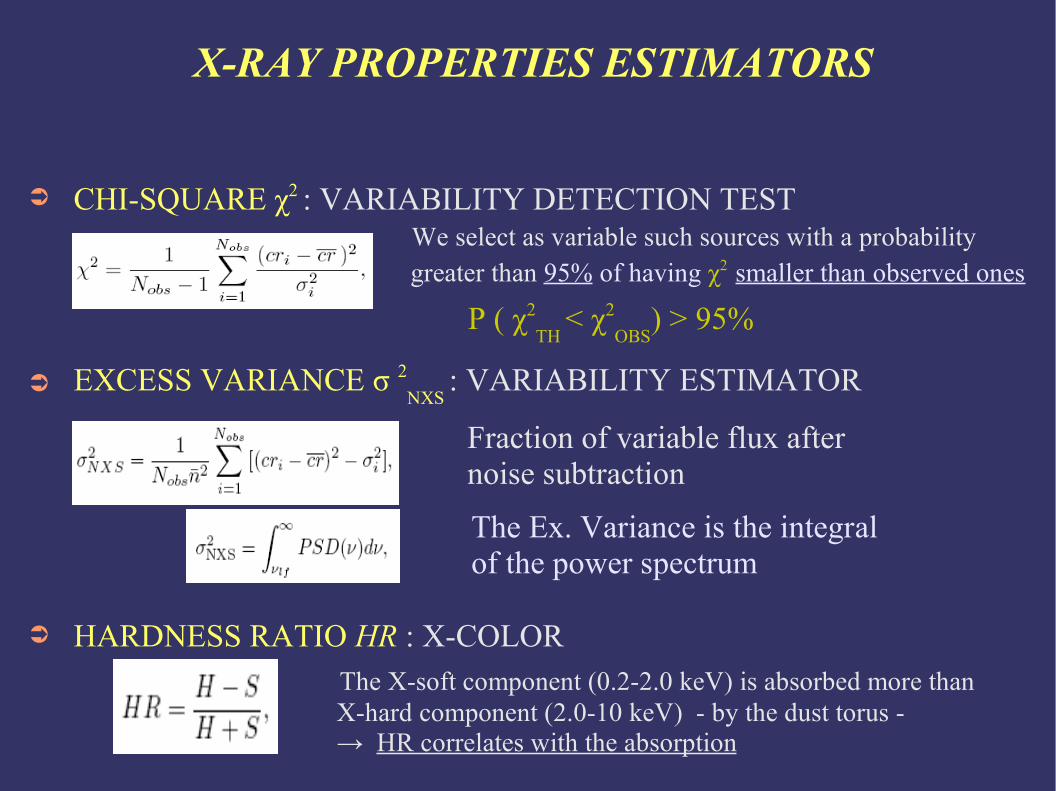
X-RAY PROPERTIES ESTIMATORS
➲ CHI-SQUARE χ2 : VARIABILITY DETECTION TEST We select as variable such sources with a probability greater than 95% of having χ2 smaller than observed ones
➲ EXCESS VARIANCE σ 2NXS
: VARIABILITY ESTIMATOR
Fraction of variable flux after noise subtraction
➲ HARDNESS RATIO HR : X-COLOR The X-soft component (0.2-2.0 keV) is absorbed more than X-hard component (2.0-10 keV) - by the dust torus - → HR correlates with the absorption
The Ex. Variance is the integralof the power spectrum
P ( χ2TH
< χ2OBS
) > 95%
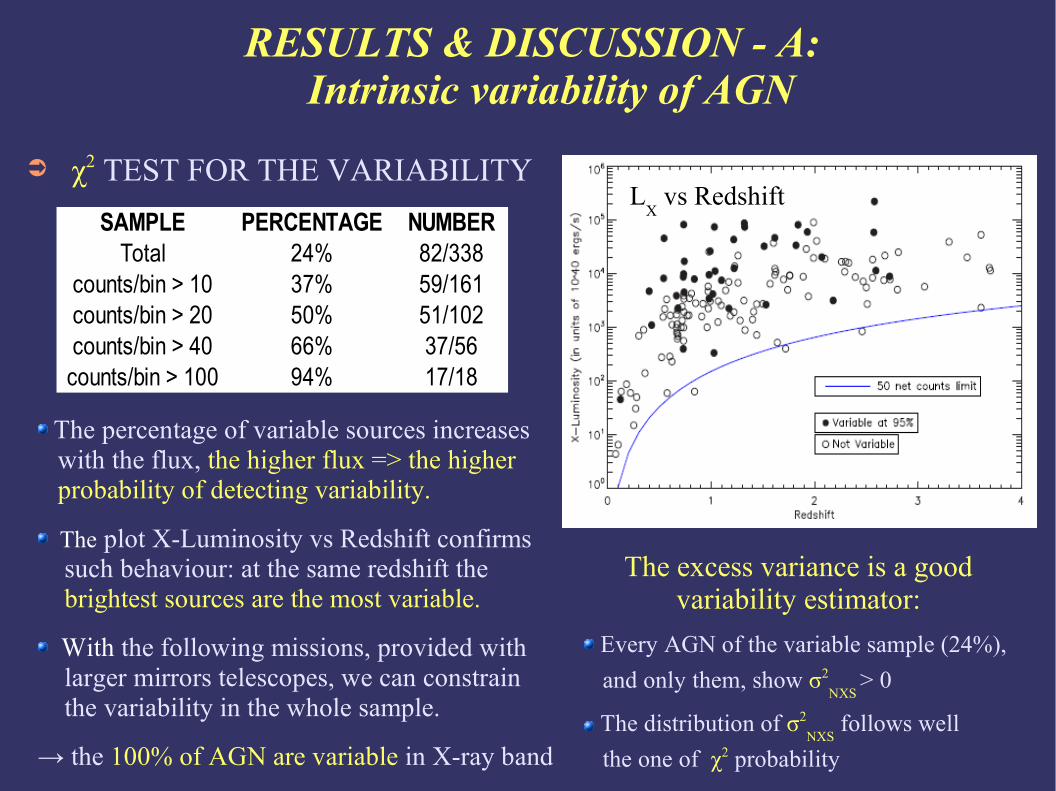
RESULTS & DISCUSSION - A:Intrinsic variability of AGN
➲ χ2 TEST FOR THE VARIABILITYSAMPLE PERCENTAGE NUMBER
Total 24% 82/338counts/bin > 10 37% 59/161counts/bin > 20 50% 51/102counts/bin > 40 66% 37/56
counts/bin > 100 94% 17/18
The percentage of variable sources increases with the flux, the higher flux => the higher probability of detecting variability.
The plot X-Luminosity vs Redshift confirms such behaviour: at the same redshift the brightest sources are the most variable.
With the following missions, provided with larger mirrors telescopes, we can constrain the variability in the whole sample.
→ the 100% of AGN are variable in X-ray band
LX vs Redshift
Every AGN of the variable sample (24%), and only them, show σ2
NXS > 0
The distribution of σ2NXS
follows well the one of χ2 probability
The excess variance is a goodvariability estimator:

RISULTATI & DISCUSSIONE - B:Variabilità X ed Assorbimento
HR diminuisce col flusso, → sorgenti meno assorbite hanno flussi maggiori
Lavori precedenti hanno mostrato che la variabilità è anti-correlata con l'assorbimento (possibile componente di riflessione compton che indebolisce la variabilità).
La percentuale di sorgenti variabili aumenta al diminuire dell'assorbimento.
HR TOTALE VARIABILI< - 0.2 59% 75%> - 0.2 41% 25%
I risultati sembrano attribuire ciò al fatto che le Sy-1 sono più luminose e quindi hanno miglior statistica: il 59% ha HR < -0.2
Tuttavia campionando a diversi intervalli di conteggi si ha sempre che il 75% delle sorgenti variabili sta ad HR < -0.2
HR vs COUNTS
Sy-1
Sy-2
Distibuzione di HR in 500-5000 conteggi
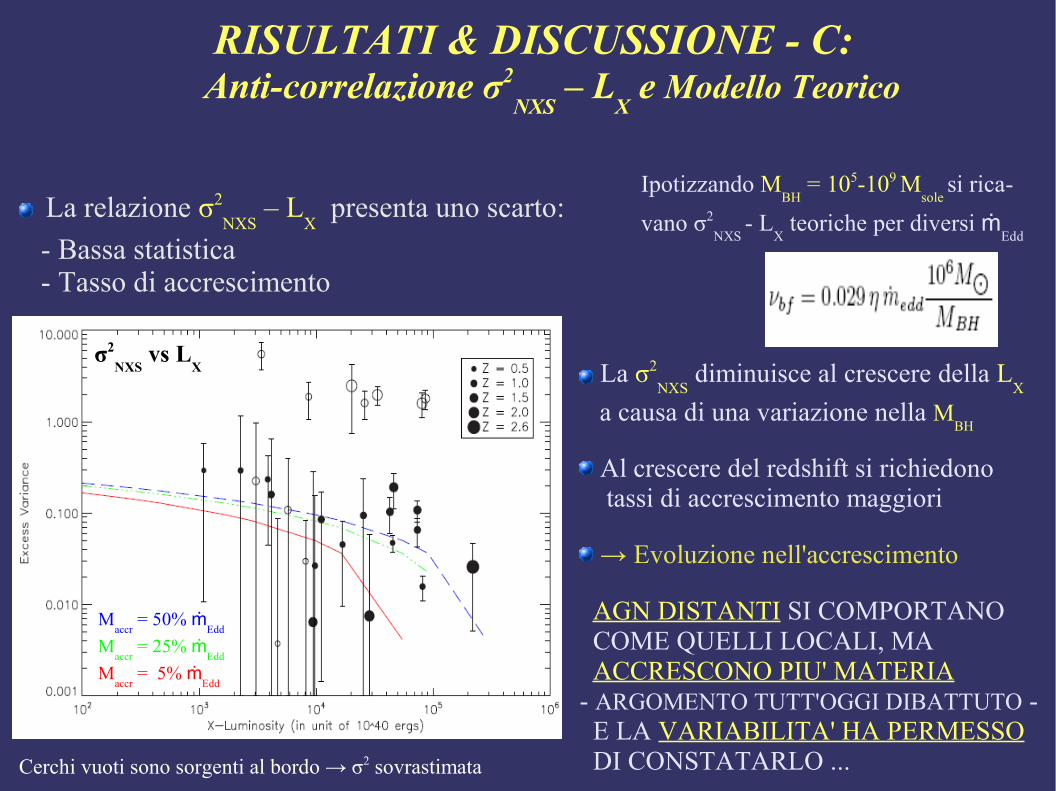
RISULTATI & DISCUSSIONE - C:Anti-correlazione σ2
NXS – L
X e Modello Teorico
La relazione σ2NXS
– LX presenta uno scarto:
- Bassa statistica - Tasso di accrescimento
Ipotizzando MBH
= 105-109 Msole
si rica-vano σ2
NXS - L
X teoriche per diversi ṁ
Edd
La σ2NXS
diminuisce al crescere della LX
a causa di una variazione nella MBH
Al crescere del redshift si richiedono tassi di accrescimento maggiori
→ Evoluzione nell'accrescimento
AGN DISTANTI SI COMPORTANO COME QUELLI LOCALI, MA ACCRESCONO PIU' MATERIA - ARGOMENTO TUTT'OGGI DIBATTUTO - E LA VARIABILITA' HA PERMESSO DI CONSTATARLO ...
Maccr
= 50% ṁEdd
Maccr
= 25% ṁEdd
Maccr
= 5% ṁEdd
σ2NXS
vs LX
Cerchi vuoti sono sorgenti al bordo → σ2 sovrastimata
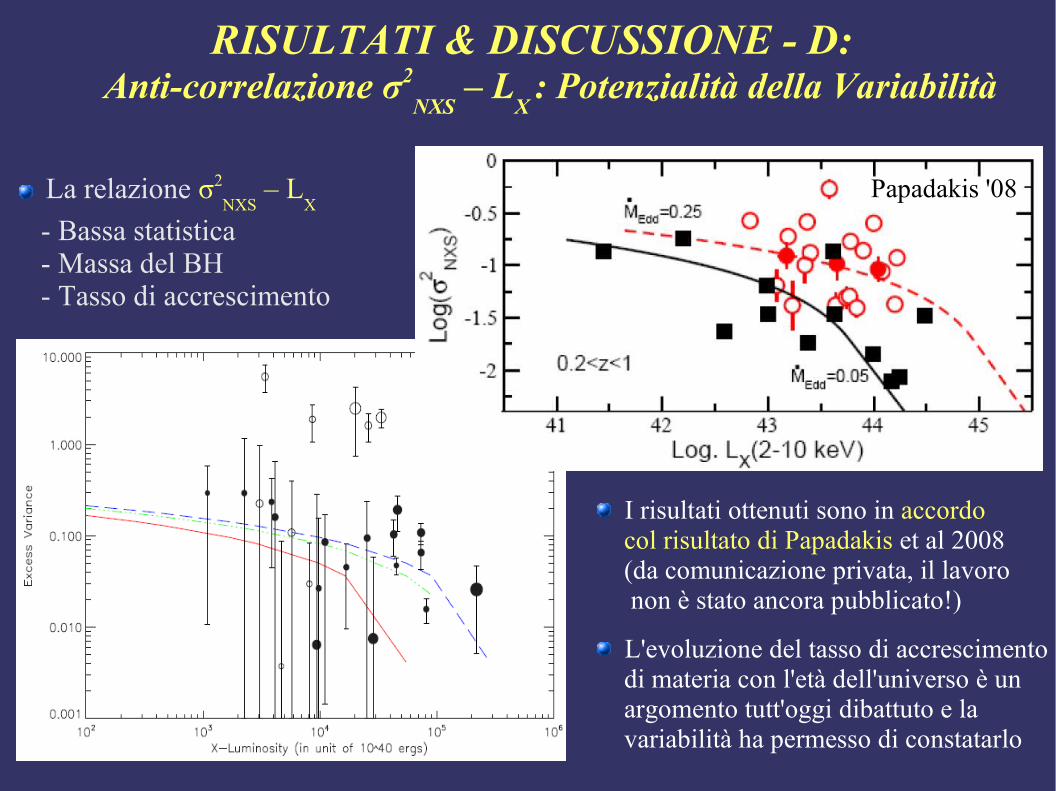
RISULTATI & DISCUSSIONE - D:Anti-correlazione σ2
NXS – L
X : Potenzialità della Variabilità
La relazione σ2NXS
– LX
- Bassa statistica - Massa del BH - Tasso di accrescimento
I risultati ottenuti sono in accordo col risultato di Papadakis et al 2008 (da comunicazione privata, il lavoro non è stato ancora pubblicato!)
L'evoluzione del tasso di accrescimento di materia con l'età dell'universo è un argomento tutt'oggi dibattuto e la variabilità ha permesso di constatarlo
Papadakis '08Papadakis '08
CONCLUSIONI & PROSPETTIVE I risultati sono in accordo col modello unificato degli AGN
Tutti gli AGN sono sorgenti variabili nel dominio X
La variabilità è anti-correlata con il flusso e l'assorbimento
L' anti-correlazione variabilità–luminosità è una conseguenza della variazione della massa del buco nero centrale e lo scarto è dovuto ad un diverso tasso di accrescimento in epoche diverse
La variabilità ha permesso di verificare che AGN più distanti accrescono più materia → evoluzione nell'accrescimento
Calibrando ed invertendo la relazione σ2NXS
– LX si può stimare la massa M
BH
assumendo un tasso di accrescimento dal redshift
Con altre osservazioni si può migliorare la statistica ed estendere tale analisi a tutte le survey profonde di AGN nel dominio X
Si può così studiare l'evoluzione degli AGN con l'età dell'universo